Environmental Factors that promote Phormidium Blooms reports/WCFM TR 2014-001... · Environmental...
44
Environmental factors that promote Phormidium blooms in Canterbury rivers Summer Scholarship Report WCFM Report 2014-001 i
Transcript of Environmental Factors that promote Phormidium Blooms reports/WCFM TR 2014-001... · Environmental...
Environmental factors that promote Phormidium blooms in Canterbury rivers
Summer Scholarship Report
WCFM Report 2014-001
i

ii

REPORT: WCFM Report 2014-001
TITLE: Environmental factors that promote Phormidium blooms in Canterbury rivers
PREPARED FOR: Waterways Centre for Freshwater Management
PREPARED BY: Tara McAllister BSc (Ecology and Biodiversity and Marine Biology)
SUPERVISED BY: Dr Susie Wood (Cawthron) and Professor Ian Hawes (Waterways Centre for Freshwater Management)
REVIEWED BY: Professor Jenny Webster-Brown and Professor Ian Hawes
AFFILIATION: Waterways Centre for Freshwater Management University of Canterbury & Lincoln University Private Bag 4800 Christchurch New Zealand
DATE: 21 February, 2014
iii
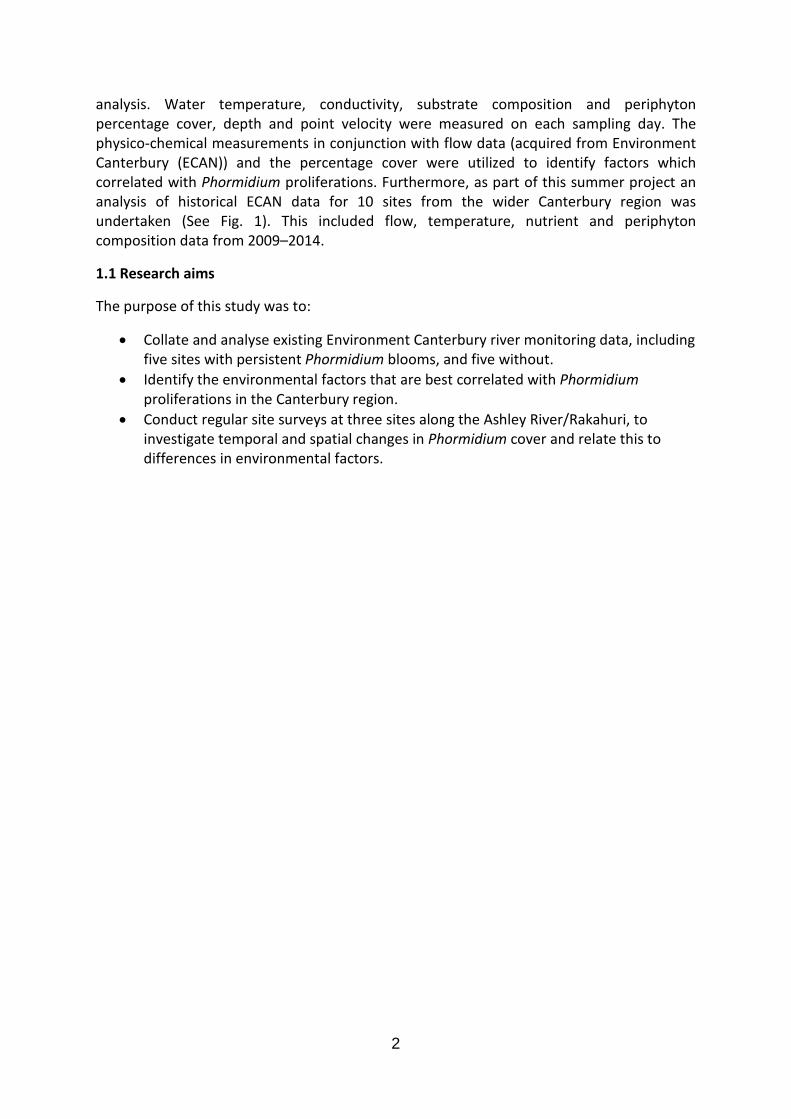
Executive Summary During the past ten years there has been an apparent increase in the prevalence of benthic cyanobacterial blooms in New Zealand rivers (Heath et al., 2011). Phormidium appears to be the dominant genus (Heath et al., 2010). Phormidium can produce powerful neurotoxins, which pose a risk to human and animal health, and animal toxicosis associated with benthic cyanobacteria has become increasingly prevalent in New Zealand (Hamil, 2001; Wood et al., 2007). Despite this health risk, little is known about the environmental factors that are important in regulating the occurrence of riverine benthic cyanobacterial blooms. In comparison, a breadth of knowledge exists regarding the environmental factors that lead to planktonic algal blooms (Oliver et al., 2012). Hydrological regime (Heath et al., 2011), water temperature (Heath et al., 2013) and nutrient concentrations (Biggs, 2000; Wood & Young, 2012) are all implicated as important environmental factors in regulating benthic cyanobacterial blooms.
In this study, we monitored three sites along the Ashley River/Rakahuri for 10 weeks and also analysed historical data for 10 sites (five with regular Phormidium blooms and five without) from the wider Canterbury region. Environmental factors investigated included nutrient concentrations (DRP, DIN, TP, TN, and nitrate), water temperature, depth, river flow, point velocity and substrate composition. The aim of this study was to identify environmental factors that correlate with Phormidium percentage cover.
Sites with regular Phormidium blooms, with the exception of Temuka at Manse Bridge were dominated by larger substrate (boulder and cobble). Comparatively, sites without Phormidium blooms were dominated by smaller substrate (sand/silt, fine gravel and gravel). All sites had low DRP concentrations. There were differences in DIN concentrations but these did not relate to probability of bloom formation. Heath et al., (2011) highlights temperature as an important factor in determining whether Phormidium is present or absent. In this study, we found no correlative relationship between Phormidium percentage cover and water temperature. Furthermore, Phormidium was observed in a range of water temperatures, between 4–20°C. A distinct pattern existed at some sites between flushing flows (3 times median flow) and Phormidium percentage cover, with more frequent flushing flows resulting in decreased Phormidium percentage cover. However, the general flushing flow rule that three times the median flow is sufficient to remove all Phormidium mats was not applicable in all of the Canterbury rivers studied. For example, a large flushing flow of 22 times the median occurred at Pareora at the huts on the 28.01.2011 and did not remove all the Phormidium. Like Heath et al., (2013), we found that Phormidium had no specific preference for water velocity and depth, but occurred at a range of depths (0.03–0.59 m) and point velocities (0–1.4 ms-1). At present, it appears that water quality is a weak predictor of Phormidium blooms. Rather substrate stability and flow may be the most important factors controlling the dynamics of Phormidium in Canterbury rivers.
iv

Contents Page
Section 1 Introduction 1
1.1 Research aims 2
Section 2 Methods 3
2.1 Sampling sites 3 2.2 Site surveys 3 2.3 Sampling protocol 3
2.3.1 Phormidium collection 3 2.3.2 Environmental parameters measured in situ 3 2.3.3 Water samples 3
2.4 Analytical methods 6 2.5 Historical ECAN data 6
Section 3 Results 7
3.1 Survey of Canterbury rivers 7 3.1.1 Site characteristics 7 3.1.2 Substrate composition 20 3.1.3 Nutrients 20 3.1.4 Water temperature 21 3.2 Ashley River survey 22 3.2.1 Ashley River/Rakahuri at SH1 22 3.2.2 Ashley River/Rakahuri at Loburn 23 3.2.3 Ashley River/Rakahuri at Gorge 24 3.2.4 Depth and Point velocity for Ashley River/Rakahuri 25
Section 4 Discussion 26
4.1 Substrate composition and Phormidium cover 26 4.2 Nutrients and Phormidium cover 26 4.3 Temperature and Phormidium cover 27 4.4 River flow and Phormidium cover 27 4.5 Velocity and depth and Phormidium cover 28
Section 5 Conclusion and Further Research 29
Acknowledgements 30
References 31
Appendix 35
v

Section 1 Introduction
Globally, many toxic cyanobacterial blooms resulting in human and animal toxicosis and deaths have been documented (Lawton & Codd, 1991; Edwards et al., 1992, Moreno et al., 2004; Catherine et al., 2013). However, these events are often attributed to planktonic cyanobacterial blooms (Carmichael et al., 2001; Azevedo et al., 2002). Consequently, the environmental factors involved in regulating planktonic cyanobacterial blooms have been researched extensively (Oliver et al., 2012). Comparatively, there is a limited understanding of the environmental factors that lead to benthic cyanobacterial proliferations (Mez et al., 1998; Heath et al., 2011). During recent decades, there has been an apparent increase in blooms of the benthic cyanobacteria Phormidium in New Zealand Rivers (Biggs & Kilroy, 2000; Heath et al., 2010, 2013). Cyanobacterial blooms are often associated with water quality issues. In addition to causing tastes and odours, some species can produce toxic secondary metabolites known as cyanotoxins that can cause acute neurotoxicity (Carmichael, 1992) and pose a health risk to humans and animals (Codd et al., 1999; Falconer & Humpage, 2005; Funari & Testai, 2008). Homoanatoxin-a and anatoxin-a are the most common toxins produced by benthic cyanobacteria in New Zealand (Hamill, 2001; Wood et al., 2007; Heath et al., 2010). Animal and human toxicosis associated with the toxins produced by benthic cyanobacteria have also become increasingly prevalent (Edwards et al., 1992; Mez et al., 1997 Hamill, 2001; Gugger et al., 2005; Wood et al., 2007; Health et al., 2011).
Hydrological flow regimes are important in regulating the biomass of benthic periphyton communities (Clausen & Biggs, 1997; Biggs & Kilroy, 2000). Clausen and Biggs (1997) found that flows greater than three times the median flow were an important mechanism in determining periphyton biomass within New Zealand Rivers. Consequently, cyanobacteria often proliferate in periods of stable flow (Bowling & Baker, 1996; Sabatar et al., 2003; Heath et al., 2011, 2013).
Heath et al., (2011) estimated the percentage cover of Phormidium and measured other physico-chemical factors in two New Zealand Rivers for one year. Water temperature and river flow were identified as main factors regulating the occurrence of Phormidium. Furthermore, Heath et al., (2013) created a Habitat Suitability Criteria for Phormidium in the Hutt River, which suggested that flushing flows (3 times median) are the most important factor in regulating Phormidium cover. However, this research also suggests that in periods of stable flow, other physico-chemical factors, including dissolved inorganic nitrogen (DIN) and dissolved reactive phosphorous (DRP) become important. Fujimoto et al., (1997) highlights how temperature influences Phormidium growth. Fujimoto et al., also observed that Phormidium was dominant in all seasons in Lake Kasumigaura, suggesting a wide temperature tolerance. Furthermore, Fujimoto et al., (1997) also demonstrated through laboratory and field experiments that P. tenue was competitively dominant over eukaryotic algae when the nitrogen: phosphorus ratio was high. Previous studies also highlight the importance of water conductivity and nutrient ratios in regulating benthic cyanobacterial growth (Biggs & Close, 1989; Biggs, 1990; Chételet et al., 1998; Wood & Young 2011, 2012).
In this study, three sites along the Ashley River/Rakahuri were sampled weekly for 10 weeks. Samples of cyanobacterial mat were collected weekly for morphological identification and later toxin analysis. Water samples were also collected weekly for nutrient
1
analysis. Water temperature, conductivity, substrate composition and periphyton percentage cover, depth and point velocity were measured on each sampling day. The physico-chemical measurements in conjunction with flow data (acquired from Environment Canterbury (ECAN)) and the percentage cover were utilized to identify factors which correlated with Phormidium proliferations. Furthermore, as part of this summer project an analysis of historical ECAN data for 10 sites from the wider Canterbury region was undertaken (See Fig. 1). This included flow, temperature, nutrient and periphyton composition data from 2009–2014.
1.1 Research aims
The purpose of this study was to:
• Collate and analyse existing Environment Canterbury river monitoring data, including five sites with persistent Phormidium blooms, and five without.
• Identify the environmental factors that are best correlated with Phormidium proliferations in the Canterbury region.
• Conduct regular site surveys at three sites along the Ashley River/Rakahuri, to investigate temporal and spatial changes in Phormidium cover and relate this to differences in environmental factors.
2
Section 2 Methods
2.1 Sampling sites
The Ashley River/Rakahuri is located in Northern Canterbury and generally flows south east for 65 km, discharging into the Pacific Ocean at Waikuku Beach (Fig. 1). Three sites (SH1, Loburn, and Gorge) were sampled weekly on the Ashley River/Rakahuri (Fig. 1) between 2 December 2013 and 10 February 2014. Sites were selected primarily due to historical cyanobacterial proliferations and accessibility. For example, the Ashley River at Gorge site generally has low cyanobacterial percentage cover whereas over the last few years both lower sites (Ashley at SH1 and Loburn) have regularly had blooms that required the issuing of public health warnings.
2.2 Site surveys
The monitoring procedure was consistent with the New Zealand Guidelines for Monitoring Cyanobacteria in Recreation Fresh Waters (Wood et al., 2009). Transect surveys were conducted in approximately the same location every week. Transect lengths varied from 6–16 m. Four transects were surveyed at each site on each sampling date. Substrate composition and periphyton percentage cover were estimated at five evenly spaced points along each transect using an underwater viewer. The data from the 20 views were used to calculate the overall average of periphyton cover and substrate composition. The date, site, time, weather, last rainfall and any pertinent comments were also recorded.
2.3 Sampling protocol
2.3.1 Phormidium collection
Ten Phormidium mat samples were collected at each site where possible. Mat samples were stored in a chilly bin until arrival at the laboratory. In the laboratory, mat samples were homogenised using a sterile rod. Sub-samples (ca. 0.5 g) were preserved with lugols iodine for morphological identification and the remainder was frozen for later toxin/molecular analysis. Analysis of these samples was not undertaken as part of this study.
2.3.2 Environmental parameters measured in situ
At each site, pH, water temperature, conductivity and dissolved oxygen were measured using a Hach HQ40d portable meter. Turbidity was measured using a hand-held HACH DR/890 Colorimeter. At each view the point velocity, river flow and depth were evaluated using a Global Water Flow probe.
2.3.3 Water samples
3

Water samples were collected weekly at all sites to analyse for metals (not analysed as part of this study), dissolved organic carbon (DOC), total nitrogen (TN) and phosphorus (TP), dissolved inorganic nitrogen (DIN) and dissolved reactive phosphorus (DRP). Samples were also collected for possible later analyses of trace metals and major ions, however these analyses were not conducted as part of this study. Water samples were stored in a chilly bin until arrival at the laboratory. Samples for dissolved nutrient analysis were filtered with GF/C filters and stored in the freezer until further analysis
4

Figure 1. Map of the approximate locations of sampling sites. For site coordinates see Appendix 1. Map originally obtained from ECAN website (http://ecan.govt.nz/services/online-services/Pages/maps-canterbury-region.aspx#canterbury-general).
Key: Ashley River site (monitored weekly) ECAN sites with no Phormidium blooms ECAN sites with historical Phormidium blooms
Opihi at SH1
Ashburton at SH72
Hurunui at SH1
Conway at SH1
Ashley at SH1 Ashley at Gorge
Ashley at Loburn
Opihi at Rockwood
Waihao at Bradshaws
Pareora at Huts
Opihi at Waipopo Temuka at Manse Bridge
Hae Hae Te Moana at Glentohi
5

2.4 Analytical methods
Dissolved reactive phosphorus was determined using molybdate colorimetry (Eaton & Franson, 2005). Absorbance was measured using a Hach DR/3900. Nitrate concentrations were analysed using the cadmium reduction method (Hach, 2002). Samples for total phosphorus were digested using the persulphate method, and analysed for dissolved reactive phosphorus (Eaton & Franson, 2005). Total nitrogen was digested as nitrate and analysed using the Hach DR/890.
2. 5 Historical Environment Canterbury data
Data from 10 sites was acquired from Environment Canterbury’s state of environment and summer recreational health monitoring programmes (Fig. 1). Flow data was also provided by ECAN. Sites were chosen specifically for comparative purposes; five had consistent Phormidium issues, generally indicated by the issuing of public health warnings, and five had no Phormidium issues. Five of the sites (Hurunui at SH1, Opihi at SH1, Pareora at Huts, Opihi at Waipopo, and Waihao at Bradshaws) are ECAN summer recreation monitoring sites. These sites are monitored weekly from November to March. Cyanobacterial percentage cover is estimated by ECAN staff by bankside observations. When the percentage cover is estimated to be over 20%, transect surveys are usually conducted following the methods in the New Zealand Guidelines for Cyanobacteria in Recreation Fresh Waters (Wood et al., 2009). For the five aforementioned sites some monthly nutrient data was available. The remaining five sites (Conway at SH1, Opihi at Rockwood, Ashburton at SH72, Hae Hae Te Moana at Glentohi, and Temuka at Manse Bridge) were periphyton modelling sites, which have been monitored monthly since July 2011. At these sites, percentage cover of periphyton was estimated with 20 views along four transects. Water temperature, conductivity, DIN and DRP were also available for these sites. Daily medians and long-term median river flow for each site were obtained from ECAN. The 10 chosen sites were revisited and substrate composition was analysed. However, it is important to emphasize that the time of cyanobacterial estimations was not synchronous with substrate composition estimations, which may introduce some inaccuracies to our data set.
6
Section 3 Results
3.1 Survey of Canterbury rivers
Flow data and historic Phormidium percentage cover estimates were provided by ECAN. This was complemented by our own in depth study of three sites on the Ashley River through the summer of 2013–2014. Data collected on dissolved oxygen, conductivity and pH were not analysed as part of this study.
3.1.1 Site characteristics
Summaries of nutrients, Phormidium percentage cover and flow for each site are provided below. It is important to note that Phormidium did occur at all sites, despite being at low abundance at many.
Ashburton at SH72
The percentage cover of Phormidium did not exceed 1.5% and this was recorded in a period of prolonged low flow (Fig.3). This site has a high median flow of 8890 L/s. The majority of the substrate (82%) is small (gravel, fine gravel and sand/silt). Water temperatures are generally between 9 and 15°C. This site has the lowest DIN concentration.
Conway at SH1
Phormidium was only observed once during monitoring with 0.3% cover occurring during a period of low flow (Fig. 4). The median flow for this site is 3151 L/s and the substrate is predominantly small (71% gravel, fine grave, sand/silt). Boulder and cobble accounted for 29% of the substrate. This site was dominated by brown filamentous algae. This site has a low DIN (0.3 mg/L).
Hae Hae Te Moana at Glentohi
Phormidium has never been recorded in the ECAN surveys at this site (Fig. 5). However, during a site visit (5 February 2014) as part of this study a small amount (ca. <0.01%) of Phormidium was observed. The substrate was dominated by gravel and fine gravel (69%). The remaining 31% was cobble. The median flow for this site is 471 L/s. However, during the sampling period flushing flows (>1413 L/s) occurred regularly. The DIN concentration is low (0.1 mg/L).
Opihi at Rockwood
The greatest Phormidium percentage cover observed at this site was 4% on the 13 December 2013 and the highest water temperature 19.6°C was also recorded on this date. This increase in Phormidium cover also coincided with a period of low flow (Fig. 6). Phormidium was not observed during sampling on the 23 November 2011 and between the
7
19 November 2012 and the 15 April 2013, but was present in small amount (<4%) on all other sampling dates. A flushing flow of 21397 L/s (6.3 times median) occurred within 10 days of sampling on the 23 November 2013. Furthermore, flushing flows occurred within a 10 day period of sampling on the 19 November 2012, 10 January 2012 and the 21 March 2013. This site has a high DIN concentration (1.3 mg/L) and has the highest proportion (40%) of large substrate (boulders and cobble) of all the sites without Phormidium issues.
Waihao at Bradshaws Bridge
Small amounts of Phormidium (1–2%) where observed from the 1 December 2010 to the 22 December 2010 during a period of low flow (less than the median of 1514 L/s). A substrate survey was not at this site as it is a tidal pool, however, bankside observations indicate that sand/silt are the dominant substrates with some large boulders. Phormidium was not observed from 6 January 2011 to the 8 January 2014 where the median flow was exceeded on many occasions (Fig. 7). However, detached Phormidium has been observed on multiple occasions. This site has the highest DIN concentration of 1.7 mg/L.
Hurunui at SH1
Percentage cover of Phormidium peaked on the 3 February 2012 at 39% during an extended period of low and stable flows. A large flushing flow (365455 L/s, 6.9 times the median) occurred within 10 days of sampling on 7 January 2013 preventing the documentation of any Phormidium until the 11 February 2013, when percentage cover was estimated to be 1%. Five days later the cover was estimated at 26%. The median flow for this site is 53300 L/s, which is high compared to the other study sites (Fig. 8). No Phormidium was observed from 15 November 2010 to the 27 January 2012, during this period flow exceeded the median on many occasions. The substrate at this site is 59% large (cobbles and boulders) and the DIN concentration is 0.5 mg/L.
Opihi at SH1
During a period of stable flow between 13 December 2011 and 21 February 2012, percentage cover of Phormidium increased, peaking at 70% on the 14 February 2012 (Fig. 9), after which, a large flushing event (84210 L/s, 9.5 times median) occurred removing all Phormidium. Six other flushing events then occurred between the 28 February 2012 and the 8 February 2013 preventing Phormidium cover from exceeding 3%. All flushing flow events appear to correspond with significant reductions of Phormidium cover (Fig. 9). This site has a high DIN concentration (0.65 mg/L) and gravel and cobble are the dominant substrate types (44 and 51% respectively).
Opihi at Waipopo
8

Gravel and cobble were the only substrate type recorded (54 and 46%, respectively). The DIN concentration is 0.7 mg/L. A peak in percentage cover of Phormidium (70%) occurred on the 19 February 2013 during a period of relatively stable flows (Fig. 10).
Pareora at Huts
The substrate at this site is dominated by large cobble and boulders (86%). Furthermore, the substrate was fairly embedded in the riverbed. The median river flow at this site is 1432 L/s, which was exceeded on multiple occasions between 2009 and 2014 (Fig. 11). Percentage cover of Phormidium peaked (88%) on the 28 January 2011 after a long period of stable flows. A large flushing flow (32568 L/s, 22.7 times median) caused this percentage cover to reduce to 20%.This site has a DIN concentration of 0.6 mg/L.
Temuka at Manse Bridge
Peaks in Phormidium cover (≥20%) have been recorded at this site on the 26 January 2013 and the 5 March 2013, which coincide with a period of low and stable flows (less than the median flow of 3473 L/s). The majority of the substrate is composed of gravel (76%). This site has the highest DIN concentration (1.7 mg/L). No Phormidium was observed on the 28 November 2012 and 17 December 2012 (Fig. 12). A flushing flow occurred within 10 days of each of these sampling days.
9

Figure 3. Average Phormidium mat cover and temperature for Ashburton River at SH72. Flow data is for the Ashburton River at Mt Somers. Light grey bars represent November 2009- April 2010, dark grey bars represent November 2010- April 2011, grey bars represent November 2011- April 2012, white bars with black outline represent November 2012- April 2013 and black bars represent November 2013- January 2014.The dashed green line represents 20% coverage indicating a bloom event. The baseline flow represents the median river flow for the entire record. The flushing flow is three times the baseline flow.
10

Figure 4. Average Phormidium mat cover, temperature and river flow for Conway River at SH1. Light grey bars represent November 2009- April 2010, dark grey bars represent November 2010- April 2011, grey bars represent November 2011- April 2012, white bars with black outline represent November 2012- April 2013 and black bars represent November 2013- January 2014.The dashed green line represents 20% coverage indicating a bloom event. The baseline flow represents the median river flow for the entire record. The flushing flow is three times the baseline flow.
11

Figure 5. Average Phormidium mat cover, temperature and river flow for Hae Hae Te Moana River at Glentohi. Light grey bars represent November 2009- April 2010, dark grey bars represent November 2010- April 2011, grey bars represent November 2011- April 2012, white bars with black outline represent November 2012- April 2013 and black bars represent November 2013- January 2014. The dashed green line represents 20% coverage indicating a bloom event. The baseline flow represents the median river flow for the entire record. The flushing flow is three times the baseline flow.
12

Figure 6. Average Phormidium mat cover, temperature and river flow for Opihi River at Rockwood. Light grey bars represent November 2009- April 2010, dark grey bars represent November 2010- April 2011, grey bars represent November 2011- April 2012, white bars with black outline represent November 2012- April 2013 and black bars represent November 2013- January 2014.The dashed green line represents 20% coverage indicating a bloom event. The baseline flow represents the median river flow for the entire record. The flushing flow is three times the baseline flow.
13

Figure 7. Average Phormidium mat cover and river flow for Waihao River at Bradshaws Bridge. Light grey bars represent November 2009- April 2010, dark grey bars represent November 2010- April 2011, grey bars represent November 2011- April 2012, white bars with black outline represent November 2012- April 2013 and black bars represent November 2013- January 2014.The dashed green line represents 20% coverage indicating a bloom event. The baseline flow represents the median river flow for the entire record. The flushing flow is three times the baseline flow.
14

Figure 8. Average Phormidium mat cover and river flow for Hurunui River at SH1. Light grey bars represent November 2009- April 2010, dark grey bars represent November 2010- April 2011, grey bars represent November 2011- April 2012, white bars with black outline represent November 2012- April 2013 and black bars represent November 2013- January 2014.The dashed green line represents 20% coverage indicating a bloom event. The baseline flow represents the median river flow for the entire record. The flushing flow is three times the baseline flow.
15
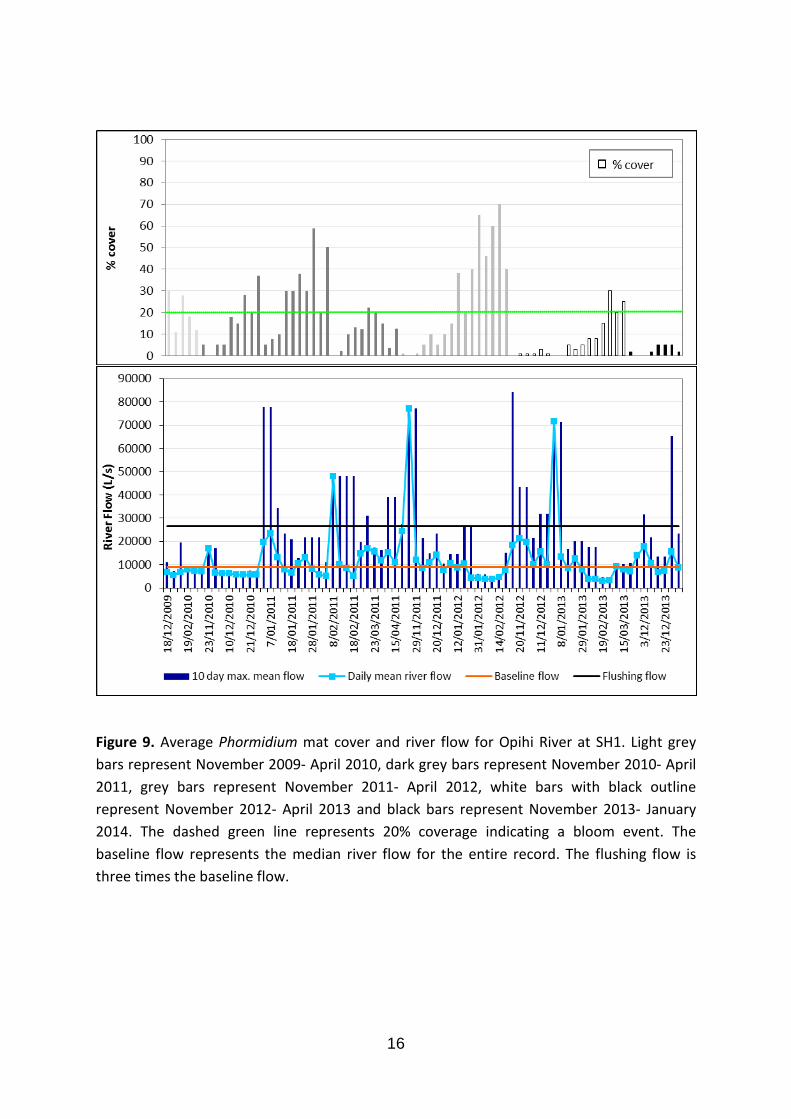
Figure 9. Average Phormidium mat cover and river flow for Opihi River at SH1. Light grey bars represent November 2009- April 2010, dark grey bars represent November 2010- April 2011, grey bars represent November 2011- April 2012, white bars with black outline represent November 2012- April 2013 and black bars represent November 2013- January 2014. The dashed green line represents 20% coverage indicating a bloom event. The baseline flow represents the median river flow for the entire record. The flushing flow is three times the baseline flow.
16

Figure 10. Average Phormidium mat cover for Opihi River at Waipopo. Flow data is for the Opihi River at SH1. Light grey bars represent November 2009- April 2010, dark grey bars represent November 2010- April 2011, grey bars represent November 2011- April 2012, white bars with black outline represent November 2012- April 2013 and black bars represent November 2013- January 2014.The dashed green line represents 20% coverage indicating a bloom event. The baseline flow represents the median river flow for the entire record. The flushing flow is three times the baseline flow.
17
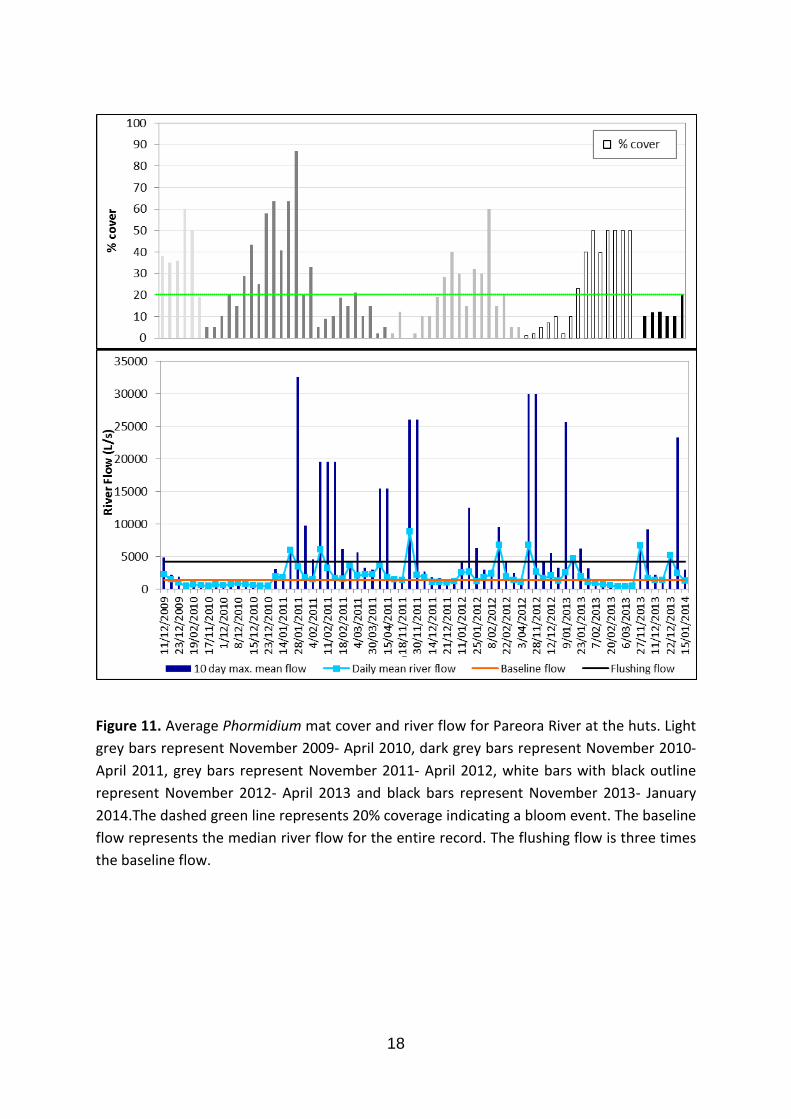
Figure 11. Average Phormidium mat cover and river flow for Pareora River at the huts. Light grey bars represent November 2009- April 2010, dark grey bars represent November 2010- April 2011, grey bars represent November 2011- April 2012, white bars with black outline represent November 2012- April 2013 and black bars represent November 2013- January 2014.The dashed green line represents 20% coverage indicating a bloom event. The baseline flow represents the median river flow for the entire record. The flushing flow is three times the baseline flow.
18
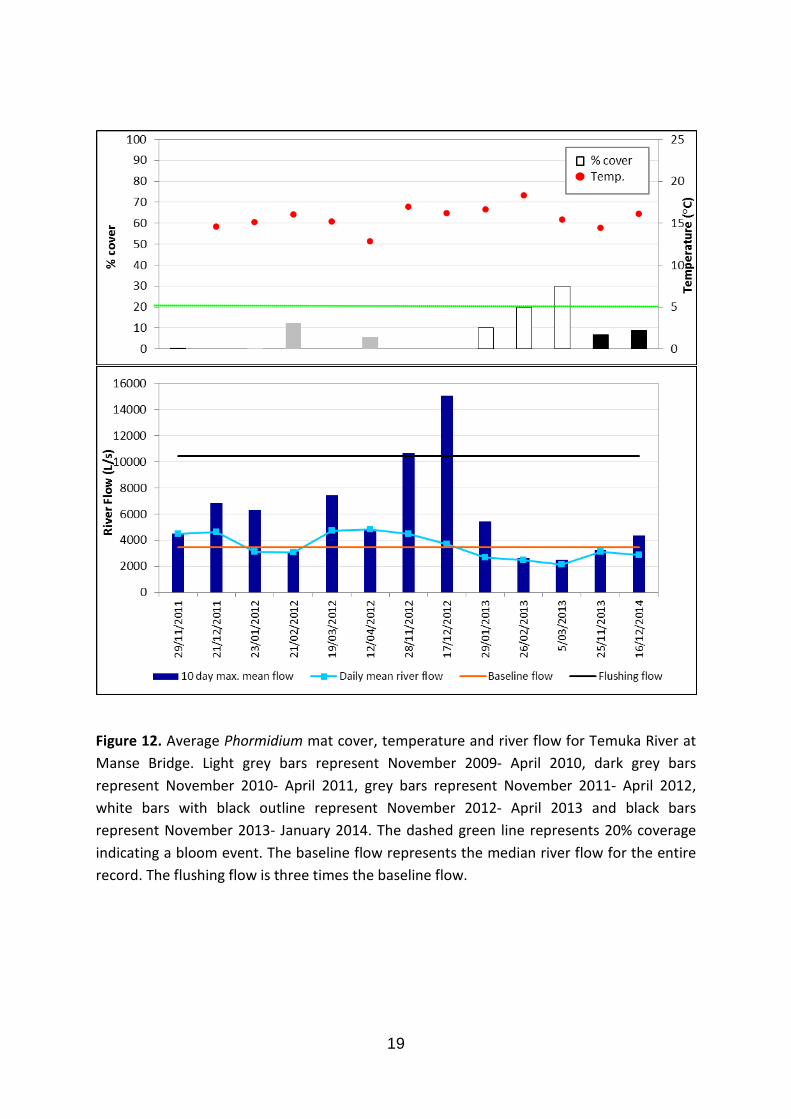
Figure 12. Average Phormidium mat cover, temperature and river flow for Temuka River at Manse Bridge. Light grey bars represent November 2009- April 2010, dark grey bars represent November 2010- April 2011, grey bars represent November 2011- April 2012, white bars with black outline represent November 2012- April 2013 and black bars represent November 2013- January 2014. The dashed green line represents 20% coverage indicating a bloom event. The baseline flow represents the median river flow for the entire record. The flushing flow is three times the baseline flow.
19

3.1.2 Substrate Composition
The dominant substrates for most sites were gravel and cobble. Ashley at the Gorge, Pareora at Huts and Hurunui at SH1 had a larger proportion of boulders (>20%) compared to all other sites (Fig. 2). Interestingly, some of the sites without Phormidium problems have a larger proportion (>60%) of gravel, fine gravel and sand/silt, than those with Phormidium problems, with the exception of the Temuka at Manse Bridge site. The sites with persistent Phormidium problems are dominated (excluding Temuka at Manse Bridge) by larger substrate (<46%, boulder/cobble).
Figure 2. Average percent cover of various substrates at all sampling sites. Values are averages of 20 measurements for all sites, except the three sites along the Ashley River /Rakahuri which are averages of 200 views. The four sites left of the black line indicate sites without historical Phormidium proliferations, the five sites directly on the right are sites with historical Phormidium proliferations. 3.1.3 Nutrients
The results in Table 1 below are averages calculated from data (2009-2014) provided by ECAN. Results for sites marked with a * are averages from weekly samples between 2013 and 2014 and N +N is only nitrate-N. Highlighted sites are ones with historical cyanobacterial proliferations. There were no significant differences between DRP at sites with and without
20

Phormidium issues. All are rather low and none exceeded 0.01 mg/L. In contrast DIN concentrations are high at all sites, with the exception of Ashburton at SH72. TN:TP and DIN:DRP ratios (by weight) tended to exceed the value of 10 that is commonly taken to indicate the switch between N and P limitation of growth rate, though all sites along the Ashley River/Rakahuri, where blooms were present, had low TN:TP ratios.
Table 1. Summary of nutrient concentrations for all study sites, including; ratio of total nitrogen to total phosphorus (TN:TP), ratio of dissolved inorganic phosphorus to dissolved reactive phosphorus (DIN:DRP), dissolved inorganic nitrogen (DIN), dissolved reactive phosphorus (DRP), total nitrogen (TN), total phosphorus (TP), nitrate-N and nitrite-N (N + N) and ammoniacal-N (NH4). The first five unhighlighted sites are those without historical proliferations. All measurements are given in mg/L.
Site DIN DRP TN TP N + N NH4 TN:TP DIN:DRP Ashburton @ SH72 0.0342 0.0018
0.0289 0.0054 19:1
Conway @ SH1 0.3037 0.0083 0.3998 0.005 36.6:1 Hae Hae Te Moana @ Glentohi 0.1053 0.0037 0.1178 0.0054 28.5:1 Opihi @ Rockwood 1.2637 0.0077
1.4913 0.009 164.1:1
Waihao @ Bradshaws Bridge 0.57 0.0033 0.6942 0.0108 0.5835 0.0094 64.3:1 172:1 Hurunui @ SH1 0.4967 0.0043 0.4917 0.005 115.5:1 Opihi @ SH1 0.65 0.0051 0.6390 0.0081 0.6328 0.0051 78.9:1 151.2:1 Opihi@ Waipopo 0.71 0.0036 0.8075 0.0069 0.6988 0.0109 117:1 127.5:1 Pareora @ Huts 0.59 0.0068 0.89 0.0082 0.5775 0.0098 108.5:1 86.8:1 Temuka @ Manse Bridge 1.7031 0.0087
1.9971 0.0127 195.8:1
Ashley @ SH1*
0.0059 0.2842 0.0365 0.1092
11:1 Ashley @ Loburn* 0.0073 0.1245 0.0364 0.1220 5.5:1 Ashley @ Gorge* 0.0053 0.3258 0.0495 0.0431
9:1
3.1.4 Water temperature
Phormidium was observed in temperatures ranging between 4–20°C (data not shown) in Canterbury rivers. On 26 July 2011, 4% cover of Phormidium was recorded at the Rangitata River at a water temperature of 4°C. Furthermore, a bloom of 24% cover was recorded on the 26 June 2012 in the Temuka River at a temperature of 8°C (data not shown). There appears to be no correlation between temperature and Phormidium percentage cover (data not shown).
21

3.2 Ashley River Survey 3.2.1 Ashley River/Rakahuri at SH1
Persistent blooms have been recorded at this site from 2009–2014 (data not shown), despite the substrate being 57% gravel (Fig.2). During this study, two blooms were observed (Fig. 13). The water temperature varied between 15 and 17°C. A flushing flow occurred on the 30 December 2013, which appeared to remove all Phormidium, after which the percentage cover increased weekly by approximately 6% under stable flow conditions. This site has a low TN:TP ratio of 11:1 (Table 1).
Figure 13. Average weekly Phormidium mat cover and water temperature for Ashley River/Rakahuri at SH1 from 2 December 2013 to 10 February 2014. The dashed green line represents 20% coverage indicating a bloom event.
22

23
3.2.2 Ashley River/Rakahuri at Loburn
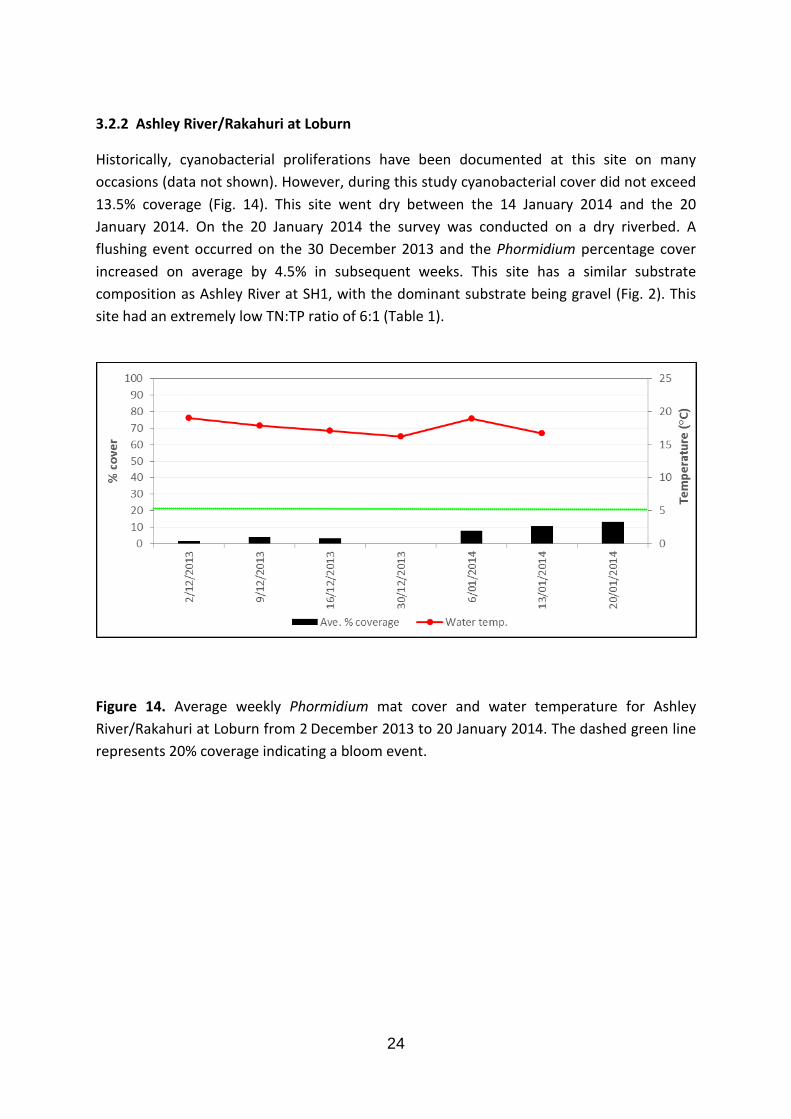
Historically, cyanobacterial proliferations have been documented at this site on many occasions (data not shown). However, during this study cyanobacterial cover did not exceed 13.5% coverage (Fig. 14). This site went dry between the 14 January 2014 and the 20 January 2014. On the 20 January 2014 the survey was conducted on a dry riverbed. A flushing event occurred on the 30 December 2013 and the Phormidium percentage cover increased on average by 4.5% in subsequent weeks. This site has a similar substrate composition as Ashley River at SH1, with the dominant substrate being gravel (Fig. 2). This site had an extremely low TN:TP ratio of 6:1 (Table 1).
Figure 14. Average weekly Phormidium mat cover and water temperature for Ashley River/Rakahuri at Loburn from 2 December 2013 to 20 January 2014. The dashed green line represents 20% coverage indicating a bloom event.
24
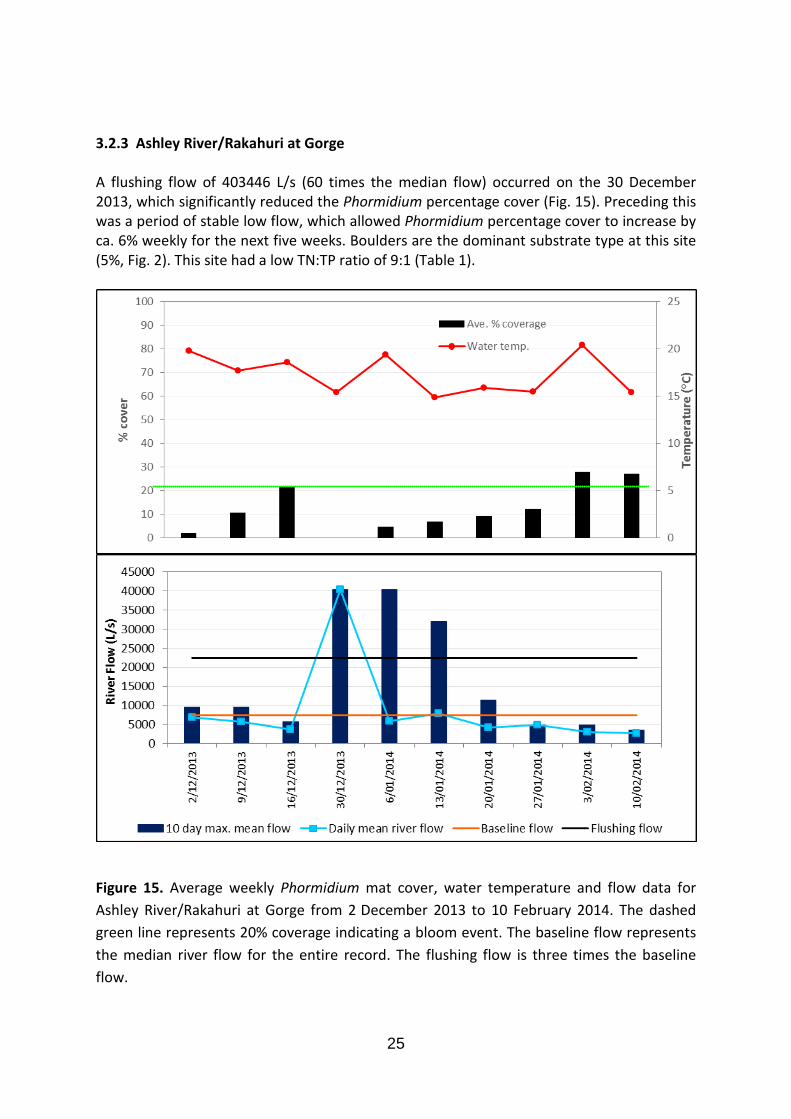
3.2.3 Ashley River/Rakahuri at Gorge A flushing flow of 403446 L/s (60 times the median flow) occurred on the 30 December 2013, which significantly reduced the Phormidium percentage cover (Fig. 15). Preceding this was a period of stable low flow, which allowed Phormidium percentage cover to increase by ca. 6% weekly for the next five weeks. Boulders are the dominant substrate type at this site (5%, Fig. 2). This site had a low TN:TP ratio of 9:1 (Table 1).
Figure 15. Average weekly Phormidium mat cover, water temperature and flow data for Ashley River/Rakahuri at Gorge from 2 December 2013 to 10 February 2014. The dashed green line represents 20% coverage indicating a bloom event. The baseline flow represents the median river flow for the entire record. The flushing flow is three times the baseline flow.
25

3.2.4 Depth and Point Velocity for Ashley River/Rakahuri
Depth ranged from 0.1 m to 0.9 m (Table 2). Average point velocities were similar at the SH1 and Loburn sites (Table 2). Comparatively, the Gorge site had a higher average velocity of 0.5 ms -1 and had the greatest mean depth of 0.29 m.
Table 2. Mean, minimum and maximum depths and point velocity (measured at the riverbed/water interface) for the three Ashley River/Rakahuri sites. Means were calculated from 200 measurements, except for the Loburn site, where means were calculated from 120 measurements.
Depth (m) Point velocity (ms -1)
Mean Min. Max Mean Min Max
SH1 0.23 0.1 0.9 0.39 0 0.8 Loburn 0.13 0.03 0.45 0.32 0 0.8 Gorge 0.29 0.1 0.59 0.47 0 1.4
26

Section 4 Discussion
4.1 Substrate composition and Phormidium cover
An increase in the proportion of large sized substrate appeared to correlate with an intensification of Phormidium percentage cover. This is consistent with the findings of Heath et al., (2012) who studied Phormidium at seven sites in the Hutt River over a 12 month period. Small substrate was the dominant substrate type at Conway at SH1. This, in conjunction with the occurrence of relatively frequent flushes at this site as well as Ashburton at SH72, provides a relatively unstable habitat that may prevent Phormidium blooms from occurring.
Heath et al., (2013) also observed that Phormidium can proliferate on all substrate types. A similar observation was made in this study where over the study period (November 2013 to January 2014) it was noted as present on all substrate types from bedrock to silt in Canterbury rivers. This infers that substrate size alone may not be a key variable in controlling Phormidium blooms, but rather the combination of substrate stability and flow variability. Large boulders may provide refuge for Phormidium inoculums during periods of high flow (Murdock & Dodds, 2007). During various site visits of the Canterbury rivers when Phormidium was present at low levels (<0.1%) it was observed mostly on large, stable substrate (personal observations).
4.2 Nutrients and Phormidium cover
The Canterbury river sites with high Phormidium coverage (>20% on multiple occasions) all had low DRP (<0.009 mg/L). This is consistent with studies in other regions of New Zealand (Biggs & Price, 1987; Wood & Young 2012; Heath et al., 2013). However, the sites without Phormidium issues also have low DRP, this suggests that this is not the only variable regulating Phormidium blooms in Canterbury rivers.
Other studies of New Zealand rivers have demonstrated a correlation between high TN:TP ratios (>15:1) and Phormidium blooms (Heath et al., 2011; Heath et al., 2012; Wood & Young, 2012) and it has been hypothesized that Phormidium has a competitive advantage over other algae in low phosphorus environments. However, more research is required to elucidate how Phormidium obtains enough phosphorus to support its rapid growth. A unique feature of Phormidium mats is the occurrence of a thin layer of fine sediment at the substrate/mat interface. Thus one hypothesis is that phosphorus bound to the fine sediment may become accessible to Phormidium due to the thick cohesive nature of the mats and the process of photosynthesis (raising pH during the day) and/or respiration (lowering oxygen concentrations at night), which could enhance release of biologically available phosphorus. Phormidium filaments are extremely motile and it is proposed that the filaments’ capture sediment and then use their motility to stay above the sediment.
With the exception of ‘Ashburton at SH72’, all sites had DIN elevated above the threshold of 0.1 mg/L suggested by Wood and Young (2012) as being required for Phormidium proliferation. Phormidium in New Zealand is thought to lack the ability to fix nitrogen (Heath, unpublished data), therefore, requires moderate nitrogen concentrations for rapid
27

growth. Low DIN concentrations may therefore restrict the growth of Phomidium at ‘Ashburton at SH72’ and ‘Hae Hae Te Moana at Glentohi’. Low DIN concentrations may also favour algal species with the ability to fix nitrogen and therefore may explain the lack of Phormidium at ‘Conway at SH1’ and the dominance of other algal species.
Increased nitrate concentrations in a water body is expected to stimulate faster biomass accrual, as a larger concentration gradient will increase the rate of diffusion from the water to the cell surface (Chételat et al., 1999). This may explain the fast biomass accrual observed at some sites. For example, Phormidium percentage cover doubled from 30% (1 February 2012) to 60% (8 February 2012) in one week at the ‘Pareora River at Huts’. High resolution sampling of nutrient concentrations and growth rate would be required to confirm possible relationships.
4.3 Temperature and Phormidium cover
Peaks in periphyton percentage cover have been documented during summer months in New Zealand, when the flow is stable and the temperature is elevated (Biggs & Close, 1989; Biggs, 1990; Heath et al., 2010, 2011). This is also the case in the Canterbury region, with peaks in Phormidium cover usually occurring in late summer. Temperature has been identified as being an important factor in regulating the occurrence of Phormidium blooms in New Zealand (Heath et al., 2011). However, no clear relationship was found between temperature and Phormidium percentage cover in this study because only data from the summer periods were used.
4.4 River flow and Phormidium cover
It has been suggested that the frequency of flushing events and duration of stable flow may be more important than the river flow in predicting the occurrence of Phormidium (Milne & Watts, 2007, Heath et al., 2011, Wood & Young, 2007, Heath et al., 2012). The general rule implemented within various regional councils around New Zealand is that a flushing flow (usually considered to be three times the median) is adequate to remove Phormidium (Clausen & Biggs, 1997, Milne & Watts, 2007).
High flow events clearly did have an impact on Phormidium in Canterbury rivers, but the “three times median” rule was not universally applicable. Similarly, Wood and Young (2012) concluded that this rule was not appropriate for all the rivers in the Manawatū-Whanganui region. Flows greater than six times the median were required to reduce the Phormidium cover at the ‘Pareora at Huts’ site. Conversely, at the ‘Temuka River at Manse Bridge’ site a flow of only two times the median was sufficient to remove all Phormidium. This difference may be a function of differences in the stability of the substrate, and therefore the interaction between flow and substrate size. For example, a flushing flow of 23 times the median was recorded at the ‘Pareora River at Huts’ site. This flushing flow reduced the percentage cover of Phormidium from 87% (28 January 2011) to 20% (2 February 2011). This site also had the greatest proportion of bedrock and cobble substrate of all sites (>80%). This suggests that this high river flow may have not been strong enough to mobilize the large substrate and therefore remove all Phormidium mats. River-specific flushing flow rules may need to be identified for specific sites, to allow for substrate type and flow characteristics of the site.
28

4.5 Velocity and depth and Phormidium cover
Francoeur and Biggs (2006) highlight the importance of water velocity in removing algal biomass. However, their study also shows that mat-forming species may be more tolerant of higher velocities than other growth forms. An increased water velocity may actually result in more rapid increases in Phormidium percentage cover at a site if it reduces the boundary layer surrounding the Phormidium mat and allows for faster uptake of nutrients from the surrounding environment. This may explain why Phormidium commonly grows in riffles. Heath et al., (2012) document Phormidium percentage cover as being greatest at velocities of less than 1.1 ms-1. However, they demonstrated that at a velocity of 2.1 ms-1, Phormidium cover still exceeded 20%. Similarly, in this study at the Ashley River at the gorge site, Phormidium cover exceeded 20% with an average water velocity of 1.4 ms-1.
Phormidium appears to be efficient in utilizing low light conditions, as it was observed in a variety of depths during this study. Furthermore, Heath et al., (2012) found that Phormidium in the Hutt River had no preference for depth. He attributed this finding to clear water, allowing high light penetration. This may also be the case for Phormidium in the Ashley River/Rakahuri as turbidity readings did not exceed 10 NTU unless the river was in flood.
29

Section 5 Conclusions and Further Research
The findings from the current study are preliminary and give an indication of some of the factors that may promote Phormidium blooms in the Canterbury region. Phormidium was present at all sites sampled, but blooms only formed at some. The frequency of flushing flows appears to be an important environmental parameter controlling bloom formation in Canterbury rivers. All of the rivers with high Phormidium bloom frequency had high DIN concentrations (≥ 0.5 mgL-1) and moderately low DRP concentrations (≤0.01 mgL-1), but some sites meeting these nutrient criteria did not have regular Phormidium blooms. The interaction between substrate stability and flow restricts the applicability of a single flushing flow value within all Canterbury rivers. Low DRP concentrations may be required for Phormidium to bloom but this requires further testing because low values were observed at all sites. However, the role of DIN is not yet completely understood. Low temperatures do not prevent Phormidium growth.
Future research should concurrently measure water quality attributes and cyanobacterial coverage, whilst keeping other environmental factors constant, such as substrate type. Further research is required to discover where Phormidium obtains alternative sources of phosphorus, as it does not appear to be the DRP in the water column. This is a phenomena which has recently been discovered in didymo (see Bothwell, Taylor & Kilroy, 2014). Other water quality attributes (dissolved organic carbon, dissolved metals etc.) may be influencing the growth of Phormidium and therefore needs to be investigated further. The rate of Phormidium growth may also be an important component for predicting the ability of blooms to form at particular sites, which requires further research.
30

Acknowledgements
I thank Dr Susie Wood for her continued guidance and support and willingness to help me (all the time!). I am very grateful to Dr Ian Hawes for facilitating my research and igniting my passion for cyanobacteria. I thank Annalise Davies, Sarah Hayman and Phil Clunies-Ross for the early morning assistance in Phormidium hunting duties. I thank Suellen Knopick for constantly helping me get organised and settled in. I thank Dr Paul Broady for enabling me to see the beauty of Phormidium under the microscope. I thank Hana Christenson for being very patient and teaching me how to process my samples for water chemistry. I thank Dr Dave Kelly and Kimberley Robinson from ECAN for assistance throughout my summer scholarship. I also thank ECAN for funding this summer scholarship. I am very grateful to Alice Trevelyan for keeping me up to date on Phormidium in South Canterbury and sending me awesome pictures of Phormidium. I thank Monica Wilson for providing all the flow data promptly. I appreciate the help Kelvin Nicolle gave me during my laboratory analyses.
31

References
Azevedo, S. M., Carmichael, W. W., Jochimsen, E. M., Rinehart, K. L., Lau, S., Shaw, G. R., & Eaglesham, G. K. (2002). Human intoxication by microcystins during renal dialysis treatment in Caruaru—Brazil. Toxicology, 181, 441–466.
Biggs, B. J. (1990). Periphyton communities and their environments in New Zealand rivers. New Zealand journal of marine and freshwater research, 24(3), 367–386.
Biggs, B. J., & Close, M. E. (1989). Periphyton biomass dynamics in gravel bed rivers: the relative effects of flows and nutrients. Freshwater biology, 22(2), 209–231.
Biggs, B. J. (2000). Eutrophication of streams and rivers: dissolved nutrient-chlorophyll relationships for benthic algae. Journal Information, 19(1).
Biggs, B. J., & Kilroy, C. (2000). Stream periphyton monitoring manual. NIWA. Biggs, B. J., & Price, G. M. (1987). A survey of filamentous algal proliferations in New Zealand rivers. New Zealand journal of marine and freshwater research, 21(2), 175–191. Bothwell, M. L., Taylor, B. W., & Kilroy, C. (2014). The Didymo story: The role of low dissolved phosphorus in the formation of Didymosphenia geminata blooms. Diatom Research, (ahead- of-print), 1-8. Bowling, L. C., & Baker, P. D. (1996). Major cyanobacterial bloom in the Barwon-Darling River, Australia, in 1991, and underlying limnological conditions. Marine and freshwater research, 47(4), 643–657. Carmichael, W. W. (1992). Cyanobacteria secondary metabolites- the cyanotoxins. Journal of Applied Microbiology, 72(6), 445–459. Catherine, Q., Susanna, W., Isidora, E. S., Mark, H., Aurélie, V., & Jean-François, H. (2013). A review of current knowledge on toxic benthic freshwater cyanobacteria–Ecology, toxin production and risk management. Water research, 47(15), 5464-5479. Chetelat, J., Pick, F. R., Morin, A., & Hamilton, P. B. (1999). Periphyton biomass and community composition in rivers of different nutrient status. Canadian Journal of Fisheries and Aquatic Sciences, 56(4), 560–569. Clausen, B., & Biggs, B. (1997). Relationships between benthic biota and hydrological indices in New Zealand streams. Freshwater biology, 38(2), 327–342. Cod, G. A., Bell, S. G., Kaya, K., Ward, C. J., Beattie, K. A., & Metcalf, J. S. (1999). Cyanobacterial toxins, exposure routes and human health. European Journal of Phycology, 34(04), 405–415.
32

Eaton, A. D., & Franson, M. A. H. (Eds.). (2005). Standard methods for the examination of water & wastewater. Edwards, C., Beattie, K. A., Scrimgeour, C. M., & Codd, G. A. (1992). Identification of anatoxin-a in benthic cyanobacteria (blue-green algae) and in associated dog poisonings at Loch Insh, Scotland. Toxicon, 30(10), 1165–1175.
Falconer, I. R., & Humpage, A. R. (2005). Health risk assessment of cyanobacterial (blue- green algal) toxins in drinking water. International Journal of Environmental Research and Public Health, 2(1), 43–50.
Funari, E., & Testai, E. (2008). Human health risk assessment related to cyanotoxins exposure. CRC Critical Reviews in Toxicology, 38(2), 9–-125.
Francoeur, S. N., & Biggs, B. J. (2006). Short-term effects of elevated velocity and sediment abrasion on benthic algal communities. In Advances in Algal Biology: A Commemoration of the Work of Rex Lowe (pp. 59–69). Springer Netherlands.
Fujimoto, N., Sudo, R., Sugiura, N., & Inamori, Y. (1997). Nutrient-limited growth of Microcystis aeruginosa and Phormidium tenue and competition under various N: P supply ratios and temperatures. Limnology and Oceanography, 42(2), 250–256. Gugger, M., Lenoir, S., Berger, C., Ledreux, A., Druart, J. C., Humbert, J. F., ... & Bernard, C. (2005). First report in a river in France of the benthic cyanobacterium Phormidium favosum producing anatoxin-a associated with dog neurotoxicosis. Toxicon, 45(7), 919–928. Hach, C. (2002). Water analysis handbook. Loveland, Colorado, USA, 61–62. Hamill, K. D. (2001). Toxicity in benthic freshwater cyanobacteria (blue-green algae): First observations in New Zealand. Heath, M. W., Wood, S. A., & Ryan, K. G. (2010). Polyphasic assessment of fresh-water benthic mat-forming cyanobacteria isolated from New Zealand. FEMS Microbiology Ecology, 73(1), 91–109. Heath, M. W., Wood, S. A., & Ryan, K. G. (2011). Spatial and temporal variability in Phormidium mats and associated anatoxin-a and homoanatoxin-a in two New Zealand rivers. Aquatic Microbial Ecology, 64(1), 69. Heath, M. W., Wood, S. A., Brasell, K. A., Young, R. G., & Ryan, K. G. (2013). Development of habitat suitability criteria and in-stream habitat assessment for the benthic cyanobacterium Phormidium. River Research and Applications.
33
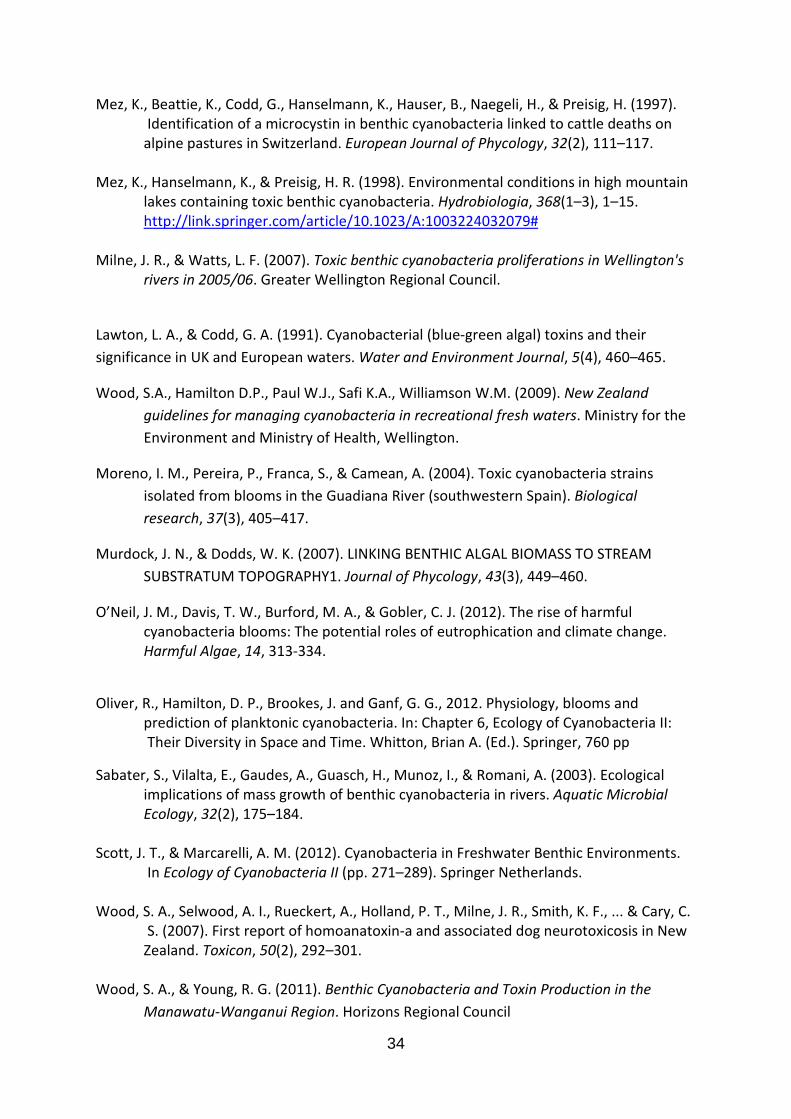
Mez, K., Beattie, K., Codd, G., Hanselmann, K., Hauser, B., Naegeli, H., & Preisig, H. (1997). Identification of a microcystin in benthic cyanobacteria linked to cattle deaths on alpine pastures in Switzerland. European Journal of Phycology, 32(2), 111–117. Mez, K., Hanselmann, K., & Preisig, H. R. (1998). Environmental conditions in high mountain lakes containing toxic benthic cyanobacteria. Hydrobiologia, 368(1–3), 1–15. http://link.springer.com/article/10.1023/A:1003224032079# Milne, J. R., & Watts, L. F. (2007). Toxic benthic cyanobacteria proliferations in Wellington's rivers in 2005/06. Greater Wellington Regional Council.
Lawton, L. A., & Codd, G. A. (1991). Cyanobacterial (blue-green algal) toxins and their significance in UK and European waters. Water and Environment Journal, 5(4), 460–465.
Wood, S.A., Hamilton D.P., Paul W.J., Safi K.A., Williamson W.M. (2009). New Zealand guidelines for managing cyanobacteria in recreational fresh waters. Ministry for the Environment and Ministry of Health, Wellington.
Moreno, I. M., Pereira, P., Franca, S., & Camean, A. (2004). Toxic cyanobacteria strains isolated from blooms in the Guadiana River (southwestern Spain). Biological research, 37(3), 405–417.
Murdock, J. N., & Dodds, W. K. (2007). LINKING BENTHIC ALGAL BIOMASS TO STREAM SUBSTRATUM TOPOGRAPHY1. Journal of Phycology, 43(3), 449–460.
O’Neil, J. M., Davis, T. W., Burford, M. A., & Gobler, C. J. (2012). The rise of harmful cyanobacteria blooms: The potential roles of eutrophication and climate change. Harmful Algae, 14, 313-334.
Oliver, R., Hamilton, D. P., Brookes, J. and Ganf, G. G., 2012. Physiology, blooms and prediction of planktonic cyanobacteria. In: Chapter 6, Ecology of Cyanobacteria II: Their Diversity in Space and Time. Whitton, Brian A. (Ed.). Springer, 760 pp
Sabater, S., Vilalta, E., Gaudes, A., Guasch, H., Munoz, I., & Romani, A. (2003). Ecological implications of mass growth of benthic cyanobacteria in rivers. Aquatic Microbial Ecology, 32(2), 175–184. Scott, J. T., & Marcarelli, A. M. (2012). Cyanobacteria in Freshwater Benthic Environments. In Ecology of Cyanobacteria II (pp. 271–289). Springer Netherlands. Wood, S. A., Selwood, A. I., Rueckert, A., Holland, P. T., Milne, J. R., Smith, K. F., ... & Cary, C. S. (2007). First report of homoanatoxin-a and associated dog neurotoxicosis in New Zealand. Toxicon, 50(2), 292–301. Wood, S. A., & Young, R. G. (2011). Benthic Cyanobacteria and Toxin Production in the Manawatu-Wanganui Region. Horizons Regional Council
34

Wood, S. A., & Young, R. G. (2012). Review of Benthic Cyanobacteria Monitoring Programme 2012. Horizons Regional Council.
35

Appendix
Appendix 1. Site locations
Table A1. Coordinates for all sites.
Site NZTMX NZTMY Ashley at SH1 1574900.9 5208021.7 Ashley at Loburn 1567269.9 5207656.1 Ashley at Gorge 1537076.9 5213274.8 Ashburton at SH72 1481519.4 5170925.3 Conway at SH1 1634279.6 5283617.9 Hae Hae Te Moana at Glentohi 1448658.9 5121784.2 Opihi at Rockwood 1435562.7 5107424.3 Waihao at Bradshaws Bridge 1454091.3 5040401.2 Hurunui at SH1 1608329.3 5250306.6 Opihi at SH1 1462012.9 5097395.5 Opihi at Waipopo 1466881.6 5096730.5 Pareora at Huts 1445305.4 5080570.6 Temuka at Manse Bridge 1461775.2 5099444.2
Appendix 2. Raw data for the Ashley River survey
T1, T2, T3 and T4 represent the averages in benthic cyanobacterial cover for the respective transect. Where cells are empty the parameter was not measured due to equipment malfunction, with the exception of transects on the 30.12.13 were surveys were not conducted due to a flood.
Table A2.1 Environmental parameters measured and the average percentage cover of Phormidium for each transect and the total average for Ashley River at SH1.
Date Temp. (°C)
DO (mg/L)
Cond. (u/S)
pH Turbidity (NTU)
T1 T2 T3 T4 Overall % cover
02.12.13 14.8 11.18 88.6 7.29 0 2.4 4.7 3 54.4 16.125 09.12.13 16.7 10.11 97 7.53 21.67 15.6 18 9 9.4 13 16.12.13 17.1 8.68 99 4 20 25 28.4 15 22.1 30.12.13 17 9.0 86.1 7.8 44 06.01.14 16.8 9.4 88 8.1 1 0 0 0 0 0 13.01.14 15.3 9.9 85.6 7.6 0 1.4 1.2 1.8 0 1.1 20.01.14 16.5 9.6 88.1 7.6 0 5.6 4.4 3 2.8 3.95 27.01.14 15.7 9.1 95.4 7.2 7 13.4 15.4 14 8.1 12.725 03.02.14 17 9.61 89 0 15.4 23 14 16 17.1 10.02.14 16.7 8.37 93.2 6.8 0 32 36 33 23.2 31.05
36

37
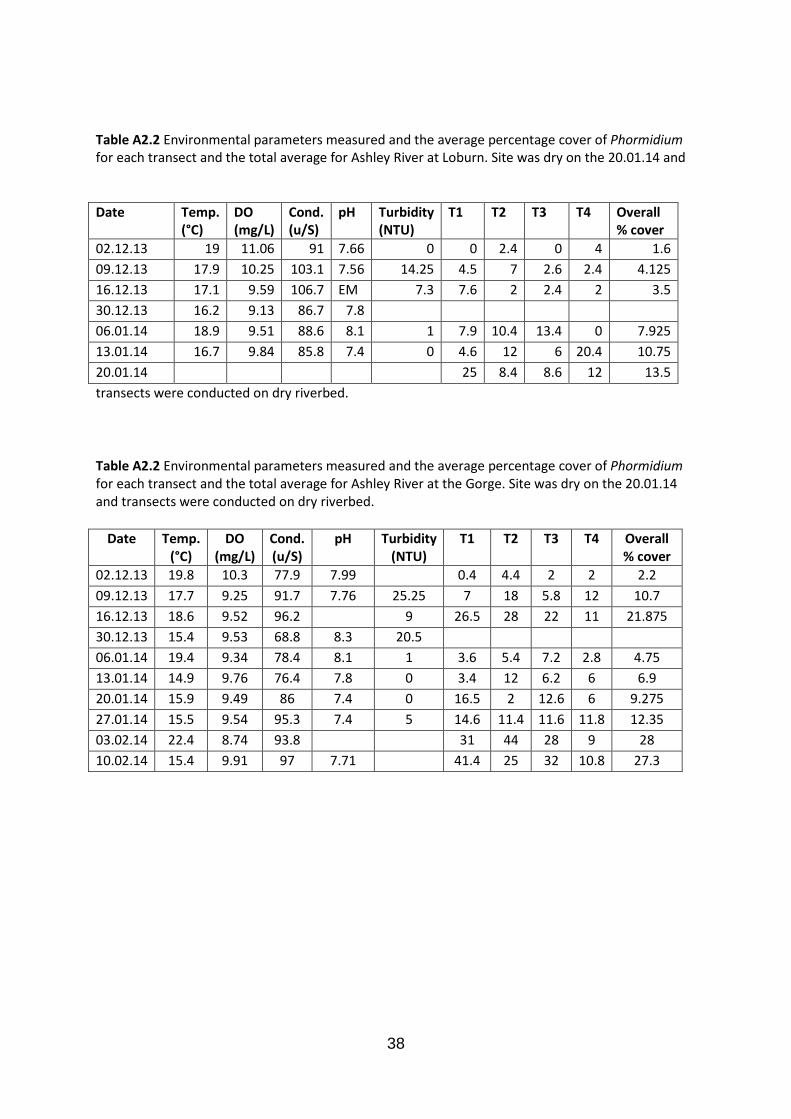
Table A2.2 Environmental parameters measured and the average percentage cover of Phormidium for each transect and the total average for Ashley River at Loburn. Site was dry on the 20.01.14 and
transects were conducted on dry riverbed.
Table A2.2 Environmental parameters measured and the average percentage cover of Phormidium for each transect and the total average for Ashley River at the Gorge. Site was dry on the 20.01.14 and transects were conducted on dry riverbed.
Date Temp. (°C)
DO (mg/L)
Cond. (u/S)
pH Turbidity (NTU)
T1 T2 T3 T4 Overall % cover
02.12.13 19.8 10.3 77.9 7.99 0.4 4.4 2 2 2.2 09.12.13 17.7 9.25 91.7 7.76 25.25 7 18 5.8 12 10.7 16.12.13 18.6 9.52 96.2 9 26.5 28 22 11 21.875 30.12.13 15.4 9.53 68.8 8.3 20.5 06.01.14 19.4 9.34 78.4 8.1 1 3.6 5.4 7.2 2.8 4.75 13.01.14 14.9 9.76 76.4 7.8 0 3.4 12 6.2 6 6.9 20.01.14 15.9 9.49 86 7.4 0 16.5 2 12.6 6 9.275 27.01.14 15.5 9.54 95.3 7.4 5 14.6 11.4 11.6 11.8 12.35 03.02.14 22.4 8.74 93.8 31 44 28 9 28 10.02.14 15.4 9.91 97 7.71 41.4 25 32 10.8 27.3
Date Temp. (°C)
DO (mg/L)
Cond. (u/S)
pH Turbidity (NTU)
T1 T2 T3 T4 Overall % cover
02.12.13 19 11.06 91 7.66 0 0 2.4 0 4 1.6 09.12.13 17.9 10.25 103.1 7.56 14.25 4.5 7 2.6 2.4 4.125 16.12.13 17.1 9.59 106.7 EM 7.3 7.6 2 2.4 2 3.5 30.12.13 16.2 9.13 86.7 7.8 06.01.14 18.9 9.51 88.6 8.1 1 7.9 10.4 13.4 0 7.925 13.01.14 16.7 9.84 85.8 7.4 0 4.6 12 6 20.4 10.75 20.01.14 25 8.4 8.6 12 13.5
38

Waterways Centre for Freshwater Management University of Canterbury & Lincoln University Private Bag 4800 Christchurch New Zealand
Phone +64 3 364 2330 Fax: +64 3 364 2365
www.waterways.ac.nz
39