Environmental Factors Solar Radiation
42
Transcript of Environmental Factors Solar Radiation

Environmental and Cultural Factors Limiting Potential Yields
Atmospheric Carbon DioxideSolar RadiationTemperature (Extremes)WaterWindNutrients (N and K)Others, ozone etc.,Growth Regulators (PIX)

Radiation and Plant Growth
Total amount (duration or length), intensity and quality of light will have profound influence on the energy balance and flow of different
components of Earth’s ecosystems.

The objectives of this lecture are:
• To learn global, regional and local spatial and temporal/diurnal trends in solar radiation.
• Radiation distribution in different plant canopies.
• The influence of solar radiation on plants and ecosystems in general.
• The relationship between solar radiation and remote sensing.
Solar Radiation - Objectives

Solar Radiation
• All life on the earth is maintained by the flow of energy radiated by the Sun and entering the biosphere.
• Plants fix this energy through photosynthesis. • Radiation is also the primary source for turnover of
organic materials, and by regulating the heat and water balance of the earth it provides the energy condition essential for living organisms.
• For plants, radiation is:– A source of energy (photoenergetic effect).– Stimulus for development (photocybernetic effect).– Stress factor (photodestructive effect).

Light and Carbohydrates and Dry Matter Production
• Of the 100% total energy received by the leaf, only 5% is converted into carbohydrates and later for biomass production.
• Losses of energy by non-absorbed wavelengths: 60%
• Reflection and transmission: 8%
• Heat dissipation: 8%
• Metabolism: 19%

Radiation and PhotosynthesisLeaf-level

Radiation and PhotosynthesisCanopy-level
Light or PPFD, µmol m-2 s-1
0 200 400 600 800 1000 1200 1400 1600 1800 2000 2200 2400
Can
opy
phot
osyn
thes
is, m
g C
O2 m
-2 s
-1
-2
0
2
4
6
8

Light and Dry Matter Production

Solar Radiation - Crop GrowthCotton Photosynthetic response to solar radiation
Solar Radiation, MJ m-2 d-10 5 10 15 20 25 30
Pho
tosy
nthe
sis,
g C
O2
m-2
d-1
0
50
100
150
200
250

Net Photosynthesis and Available Light Intensity
Time of the Day (Central Standard Time)0 2 4 6 8 10 12 14 16 18 20 22 24
PP
FD, µ
mol
m-2
s-1
0
500
1000
1500
2000
2500
Car
bon
Exc
hang
e R
ate,
mg
CO
2 m
-2 s
-1
-2
-1
0
1
2
3
4
5
6
7
360 µL L-1
Solar RadiationMaize, DAE 37

SPAR - Data AcquisitionCanopy Photosynthesis and Solar Radiation
Time, h4 6 8 10 12 14 16 18 20
PP
FD, µ
mol
m-2
s-1
0
500
1000
1500
2000
Pho
tosy
nthe
sis,
mg
CO
2 m
-2 s
-1
-2
0
2
4
6
8 80 DAE 1995 plus 2°C
720 µl l-1 CO2
360 µl l-1 CO2

Radiation – Some Facts

Solar Radiation – Some Facts• The Sun is the universal source of energy for the earth and the
organisms living on it.
• At the outer limits of the Earth’s atmosphere, the intensity of the radiation is 1360 W m-2 (Solar constant).
• More than half is lost, being cast back into space as a result of refraction and diffraction in the atmosphere, or scattered or absorbed by particles in the air.
• The radiation reaching Earth’s surface is called global radiation, and ranges from 290 to 3000 nm.
• On average, 45% of the incoming solar radiation falls within therange of 389 to 710 nm, which is the range utilized by photosynthesis by plants. This range is often defined as photosynthetically active radiation, PAR, and is often denoted by the range between 400 to 700 nm.

Solar Radiation – Some Facts
• Radiation at shorter wavelengths (UV-A 315 to 380 nm andUV-B 280 to 315 nm) is known as ultraviolet radiation, and is absorbed in the upper atmosphere by ozone and oxygen.
• If we do not have the absorption of the ultraviolet radiation byozone and oxygen, life on this planet as we know it could notsurvive because of the excessive levels of UV.
• UV radiation (<300 nm) are absorbed by nucleic acids andproteins.
• These high-energy wavelengths cause degradation of these molecules.

Solar Radiation – Some Facts
• The upper end of the spectrum is known as infrared radiation (IR 750 to 4000 nm).
• Plants do receive long wave radiation known as thermoradiation (IR 4000 to 105 nm) and themselves emit this type of radiation.
• Our eyes, for example, are sensitive to only a small range of frequencies – visible light region of the electromagnetic spectrum.

Solar Radiation – Some Facts
• Light is also a particle, which we call a photon. Each photon contains an amount of energy that is called quantum (plural quanta).
• The energy content of the light is not continuous but rather is delivered in these discrete packets, the quanta. Therefore, Sun light is like a rain of photons of different frequencies.

Solar Radiation – Some Facts
• As the Sun transverses the sky from 0 to 180°, the radiant energy passes through various densities of atmosphere which alters by absorption and scattering the spectral radiation received on theearth.
• This atmospheric absorption and scattering cause the solar irradiance reaching the earth to change; i.e., when the Sun isnear the horizon, the light must pass through the longest air path compared to when the Sun is directly overhead when the air mass is least.

Radiation and Plant Life

Solar Radiation and Day-length

Solar Radiation and Day-length
In the northern hemisphere,Summer solstice: 22 JuneWinter solstice: 22 December

Radiation Trends

Mississippi Long-term Climatic DataTemperature and Solar Radiation
Day of the Year0 60 120 180 240 300 360
Ave
rage
Tem
pera
ture
, °C
0
5
10
15
20
25
30
35
Sol
ar R
adia
tion,
MJ
m-2
day
-1
5
10
15
20
25
30
35
Temperature
Solar Radiation
Optimum Temp. line
Minimum Temp. line

Radiation Conditions - Seasonal TrendsStoneville, MS and Maros, Indonesia
Day of Year0 60 120 180 240 300 360
Sol
ar R
adia
tion,
MJ
m-2
d-1
0
5
10
15
20
25
30
Stoneville, MS
Maros, Indonesia
16.6, 6076
17.7, 6446

Radiation Conditions - Seasonal TrendsBakersfield, CA, Corpus Christi, TX and Stoneville, MS
Day of Year0 60 120 180 240 300 360
Sol
ar R
adia
tion,
Lan
gley
s
0
100
200
300
400
500
600
700
800Bakersfield, CA
Corpus Christi, TX
Stoneville, MS
1 langley = 0.04186 MJ m-2 d-1

Radiation – Long-term Typical Values Several places across the US
Location MJ m-2 year-1
Bakersfield, CA 7923 100%
Stoneville, MS 7378 -7%
Corpus Christi, TX 7146 -10%
Florence, SC 6817 -14%
Huntsville, AL 6718 -15%

Radiation – Long-term Typical Values Stoneville, MS and Bakersfield, CA
Month
0 1 2 3 4 5 6 7 8 9 10 11 12
Mon
thly
tota
l rad
iatio
n, M
J m
-2
0
200
400
600
800
1000
1200Stoneville, MSBakersfield, CA

Radiation Conditions - Seasonal TrendsBakersfield, CA and Stoneville, MS - 1991
Day of Year0 60 120 180 240 300 360
Sol
ar R
adia
tion,
Lan
gley
s
0
200
400
600
800
1000 Bakersfield, CA Stoneville, MS
Min. 37 18
Max. 756 772
Mean 451 404
Total 164,685 147,622
11% more
Stoneville, MS
Bakersfield, CA

Radiation Distribution in the Plant Cover

The incident light at the top of the canopy is absorbed by successive layers of leaves in the canopy. This light enters the bottom of the canopy by:
1. Direct radiation as sun fluxes through the gaps in the canopy
2. Scattered light from the leaves and soil.
3. Transmittance through the leaves.
Radiation and Canopy Interception

The interception of the light by the canopy is expressed by Beer’s law as follows:
I = I0 e-kLAI
Where I is the intensity of the light at the point in the canopy, I0 = light intensity at the top of the canopy, LAI is the leaf area index above that point and k represents the extinction coefficient determined empirically.
Leaf area index is the most commonly used canopy structure parameter, and is defined as:
Leaf Area Index (LAI) = Total leaf area / ground area
Radiation Interception

The decrease in light intensity or the attenuation of radiation (attenuation coefficient) in a stand depends on:
1. Density of the foliage.
2. The arrangement of the leaves within the canopy.
3. The inclination (angle) of the leaves.
Therefore, for grain crops and grasses, the attenuation coefficient is between 0.3 to 0.5, in the dicots, for example, it is about 0.7 and in a dense forest, it is mostly absorbed by the top canopy and very little is pass through the lower layers.

Radiation Interception and Leaf Type

Radiation Distribution in the Soil and Water
• Radiation or light scarcely penetrates soil at all; 1% in sandy and clay soils reaches a depth of 2-5 mm below the soil surface.
• In water, radiation is more strongly attenuated than in the atmosphere.
- Long-wave radiation is absorbed in the upper few mm, infra-red in the upper few cm and UV penetrates up to a 1 m.
- For an example, in open ocean – 1% of the light penetrates down to 150 m and it is about 20 – 50 m near the shorelines.
- In clear lakes, light penetrates in sufficient quantities to support vascular plants up to 5 m.

Radiation, Remote Sensing and Plant Physiology
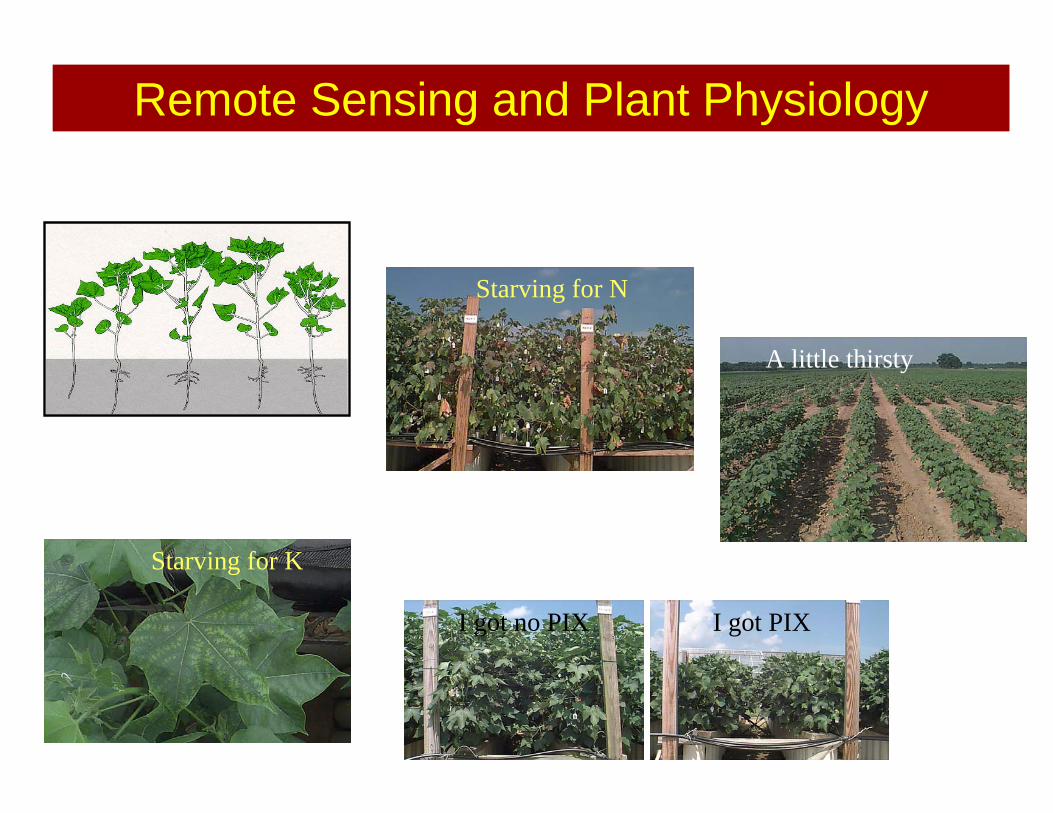
Remote Sensing and Plant Physiology
I got PIX
Starving for K
Starving for N
I got no PIX
20 25 30 35 40
Temperature, oC
A little thirsty

Reflectance - Leaf Level
• Leaf surface properties (wax and cuticle)• Internal structure (anatomy)• Biochemistry (concentration and distribution)• Leaf physiology

Reflectance - Canopy Level
• Soil characteristics• Vegetation characteristics

Typical spectral response characteristics of green vegetation (after Hoffer, 1978)

Leaf Nitrogen and Spectra
Wave Length, nm200 300 400 500 600 700 800 900 1000 1100 1200
Frac
tion
of th
e M
axim
um R
adia
nce
0.00
0.25
0.50
0.75
1.00Leaf N = 1.9%
Leaf N = 3.2%Leaf N = 3.3%
___
___

Typical Spectra - Species DifferencesWell-watered and well-fertilized
Wavelength, nm500 1000 1500 2000 2500
Ref
lect
ance
0.00
0.25
0.50
0.75
1.00
Corn
SoybeanCottonSorghum

Environmental Plant PhysiologyReading and Reference Material
1. Larcher, W. 1995. Physiological Plant Ecology. 1.2 Radiation and Climate, pages 31-56 (You have to read).
2. Pressaraki, M. (eds). 1994. Handbook of Plant Physiology, Chapter 11 by Serano, L., J. A. Pardos, F. I. Punalre and F. Domingo. Absorption of radiation, photosynthesis, and biomass production in plants. Pages243-256.
3. Hall, A.E. Chapter 4, pages 33-58, Crop physiological responses to light.
4. ASAE EP344.3 Jan2005. Lighting Systems for Agricultural Facilities (A must read paper if you are working with greenhouses and controlled environments and radiation environments, and also for unit explanations and conversions).