Environmental Engineering unsaturated soil property ... · unsaturated soil property functions, ......
39
Draft Examination of the estimation of relative permeability for unsaturated soils Journal: Canadian Geotechnical Journal Manuscript ID: cgj-2015-0043.R2 Manuscript Type: Article Date Submitted by the Author: 28-May-2015 Complete List of Authors: Zhang, Feixia; University of Alberta, Department of Civil and Environmental Engineering Fredlund, Delwyn; Golder Associates Ltd., Saskatoon, Keyword: Permeability function, unsaturated coefficient of permeability, soil suction, unsaturated soil property functions, air-entry value https://mc06.manuscriptcentral.com/cgj-pubs Canadian Geotechnical Journal
Transcript of Environmental Engineering unsaturated soil property ... · unsaturated soil property functions, ......

Draft
Examination of the estimation of relative permeability for
unsaturated soils
Journal: Canadian Geotechnical Journal
Manuscript ID: cgj-2015-0043.R2
Manuscript Type: Article
Date Submitted by the Author: 28-May-2015
Complete List of Authors: Zhang, Feixia; University of Alberta, Department of Civil and Environmental Engineering Fredlund, Delwyn; Golder Associates Ltd., Saskatoon,
Keyword: Permeability function, unsaturated coefficient of permeability, soil suction, unsaturated soil property functions, air-entry value
https://mc06.manuscriptcentral.com/cgj-pubs
Canadian Geotechnical Journal

Draft
1
Examination of the estimation of relative permeability for unsaturated soils
Feixia Zhang1, and D.G. Fredlund2
1 PhD Candidate, University of Alberta, Edmonton, AB, [email protected]
2 Senior Geotechnical Engineer, Golder Associates Ltd., Saskatoon, SK., Canada,
Corresponding author: Feixia Zhang
Address: Department of Civil & Environmental Engineering, University of Alberta, Markin/CNRL
Natural Resources Engineering Facility, 9105-116th ST, Edmonton, Alberta, Canada, T6G 2W2
Telephone number: 780-708-5323
E-mail Address: [email protected]
Page 1 of 38
https://mc06.manuscriptcentral.com/cgj-pubs
Canadian Geotechnical Journal

Draft
2
Abstract:
The unsaturated permeability function is an important soil property function used in the
numerical modeling of saturated-unsaturated soil systems. The permeability function is
generally predicted by integrating along the soil-water characteristic curve (SWCC) starting at
saturated soil conditions. The integration is based on a particular integral formula. The
Fredlund-Xing-Huang permeability function is a flexible integration techniques used for
calculating the unsaturated permeability function. The original permeability theory published by
Fredlund et al., (1994) specified that the air-entry value, ψaev (AEV), be used as the lower limit of
the integration when calculating the permeability function. However, since there was no
analytical procedure available for the calculation of the air-entry value on the SWCC, it became
common practice to start the integration procedure from a value near zero. The assumption was
made that the error associated with starting the integration from an arbitrary low value was
minimal. While this might be the case in some situations, the error can be quite substantial in
other situations. This paper undertakes a study of the effect of the lower limit of integration on
the calculation of the permeability function. Comparisons are made between starting the
integration from various values below the AEV and starting the integration from the calculated
air-entry value, ψaev. A mathematical algorithm is also proposed for the calculation of the AEV
for integration purposes. The results show that the relative coefficient of permeability can be
significantly under-estimated when the lower limit of integration is smaller than the AEV. The
recommendation is that the AEV always be used as the lower limit of integration in the
Fredlund-Xing-Huang permeability equation.
Key words: Permeability function, unsaturated coefficient of permeability, soil suction,
unsaturated soil property functions, air-entry value.
Page 2 of 38
https://mc06.manuscriptcentral.com/cgj-pubs
Canadian Geotechnical Journal

Draft
3
Introduction
The unsaturated coefficient of permeability function is required when modeling saturated-
unsaturated soil systems. Direct measurement of the unsaturated permeability function is costly,
technically-demanding, and time-consuming. As a result, the measurement of the unsaturated
permeability function is reserved for research studies or large projects where substantial risk
may be involved. Considerable research has been directed towards the estimation of the
unsaturated coefficient of permeability function. There are four categories of models used for
the estimation of unsaturated coefficient of permeability functions (Fredlund et al, 2012); namely,
i.) empirical models, ii.) statistical models, iii.) correlation models and iv.) regression models.
Empirical models and statistical models appear to be most extensively used in geotechnical
engineering. The past decades have witnessed a rapid increase in the combined modeling of
the saturated-unsaturated portions as a soil continuum (Fredlund et al. 2012). Considerable
effort is expended in measuring the saturated coefficient of permeability of each soil layer and
then the unsaturated soil permeability functions are generally estimated based on one of the
above-mentioned models. Often the numerical modeling is followed by a parametric study or a
probabilistic analysis which quantifies the effect of variations in the permeability function on the
final outcome of the analysis. In any case, the estimation of the permeability function has
become an integral part of assessing the hydraulic soil properties associated with seepage
analyses.
Empirical models utilize the similar character of the soil-water characteristic curve, (SWCC), and
the permeability function to estimate the unsaturated coefficient of permeability function. The
Brooks and Corey (1964) equation is one example of an empirical model. Statistical models
make use of the fact that the permeability function and the soil-water characteristic curve are
mainly controlled by the pore-size distribution of the soil. Consequently, the permeability
function was developed based on the interpretation and application of the SWCC. Childs and
Page 3 of 38
https://mc06.manuscriptcentral.com/cgj-pubs
Canadian Geotechnical Journal

Draft
4
Collis-George (1950), Burdine (1953) and Mualem (1976) are three commonly used integral
formulas of relative permeability based on different physical models.
The van Genuchten equation (1980) and the Fredlund and Xing equation (1994) are two well-
known mathematical equations for the SWCC. The van Genuchten SWCC equation was
introduced into the Burdine (1953) equation and the Mualem (1976) integral formulas to obtain a
permeability function. This gave rise to two closed-form solutions for the unsaturated soil
permeability equation. The Fredlund and Xing (1994) SWCC equation was also introduced into
the Childs and Collis-George (1950) integral formula, yielding an integral solution for the
permeability equation. These combinations have given rise to three unsaturated soil
permeability functions commonly used in geotechnical engineering. The three methodologies for
the relative permeability function are referred to as: i.) the van Genuchten-Burdine (1980)
equation, ii.) the van Genuchten-Mualem (1980) equation, and iii.) the Fredlund, Xing and
Huang (1994) permeability function. In each of the above cases, the unsaturated soil
permeability function is obtained by combining the saturated coefficient of permeability and the
relative coefficient of permeability. The Fredlund, Xing and Huang (1994) permeability function
has the advantage that the integral permeability function retains the independence of the SWCC
fitting variables when estimating the coefficients of permeability. On the other hand, the van
Genuchten permeability functions are closed-form and simpler to use in engineering practice.
The original relative permeability theory published by Fredlund et al., (1994) specified the air-
entry value, ψaev, as the lower limit of the integration. However, implementations in engineering
practice appear to have used other values between zero and ψaev as the starting point of
integration when calculating the relative coefficient of permeability. It does not appear that any
study has been undertaken to assess whether the choice for the lower limit of integration
influences the calculation of the Fredlund, Xing and Huang (1994) permeability function.
Page 4 of 38
https://mc06.manuscriptcentral.com/cgj-pubs
Canadian Geotechnical Journal
Draft
5
This paper investigates the error caused by using various values for the lower limit of integration.
The effect of the lower limit of integration is examined in terms of the effect of each of the
SWCC fitting parameters, (i.e., “af, nf, mf, mf”), on the resulting error. An empirical procedure for
the determination of the air-entry value is also described. The definition of the “permeability
error” is described followed by a study of the impact of the fitting parameters on the magnitude
of the error in the permeability function.
Determination of the Air-Entry Value (AEV) from the Degree of Saturation SWCC, (S-
SWCC)
The SWCC for a soil is defined as the relationship between the water content and soil suction
(Williams 1982), and is commonly used as the basis for the estimation of unsaturated soil
properties (e.g., the permeability function for an unsaturated soil). Different designations for the
amount of water in the soil generate different forms of SWCC, such as gravimetric water content
SWCC, volumetric water content SWCC, instantaneous volumetric water content SWCC, and
degree of saturation SWCC. The volumetric water content is the water content with the volume
of water referenced to the original total volume of the soil specimen. The instantaneous
volumetric water content is the water content with the volume of water referenced to the
instantaneous total volume of the soil specimen. Each form of the SWCC provides similar
information to the geotechnical engineer if the soil does not undergo volume change as soil
suction is increased. When soil undergoes volume change, as is the case for soft clays and
slurry soils, the gravimetric water content SWCC, instantaneous volumetric water content
SWCC and degree of saturation SWCC are distinctly different from one another. Volumetric
water content SWCC is not of significance when soil undergoes high volume change.
Conventional permeability functions (e.g., Fredlund et al. (1994) equation; van Genuchten-
Burdine equation; van Genuchten-Mualem equation) produce reasonable estimations using
Page 5 of 38
https://mc06.manuscriptcentral.com/cgj-pubs
Canadian Geotechnical Journal
Draft
6
volumetric water content SWCC when there is no volume change during drying. Volumetric
water content SWCC is no longer appropriate in the estimation of the relative permeability
function when soil undergoes volume change. It is important to know that the relative coefficient
of permeability function, as well as the air-entry value must be estimated from degree of
saturation SWCC (Fredlund et al. 2011). This paper uses the degree of saturation SWCC to
calculate the appropriate estimation of the relative permeability function.
Various forms of mathematical equations have been suggested to characterize the SWCC. The
equation proposed by Fredlund and Xing (1994) has been shown to have sufficient flexibility to
best-fit laboratory data reasonably well over the entire soil suction range from near zero to 106
kPa provided the material behaves in a mono-modal manner. The form of the Fredlund and
Xing (1994) equation written in terms of degree of saturation, (i.e., S-SWCC) is shown in
equation (1).
( )( ) ( )( )
( ) ( )( )( )6
0 1 ln 1 ln 1 10
ln exp 1f
f
r r
mn
f
SS
a
ψ ψ ψψ
ψ
− + +=
+ (1)
where,
ψ = soil suction;
( )S ψ = degree of saturation at a soil suction of ψ ;
0S = initial degree of saturation at zero soil suction; and
, , ,f f f ra n m ψ = four best-fitting parameters controlling the shape of the SWCC.
The shape of the SWCC (e.g., described by the air-entry value, the slope, the residual
conditions) are influenced by the four fitting parameters, (i.e., af, nf, mf and ψf) in a combined
Page 6 of 38
https://mc06.manuscriptcentral.com/cgj-pubs
Canadian Geotechnical Journal

Draft
7
and complex manner. There is no simple one-on-one connection between the fitting parameters
and the features of the curve, although af affects the air-entry value in a significant way, while nf
significantly influences the slope of SWCC. Bharat and Sharma, (2012) studied the validity limits
of of the Fredlund-Xing parameters and found that small values of ψr influenced the SWCC
near saturation and mf also influenced the residual portion of the SWCC. In other words, these
variables affect the shape of an SWCC in a coupled manner.
The air-entry value, (AEV), of the soil is the suction at which air begins to enter the largest pores
in the soil (Fredlund and Xing, 1994). Vanapalli et al., (1998) proposed an empirical, graphical
construction technique to estimate the air-entry value from the SWCC. The air-entry value must
be determined from the degree of saturation SWCC (Fredlund et al. 2011).
A mathematical algorithm is proposed in this paper for the determination of the AEV based on
the graphical construction suggested by Vanapalli et al. (1998). The following steps are outlined
with respect to the analysis for the AEV.
Step 1. Find the best-fitting SWCC for the degree of saturation SWCC using the Fredlund and
Xing (1994) equation (Figure 1).
Step 2. Through use of a variable substitution technique, the Fredlund-Xing (1994) best-fitting
equation can be transformed into a substitution equation (i.e., Eq. 2). The substitution equation
describes the relationship between the degree of saturation and the logarithm of soil suction to
the base 10 (Figure 2). The shape of the curve for the substitution equation plotted using
arithmetic coordinates is the same as the shape of the curve for the best-fitting equation plotted
Page 7 of 38
https://mc06.manuscriptcentral.com/cgj-pubs
Canadian Geotechnical Journal

Draft
8
using a semi-logarithmic coordinate system. The arithmetic plot of the substitution equation has
the same inflection point as the semi-logarithmic plot of the best-fitting equation.
( )( ) ( )( )
( ) ( )( )( )6
0 1 ln 1 10 ln 1 10
ln exp 1 10f
f
r r
mn
f
SSS
a
ξ
ξ
ψ ψξ
− + +=
+ (2)
where,
( )10logξ ψ= ; ( )SS ξ = the degree of saturation at a soil suction of ψ ;
ψ = soil suction.
Step 3. Determine the point of maximum slope (or the inflection point) on the arithmetic plot of
the substitution equation. The point of maximum slope is also a point of zero curvature.
Therefore, the second derivative of equation (2) can be set equal to zero as shown in equation
(3).
( )2
2
d0
d
SS ξξ
= (3)
Solving equation (3) for the ξ value of zero curvature point and substituting the ξ value into
equation (2) yields the corresponding term, ( )SS ξ . The determined point of zero curvature has
coordinates ( iξ , ( )iSS ξ ) (Figure 2).
Step 4. Draw a line tangent to the curve through the point of maximum slope (Figure 2). The
point of maximum slope is ( iξ , ( )iSS ξ ) and the maximum slope is ( )'
iSS ξ . The equation for the
tangent line is as shown in equation (4).
( ) ( )( ) ( )'
i i iTL SS SSξ ξ ξ ξ ξ= − + (4)
Where, TL(ξ) represents the function of the tangent line.
Page 8 of 38
https://mc06.manuscriptcentral.com/cgj-pubs
Canadian Geotechnical Journal

Draft
9
Step 5. Draw a horizontal line through the maximum degree of saturation. The intersection of
the two lines indicates the air-entry value (Figure 2). The horizontal line is given by equation (5).
( ) 0HL Sξ = (5)
Where, HL(ξ) represents the function of the horizontal line.
The intersection point can be obtained mathematically by solving equations (5) and (4). The
intersection point is, ( )
( )0
0',
i
i
i
S SSS
SS
ξξ
ξ
−+
, on the arithmetic plot.
Step 6. Back calculate the AEV through use of the relationship, ( )10logξ ψ= . The air-entry
value for the soil can be written as follows.
( )( )
0
'
10
ii
i
S SS
SS
AEV
ξξ
ξψ−
+
= (6)
Statement of the Integration Problem Associated with the Fredlund, Xing and Huang
(1994) Permeability Function
Fredlund, Xing and Huang (1994) suggested a mathematical function for the estimation of the
relative coefficient of permeability based on a physical model proposed by Childs and Collis-
George (1950) (see equation (7)).
(7)
Where,
krs(ψ) = relative coefficient of permeability at soil suction of ψ. The superscript s means that the
degree of saturation-SWCC is used for the estimation of the relative permeability in Equation (7);
( )
( ) ( ) ( )( )
( ) ( ) ( )( )
ln
ln
'
'
aev
yb
y
y
S
r ybaev y
y
S e SS e dy
ek
S e SS e dy
e
ψ
ψ
ψ
ψψ
−
=−
∫
∫
Page 9 of 38
https://mc06.manuscriptcentral.com/cgj-pubs
Canadian Geotechnical Journal

Draft
10
b = upper limit of integration [i.e., ln(1000000)];
y = dummy variable of integration representing the logarithm of suction;
S = degree of saturation-SWCC equation;
S’ = derivative of the degree of saturation-SWCC equation;
ey = natural number raised to the dummy variable power.
The denominator of equation (7) is an integral, the lower limit of the integration of which is the
air-entry value, ψaev. Although the original theory (Fredlund et al, 1994) specified the air-entry
value, ψaev, as the lower limit of integration, other values between a value close to zero and ψaev
have been used as the starting point for integration while estimating the relative permeability
function. The arbitrarily selected small value for the starting point of integration appears to have
been used because no closed-form analytical procedure had been proposed for the calculation
of the AEV. Details on how the integration using Fredlund et al (1994) permeability is to be
carried out can be found in the original paper. In addition, the importance of using the degree of
saturation SWCC for calculating the permeability function has not been clearly emphasized in
the research literature.
If a suction value ψi between (near) zero and ψaev is used as the lower limit of integration, the
permeability function of equation (7) takes on the form shown in equation (8)
( )
( ) ( ) ( )( )
( ) ( ) ( )( )
ln
ln
'
'
i
yb
y
y
S
ri ybi y
y
S e SS e dy
ek
S e SS e dy
e
ψ
ψ
ψ
ψψ
−
=−
∫
∫ (8)
where, kris(ψ) = relative coefficient of permeability at soil suction of ψ, when a suction value ψi is
used as the lower limit of integration for the integral in the denominator of the Equation (8).
Page 10 of 38
https://mc06.manuscriptcentral.com/cgj-pubs
Canadian Geotechnical Journal
Draft
11
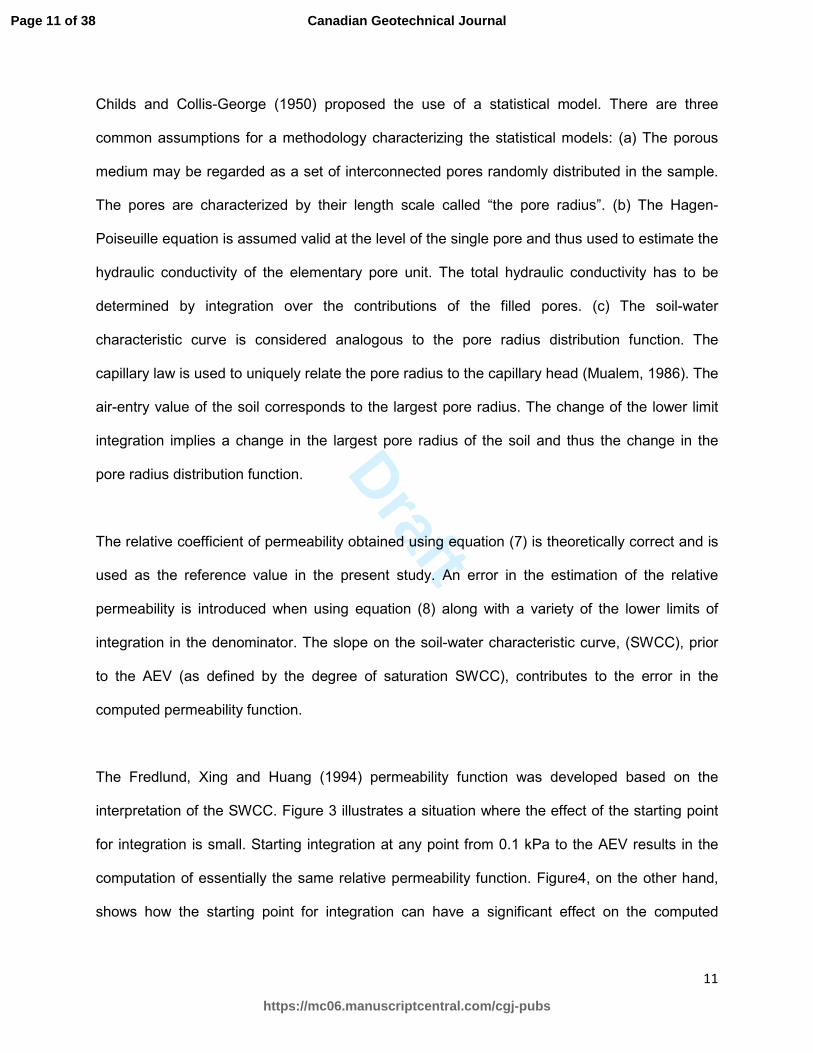
Childs and Collis-George (1950) proposed the use of a statistical model. There are three
common assumptions for a methodology characterizing the statistical models: (a) The porous
medium may be regarded as a set of interconnected pores randomly distributed in the sample.
The pores are characterized by their length scale called “the pore radius”. (b) The Hagen-
Poiseuille equation is assumed valid at the level of the single pore and thus used to estimate the
hydraulic conductivity of the elementary pore unit. The total hydraulic conductivity has to be
determined by integration over the contributions of the filled pores. (c) The soil-water
characteristic curve is considered analogous to the pore radius distribution function. The
capillary law is used to uniquely relate the pore radius to the capillary head (Mualem, 1986). The
air-entry value of the soil corresponds to the largest pore radius. The change of the lower limit
integration implies a change in the largest pore radius of the soil and thus the change in the
pore radius distribution function.
The relative coefficient of permeability obtained using equation (7) is theoretically correct and is
used as the reference value in the present study. An error in the estimation of the relative
permeability is introduced when using equation (8) along with a variety of the lower limits of
integration in the denominator. The slope on the soil-water characteristic curve, (SWCC), prior
to the AEV (as defined by the degree of saturation SWCC), contributes to the error in the
computed permeability function.
The Fredlund, Xing and Huang (1994) permeability function was developed based on the
interpretation of the SWCC. Figure 3 illustrates a situation where the effect of the starting point
for integration is small. Starting integration at any point from 0.1 kPa to the AEV results in the
computation of essentially the same relative permeability function. Figure4, on the other hand,
shows how the starting point for integration can have a significant effect on the computed
Page 11 of 38
https://mc06.manuscriptcentral.com/cgj-pubs
Canadian Geotechnical Journal

Draft
12
permeability function. The difference between the results shown in Figures 3 and 4 appears to
be mainly due to a change in the nf (or steepness of the SWCC) variable.
The shape of the SWCC greatly influences the errors that could be caused in the estimation
results for the permeability function. Therefore, it is important to study the effect of each of the
four fitting parameters af, n
f, m
f,ψ
r on the errors in the permeability function that is introduced
by using a small value as the lower limit of integration. The objective of this paper is to examine
the effect of each of the fitting variables, af, n
f, m
f,ψ
r on errors in the relative permeability
function that is caused by using various small values for the lower limit of integration.
Definition of the Error Introduced by Using an Inappropriate Lower Limit of Integration
( , )iERR ψ ψ is the mathematical function used to quantify the error introduced as a result of
selecting various values for the lower limit of integration. More specifically, it is the change in
permeability introduced by using equation (8) with a lower limit of integration other than the air-
entry value, (AEV), in the denominator. The comparison is made to the permeability obtained
when using equation (7) with the AEV as the lower limit of integration in the integral of
denominator. The mathematical form of the error ( , )iERR ψ ψ is given by equation (9).
Page 12 of 38
https://mc06.manuscriptcentral.com/cgj-pubs
Canadian Geotechnical Journal

Draft
13
( )
( ) ( ) ( )( )
( ) ( ) ( )( )
( ) ( ) ( )( )
( ) ( ) ( )( )
ln
10
ln
ln
10
ln
0 , 0
'
, Log , 0
'
'
Log , 0
'
i
i
aev
i aev
ybi y
y
i i aevyb
y
y
ybi y
y
i aevybaev y
y
S e SS e dy
eERR
S e SS e d y
e
S e SS e dy
e
S e SS e dy
e
ψ
ψ
ψ
ψ
ψ ψ ψ
ψ
ψ ψ ψ ψ ψψ
ψ
ψ ψ ψψ
< < < −
= < ≤ ≤ −
− < < < −
∫
∫
∫
∫
(9)
The error is defined in terms of orders of magnitude. ( , )iERR ψ ψ in equation (9) is the common
logarithm of the ratio of the permeability at any soil suction, ψ, estimated by equation (7) to the
permeability estimated by equation (8) with ψi set at various lower limits of integration in the
denominator. The lower limit of integration ψi in equation (8) is a suction value between the AEV
and a lower suction. The definition of ( , )iERR ψ ψ implies that the closer the value, ( , )iERR ψ ψ
is to 0, the smaller the error. The error ( , )iERR ψ ψ remains at a constant value equal to
( , )iERR AEV ψ for soil suctions greater than the AEV. ( , )iERR AEV ψ
is the upper bound of
the error ( , )iERR ψ ψ and it represents the largest error across the entire soil suction range
when using various ψi values as the lower limit of integration rather than the AEV in equation (8)
when calculating the relative permeability. The error at the AEV, ( , )iERR AEV ψ rather than the
error, ( , )iERR ψ ψ , across the entire suction range is studied in a parametric manner. Figure 5
illustrates the meaning of the error at the AEV, ( , )iERR AEV ψ in terms of orders of magnitude
caused by using ψi as the lower limit of integration in equation (8).
Page 13 of 38
https://mc06.manuscriptcentral.com/cgj-pubs
Canadian Geotechnical Journal

Draft
14
The sensitivity of ( , )iERR AEV ψ to changes in the best-fitting parameters, “af, nf, mf, ψr”
for the SWCC
A parametric study was undertaken to investigate the empirical relationships between the best-
fitting parameters “af, nf, mf, ψr” of the SWCC and the error of ( , )iERR ψ ψ , associated with the
Fredlund et al. (1994) permeability function. The error at the AEV, ( , )iERR AEV ψ rather than
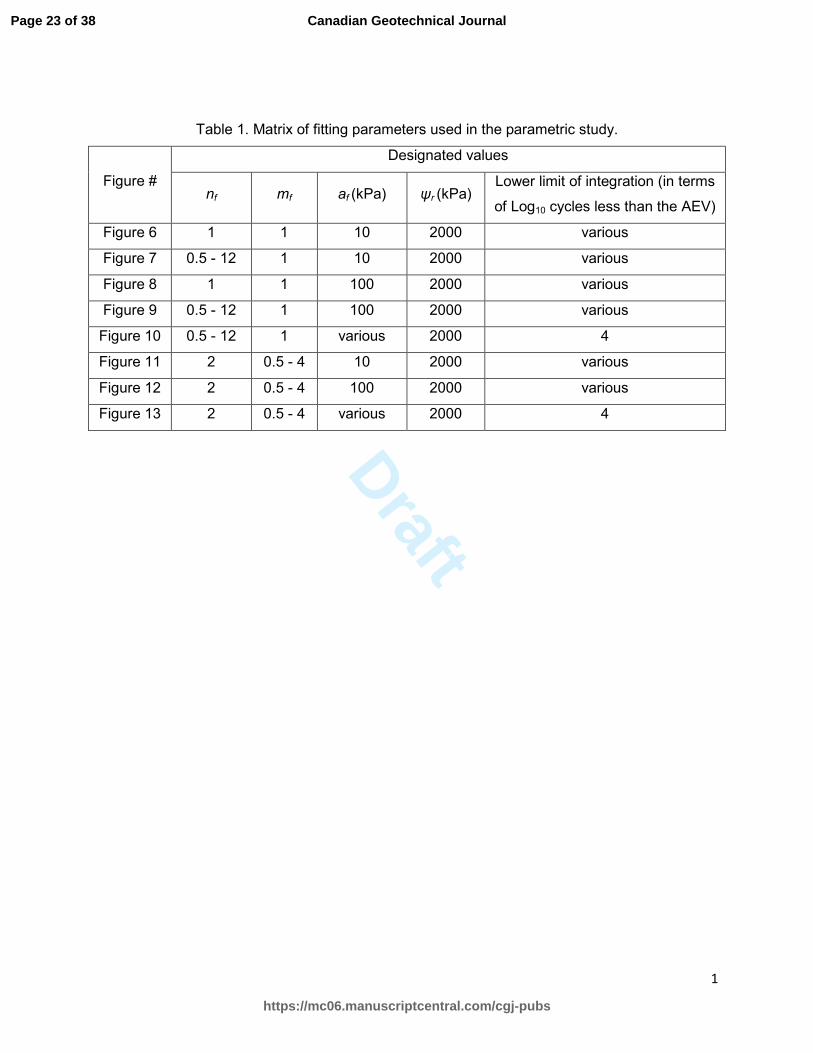
the error, ( , )iERR ψ ψ , across the entire suction range is studied for simplification. Table 1
summarizes the parametric study in matrix form.
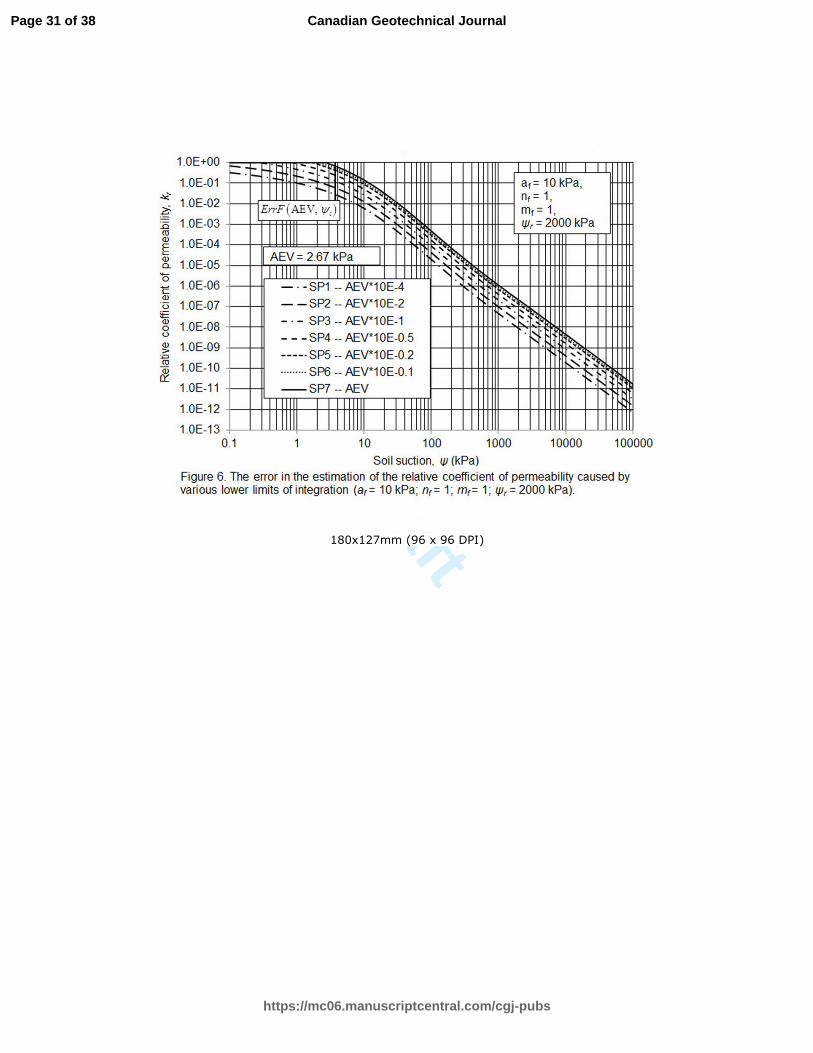
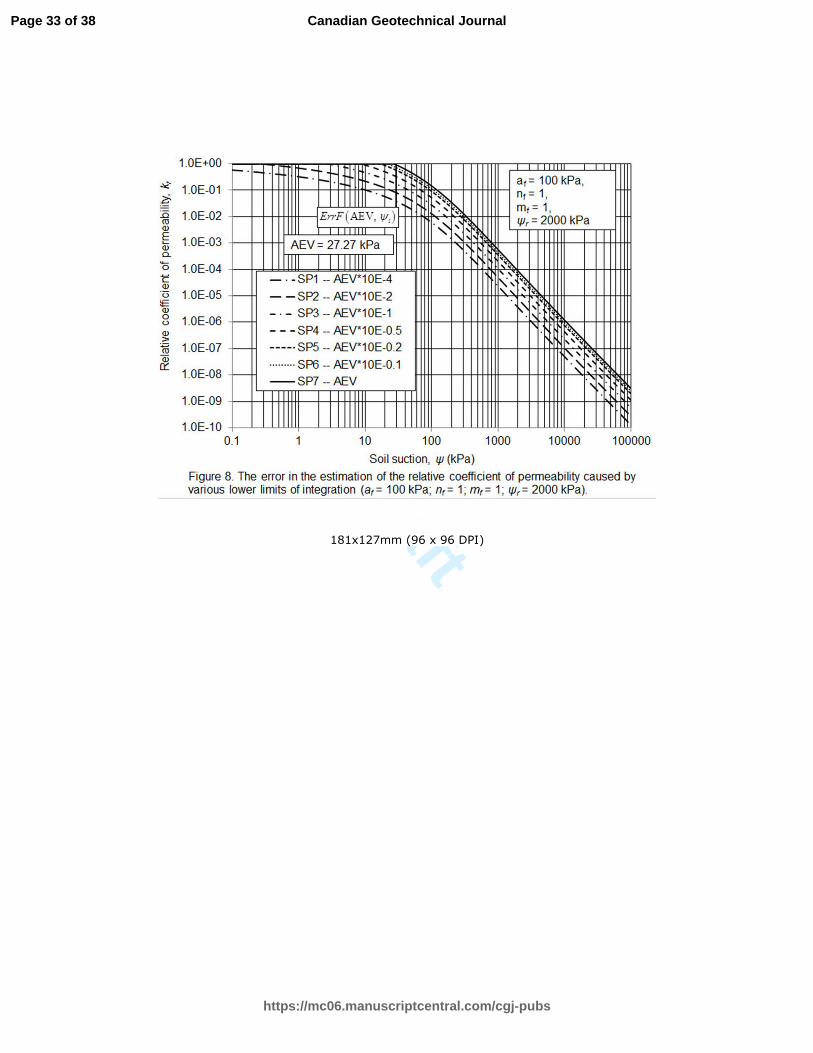
The influence of the nf value on ( , )iERR AEV ψ
The sensitivity of the error in the permeability function at the AEV to the change of the nf value
on the SWCC is studied for permeability functions obtained using equation (8). Seven different
lower limits of integration ψi were selected for the integral in the denominator. These seven
different lower limits of integration are 10, 4, 2, 1, 0.5, 0.2 and 0.1 Log10 cycles less than the
empirical AEV. Figure 6 and Figure 8 show the errors in the estimation of the relative coefficient
of permeability caused by using various lower limits of integration when af = 10 kPa and af = 100
kPa, respectively (Note: nf = 1; mf = 1; ψr = 2000 kPa).
The empirical relationships between ( , )iERR AEV ψ and the corresponding nf value for various
ψi are plotted in Figure 7 and Figure 9. A value of 1 on the vertical coordinate refers to one
order of magnitude change in the coefficient of permeability at the AEV, and a value of 4 would
mean 4 orders of magnitude. Figure 7 reveals the influence of nf on the errors when af = 10 kPa;
mf = 1; ψr = 2000 kPa. Figure 9 shows the influence of nf on the errors when af = 100 kPa; mf =
1; ψr = 2000 kPa. In Figures 6 to 9, the curve denoted by SP1 in the legend is related to the
Page 14 of 38
https://mc06.manuscriptcentral.com/cgj-pubs
Canadian Geotechnical Journal

Draft
15
error caused by using a value 4 Log10 cycles less than the empirical AEV as the lower limit of
integration. The curve denoted by SP2 in the legend is for the error caused by using a lower
limit of integration that is 2 Log10 cycles less than the empirical AEV. The other notations (e.g.,
SP3, SP4, SP5 and SP6) can be interpreted in the same way as interpreted for SP1 and SP2.
Figures 7 and 8 show a similar pattern when different af values are selected. The results show
the errors in the estimation of the relative permeability at the AEV when using equation (8) with
different lower limits of integration ψi instead of using equation (7) with the AEV as the starting
integration point. The results in Figures 7 and Figure 8 reveal that the error decreases with an
increase in the nf value, particularly when the nf value is smaller than 2. The slope of the change
of the error versus the nf value becomes much steeper at small nf values. This is particularly
true for errors caused by using a lower limit of integration which is beyond 2 Log10 cycles less
than the AEV. The results also show that using a value of more Log10 cycles separated from the
AEV as the lower limit of integration produces a greater error in the estimated permeability
function for a particular SWCC. This phenomenon is more apparent when the nf value is smaller
than 2. In this case, the estimated relative permeability is significantly influenced by the selected
lower limit of integration for a particular SWCC. It is important to use the correct lower limit of
integration (i.e., the computed AEV), in the estimation of the permeability function
Figures 10 present errors caused by using a lower limit of integration of 4 Log10 cycles less than
the AEV for permeability functions obtained from SWCCs with various af values. The purpose of
arranging the results in this manner is to shows how the af value affects the error in the
estimation of the permeability function when an inappropriate lower limit of integration is used.
The starting point for integration is denoted in terms of the Log10 cycles less than the AEV. It
was found that the af value does not have much influence on the error caused by using the
inappropriate lower limit of integration. However, the error is more sensitive to the af value when
Page 15 of 38
https://mc06.manuscriptcentral.com/cgj-pubs
Canadian Geotechnical Journal
Draft
16
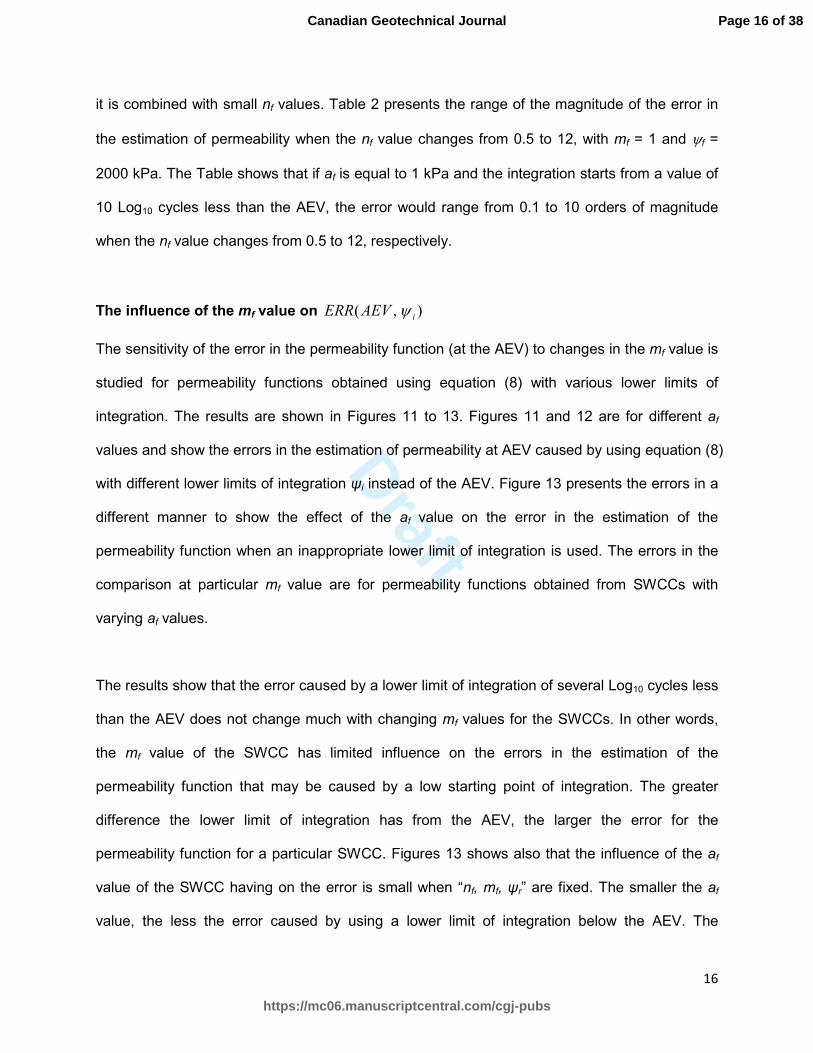
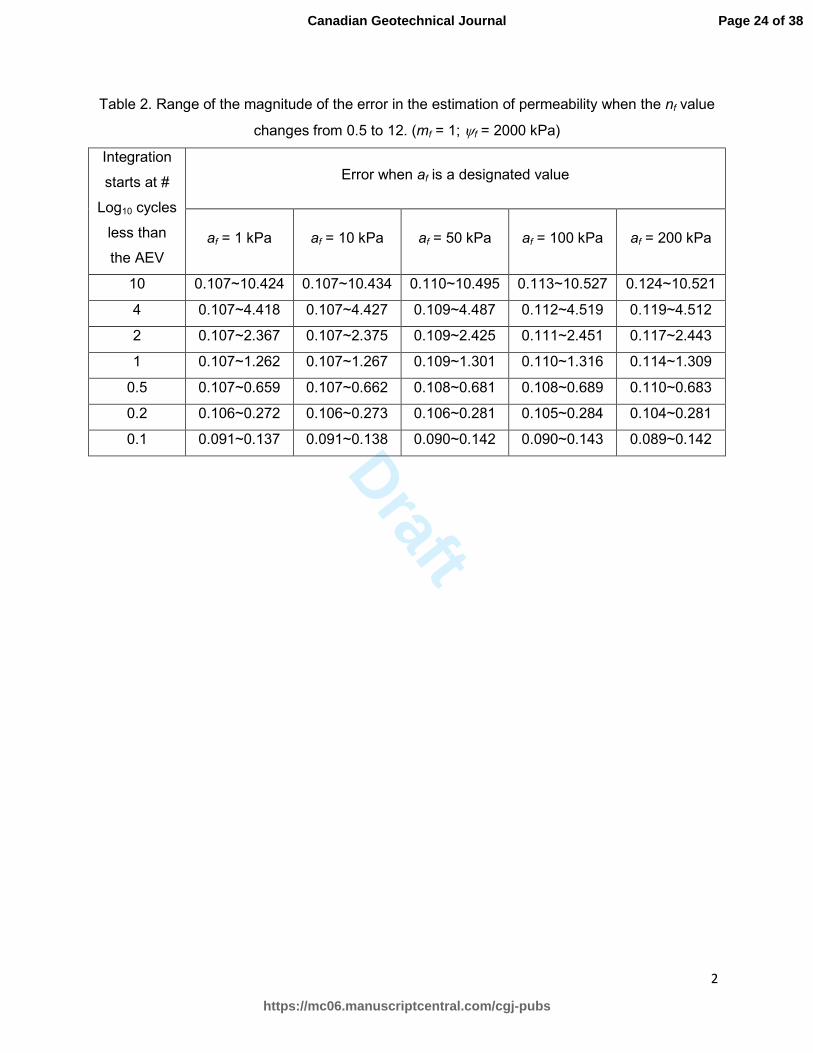
it is combined with small nf values. Table 2 presents the range of the magnitude of the error in
the estimation of permeability when the nf value changes from 0.5 to 12, with mf = 1 and ψf =
2000 kPa. The Table shows that if af is equal to 1 kPa and the integration starts from a value of
10 Log10 cycles less than the AEV, the error would range from 0.1 to 10 orders of magnitude
when the nf value changes from 0.5 to 12, respectively.
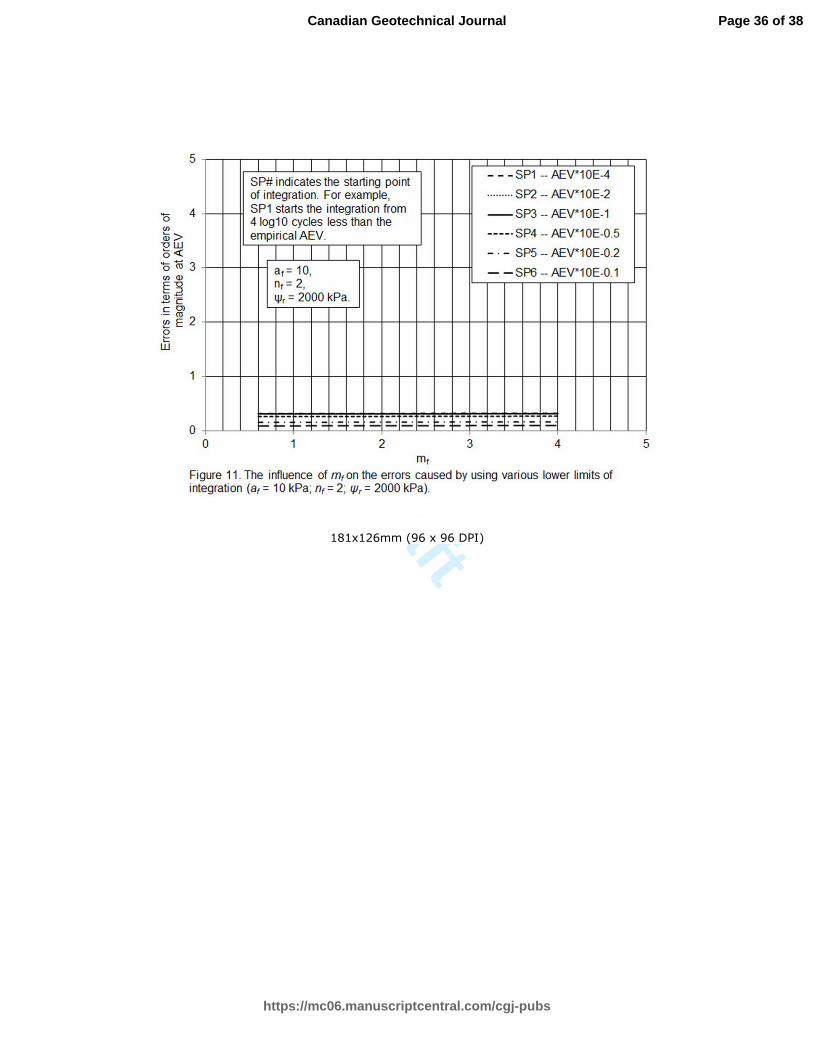
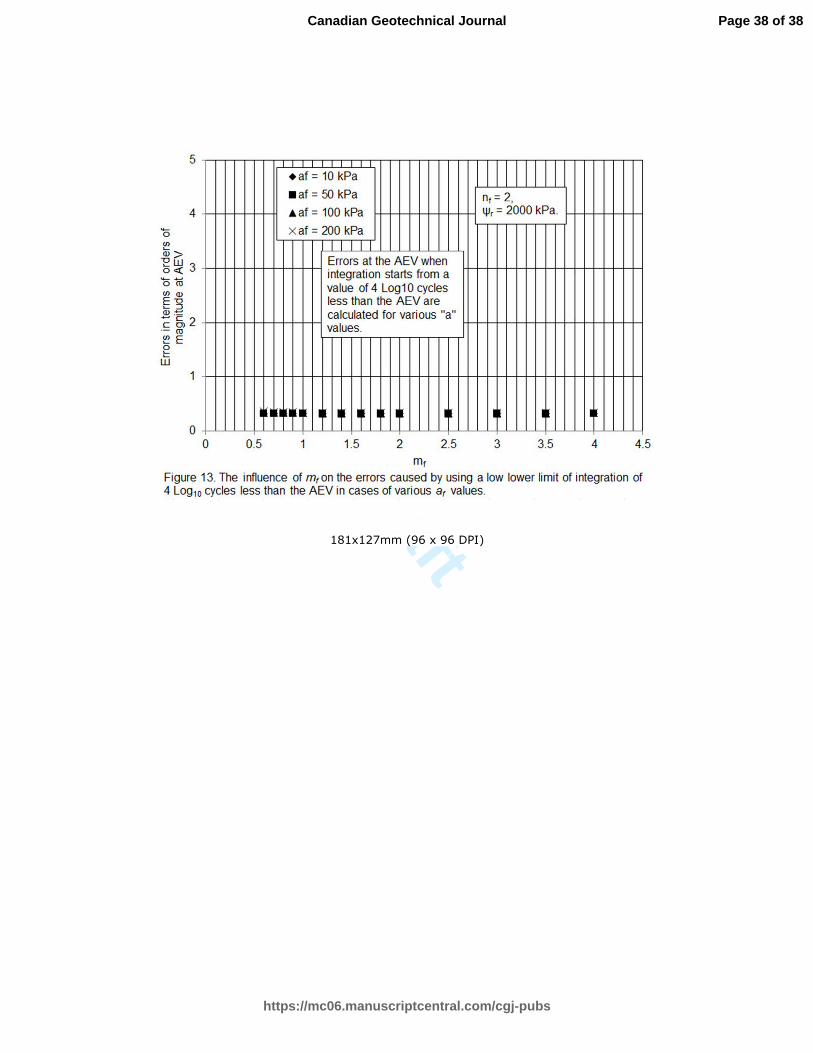
The influence of the mf value on ( , )iERR AEV ψ
The sensitivity of the error in the permeability function (at the AEV) to changes in the mf value is
studied for permeability functions obtained using equation (8) with various lower limits of
integration. The results are shown in Figures 11 to 13. Figures 11 and 12 are for different af
values and show the errors in the estimation of permeability at AEV caused by using equation (8)
with different lower limits of integration ψi instead of the AEV. Figure 13 presents the errors in a
different manner to show the effect of the af value on the error in the estimation of the
permeability function when an inappropriate lower limit of integration is used. The errors in the
comparison at particular mf value are for permeability functions obtained from SWCCs with
varying af values.
The results show that the error caused by a lower limit of integration of several Log10 cycles less
than the AEV does not change much with changing mf values for the SWCCs. In other words,
the mf value of the SWCC has limited influence on the errors in the estimation of the
permeability function that may be caused by a low starting point of integration. The greater
difference the lower limit of integration has from the AEV, the larger the error for the
permeability function for a particular SWCC. Figures 13 shows also that the influence of the af
value of the SWCC having on the error is small when “nf, mf, ψr” are fixed. The smaller the af
value, the less the error caused by using a lower limit of integration below the AEV. The
Page 16 of 38
https://mc06.manuscriptcentral.com/cgj-pubs
Canadian Geotechnical Journal
Draft
17
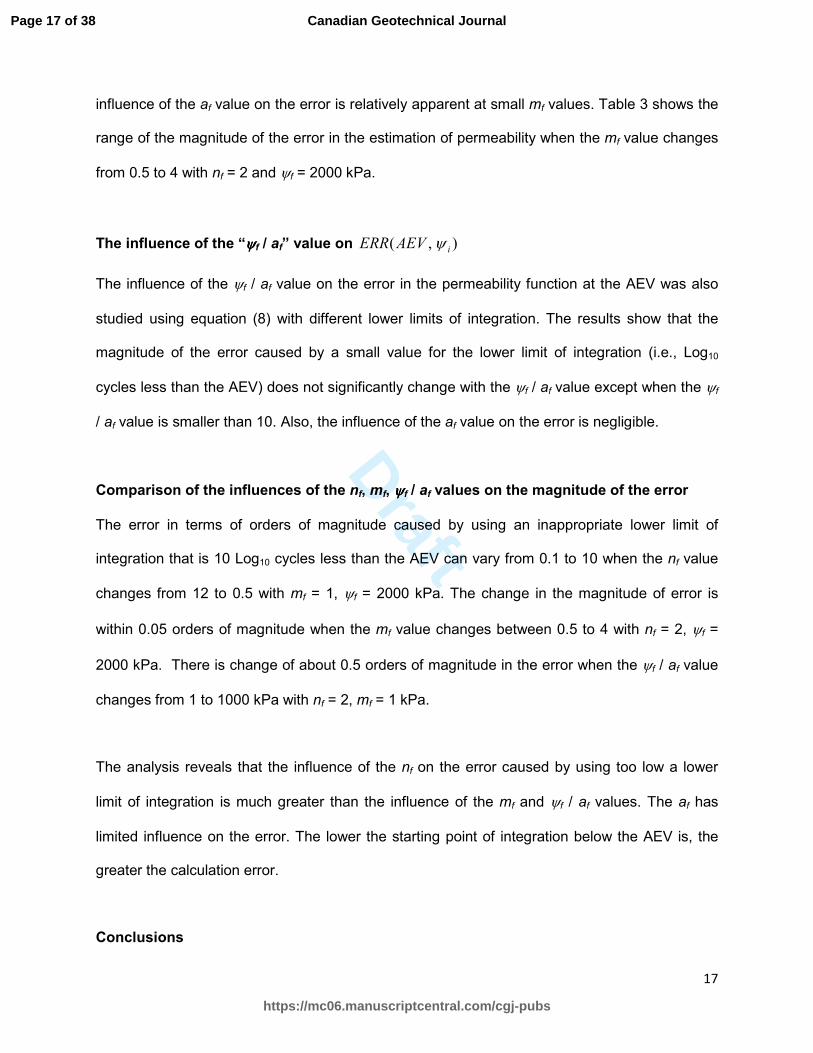
influence of the af value on the error is relatively apparent at small mf values. Table 3 shows the
range of the magnitude of the error in the estimation of permeability when the mf value changes
from 0.5 to 4 with nf = 2 and ψf = 2000 kPa.
The influence of the “ψψψψf / af” value on ( , )iERR AEV ψ
The influence of the ψf / af value on the error in the permeability function at the AEV was also
studied using equation (8) with different lower limits of integration. The results show that the
magnitude of the error caused by a small value for the lower limit of integration (i.e., Log10
cycles less than the AEV) does not significantly change with the ψf / af value except when the ψf
/ af value is smaller than 10. Also, the influence of the af value on the error is negligible.
Comparison of the influences of the nf, mf, ψψψψf / af values on the magnitude of the error
The error in terms of orders of magnitude caused by using an inappropriate lower limit of
integration that is 10 Log10 cycles less than the AEV can vary from 0.1 to 10 when the nf value
changes from 12 to 0.5 with mf = 1, ψf = 2000 kPa. The change in the magnitude of error is
within 0.05 orders of magnitude when the mf value changes between 0.5 to 4 with nf = 2, ψf =
2000 kPa. There is change of about 0.5 orders of magnitude in the error when the ψf / af value
changes from 1 to 1000 kPa with nf = 2, mf = 1 kPa.
The analysis reveals that the influence of the nf on the error caused by using too low a lower
limit of integration is much greater than the influence of the mf and ψf / af values. The af has
limited influence on the error. The lower the starting point of integration below the AEV is, the
greater the calculation error.
Conclusions
Page 17 of 38
https://mc06.manuscriptcentral.com/cgj-pubs
Canadian Geotechnical Journal

Draft
18
Following is a summary of the conclusions that can be drawn from the study related to the
starting point of integration for the Fredlund et al., (1994) permeability function.
I. If a lower limit of integration used in the integral of Fredlund et al (1994) is smaller than
the AEV, the computed results will under-estimate the relative coefficient of permeability.
The smaller the value used for the starting point of integration compared to the AEV, the
greater will be the difference between the computed results and the relative permeability.
II. The error caused by using a small value for the lower limit of integration is influenced by
the fitting parameters of the Fredlund-Xing (1994) SWCC equation, namely af, nf, mf, ψr.
The analysis reveals that the influence of the nf value is much greater than the influence
of af, mf and ψf / af values.
III. The difference caused by a particular lower limit of integration, defined in terms of a
particular number of Log10 cycles less than the AEV, decreases with an increase in the nf
value when the values of af, mf, ψr are fixed. This is particularly true when the nf value is
smaller than 2.
IV. The mf value for the SWCC has limited influence on the difference in the estimation of
the permeability function that may be caused by a low starting point of integration.
V. The difference in the estimation of the relative coefficient of permeability caused by
using a particular low starting point of integration usually does not change much with the
change in the af value. However, the difference becomes more sensitive to the af value
when it is combined with a small nf values and small mf values.
Page 18 of 38
https://mc06.manuscriptcentral.com/cgj-pubs
Canadian Geotechnical Journal

Draft
19
VI. It is recommended that the AEV always be used as the lower limit of integration when
estimating the relative permeability function with the Fredlund et al., (1994) estimation
procedure.
VII. Further studies regarding the importance of AEV in the estimation of the relative
permeability function are recommended to be undertaken where other physical models
are used along with other SWCCs.
List of References
Bharat, T. V., and Sharma, J. 2012. “Validity limits of Fredlund-Xing-Kunze model for the
estimation of hydraulic properties of unsaturated soils”, Proceddings of Canadian
Geotechnical Conference, Winnipeg, Manitoba, September 30th to October 3rd., paper
#263.
Brooks, R. H., and Corey, A. T. 1964. "Hydraulic properties of porous media". Colorado State
University, (March) Hydraulic Paper No. 3, 27 p.
Burdine, N. 1952. "Relative permeability calculations from pore size distribution data".
Transactions of the AIME, Vol. 198, pp. 71-77.
Childs, E. C., and Collis-George, N. 1950. “The permeability of porous materials”. Proceedings
of the Royal Society of London. Series A. Mathematical and Physical
Sciences, 201(1066), pp. 392-405.
Mualem, Y., and Klute, A. 1986. “Hydraulic conductivity of unsaturated soils: prediction and
formulas.” Methods of Soils Analysis. Part 1. Physical and Mineralogical Methods, 799-
823.
Fredlund, D. G., and Xing, A. 1994. "Equations for the soil-water characteristic curve". Canadian
Geotechnical Journal, 31(4), 521-532.
Page 19 of 38
https://mc06.manuscriptcentral.com/cgj-pubs
Canadian Geotechnical Journal

Draft
2
Fredlund, D. G., Xing, A., and Huang, S. 1994. "Predicting the permeability function for
unsaturated soils using the soil-water characteristic curve". Canadian Geotechnical
Journal, 31(4), 533-546.
Fredlund, D. G., Stone, J., Stianson, J., and Sedgwick, A. 2011. "Determination of water storage
and permeability functions for oil sands tailings". Proceedings of the Tailings and Mine
Waste Conference, Vancouver, B.C..
Fredlund, D. G., Rahardjo, H., and Fredlund, M. D. 2012. “Unsaturated soil mechanics in
engineering practice”. John Wiley & Sons, New York, N.Y., 926 p.
Mualem, Y. 1976. "A new model for predicting the hydraulic conductivity of unsaturated porous
media". Water Resources Research, 12(3), 513-522.
Van Genuchten, M. T. 1980. "A closed-form equation for predicting the hydraulic conductivity of
unsaturated soils." Soil Science Society America Journal, 44(5), 892-898.
Vanapalli, S.K., Sillers, W.S., and Fredlund, M.D. 1998. “The meaning and relevance of residual
state to unsaturated soils”, Proceedings of the Fifty-First Canadian Geotechnical
Conference, Edmonton, AB, October 4-7, pp.1-8.
Williams, P.J. 1982. “The surface of the Earth, an introduction to geotechnical science”.
Longman Inc., New York.
Page 20 of 38
https://mc06.manuscriptcentral.com/cgj-pubs
Canadian Geotechnical Journal

Draft
3
LIST OF FIGURES
Figure 1. S-SWCC for a hypothetical soil plotted using semi-logarithmic coordinate
Figure 2. The arithmetical plot of the substitution equation
Figure 3. Relative coefficient of permeability obtained using equation (8) with different lower
limits of integration for a soil with af = 500 kPa, nf = 4, mf = 1, ψr = 10,000 kPa for SWCC
Figure 4. Relative coefficient of permeability obtained using equation (8) with different lower
limits of integration for a soil with af = 500 kPa, nf = 1, mf = 1, ψr = 10000 kPa for SWCC
Figure 5. Error at AEV in terms of orders of magnitude caused by using ψi equal to 1 kPa as the
lower limit of integration in equation (8)
Figure 6. The error in the estimation of the relative coefficient of permeability caused by various
lower limits of integration (af = 10 kPa; nf = 1; mf = 1; ψr = 2000 kPa)
Figure 7. The influence of nf on the errors caused by using various lower limits of integration
Figure 8. The error in the estimation of the relative coefficient of permeability caused by various
lower limits of integration (af = 100 kPa; nf = 1; mf = 1; ψr = 2000 kPa)
Figure 9. The influence of nf on the errors caused by using various lower limits of integration (af
= 100 kPa; mf = 1; ψr = 2000 kPa)
Figure 10. The influence of nf on the errors caused by using a low lower limit of integration of 4
Log10 cycles less than the AEV in cases of various af values
Figure 11. The influence of mf on the errors caused by using various lower limits of integration
(af = 10 kPa; nf = 2; ψr = 2000 kPa)
Figure 12. The influence of mf on the errors caused by using various lower limits of integration
(af = 100 kPa; nf = 2; ψr = 2000 kPa)
Figure 13. The influence of mf on the errors caused by using a low lower limit of integration of 4
Log10 cycles less than the AEV in cases of various af values
Page 21 of 38
https://mc06.manuscriptcentral.com/cgj-pubs
Canadian Geotechnical Journal

Draft
I
LIST OF TABLES
Table 1. Matrix of fitting parameters used in the parametric study
Table 2. Range of the magnitude of the error in the estimation of permeability when the nf value
changes from 0.5 to 12. (mf = 1; ψf = 2000 kPa)
Table 3. Range of the magnitude of the error in the estimation of permeability when the mf value
changes from 0.5 to 4. (nf = 2; ψf = 2000 kPa)
Page 22 of 38
https://mc06.manuscriptcentral.com/cgj-pubs
Canadian Geotechnical Journal
Draft
1
Table 1. Matrix of fitting parameters used in the parametric study.
Figure #
Designated values
nf mf af (kPa) ψr (kPa) Lower limit of integration (in terms
of Log10 cycles less than the AEV)
Figure 6 1 1 10 2000 various
Figure 7 0.5 - 12 1 10 2000 various
Figure 8 1 1 100 2000 various
Figure 9 0.5 - 12 1 100 2000 various
Figure 10 0.5 - 12 1 various 2000 4
Figure 11 2 0.5 - 4 10 2000 various
Figure 12 2 0.5 - 4 100 2000 various
Figure 13 2 0.5 - 4 various 2000 4
Page 23 of 38
https://mc06.manuscriptcentral.com/cgj-pubs
Canadian Geotechnical Journal
Draft
2
Table 2. Range of the magnitude of the error in the estimation of permeability when the nf value
changes from 0.5 to 12. (mf = 1; ψf = 2000 kPa)
Integration
starts at #
Log10 cycles
less than
the AEV
Error when af is a designated value
af = 1 kPa af = 10 kPa af = 50 kPa af = 100 kPa af = 200 kPa
10 0.107~10.424 0.107~10.434 0.110~10.495 0.113~10.527 0.124~10.521
4 0.107~4.418 0.107~4.427 0.109~4.487 0.112~4.519 0.119~4.512
2 0.107~2.367 0.107~2.375 0.109~2.425 0.111~2.451 0.117~2.443
1 0.107~1.262 0.107~1.267 0.109~1.301 0.110~1.316 0.114~1.309
0.5 0.107~0.659 0.107~0.662 0.108~0.681 0.108~0.689 0.110~0.683
0.2 0.106~0.272 0.106~0.273 0.106~0.281 0.105~0.284 0.104~0.281
0.1 0.091~0.137 0.091~0.138 0.090~0.142 0.090~0.143 0.089~0.142
Page 24 of 38
https://mc06.manuscriptcentral.com/cgj-pubs
Canadian Geotechnical Journal

Draft
3
Table 3. Range of the magnitude of the error in the estimation of permeability when the mf value
changes from 0.5 to 4. (nf = 2; ψf = 2000 kPa)
Integration starts at
# Log10 cycles less
than the AEV
Error when af is a designated value
af = 10 kPa af = 50 kPa af = 100 kPa af = 200 kPa
10 0.317~0.323 0.321~0.326 0.325~0.339 0.333~0.374
4 0.317~0.323 0.320~0.324 0.324~0.333 0.331~0.353
2 0.317~0.322 0.320~0.324 0.323~0.330 0.329~0.344
1 0.309~0.315 0.311~0.316 0.313~0.317 0.317~0.324
0.5 0.262~0.270 0.263~0.270 0.264~0.271 0.266~0.271
0.2 0.156~0.164 0.156~0.164 0.156~0.164 0.156~0.164
0.1 0.090~0.096 0.090~0.096 0.090~0.096 0.089~0.096
Page 25 of 38
https://mc06.manuscriptcentral.com/cgj-pubs
Canadian Geotechnical Journal

Draft
177x111mm (96 x 96 DPI)
Page 26 of 38
https://mc06.manuscriptcentral.com/cgj-pubs
Canadian Geotechnical Journal

Draft
182x126mm (96 x 96 DPI)
Page 27 of 38
https://mc06.manuscriptcentral.com/cgj-pubs
Canadian Geotechnical Journal

Draft
180x125mm (96 x 96 DPI)
Page 28 of 38
https://mc06.manuscriptcentral.com/cgj-pubs
Canadian Geotechnical Journal

Draft
181x126mm (96 x 96 DPI)
Page 29 of 38
https://mc06.manuscriptcentral.com/cgj-pubs
Canadian Geotechnical Journal

Draft
181x127mm (96 x 96 DPI)
Page 30 of 38
https://mc06.manuscriptcentral.com/cgj-pubs
Canadian Geotechnical Journal
Draft
180x127mm (96 x 96 DPI)
Page 31 of 38
https://mc06.manuscriptcentral.com/cgj-pubs
Canadian Geotechnical Journal

Draft
182x126mm (96 x 96 DPI)
Page 32 of 38
https://mc06.manuscriptcentral.com/cgj-pubs
Canadian Geotechnical Journal
Draft
181x127mm (96 x 96 DPI)
Page 33 of 38
https://mc06.manuscriptcentral.com/cgj-pubs
Canadian Geotechnical Journal

Draft
181x127mm (96 x 96 DPI)
Page 34 of 38
https://mc06.manuscriptcentral.com/cgj-pubs
Canadian Geotechnical Journal

Draft
182x126mm (96 x 96 DPI)
Page 35 of 38
https://mc06.manuscriptcentral.com/cgj-pubs
Canadian Geotechnical Journal
Draft
181x126mm (96 x 96 DPI)
Page 36 of 38
https://mc06.manuscriptcentral.com/cgj-pubs
Canadian Geotechnical Journal

Draft
181x126mm (96 x 96 DPI)
Page 37 of 38
https://mc06.manuscriptcentral.com/cgj-pubs
Canadian Geotechnical Journal
Draft
181x127mm (96 x 96 DPI)
Page 38 of 38
https://mc06.manuscriptcentral.com/cgj-pubs
Canadian Geotechnical Journal