ENVIRONMENTAL EFFECTS REPORT - EPA Tasmaniaepa.tas.gov.au/documents/fulton hogan pty ltd, east...
209
Prepared for Environment Protection Authority ENVIRONMENTAL EFFECTS REPORT Proposed Mobile Asphalt Plant A leased part of 195 Circular Road, East Ridgley, TAS August 2014
Transcript of ENVIRONMENTAL EFFECTS REPORT - EPA Tasmaniaepa.tas.gov.au/documents/fulton hogan pty ltd, east...

Prepared for Environment Protection Authority
ENVIRONMENTAL EFFECTS REPORT Proposed Mobile Asphalt Plant
A leased part of 195 Circular Road, East Ridgley, TAS
August 2014

Prepared by: EnviroRisk Management Pty Ltd ABN 24 069 947 904 PO Box 183 LARA VIC 3212 P: 03 5282 3773 F: 03 5282 4430 www.envirorisk.com.au QUALITY CONTROL Our Ref: FH_East Ridgley Asphalt Plant_EER_Final_260814 Version: Final Date: 26 August 2014

Environmental Effects Report – Fulton Hogan
3 |FH_East Ridgley Asphalt Plant_EER_Final_260814
TABLE OF CONTENTS
PART A – PROPONENT DETAILS .................................................................................................... 7
PART B – PROJECT DESCRIPTION .................................................................................................. 8
1.0 DESCRIPTION OF THE PROJECT ............................................................................................ 8
1.1 Interaction with BIS Industries Quarry Operation ......................................................... 8 1.2 Project Timeframe ......................................................................................................... 8 1.3 Resources ....................................................................................................................... 9 1.4 Asphalt Plant Products ................................................................................................... 9 1.5 Market ............................................................................................................................ 9 1.6 Production Schedule and Operating Hours ................................................................... 9 1.7 Asphalt Processing Techniques and Equipment .......................................................... 10 1.8 Infrastructure ............................................................................................................... 11 1.9 Workforce .................................................................................................................... 12 1.10 Traffic and Access ......................................................................................................... 12
2.0 PROJECT AREA ................................................................................................................... 13
2.1 Project Location ........................................................................................................... 13 2.2 Current and Historical Use of the Site ......................................................................... 17 2.3 Land Tenure of the Site ................................................................................................ 17 2.4 Surrounding Land uses and Nearest Sensitive Receptors ........................................... 18 2.5 Geology ........................................................................................................................ 18
3.0 MAP AND SITE PLAN .......................................................................................................... 22
3.1 General Location Plan .................................................................................................. 22 3.2 Site Plan ........................................................................................................................ 22 3.3 Land on which activity will take place ......................................................................... 22
4.0 RATIONALE AND ALTERNATIVES ........................................................................................ 22
4.1 Project Rationale .......................................................................................................... 22 4.2 Other Options .............................................................................................................. 23
PART C – POTENTIAL ENVIRONMENTAL EFFECTS ........................................................................ 29
5.0 KEY ENVIRONMENTAL ISSUES ........................................................................................... 29
5.1 Flora and Fauna ............................................................................................................ 29 5.2 Rivers, creeks, wetlands and estuaries ........................................................................ 31 5.3 Significant Areas ........................................................................................................... 32 5.4 Coastal Zone ................................................................................................................. 33 5.5 Marine Areas ................................................................................................................ 33 5.6 Air Emissions ................................................................................................................ 33 5.7 Liquid Effluent .............................................................................................................. 39 5.8 Solid Wastes ................................................................................................................. 39

Environmental Effects Report – Fulton Hogan
4 |FH_East Ridgley Asphalt Plant_EER_Final_260814
5.9 Noise Emissions ............................................................................................................ 40 5.10 Transport Impacts ........................................................................................................ 43 5.11 Other Off‐site Impacts ................................................................................................. 46 5.12 Hazardous Substances and Chemicals and Fire Management .................................... 46 5.13 Site Contamination ...................................................................................................... 47 5.14 Sustainability and Climate Change ............................................................................... 47 5.15 Cultural Heritage .......................................................................................................... 48 5.16 Sites of High Public Interest ......................................................................................... 48 5.17 Rehabilitation and Decommissioning .......................................................................... 49
PART D – MANAGEMENT COMMITTMENTS ............................................................................... 50
6.0 FLORA AND FAUNA MANAGEMENT .................................................................................. 50
7.0 AIR QUALITY AND ODOUR MANAGEMENT ........................................................................ 50
8.0 STORMWATER MANAGEMENT .......................................................................................... 52
9.0 WASTE MANAGEMENT ...................................................................................................... 52
10.0 NOISE MANAGEMENT ....................................................................................................... 53
11.0 TRAFFIC AND TRANSPORT MANAGEMENT ........................................................................ 53
12.0 HAZARDOUS SUBSTANCES AND CHEMICAL STORAGE MANAGEMENT ............................... 53
13.0 CULTURAL HERITAGE MANAGEMENT ................................................................................ 54
14.0 REHABILITATION AND DECOMISSIONING MANAGEMENT ................................................. 55
PART E – PUBLIC CONSULTATION ............................................................................................... 56
16.0 STAKEHOLDER CONSULTATION ......................................................................................... 56
16.1 Land Owner, Neighbouring Operations and Government Agencies ........................... 56 16.2 Additional Key Stakeholders ........................................................................................ 56
17.0 REFERENCES ...................................................................................................................... 57
APPENDIX 1 ‐ NATURAL VALUES ATLAS REPORT ......................................................................... 58
APPENDIX 2 ‐ ENVIRONMENT PROTECTED MATTERS SEARCH TOOL REPORT ............................. 59
APPENDIX 3 ‐ FULTON HOGAN EAST RIDGLEY MOBILE ASPHALT PLANT ENVIRONMENTAL MANAGEMENT PLAN ................................................................................................................. 60
APPENDIX 4 ‐ AIR QUALITY ASSESSMENT ................................................................................... 61
APPENDIX 5 ‐ ENVIRONMENTAL NOISE ASSESSMENT ................................................................. 62
APPENDIX 6 ‐ FULTON HOGAN CASE AND MANAGEMENT ACTION PROCEDURE ........................ 63

Environmental Effects Report – Fulton Hogan
5 |FH_East Ridgley Asphalt Plant_EER_Final_260814
LIST OF TABLES
TABLE 1: LAND TENURE DETAILS ................................................................................................................ 17 TABLE 2: OTHER OPTIONS FOR LOCATION OF THE PROPOSED MOBILE ASPHALT PLANT ......................................... 23 TABLE 3: AIR QUALITY ASSESSMENT CRITERIA .............................................................................................. 34 TABLE 4: ACOUSTIC DATA USED IN NOISE MODELLING ................................................................................... 41 TABLE 5: PREDICTED NOISE LEVELS AT NEAREST SENSITIVE RECEIVERS ............................................................... 41 TABLE 6: NUMBER AND TYPE OF VEHICULAR MOVEMENTS FROM THE ASPHALT PLANT AND ADJACENT QUARRY
OPERATION .................................................................................................................................... 43 TABLE 7: SITES LISTED ON THE TASMANIAN HERITAGE REGISTER ‐ RIDGLEY AND SURROUNDING AREA ...................... 49 LIST OF FIGURES
FIGURE 1: TYPICAL LAYOUT – DRUM MIXING PROCESS ASPHALT PLANT (ILLUSTRATIVE ONLY). .............................. 11 FIGURE 2: GENERAL LOCATION OF PROPOSED ASPHALT PLANT ........................................................................ 13 FIGURE 3: PROPOSED LOCATION OF ASPHALT PLANT IMMEDIATELY EAST OF BIS INDUSTRIES QUARRY ‐ EAST RIDGLEY
.................................................................................................................................................... 14 FIGURE 4: LOCATION OF PROPOSED ASPHALT PLANT ON MINING LEASE 1218P/M ............................................. 14 FIGURE 5: LAND ZONING UNDER BURNIE INTERIM PLANNING SCHEME .............................................................. 14 FIGURE 6: PROPOSED ASPHALT PLANT LOCATION LOOKING NORTH TO ADJACENT FARMING LAND AND QUARRY
OPERATION ..................................................................................................................................... 15 FIGURE 7: PROPOSED ASPHALT PLANT LOCATION LOOKING EAST ....................................................................... 16 FIGURE 8: PROPOSED ASPHALT PLANT LOCATION (LEFT OF ROAD) LOOKING SOUTH ALONG QUARRY ACCESS ROAD ..... 16 FIGURE 9: 195 CIRCULAR ROAD, EAST RIDGLEY (PROPERTY ID 7387623, TITLE REF: 120295/2) ....................... 18 FIGURE 10: VIEW LOOKING NORTH FROM PROPOSED ASPHALT PLANT LOCATION TO NEAREST SENSITIVE RECEPTOR ..... 19 FIGURE 11: VIEW LOOKING EAST FROM PROPOSED ASPHALT PLANT LOCATION TO NEAREST SENSITIVE RECEPTOR ........ 19 FIGURE 12: VIEW LOOKING SOUTH FROM PROPOSED ASPHALT PLANT LOCATION TO NEAREST SENSITIVE RECEPTOR .... 20 FIGURE 13: VIEW LOOKING WEST FROM PROPOSED ASPHALT PLANT LOCATION ................................................... 20 FIGURE 14: LOCATION OF PROPOSED ASPHALT PLANT WITH 500M BUFFER AND LOCATION OF NEAREST SENSITIVE
RECEPTORS ..................................................................................................................................... 21 FIGURE 15: GENERAL LOCATION PLAN ........................................................................................................ 24 FIGURE 16: SITE LAYOUT PLAN .................................................................................................................. 25 FIGURE 17: TYPICAL SILO ELEVATIONS ........................................................................................................ 26 FIGURE 18: PLANT ELEVATIONS ................................................................................................................. 27 FIGURE 19: INDICATIVE LEASE BOUNDARY OF THE PROPOSED MOBILE ASPHALT PLANT SITE .................................. 28 FIGURE 20: AIR QUALITY ASSESSMENT ‐ LOCATION OF SENSITIVE RECEPTORS ..................................................... 36 FIGURE 21: LOCATION OF NEAREST SENSITIVE RECEPTORS FOR NOISE MODELLING ................................................ 40 FIGURE 22: TRUCK TRANSPORT ROUTE ....................................................................................................... 45
Environmental Effects Report – Fulton Hogan
6 |FH_East Ridgley Asphalt Plant_EER_Final_260814
GLOSSARY
ABBREVIATION DESCRIPTION
BCC Burnie City Council
EPA Environment Protection Authority
EMP Environmental Management Plan
EMPCA Environmental Management and Pollution Control Act 1994
EPBC Environment Protection and Biodiversity Conservation Act 1999
FH Fulton Hogan
LIST Land Information Services Tasmania
NOI Notice of Intent

Environmental Effects Report – Fulton Hogan
7 |FH_East Ridgley Asphalt Plant_EER_Final_260814
PART A – PROPONENT DETAILS Contact details of the project proponent are:
Name Fulton Hogan Industries Pty Ltd Registered Address Level 1, Building 7, Botanicca Corporate Park, 572 Swan Street,
Richmond, Victoria 3121 Postal Address PO Box 56, Hawthorn, Vic, 3122 ABN 54 000 630 689 Phone +61 2 4587 5111 Fax +61 2 4587 5148
The primary contact person regarding this Environmental Effects Report (EER) and the project will be: Name Rachel Lowe Position Environment Manager – Victoria and Tasmania Company Fulton Hogan Industries Pty Ltd Address Level 1, Building 7, Botanicca Corporate Park, 572 Swan Street,
Richmond, Victoria 3121 Phone +61 39340 6282 Fax +61 39340 6299 Mobile 0408 910 740 Email [email protected] Fulton Hogan is a leading producer and contractor of asphalt products and services across Australia. Their products and services are supplied from more than 40 locations around the country, with a capacity that ranges from 35 tonnes per hour to a massive 300 tonnes per hour. They combine state‐of‐the‐art fixed and mobile plant and equipment with skilled, well trained teams to deliver high performance asphalt for the most demanding applications. The asphalt is designed and manufactured to meet client’s needs, providing superior performance in a variety of applications. Fulton Hogan’s technical staff works closely with their suppliers to incorporate the latest developments and technologies into the final product. They also ensure that the asphalt production processes use the latest ‘green’ technologies, including low temperature/low emission technologies to conserve energy and reduce environmental impacts. Asphalt products can be supplied at the point of manufacture, delivered to any construction project, or supplied as a component of the total pavement solution. Asphalt mixes can also be manufactured on site by mobile mix plants, with capacities of up to 300 tonnes of product per hour.

Environmental Effects Report – Fulton Hogan
8 |FH_East Ridgley Asphalt Plant_EER_Final_260814
PART B – PROJECT DESCRIPTION 1.0 DESCRIPTION OF THE PROJECT
Fulton Hogan propose to develop a temporary mobile Asphalt plant on a leased portion of 195 Circular Road, East Ridgley, Tasmania. The following sections provide a detailed description of the elements of the proposed mobile asphalt plant.
1.1 Interaction with BIS Industries Quarry Operation
The asphalt plant will be located on a Mining Lease (ID: 10536, Tenement Reference: 1218P/M, approx. 98 hectares in size) issued by Mineral Resources Tasmania (Department of Infrastructure, Energy and Resources) to BIS Industries Limited. Irrespective of this the asphalt plant will be an independent operation and will operate under a permit issued under the Land Use Planning and Approval Act 1993 that will contain environmental conditions. The environmental conditions relating to the level 2 activity will be regulated by the EPA. The site will also operate under an Environmental Management Plan (EMP) (Appendix 3). The only interaction between the asphalt plant and the quarry from an operational perspective will be the delivery of aggregate resource from the quarry to the asphalt plant for use in asphalt production and the use of the quarry access road for the movement of trucks delivering asphalt product to the Burnie Port and/or other specific projects. It is worth noting that the quarry already undertakes some material processing activities (i.e. crushing and screening of aggregates). As such, the materials processing proposed by the Asphalt plant is not inconsistent with the current use of ‘Rural Resource’ zoned land for the quarry operations. The quarry will continue to operate under its own EPN (Licence No 3166 Issued 3 June 1986 – NOTE this is currently being reviewed by EPA) and the Asphalt Plant will operate under its own EPN. However due to BIS Industries EPN applying to the whole Mining Lease, BIS industries will ultimately be responsible for environmental management and performance. As such an arrangement will be made between Fulton Hogan and BIS industries such that the asphalt plant operation will also meet and comply with environmental requirements imposed upon BIS industries.
1.2 Project Timeframe
The Plant will be located at the site for around 18 months in total, with a brief 2 month intermission where it will be relocated to Launceston for a separate project before returning back to the site. The Asphalt plant is scheduled for mobilisation in September 2014 through to December 2014. The plant will then be relocated to Launceston for 2 months and will return back to the East Ridgley site in early 2015 and operate through to the end of 2015.

Environmental Effects Report – Fulton Hogan
9 |FH_East Ridgley Asphalt Plant_EER_Final_260814
1.3 Resources
Aggregate materials for asphalt product will be sourced from the adjacent BIS industries Quarry. Approximately 2,500 tonnes of aggregate will be stored in stockpiles on the asphalt plant site in preparation for asphalt production events. Low‐sulphur1 Bitumen, Hot Oil and Sand will be delivered to the site. The low‐sulphur Bitumen and the Hot Oil will be stored in tanks (refer to Section 5.12 of this EER) and the sand stored in stockpiles.
1.4 Asphalt Plant Products
The temporary mobile asphalt plant will manufacture specialty asphalt, for use at the Burnie Port and similar locations.
1.5 Market
The temporary establishment of the plant will be to service the specialised asphalt requirement at the Burnie Port. It is not intended to take away business from local asphalt plants already servicing Burnie and the surrounding area. The works at the Burnie Port are critical to the local economy, operation of the Port and Port safety. The existing pavements and infrastructure are failing and require imminent replacement. Due to the failures and environmental control required in the Port environment, these works are scheduled to commence in September 2014.
1.6 Production Schedule and Operating Hours Annual production volumes will be approximately 20,000 tonnes per year. As such, the asphalt plant would be a Level 2 activity as per the following classification under Schedule 2 – 7(d) of the Environmental Management and Pollution Control Act 1994:
7(d) Pre‐mix Bitumen Plants: works in which crushed or ground rock aggregates are mixed with bituminous or asphaltic materials for the purpose of producing road‐building mixtures and capable of producing more than 1,000 tonnes of material per year.
Whilst the plant will be located at the site during the above mentioned periods, actual operation of the plant for production of asphalt will be subject to specific pouring timeframes at the Burnie Port and/or other specific projects. The plant will operate between the hours of 7.30am to 6pm Monday to Friday, 7.30am to 12pm on Saturdays, but not on Sundays or public holidays. The design capacity of the plant is
1 A low sulphur bitumen will be used for the production of asphalt. This bitumen product is a specialist mix sourced out of Victoria and has been specifically ‘cut’ during production of shorter chain odorous hydrocarbons to reduce odour.

Environmental Effects Report – Fulton Hogan
10 |FH_East Ridgley Asphalt Plant_EER_Final_260814
180 tons per hour, and current production forecasts indicate that the plant will produce approximately 20,000 tons per year, running for only approximately 120 hours per year. It is expected that production of asphalt will only occur over a 10‐12 week period in total (i.e. 5‐6 production events over the 18 month period with each being a 2 week window and the plant operating at varying times of the day subject to demand). The reminder of the time the plant will remain dormant with stockpiles on the site. The intention is for the works to be largely conducted over the summer months when the environmental risk is lower and quality and efficient production can be best achieved.
1.7 Asphalt Processing Techniques and Equipment
This particular plant has been custom built for Fulton Hogan and exhibits the high level of environmental controls Astec plants are known for. This plant is approximately 3 years old and has been in very sensitive environments, such as Barrow Island, which had stringent quarantine and environmental controls to protect the islands rare and threatened species. It is proposed to install a modern, high efficiency asphalt plant (Figure 1 Typical plant – a detailed site plan is found in Figure 16), comprising of: Parallel flow drum mixer (capacity 180 tonne/hour); Diesel fired burner (heat source for aggregate heating/drying stages within the drum mixer);
25 tonne hot asphalt storage bin; 6 x cold feed bin unit; Baghouse dust filter, dust extraction fan and associated discharge stack; Truck load out and plant control room. Production processes at the site will comprise: Asphalt batching Stockpiling Blending of cement treated crushed rock Delivery to the site of aggregate, sand or low‐sulphur bitumen Removal from the site of asphalt Maintenance to or the operation of plant In summary stockpiled aggregates are transferred by front end loader up the ramp and into the cold feed bins where the aggregate is transported via the incline conveyor into the Double Barrel Drum. The Drum rotates and first heats the aggregate and then mixes it with low‐sulphur Bitumen (provided by pipe from the Bitumen Tank to the Double Barrel Drum). After the bitumen and aggregate are mixed in the drum, the resulting hot mix is transferred into the storage silos ready for loading into trucks and delivery to the asphalt pouring site. The plant is operated from the control centre. The baghouse removes particulate matter from the drum exhaust prior to emissions being discharged via a stack to atmosphere.
Environmental Effects Report – Fulton Hogan
11 |FH_East Ridgley Asphalt Plant_EER_Final_260814
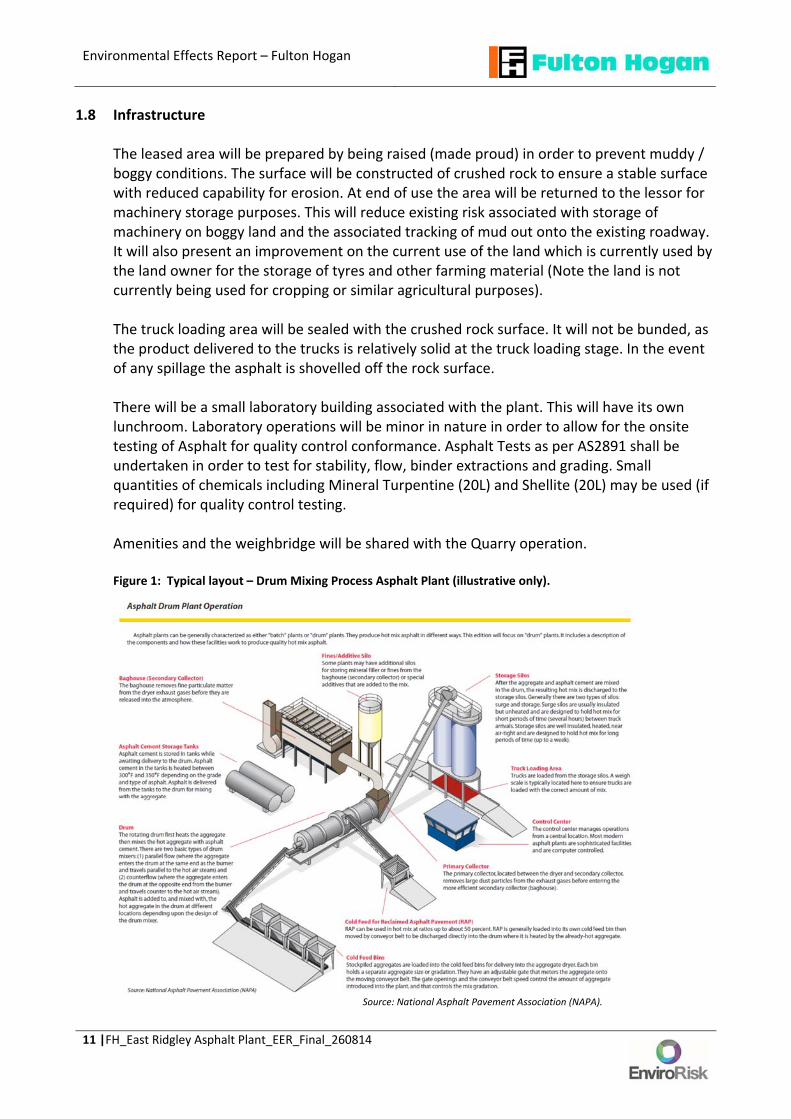
1.8 Infrastructure
The leased area will be prepared by being raised (made proud) in order to prevent muddy / boggy conditions. The surface will be constructed of crushed rock to ensure a stable surface with reduced capability for erosion. At end of use the area will be returned to the lessor for machinery storage purposes. This will reduce existing risk associated with storage of machinery on boggy land and the associated tracking of mud out onto the existing roadway. It will also present an improvement on the current use of the land which is currently used by the land owner for the storage of tyres and other farming material (Note the land is not currently being used for cropping or similar agricultural purposes). The truck loading area will be sealed with the crushed rock surface. It will not be bunded, as the product delivered to the trucks is relatively solid at the truck loading stage. In the event of any spillage the asphalt is shovelled off the rock surface. There will be a small laboratory building associated with the plant. This will have its own lunchroom. Laboratory operations will be minor in nature in order to allow for the onsite testing of Asphalt for quality control conformance. Asphalt Tests as per AS2891 shall be undertaken in order to test for stability, flow, binder extractions and grading. Small quantities of chemicals including Mineral Turpentine (20L) and Shellite (20L) may be used (if required) for quality control testing. Amenities and the weighbridge will be shared with the Quarry operation. Figure 1: Typical layout – Drum Mixing Process Asphalt Plant (illustrative only).
Source: National Asphalt Pavement Association (NAPA).

Environmental Effects Report – Fulton Hogan
12 |FH_East Ridgley Asphalt Plant_EER_Final_260814
1.9 Workforce
The Asphalt plant will require employment of 2 personnel when in operation and contractors as required.
1.10 Traffic and Access All traffic will enter and exit the site via the Quarry Access Road. When leaving the site trucks will turn right on Circular Road and then on to Ridgley Highway and follow the designated truck route to the Burnie Port and other locations. Burnie City Council have advised that Circular Road has already been designed to cater for the type and quantity of truck movements referred to above. Refer to Section 5.10 for additional specific details relating to Traffic Management.
1.11 Power Supply Power will be delivery to the plant via mains electricity supply.
1.12 Fuel and Chemical Storage A self bunded diesel tank to run the burner will be located on the site. Bunding will be constructed for the balance of tank storage, including a low‐sulphur Bitumen Tank (60,000 Litres) and Hot Oil Tank (700 Litres).
1.13 Water Services Demand for water will be limited and process water will not be required for the asphalt
production. There will be no process water discharged from the site. Access to mains water for minor use will be available from the adjacent quarry operation. Water for dust suppression will be provided by water carts, who will supply and apply. Refer to section 5.3 for details and management of stormwater runoff from the site.

Environmental Effects Report – Fulton Hogan
13 |FH_East Ridgley Asphalt Plant_EER_Final_260814
2.0 PROJECT AREA 2.1 Project Location
The asphalt plant operation will be located on a leased portion (approx. 0.9 hectares) of 195 Circular Road, East Ridgley, TAS 7321 approximately 10 kilometres south of the Burnie CBD (Figures 2 and 3). Figure 4 shows the proposed location of the asphalt plant relative to the BIS industries Mining Lease. The proposed site is a generally flat parcel of land at an elevation of approximately 260m above sea level. The surrounding land has a similar gradient for approximately 500 metres radius with the exception of Rawlings Hill located approximately 450 metres to the south west which rises to 320 metres above sea level and a sloping gradient beyond the adjacent quarry down to the Pet River to the north. There are no water courses or water bodies running through or on the site. The site currently has no vegetation other than grass. The only buildings are an existing small farm shed (Figures 6 – 8). Figure 2: General Location of Proposed Asphalt Plant
Proposed Asphalt Plant

Environmental Effects Report – Fulton Hogan
14 |FH_East Ridgley Asphalt Plant_EER_Final_260814
Figure 3: Proposed Location of Asphalt Plant immediately East of BIS Industries Quarry ‐ East Ridgley
Figure 4: Location of Proposed Asphalt plant on Mining Lease 1218P/M
Figure 5: Land Zoning Under Burnie Interim Planning Scheme
Indicative Lease of Proposed Asphalt Plant
Mining Lease 1218P/M – BIS Industries
Location ofProposed Asphalt Plant

Environmental Effects Report – Fulton Hogan
15 |FH_East Ridgley Asphalt Plant_EER_Final_260814
Figure 6: Proposed Asphalt plant location looking north to adjacent farming land and quarry operation

Environmental Effects Report – Fulton Hogan
16 |FH_East Ridgley Asphalt Plant_EER_Final_260814
Figure 7: Proposed Asphalt plant location looking east
Figure 8: Proposed Asphalt plant location (left of road) looking south along Quarry access road

Environmental Effects Report – Fulton Hogan
17 |FH_East Ridgley Asphalt Plant_EER_Final_260814
2.2 Current and Historical Use of the Site
The land on which the proposed asphalt plant will be located is currently grassed farming land (Figures 6 – 8) and zoned as ‘Rural Resource’ under the Burnie Interim Planning Scheme. The land is not currently used for cropping/agricultural purposes but has been used for the storage of farming plant, equipment and consumables (i.e. tyres, plastics etc.). As mentioned in sections 1.1 and 2.3 the asphalt plant is also located on a Mining Lease (ID: 10536, Tenement Reference: 1218P/M, approx. 98 hectares in size) issued by Mineral Resources Tasmania (Department of Infrastructure, Energy and Resources) to BIS Industries Limited. The quarry operates under a Category 3 Licence for the extraction of construction minerals issued by Mineral Resources Tasmania and a Licence to Operate Scheduled Premises (licence No 3166 issued 3 June 1986) by the EPA. This licence applies to the whole Mining Lease. Due to BIS Industries EPN applying to the whole Mining Lease, BIS industries will ultimately be responsible for environmental management and performance. As such an arrangement will be made between Fulton Hogan and BIS industries such that the asphalt plant operation will also meet and comply with environmental requirements imposed upon BIS industries.
Historically the land on which the asphalt plant will be located has been used for broad acre farming and livestock. Historically, the remainder of the land parcel (Property ID 7387623, Title Ref: 120295/2) has also been used for farming and livestock and the quarry operation.
2.3 Land Tenure of the Site
Table 1 lists the Land Tenure details. Table 1: Land Tenure Details
Project Name Fulton Hogan Mobile Asphalt Plant – East Ridgley
Address 195 Circular Road, East Ridgley, TAS 7321 (Figure 9)
Property ID 7387623
Tile Reference 120295/2
Land owner Mr Gary and Mrs Pat Clarke (GA and PM Clarke Pty Ltd) of 195 Circular Road, East Ridgley TAS 7321.
Lease Details The site will be leased by Fulton Hogan from the Land owner under a Proposal to Lease –195 Circular Road, East Ridgley TAS 7321 (Lessor ABN 97766348939 Pty Ltd).
Zoning ‘Rural Resource’ under the Burnie Interim Planning Scheme 2013 (Figure 5) and will require a Discretionary Permit under a ‘Manufacturing and Processing’ Use Class.
Mining Lease Mining Lease (ID: 10536, Tenement Reference: 1218P/M, approx. 98 hectares in size) issued to BIS Industries Limited with a Category 3 Licence for the extraction of construction minerals (Figure 4). The existing quarry also operates under a Licence to Operate Scheduled Premises (licence No 3166) issued on the 3rd June 1986. This licence applies to the whole Mining Lease.

Environmental Effects Report – Fulton Hogan
18 |FH_East Ridgley Asphalt Plant_EER_Final_260814
Figure 9: 195 Circular Road, East Ridgley (Property ID 7387623, Title Ref: 120295/2)
www.thelist.tas.gov.au
2.4 Surrounding Land uses and Nearest Sensitive Receptors
Surrounding land uses and neighbours are: North: Farming land and Quarry operation. Further north is a Riparian forest area and Pet River (Pet River flows generally to the north east and merges with Emu Creek approximately 3 – 4 kilometres downstream. The closest resident is approximately 740 metres to the north west (Figures 10 & 14).
East: Farming land, closest resident is approximately 650 metres away (Figures 11 & 14). South: Farming land, closest resident is approximately 350 metres away (Figure 14). This is the residence of Mr Gary and Mrs Pat Clarke) owners of the land on which the asphalt plant will be located. Views from the Clarkes residence to the asphalt plant will be blocked by natural topography (Figure 12) which will also assist in minimising any environmental impact (i.e. noise/odour) to this residence). West: Farming land and Quarry operation, closest resident is approx. 1 kilometre away but with no clear line of site to the asphalt plant location (Figure 13 & 14).
2.5 Geology The geology of the site and the surrounding area is a Tertiary Basalt [basanaite (Tb)] of the Cenozoic Era.
195 Circular Road, East Ridgley, TAS, Property ID: 7387623 Title: 120295/2

Environmental Effects Report – Fulton Hogan
19 |FH_East Ridgley Asphalt Plant_EER_Final_260814
Figure 10: View looking north from proposed asphalt plant location to nearest sensitive receptor (approx. 750m away)
Figure 11: View looking east from proposed asphalt plant location to nearest sensitive receptor (approx. 650m away)

20 |FH_East Ridgley Asphalt Plant_EER_Final_260814
Figure 12: View looking south from proposed Asphalt Plant location to nearest sensitive receptor (approx. 350m away) over the crest of the hill
Figure 13: View looking west from proposed asphalt plant location. Nearest sensitive receptor cannot be seen.

Environmental Effects Report – Fulton Hogan
21 |FH_East Ridgley Asphalt Plant_EER_Final_260814
Figure 14: Location of Proposed Asphalt Plant with 500m Buffer and Location of Nearest Sensitive Receptors

Environmental Effects Report – Fulton Hogan
22 |FH_East Ridgley Asphalt Plant_EER_Final_260814
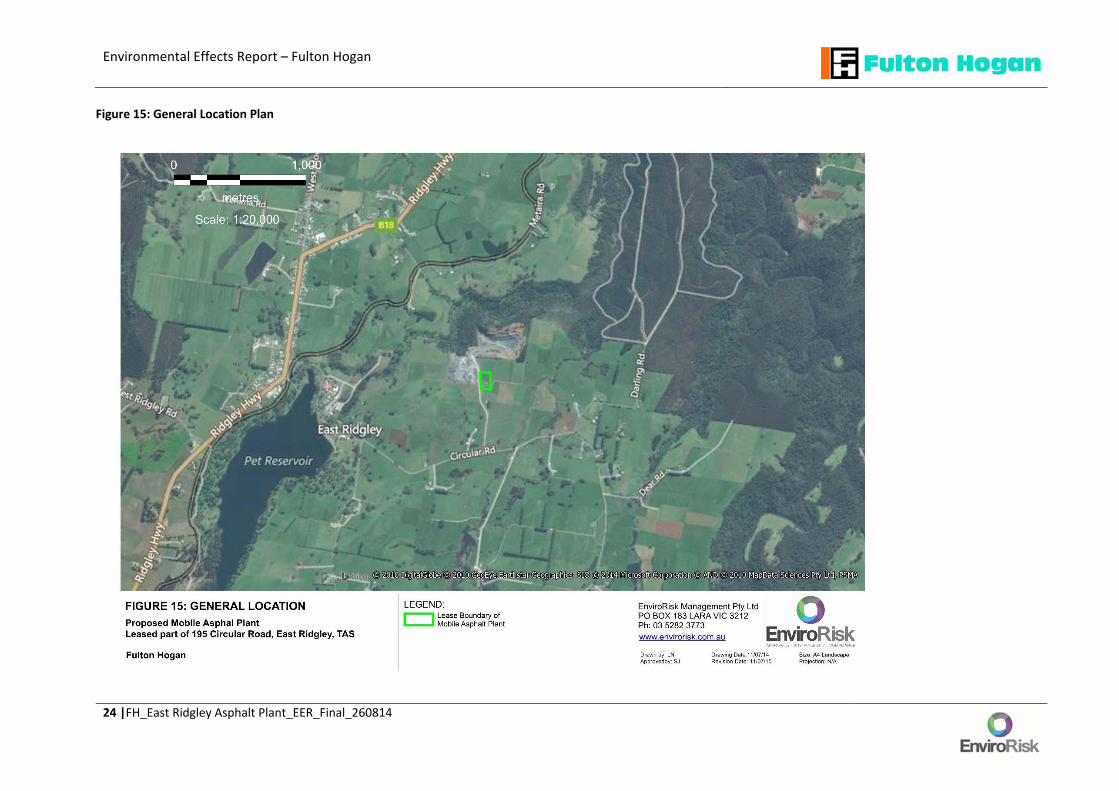
3.0 MAP AND SITE PLAN 3.1 General Location Plan
Figure 15 shows the general location of the proposed mobile asphalt plant site and the surrounding area. The site will be located approximately 1.5 kilometres east of the Ridgley Township. Other significant features in the general location area include the BIS Industries Quarry to the immediate north and west of the site, the Pet Reservoir (approximately 1.5 km south west), and Pet River (approx. 350m north)
3.2 Site Plan
Figure 16 shows the site layout plan of the proposed mobile asphalt plant. The site plan also shows the locations of the laboratory, bunded tank storage area, self bunded diesel tank, truck spraying area, bitumen tank loading area, site entry and exit points and traffic flow. Figures 17 and 18 show the side elevations of the silo and transfer screws and the elevations of the batcher and surge bin/storage silos respectively. The silo is used for adding special additives to the asphalt mix in the Double Barrel Drum. Figure 18 shows the elevations of the batcher and surge bin/storage silos that hold the asphalt ready for loading into trucks.
3.3 Land on which activity will take place
Figure 19 shows the indicative lease boundary on which the proposed mobile asphalt plant will be located and comprises an area approximately one (1) hectare in size.
4.0 RATIONALE AND ALTERNATIVES 4.1 Project Rationale
The temporary establishment of the mobile asphalt plant will be to service the specialised asphalt requirement at the Burnie Port. It is not intended to take away business from local asphalt plants already servicing Burnie and the surrounding area. The works at the Burnie Port are critical to the local economy, operation of the Port and Port safety. The existing pavements and infrastructure are failing and require imminent replacement. The key raw product for the manufacture of the specialised asphalt (i.e. gravel) is being sourced from the BIS Industries Basalt Quarry located at 195 Circular Road, East Ridgeley. Locating the asphalt plant on land immediately adjacent to the quarry effectively eliminates any double handling of rock materials and presents an ideal strategic location for the asphalt plant. The proposed site at east Ridgley is a rural area with the closest resident being the landowner approx. 350m away behind a hill to the south. All other residents are well over 500m away providing an appropriate buffer distance. A similar buffer and acceptable

Environmental Effects Report – Fulton Hogan
23 |FH_East Ridgley Asphalt Plant_EER_Final_260814
management of environmental effects would not effectively achieved if the asphalt plant was to be located in options investigated in the Burnie township area (refer to section 4.1 below).
4.2 Other Options
Alternative options were investigated for the location of the proposed mobile asphalt plant. A summary of the evaluation of each option including the advantages and disadvantages is outlined in Table 2. Table 2: Other Options for Location of the Proposed Mobile Asphalt plant
OPTION ADVANTAGES DISADVANTAGES Burnie Port Located at the Port
Proposed development in line with land use zoning
Potential environmental nuisance to nearby community (approx. 100m away) and residents (approx. 300m away) from dust, odour and noise impacts. Environmentally sensitive location on the water’s edge and exposed to winds which will exacerbate dust effects. Limited space available, which is required for the storage of excavated materials for future use by the Port.
Timber Mill (Massey Greene Drive, Burnie)
Closer to the Port
Potential environmental nuisance to nearby and residents (approx. 150m away) from dust and odour. Insufficient room on site to locate the mobile asphalt plant and operate the facility safely. Proposed development was not in line with land use zoning. The proposed area was not in an industrial zoned area but rather an area currently zoned as ‘Open Space’
East Ridgley – within Quarry
Closest residents 350m or more away Close and immediate access to key raw product resource
Minimises volume of trucks needed for manufacturing and delivery by a third.
Insufficient room to locate asphalt plant due to quarry waste stockpile footprint. Topography of quarry not level enough to locate the plant Discretionary land use planning permit required
East Ridgley – adjacent to Quarry
Closest resident is 350m away behind a hill. Next closest residents are over 500m away.
Keeps the plant out of the way of the community (minimal effect on Burnie)
Direct access to dedicated truck haulage route to Burnie.
Close and immediate access to key raw product resource providing a more economic and sustainable solution Minimises volume of trucks needed for manufacturing and delivery by a third.
Discretionary land use planning permit required
Environmental Effects Report – Fulton Hogan
24 |FH_East Ridgley Asphalt Plant_EER_Final_260814
Figure 15: General Location Plan

FUEL
TAN
KH
C-120
A.C
. TAN
K
BA
RR
ELD
OU
BLE
PBH
-BA
GH
OU
SE
INC
LINE C
ON
VEY
OR
CO
NTR
OL
RO
OM
AIR
Com
p
40 TON SEB
GEN
ERA
TOR
R A
M P
UL
PUM
P
GEN
Diesel 40K
L
10.00
BITUMEN LOADING
SAPLIN
G
LAB
OR
ATO
RY
CA
R PA
RK
ING
AGGREGATESTOCK PILES
AREA
OU
T ON
LY
IN O
NLY
R O
A D
R O
A D
75.96
128.
76
79.05
128.79
33.52
SelfBundedTank
SPRA
Y
Sheet
Drawn By Dimensions
Kamal Sehra Metres
A3
Drw No: FH089
115 - 119 Churchill Rd North
Dry Creek SA Ph:08-81394500
MOBILE ASPHALT PLANT EAST RIDGLEY SITE PLAN
REV. DATE
0 30/07/2014
L E G E N D
R0
File Name
East Ridgley Site Compound
Revision-5 Date:24/04/2014
Site Location
East Ridgley, TAS
Approved By
Daniel Taylor
Scale
1:3501/1
FENCE LINE
TRUCK PATH
Lok
Typewritten Text
FIGURE 16:Site Layout Plan
Lok
Typewritten Text

Lok
Typewritten Text
FIGURE 17: Typical Silo Elevations

SIDE ELEVATION OPERATIONAL
SEB 50/24
12/15/2011
SB002607A 01
11-186
12/16/2001
ASTEC AUSTRALIA
Lok
Typewritten Text
FIGURE 18: Plant Elevations

Environmental Effects Report – Fulton Hogan
28 |FH_East Ridgley Asphalt Plant_EER_Final_260814
Figure 19: Indicative Lease Boundary of the Proposed Mobile Asphalt Plant Site
79.05m
75.96m
128.76m
128.79
m

Environmental Effects Report – Fulton Hogan
29 |FH_East Ridgley Asphalt Plant_EER_Final_260814
PART C – POTENTIAL ENVIRONMENTAL EFFECTS 5.0 KEY ENVIRONMENTAL ISSUES
The proposed location of the mobile asphalt plant was subjected to specific environmental impact assessments by applicable environmental experts and other appropriate investigation to appropriately evaluate the potential environmental effects. This section outlines the results of these assessments and investigations and determinations from these assessments aided the development of appropriate management commitments to avoid and/or minimise impacts (refer to Part D of the EER). Furthermore the management of key environmental issued will also be facilitated under the Fulton Hogan Environmental Management Strategy ‐ Southern Region Metro Surfacing and the Fulton Hogan East Ridgley Mobile Asphalt Plant Environmental Management Plan (EMP) (refer Appendix 3)
5.1 Flora and Fauna
A search was undertaken of the Land Information System Tasmania (LIST) on the Wednesday 18 June 2014 and of the Natural Values Atlas on Friday 20 June 2014 to identify other potential flora and fauna characteristics that may be associated with or surrounding the site. The search revealed the following (Please refer to Appendix 1 for a copy of the Natural Values Atlas Report):
The vegetation classification on the site is (FAG) Agricultural, urban and exotic vegetation.
The vegetation classification for the adjacent quarry land to the west and north is (FUM) Extra urban miscellaneous and agricultural, urban and exotic.
The site is located within the Emu River Catchment Area. However there are no creeks or streams running through the property.
Approximately 350 metres to the North (on the northern side of the adjacent quarry) is a 6.7 hectare area of eucalyptus viminalis wet forest that it classified a threatened community. The proposed asphalt plant will not impact upon this area.
Other forest areas to the north (along the Pet River corridor) are classified as Tall Native Eucalypt, Rainforest and related scrub – nothofagus‐phyllocladus short rainforest and Rainforest (sub‐temperate). The proposed asphalt plant will not impact upon these areas.
There are no records of threatened flora within 1 km of the site
There is a recorded sighting (aprox December 1991) of Dasyurus maculatus subsp. Maculatus (spotted‐tail quoll) approximately 850m to the south west near Circular Road.
There are no known cases of threatened fauna within 1km of the site, however there is the potential for seven (7) threatened fauna species within 1 km of the site. These include Dasyurus maculatus (spotted‐tailed quoll), Perameles gunnii (eastern barred bandicoot), Pseudemoia pagenstecheri (tussock skink), Astacopsis gouldi (giant freshwater crayfish), Lathamus (discolor swift parrot), Sarcophilus harrisii (tasmanian devil), Prototroctes maraena (australian grayling). Given that the prosed site is grassed vacant agricultural land it is considered unlikely that it is suitable habitat for the above mentioned species

Environmental Effects Report – Fulton Hogan
30 |FH_East Ridgley Asphalt Plant_EER_Final_260814
and that potential for these species in the area is likely attributable to Pet River and surrounding Riparian areas and vegetation approximately 350m to the north of the site.
There are no records of raptor nests or sightings within 1km of the site.
There are no records of non‐threatened flora of conservation significance found within 1km of the site.
There are no records of non‐threatened fauna of conservation significance found within 1km of the site.
There are no records of Tas Management Act Weeds found within 1 km of the site.
There are no records of priority weeds found within 1km of the site. The trigger for involvement by the Commonwealth Government under the Environmental Protection and Biodiversity Conservation Act (EPBC Act) includes:
World Heritage properties
National Heritage places;
Wetlands of international importance (Ramsar Wetlands);
listed threatened species and ecological communities;
listed migratory species;
the Commonwealth marine area; and
nuclear actions, including uranium mining. A search of the Commonwealth Department of the Environment Protected Matters Search Tool’ was conducted on Friday 13th June 2014 in relation to the proposed asphalt plant location and applied a one (1) kilometre search radius. The search revealed the following (Refer to Appendix 2 for a copy of the full report):
Listed threatened species – 11
Listed migratory species – 7
Listed marine species – 8
Regional Forrest Agreements – 1
Invasive Species – 22 It is considered that the identified threatened, migratory and marine flora and fauna species in the search area are likely to be attributable to the Riparian forested area and Pet River (and associated habitats) approximately 350m to the north of the proposed asphalt plant location. Therefore it is considered that:
(a) the project is not likely to require approval under the Environment Protection and Biodiversity Conservation Act 1999; and

Environmental Effects Report – Fulton Hogan
31 |FH_East Ridgley Asphalt Plant_EER_Final_260814
(b) referral of the project to the Commonwealth Government for a determination on whether approval under the Environment Protection and Biodiversity Conservation Act 1999 is required, is also not deemed necessary.
There will be no native vegetation or potential habitat cleared or disturbed in the establishment and/or operation of the mobile asphalt plant. In the event that threatened fauna is encountered during the operation of the asphalt plant, Fulton Hogan shall notify applicable agencies for proposed actions of management. The site will be established on a gravel hard stand area thereby restricting weed growth. In addition weed control will be implemented throughout the operation of the plant to prevent the establishment and spreading of weeds on and off the site. Trucks coming onto the site will enter the site from the quarry access road and will only drive on the gravel hard stand area. The site will be monitored as part of routine environmental inspections for any potential import of weeds and these shall immediately be treated if identified. Flora, Fauna and weed management will be managed and implemented in accordance with the following:
Fulton Hogan East Ridgley Mobile Asphalt Plant Environmental Management Plan (EMP) (refer Appendix 3);
Fulton Hogan Flora and Fauna Management Procedure
Fulton Hogan Incident and Emergency Response Flowchart‐ Encountering Wildlife
Fulton Hogan Noxious Weeds Procedure; and
Specific management commitments relating to flora and fauna and weed management outlined in Part D of the EER.
5.2 Rivers, creeks, wetlands and estuaries
The site is located within the Emu River Catchment Area and specifically the catchment of Pet River. There are no creeks or streams located on the site. Pet River is located approximately 350m to the north of the asphalt plant site. Pet River flows in a north westerly direction and merges with Emu Creek approximately three (3) kilometres downstream from the site. The average annual rainfall in the East Ridgley area is approximately 1,200 mm per year with the large majority falling between May and October. The asphalt plant is a closed system and as such there are no ongoing losses of pollutants. All chemical and fuel storage will be within bunded areas. The diesel tank will be self bunded and an impervious, geotextile lined, earthen bund shall be constructed for the bitumen and hot oil tank storage. This will ensure that in the event that there was an incident, stormwater will not be polluted.

Environmental Effects Report – Fulton Hogan
32 |FH_East Ridgley Asphalt Plant_EER_Final_260814
The site will be relatively flat and will consist of compacted gravel. The International Erosion Control Association (IECA) recommends that for a site, whereby there are no exposed soils and that is flat or has a very low gradient (<10%), gravelling can be used as an erosion control measure. Therefore, the site can be considered to present a very low risk to erosion occurring as the site will be completely gravelled. All traffic movements shall be restricted to the gravel surface. This will prevent any mud from being tracked onto roads. Surface water runoff from the asphalt plant site will predominantly soak through the imported gravel base. Given that the site will be relatively flat there will be minimal stormwater sheet flow occurrences which can be treated using a Type 3 sediment control such as sediment fencing (IECA, Best Practice Erosion and Sediment Control, Book 1). Any stormwater runoff will be diverted to constructed channels and sediment fences prior to fanning out into the adjacent farming land buffer. Two crossovers will be constructed over the exiting roadside drain in order to provide access in and out of the site. Pipes shall be installed under the crossovers in order to ensure that roadside runoff flows are not impeded. Both the site and the crossovers will be sealed in crushed rock material or equivalent and compacted to refusal. This will minimise the potential erosion from these surfaces. The aggregate surfacing will be maintained so that mud tracked onto the surface does not become a stormwater pollutant. Visual inspections of any water runoff from the site shall be undertaken to verify that no pollutants are leaving the site. There are no groundwater bores proposed to be developed or groundwater to be extracted as part of the proposed operation. Stormwater Management at the site will be managed and implemented in accordance with the following:
Fulton Hogan East Ridgley Mobile Asphalt Plant Environmental Management Plan (EMP) (refer Appendix 3),
Fulton Hogan Erosion and Sediment Procedure; and
Specific management commitments relating to stormwater management outlined in Part D of the EER.
5.3 Significant Areas
The proposed site is not located within or adjacent to an existing reserved area (e.g. National Park, State Reserve, Regional Reserve, Nature Reserve, Forest Reserve or Conservation Area). The closest reserves are Private Timber Reserves and Private Reserves located approximately 900m and 750m to the east and west respectively (Please refer to Appendix 1 for a copy of the Natural Values Atlas Report).

Environmental Effects Report – Fulton Hogan
33 |FH_East Ridgley Asphalt Plant_EER_Final_260814
5.4 Coastal Zone
The proposed asphalt plant site is located approximately eleven (11) kilometres south of the nearest coastline and is therefore not within nor will impact on a coastal zone.
5.5 Marine Areas
The proposed asphalt plant site is not located near nor will impact on any marine area.
5.6 Air Emissions
The proposed mobile asphalt plant site is located in a rural area with the closest resident (the landowner) approximately 350m to the south behind a hill and other residents being located approximately 500m away or more in all directions. Reportedly there have been no complaints from neighbours about the existing adjacent quarry activities with regard to air quality. As the mobile asphalt plant at East Ridgley will be located immediately adjacent to an existing quarry operation an air quality assessment has been undertaken by EML Air Pty Ltd in July 2014 that is representative of the weather and topography of the East Ridgley area and the location of sensitive receptors to demonstrate that emissions from the plant would not contribute in such a way that the cumulative emissions would not exceed applicable air quality and odour criteria under the Environment Protection Policy (Air Quality) 2004.
5.6.1 Air Emission Sources and Air Quality Criteria
The main emissions to air from the proposed asphalt plant are dust, particulate matter and odour. Sources of emissions are listed below and their location is shown in the Fulton Hogan EMP (Appendix 3). Point Source Emissions Fugitive Emissions
Baghouse [PM10, PM2.5, Odour, inorganic compounds (metals) and organic compounds (BTEX), PAH’s, VOC’s (Asphalt Fume)]
Aggregate Stockpiles (Dust, PM10, PM2.5) Asphalt Loading from Storage Silo (Odour)
5.6.2 Air Quality Criteria
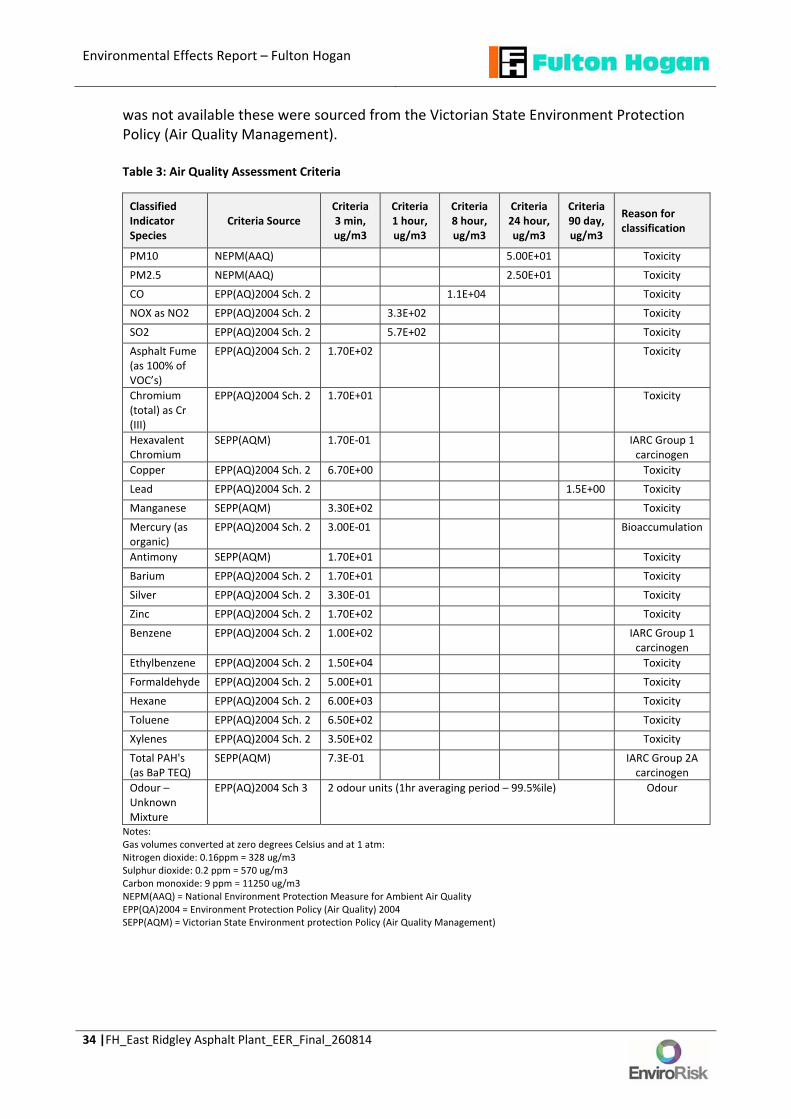
The Tasmanian Environment Protection Policy (Air Quality) 2004 (EPP‐AQ), outlines design ground level concentrations that must not be exceeded inclusive of representative existing background concentrations at relevant receptor locations. The EPP(AQ) also addresses odour. Clause 13 of the policy states that if the EPA considers that an activity is likely to cause an environmental nuisance then the EPA will require that the applicable odour criteria be met at and beyond the site boundary of the facility. The air quality criteria relevant to the project (Table 3) were sourced from the Environment Protection Policy (Air Quality) 2004 – Schedules 2 and 3 and the National Environment Protection Measure for Ambient Air Quality (for particulate matter). Where specific criteria
Environmental Effects Report – Fulton Hogan
34 |FH_East Ridgley Asphalt Plant_EER_Final_260814
was not available these were sourced from the Victorian State Environment Protection Policy (Air Quality Management). Table 3: Air Quality Assessment Criteria
Classified Indicator Species
Criteria Source Criteria 3 min, ug/m3
Criteria 1 hour, ug/m3
Criteria 8 hour, ug/m3
Criteria 24 hour, ug/m3
Criteria 90 day, ug/m3
Reason for classification
PM10 NEPM(AAQ) 5.00E+01 Toxicity
PM2.5 NEPM(AAQ) 2.50E+01 Toxicity
CO EPP(AQ)2004 Sch. 2 1.1E+04 Toxicity
NOX as NO2 EPP(AQ)2004 Sch. 2 3.3E+02 Toxicity
SO2 EPP(AQ)2004 Sch. 2 5.7E+02 Toxicity
Asphalt Fume (as 100% of VOC’s)
EPP(AQ)2004 Sch. 2 1.70E+02 Toxicity
Chromium (total) as Cr (III)
EPP(AQ)2004 Sch. 2 1.70E+01 Toxicity
Hexavalent Chromium
SEPP(AQM) 1.70E‐01 IARC Group 1 carcinogen
Copper EPP(AQ)2004 Sch. 2 6.70E+00 Toxicity
Lead EPP(AQ)2004 Sch. 2 1.5E+00 Toxicity
Manganese SEPP(AQM) 3.30E+02 Toxicity
Mercury (as organic)
EPP(AQ)2004 Sch. 2 3.00E‐01 Bioaccumulation
Antimony SEPP(AQM) 1.70E+01 Toxicity
Barium EPP(AQ)2004 Sch. 2 1.70E+01 Toxicity
Silver EPP(AQ)2004 Sch. 2 3.30E‐01 Toxicity
Zinc EPP(AQ)2004 Sch. 2 1.70E+02 Toxicity
Benzene EPP(AQ)2004 Sch. 2 1.00E+02 IARC Group 1 carcinogen
Ethylbenzene EPP(AQ)2004 Sch. 2 1.50E+04 Toxicity
Formaldehyde EPP(AQ)2004 Sch. 2 5.00E+01 Toxicity
Hexane EPP(AQ)2004 Sch. 2 6.00E+03 Toxicity
Toluene EPP(AQ)2004 Sch. 2 6.50E+02 Toxicity
Xylenes EPP(AQ)2004 Sch. 2 3.50E+02 Toxicity
Total PAH's (as BaP TEQ)
SEPP(AQM) 7.3E‐01 IARC Group 2A carcinogen
Odour – Unknown Mixture
EPP(AQ)2004 Sch 3 2 odour units (1hr averaging period – 99.5%ile) Odour
Notes: Gas volumes converted at zero degrees Celsius and at 1 atm: Nitrogen dioxide: 0.16ppm = 328 ug/m3 Sulphur dioxide: 0.2 ppm = 570 ug/m3 Carbon monoxide: 9 ppm = 11250 ug/m3 NEPM(AAQ) = National Environment Protection Measure for Ambient Air Quality EPP(QA)2004 = Environment Protection Policy (Air Quality) 2004 SEPP(AQM) = Victorian State Environment protection Policy (Air Quality Management)
Environmental Effects Report – Fulton Hogan
35 |FH_East Ridgley Asphalt Plant_EER_Final_260814
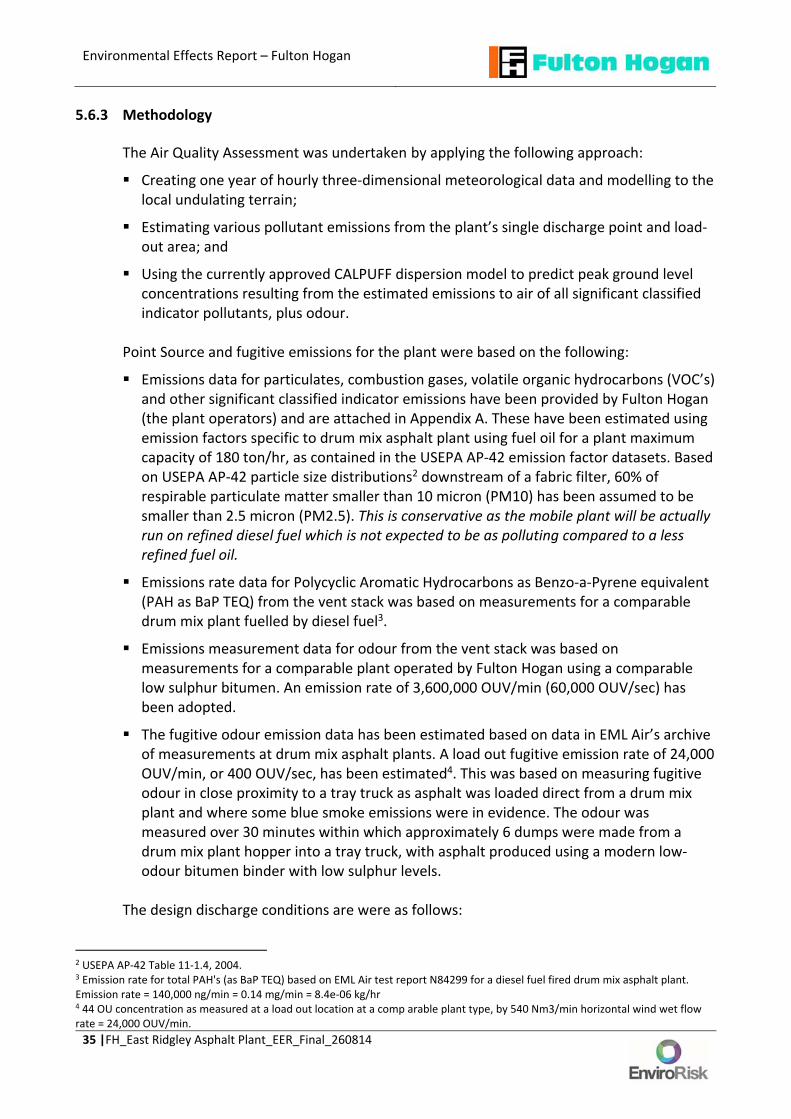
5.6.3 Methodology
The Air Quality Assessment was undertaken by applying the following approach:
Creating one year of hourly three‐dimensional meteorological data and modelling to the local undulating terrain;
Estimating various pollutant emissions from the plant’s single discharge point and load‐out area; and
Using the currently approved CALPUFF dispersion model to predict peak ground level concentrations resulting from the estimated emissions to air of all significant classified indicator pollutants, plus odour.
Point Source and fugitive emissions for the plant were based on the following:
Emissions data for particulates, combustion gases, volatile organic hydrocarbons (VOC’s) and other significant classified indicator emissions have been provided by Fulton Hogan (the plant operators) and are attached in Appendix A. These have been estimated using emission factors specific to drum mix asphalt plant using fuel oil for a plant maximum capacity of 180 ton/hr, as contained in the USEPA AP‐42 emission factor datasets. Based on USEPA AP‐42 particle size distributions2 downstream of a fabric filter, 60% of respirable particulate matter smaller than 10 micron (PM10) has been assumed to be smaller than 2.5 micron (PM2.5). This is conservative as the mobile plant will be actually run on refined diesel fuel which is not expected to be as polluting compared to a less refined fuel oil.
Emissions rate data for Polycyclic Aromatic Hydrocarbons as Benzo‐a‐Pyrene equivalent (PAH as BaP TEQ) from the vent stack was based on measurements for a comparable drum mix plant fuelled by diesel fuel3.
Emissions measurement data for odour from the vent stack was based on measurements for a comparable plant operated by Fulton Hogan using a comparable low sulphur bitumen. An emission rate of 3,600,000 OUV/min (60,000 OUV/sec) has been adopted.
The fugitive odour emission data has been estimated based on data in EML Air’s archive of measurements at drum mix asphalt plants. A load out fugitive emission rate of 24,000 OUV/min, or 400 OUV/sec, has been estimated4. This was based on measuring fugitive odour in close proximity to a tray truck as asphalt was loaded direct from a drum mix plant and where some blue smoke emissions were in evidence. The odour was measured over 30 minutes within which approximately 6 dumps were made from a drum mix plant hopper into a tray truck, with asphalt produced using a modern low‐odour bitumen binder with low sulphur levels.
The design discharge conditions are were as follows:
2 USEPA AP‐42 Table 11‐1.4, 2004. 3 Emission rate for total PAH's (as BaP TEQ) based on EML Air test report N84299 for a diesel fuel fired drum mix asphalt plant. Emission rate = 140,000 ng/min = 0.14 mg/min = 8.4e‐06 kg/hr 4 44 OU concentration as measured at a load out location at a comp arable plant type, by 540 Nm3/min horizontal wind wet flow rate = 24,000 OUV/min.

Environmental Effects Report – Fulton Hogan
36 |FH_East Ridgley Asphalt Plant_EER_Final_260814
Stack height, 6.09 m agl.
Circular flue, 0.73 m internal diameter.
Discharge temperature, 120 deg. C.
Discharge velocity, 20 m/s.
There is no existing long term ambient air quality data available for East Ridgley. Representative 70th percentile ground level concentrations were adopted based on those recorded at regional centres in Victoria (see EPA Victoria pub. 11113). The following fixed background concentration for relevant pollutant species were adopted:
For PM10, a concentration of 25 ug/m3 was adopted viz. an air quality goal of 50 ug/m3. A value of 12 ug/m3 was adopted for PM2.5.
For NO2, a concentration of 25 ppb (51 ug/m3) was adopted viz. a design criteria of 160 ppb (328 ug/m3).
For CO, a concentration of 3 ppm (3.75 mg/m3) was adopted for use as a background, viz an objective of 11.25 mg/m3 as an 8 hour average.
5.6.4 Air Quality Assessment Results
A total of three (3) sensitive receptors locations were included in the modelling scenario as shown in Figure 20 Figure 20: Air Quality Assessment ‐ Location of Sensitive Receptors

Environmental Effects Report – Fulton Hogan
37 |FH_East Ridgley Asphalt Plant_EER_Final_260814
The results of the modelling concluded (please refer to the detailed air quality assessment report in Appendix 4 for the contour plots):
The predictions for inspirable and respirable dust (as PM10 and PM2.5), nitrogen dioxide and carbon monoxide, inclusive of representative background levels, indicate that the emissions from the temporary plant would not exceed their respective EPP‐AIR design concentrations in the area around the plant, with each pollutant having a significant margin of safety . The predictions for individual metal, organic and inorganic pollutants also indicate that the emissions from the temporary plant would not exceed their respective EPP‐AIR design concentrations in the area around the plant. Compliance with all EPP‐AIR classified indicator pollutants was demonstrated with the adopted assumptions.
The emission constituent with the lowest margin of safety was asphalt fume (assessed as 100% of VOC emissions from the vent stack). Peak predicted levels were at the EPP‐AIR design criteria however these occurred to the west of the site within the quarry area, and only 25% of the criteria level was predicted at the nearest sensitive receiver location.
Odour was also a critically constraining criterion for this air quality assessment. However, if the plant were to operate every day for 10 hours per day then the 2 OU criteria level at the 99.5th percentile level was not predicted to extend as far from the plant to the nearest sensitive receiver, located to the south. This was a very conservative assessment as the actual operating hours per year are forecast to be much less than that adopted within the constraints of the modelling methodology. This would indicate that for the adopted odorous emissions to air from the production and load out operations the identified sensitive receivers in the area of the plant are very unlikely to be exposed to offensive odour. Therefore it may be concluded that this plant will be unlikely to cause an environmental nuisance as described in Clause 13 of the EPP‐AIR, based on the assessment criteria detailed in Schedule 3 of the policy.
Taking into account the above conclusions from the air quality assessment, temporary and short asphalt production windows, and the buffer distances from the plant to sensitive receivers it is considered that emissions from the mobile asphalt in conjunction with the existing quarry operations presents a low risk of environmental nuisance.
5.6.5 Air Quality Management Plan
The Asphalt Plant shall have an exhaust stack constructed to ensure emissions are treated through the baghouse prior to discharge to air. The baghouse dust filtration system will capture dust emissions from the drum mixer process exhaust stream, directing this through the baghouse, with final discharge to atmosphere through a vent stack. The baghouse discharge stack is designed to provide dispersion of any residual particulate matter and odour in the exhaust discharge stream. All of the dust captured by the baghouse filter will be re‐directed back into the mixing process, enabling re‐use of this dust waste stream in the asphalt production process. Odour emissions from the asphalt plant shall be minimised by applying stringent quality control on the asphalt plant temperature. In addition asphalt will be temporarily stored in
Environmental Effects Report – Fulton Hogan
38 |FH_East Ridgley Asphalt Plant_EER_Final_260814
the elevated silo in preparation for load out. The silo will be insulated effectively maintain the asphalt at a workable temperature which is lower than the original hot mix production temperature and therefore any blue smoke fugitive emissions should not be present. The load out area will not be enclosed, however the asphalt feed conveyor to the silo and the silo will be enclosed. Asphalt will drop directly into the asphalt truck over a short period minimising fugitive odour. Load out of trucks will occur in an efficient manner (load out times approx. 2 minutes) minimising fugitive odour. The asphalt tray trucks will be immediately tarped and driven off‐site. Maintenance and housekeeping will also be implemented and scheduled to minimise the potential for dust emissions, including:
Regular cleaning out of dust deposits from under the asphalt plant;
maintenance of dust management equipment will not be scheduled or conducted during hot, dry, windy conditions when the equipment is most needed;
A water cart will be used as required to minimise airborne dust;
Vehicles will be maintained as per maintenance schedules;
Operations shall be visually inspected for visible of dust emissions as part of the monthly environmental inspection and record observations and actions on the Environment Checklist; and
In the event of a dust suppression failure, management shall consider ceasing works in the affected areas that have the potential to generate dust (e.g. maintenance, loader movements)
On days of unfavourable weather conditions, a review of onsite practices will be undertaken to schedule activities so as to mitigate dust generation.
The site will be sheeted with crushed rock and all traffic movement on site will be restricted to the crushed rock surface and a max speed of 10 km/h to reduce dust generation. Travel routes will be clearly defined to minimise the impact on existing conditions. Incoming and outgoing loads shall be covered to minimise dust generation while transported on public roads. All stockpiled materials are to be located within the allocated areas as shown on the EMP (Appendix 3). Stockpile heights will be managed at the asphalt plant such that stockpiles shall not exceed 8m in height. The stockpile height at the site shall be managed to minimise impacts on visual amenity. Stockpiles of any fine material with dust potential will be wet down as required so as to form a surface crust, which minimises release of airborne dust. Air quality and odour from the site will be managed and implemented in accordance with the following:
Fulton Hogan East Ridgley Mobile Asphalt Plant Environmental Management Plan (EMP) (refer Appendix 3);

Environmental Effects Report – Fulton Hogan
39 |FH_East Ridgley Asphalt Plant_EER_Final_260814
Fulton Hogan Air Quality Procedure; and
Specific management commitments to manage any potential air quality issues outlined in Part D of the EER.
5.7 Liquid Effluent
The asphalt plant is a closed system and as such there are no ongoing losses of pollutants and or liquid effluent. There will be no discharge of process waters. Tanks are imperviously bunded, so in the event that there was an incident, stormwater will not be polluted.
5.8 Solid Wastes
5.8.1 Nature of Wastes
The generation of significant volumes of waste is not expected. Waste that will require management from activities will include general office waste and waste paper.
5.8.2 Waste Management Plan The waste hierarchy AVOID‐ REDUCE‐ REUSE‐ RECYCLE will be used by the site. The following general waste management practices will be implemented at the site during operation of the plant:
A bin shall be maintained in the site office to ensure safe storage and disposal of any waste generated on the site;
All waste disposed of from the site shall be taken to an appropriate facility in accordance with EPA guidelines;
Use electronic means of communication where ever possible to reduce paper waste;
All sediment waste is to be placed in gravel stockpile.
All used spill material is to be disposed of in accordance with EPA guidelines;
Maintenance will be undertaken by mobile service companies who will take their waste; and
Promote use of asphalt within product to increase recycling opportunities Waste management at the site will be implemented in accordance with the following:
Fulton Hogan East Ridgley Mobile Asphalt Plant Environmental Management Plan (EMP) (refer Appendix 3);
Fulton Hogan Waste Management Procedure;
Fulton Hogan Resource Use Procedure; and
Specific management commitments relating to waste management outlined in Part D of the EER.

Environmental Effects Report – Fulton Hogan
40 |FH_East Ridgley Asphalt Plant_EER_Final_260814
5.9 Noise Emissions As the mobile asphalt plant at East Ridgley will be located immediately adjacent to an existing quarry operation that also generates noise an environmental noise assessment including noise modelling was undertaken by Acoustic Consulting Australia Pty Ltd in July 2014 to determine that the predicted noise levels from the plant would not contribute in such a way that the cumulative noise levels would exceed existing permissible noise limits for the area and meets the requirements of the Environment Protection Policy (Noise) 2009. A summary of the process and findings undertaken in the environmental noise assessment is summarised below and the full report is provided in Appendix 5. The assessment was conducted in accordance with the Environment Protection Policy (Noise) 2009.
5.9.1 Noise Assessment Objectives and Sensitive Receivers
As the proposed mobile asphalt plant will be located within the existing mining lease and an existing environmental Licence (No 3166) is attached to the mining lease, noise from the asphalt plant will need to comply with the requirements of the licence which specifies that noise emitted from the licenced premises not exceed 45dB(A) during the day period (7am to 7pm). This limit is to be applied to the Equivalent Continuous Noise Level (LAeq) measured over a period of not less than 60 minutes. The noise modelling took into account the nearest sensitive receivers (residences nearest to the proposal site) as shown in Figure 21
Figure 21: Location of nearest sensitive receptors for noise modelling
Environmental Effects Report – Fulton Hogan
41 |FH_East Ridgley Asphalt Plant_EER_Final_260814
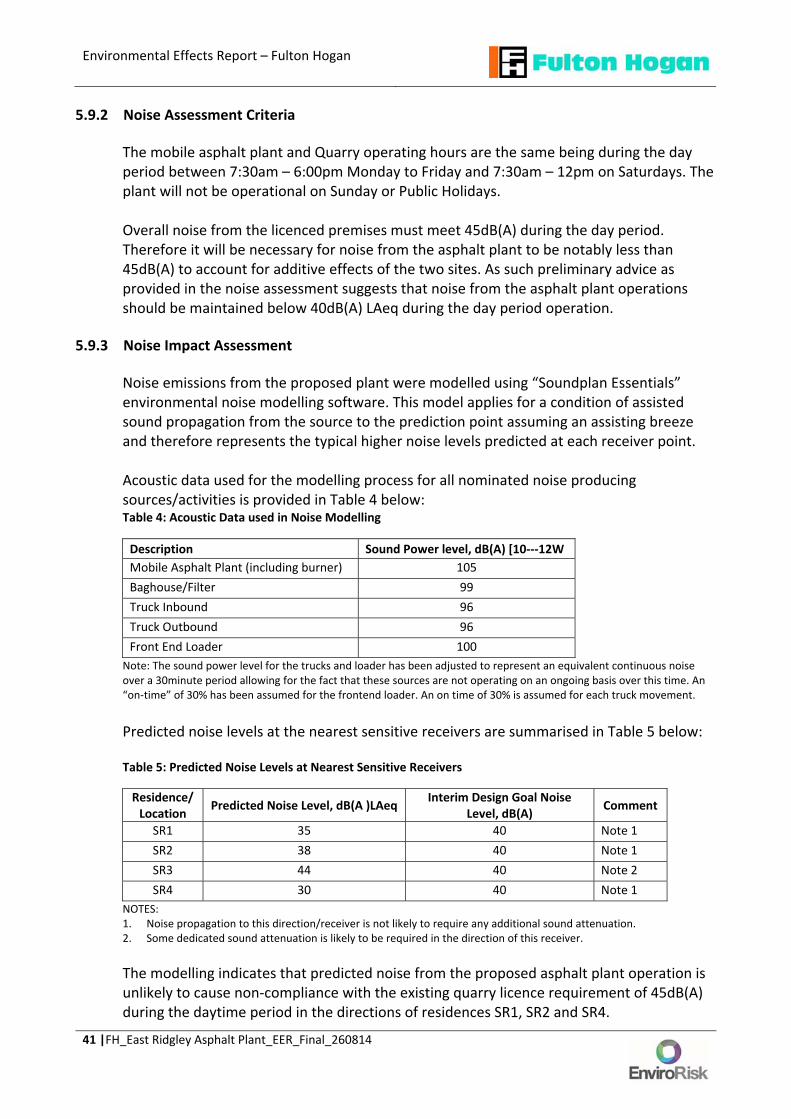
5.9.2 Noise Assessment Criteria
The mobile asphalt plant and Quarry operating hours are the same being during the day period between 7:30am – 6:00pm Monday to Friday and 7:30am – 12pm on Saturdays. The plant will not be operational on Sunday or Public Holidays. Overall noise from the licenced premises must meet 45dB(A) during the day period. Therefore it will be necessary for noise from the asphalt plant to be notably less than 45dB(A) to account for additive effects of the two sites. As such preliminary advice as provided in the noise assessment suggests that noise from the asphalt plant operations should be maintained below 40dB(A) LAeq during the day period operation.
5.9.3 Noise Impact Assessment
Noise emissions from the proposed plant were modelled using “Soundplan Essentials” environmental noise modelling software. This model applies for a condition of assisted sound propagation from the source to the prediction point assuming an assisting breeze and therefore represents the typical higher noise levels predicted at each receiver point. Acoustic data used for the modelling process for all nominated noise producing sources/activities is provided in Table 4 below: Table 4: Acoustic Data used in Noise Modelling
Description Sound Power level, dB(A) [10‐‐‐12W Mobile Asphalt Plant (including burner) 105Baghouse/Filter 99Truck Inbound 96Truck Outbound 96Front End Loader 100
Note: The sound power level for the trucks and loader has been adjusted to represent an equivalent continuous noise over a 30minute period allowing for the fact that these sources are not operating on an ongoing basis over this time. An “on‐time” of 30% has been assumed for the frontend loader. An on time of 30% is assumed for each truck movement. Predicted noise levels at the nearest sensitive receivers are summarised in Table 5 below: Table 5: Predicted Noise Levels at Nearest Sensitive Receivers
Residence/ Location Predicted Noise Level, dB(A )LAeq Interim Design Goal Noise
Level, dB(A) Comment
SR1 35 40 Note 1 SR2 38 40 Note 1 SR3 44 40 Note 2 SR4 30 40 Note 1
NOTES: 1. Noise propagation to this direction/receiver is not likely to require any additional sound attenuation. 2. Some dedicated sound attenuation is likely to be required in the direction of this receiver. The modelling indicates that predicted noise from the proposed asphalt plant operation is unlikely to cause non‐compliance with the existing quarry licence requirement of 45dB(A) during the daytime period in the directions of residences SR1, SR2 and SR4.

Environmental Effects Report – Fulton Hogan
42 |FH_East Ridgley Asphalt Plant_EER_Final_260814
In considering the result for SR3 it should be noted that the predicted noise levels at this residence requires the combination of the plant operating with the presence of breezes blowing in that direction (prevailing winds are from the west and SR3 is located to the south) and that the actual operation of the asphalt plant will be limited to 5 to 6 events over the 18 months, each having a two week duration. This leads to the conclusion that the asphalt facility generated noise levels at SR3 are unlikely to exceed 40dB(A) during the temporary existence of this facility. It should be further emphasized that: SR3 is the residence of the landowner on which the plant will be located and leased from;
during calm conditions the resulting noise levels could be at least 5dB(A) lower; and when the wind is opposing the direction of sound propagation the predicted level would be substantially lower by 10dB(A); or more in some cases
Taking into account the above conclusions from the environmental noise assessment and the temporary and short asphalt production windows, it is considered that noise from the operation of the mobile asphalt presents a low risk of environmental nuisance.
5.9.4 Noise Management Plan Noise from the asphalt plant shall be minimised by the following: Loader operations will be confined to the northern end of the site; All machinery on site shall be appropriately maintained to minimise noise emissions; and
Vehicles shall not be kept idling unnecessarily, and will not be operated during noise sensitive hours (i.e. 6pm – 7am). This will be communicated through site inductions.
Noise management at the site will be implemented in accordance with the following: Fulton Hogan East Ridgley Mobile Asphalt Plant Environmental Management Plan (EMP) (refer Appendix 3);
Fulton Hogan Noise Procedure; and Specific management commitment relating to noise management are outlined in Part D of the EER.
In addition, and if required, Fulton Hogan can undertake a post installation noise assessment, to validate that combined noise from the quarry and asphalt plant meets the 45dB(A) licence limit, under typical operating conditions.

Environmental Effects Report – Fulton Hogan
43 |FH_East Ridgley Asphalt Plant_EER_Final_260814
5.10 Transport Impacts
5.10.1 Existing Traffic Conditions The existing traffic road network of the general East Ridgley – Burnie area and the direction in which the majority of traffic flows to and from the quarry is shown in Figure 22. An outline of the existing roads used and traffic using these roads associated with the quarry is outlined below.
Local Traffic Network
The following Roads are generally used for traffic coming to and from the quarry.
Circular Road is a local road with a dual single sealed lane running in each direction to the east and west. There is a two‐way bridge that crosses the Pet River to the west of the site (approx. 750m) from the Circular Road / Ridgley Highway Intersection. Circular Road terminates at the Ridgley Highway to the west.
Ridgley Highway is a Category 2 Freight Road (classified by Department of Infrastructure, Energy and Resources) with a dual single traffic lane running in each direction to the north and south. Regional Freight Roads link major production catchments to the Trunk Roads. They carry a large number of both heavy freight and passenger vehicles. Together with Regional Access Roads, they provide safe and efficient access to Tasmania’s Regions.
Princes Highway is a Category 1 Trunk Road (classified by Department of Infrastructure, Energy and Resources) with a dual traffic sealed lane running in each direction to the east and west. Trunk Roads are the State’s major highways and are crucial to the effective functioning of Tasmanian industry, commerce and the community. They carry large numbers of heavy freight and passenger vehicles and are the key links supporting future economic development in Tasmania. The Princes Highway heads west towards Burnie and east towards Ulverstone.
Traffic from Proposed Mobile Asphalt Plant Table 6 summarises the number and type of vehicular movements to and from the quarry site and the asphalt plant. Table 6: Number and Type of Vehicular Movements from the Asphalt Plant and adjacent Quarry Operation
Quarry Asphalt Plant Thirty (30) trucks (30 tonne semi‐trailers) per day to and from the quarry
Six (6) trucks (30 tonne semi‐trailers) per hour out and six (6) in empty – Total of 12 truck movements per hour1
Sand/Cement delivery truck (as required) Bitumen truck (as required) Diesel Fuel Truck (once every 2 months)
1. These twelve (12) trucks are part of the thirty (30) truck movements from the quarry site and are not in addition to the quarry truck movements.

Environmental Effects Report – Fulton Hogan
44 |FH_East Ridgley Asphalt Plant_EER_Final_260814
By having the asphalt plant located adjacent to the quarry (which is providing the aggregate for the asphalt manufacturing process) truck traffic will be effectively reduce by a third from having the plant located at other locations closer to Burnie or the Port. All traffic will enter and exit the site via the Quarry Access Road. When leaving the site trucks will turn right on Circular Road and then on to Ridgley Highway (B18) and follow the designated truck route (C112 and National Highway 1) to the Burnie Port and other locations. Burnie City Council have advised that Circular Road has already been designed to cater for the type and quantity of truck movements referred to above. Prior to the commencement of an asphalt processing and pouring campaign surrounding residents and the Ridgley Primary School will be notified to advice of truck movements and to be aware of this during school pick up and drop off times. Where ever possible truck movements will be scheduled so as to avoid school drop off and pick up times.
5.10.2 Traffic Management Plan
Traffic management at the site will be implemented in accordance with the following:
the Fulton Hogan East Ridgley Mobile Asphalt Plant Environmental Management Plan (EMP) (refer Appendix 3); and
Specific management commitments relating to traffic management outlined in Part D of the EER.

Environmental Effects Report – Fulton Hogan
45 |FH_East Ridgley Asphalt Plant_EER_Final_260814
Figure 22: Truck Transport Route

Environmental Effects Report – Fulton Hogan
46 |FH_East Ridgley Asphalt Plant_EER_Final_260814
5.11 Other Off‐site Impacts Due to the temporary nature of the proposed mobile asphalt plant, there are no other anticipated off‐site impacts. The asphalt plant will operate in accordance with applicable regulatory requirements and the Fulton Hogan East Ridgley Mobile Asphalt Plant Environmental Management Plan (EMP) (refer Appendix 3). In the unlikely event of a complaint and or environmental incident this will be managed in accordance with the Fulton Hogan Case and Management Action Procedure (refer to Appendix 6).
5.12 Hazardous Substances and Chemicals and Fire Management A self bunded diesel tank (40,000 Litres) to run the burner will be located on the site. Bunding will be constructed for the balance of tank storage, including a Bitumen Tank (60,000 Litres) and Hot Oil Tank (700 Litres). Delivery of diesel to the site to refuel the diesel tank will occur as needed and is anticipated to be once every two months. Fuel will be delivered by a mobile supplier only and the supplier vehicle will leave the site after fuel delivery. All refuelling of plant and equipment will occur onsite at the diesel tank area. Delivery of low‐sulphur bitumen and hot oil to the site will occur as needed and will be delivered by a mobile supplier only and the supplier vehicle will be leave the site after delivery. Refilling of the Bitumen and Hot Oil tanks will occur at the tank refill points. The diesel tank will have also have an impervious, geotextile lined, earthen bund constructed at the refill point where the hose connects to the truck and the tank. The tanker delivery drivers will remain at the truck at all times during refilling of the diesel, bitumen and hot oil tanks. Spill response equipment will be located on the site and will be readily available during refilling of tanks. Any spill will be immediately cleaned up and responded to in accordance with the Fulton Hogan Incident and Emergency Respond Flowchart – Chemical Oil and Fuel Spills. Hydrocarbon contaminated dust can be returned to the fine processed material for reuse. Spill Kit absorbent material is to be disposed of in accordance with EPA Guidelines. In the unlikely event of an environmental incident this will be recorded and managed in accordance with the Fulton Hogan Case and Management Action Procedure (refer to Appendix 6). A “Truck Slip” IBC will also be located on site for use by trucks prior to loading asphalt. Truck slip is sprayed in the backs of the trucks. It is used to ensure the asphalt doesn’t stick to the truck and will slide out on delivery. Fulton Hogan endeavour to use ‘GreenSlip’ wherever available, as it is a biodegradable product. The Truck Slip IBC will be stored on a portabund or an impervious, geotextile lined, earthen bund. Any servicing oils from plant and equipment will be removed by contractor in accordance with EPA Guidelines.

Environmental Effects Report – Fulton Hogan
47 |FH_East Ridgley Asphalt Plant_EER_Final_260814
The laboratory will also store minor quantities of chemicals (i.e. <20L containers of Mineral Turpentine and Shellite) which will be contained in the laboratory container cupboard. An MSDS Register for all chemicals will be available on site. As part of good operational management Fulton Hogan will establish fire prevention measures and a Bushfire Hazard Management Plan to be followed during periods of high fire risk. Hazardous substances, chemicals and fire management at the site will be implemented in accordance with the following:
Fulton Hogan East Ridgley Mobile Asphalt Plant Environmental Management Plan (EMP) (refer Appendix 3);
Fulton Hogan Chemical Management Procedure;
Fulton Hogan Incident and Emergency Response Flowchart‐ Bushfire;
Fulton Hogan Incident and Emergency Response Flowchart‐Fires and Explosions;
Fulton Hogan East Ridgley Bushfire Hazard Management Plan; and
Specific management commitments relating to Hazardous Substances and Chemicals Management outlined in Part D of the EER.
5.13 Site Contamination The site has been historically used for farming purposes (i.e. livestock grazing, storage of waste tyres, plastic etc). There is no record of a Preliminary Site Investigation of the site history and any potentially contaminating activities, having been undertaken.
5.14 Sustainability and Climate Change
This particular plant has been custom built for Fulton Hogan and exhibits the high level of environmental controls Astec plants are known for. This plant is approximately 3 years old and has been in very sensitive environments, such as Barrow Island, which had stringent quarantine and environmental controls in order to protect the islands rare and threatened species. The baghouse system on the plant will effectively control emissions and is considered to be a best practice control for this type of plant. The location of the mobile asphalt plant will effectively eliminate truck transport by a third compared to having it located at the other options investigated and will subsequently result in less greenhouse gas emission from locating the plant at another site in Burnie. Due to the temporary nature of the operation (i.e. located at the site for an 18 month period) Climate Change factors are not considered to present an issue.

Environmental Effects Report – Fulton Hogan
48 |FH_East Ridgley Asphalt Plant_EER_Final_260814
Fulton Hogan reports under the National Greenhouse and Energy Reporting Scheme (NGERS) each year. As such records of all utility bills for the asphalt plant shall be kept for reporting purposes. The NGERS report is due by the 31st October each year.
5.15 Cultural Heritage Due to the current agricultural use of the land cultural heritage is not expected to be impacted. However a ‘Cultural Heritage Desktop Assessment’ Request was submitted to Aboriginal Heritage Tasmania (AHT) on Wednesday 18 June 2014 with a subsequent response being issued on Tuesday 1 July 2014 advising that: ‘Aboriginal Heritage Tasmania (AHT) has completed a search of the Tasmanian Aboriginal Site Index (TASI) regarding the proposed Asphalt plant at East Ridgley and can advise that there are no Aboriginal heritage sites recorded within or close to the property. Due to small scale and temporary nature of the proposal, it is believed that there is a low probability of Aboriginal heritage being impacted. Accordingly there is no requirement for an Aboriginal heritage investigation and AHT have no objection to the project proceeding.’ However if a cultural heritage site is discovered during work, Fulton Hogan will cease work immediately in the vicinity of the discovery and notify the site owner and Aboriginal Heritage Tasmania. Fencing/barricades will be installed and maintained to protect and prevent damage to the site. Cultural Heritage will be managed and implemented in accordance with the following:
Fulton Hogan East Ridgley Mobile Asphalt Plant Environmental Management Plan (EMP) (refer Appendix 3);
Fulton Hogan Heritage Procedure;
Fulton Hogan Incident and Emergency Response Flowchart‐ Encountering Cultural Heritage Sites or Remains; and
Specific management commitments relating to Cultural Heritage outlined in Part D of the EER.
5.16 Sites of High Public Interest
There are no significant sites of Public Interest within close proximity of the site. Due to the current agricultural use of the land and the absence of any significant buildings historical heritage is not expected to be impacted. A search of the Tasmanian Heritage Register was conducted on Wednesday 25 June 2014 and did not have any heritage sites listed at the proposed asphalt plant location. The nearest heritage sites listed in the register are listed in Table 7:

Environmental Effects Report – Fulton Hogan
49 |FH_East Ridgley Asphalt Plant_EER_Final_260814
Table 7: Sites listed on the Tasmanian Heritage Register ‐ Ridgley and surrounding area ID No. Place Name Place Address Town Postcode THR Status Municipality11919 Hampshire Hills
Station and Brick Pits
Ridgley Highway Upper Natone Road
Hampshire 7321 Permanently Registered
Burnie City Council
11925 Hampshire Hills Silver Mine
Ridgley Highway Hampshire 7321 Permanently Registered
Burnie City Council
702 Former Van Diemen's Land Company Hut
RA 85 "Willow Vale" Circular Road
East Ridgley
7321 Permanently Registered
Burnie City Council
704 Armitage 444 Ridgley Highway
Mooreville 7321 Permanently Registered
Burnie City Council
5.17 Rehabilitation and Decommissioning Rehabilitation of the site following completion of all asphalt production activities will
include:
Removal of all associated plant and equipment including all materials and bunds.
The imported crushed rock base on which the plant had been placed will remain for use by the land owner for storage of farming equipment and supplies. This will ensure the sites continued use is consistent with the ‘Rural Resource’ zoning of the land allowing for continued primary industry and/or agricultural use.
The site will be subject to a complete site contamination assessment upon closure of the asphalt plant. Any identified contamination will be appropriately remediated either onsite using land farming techniques and or disposed off site at an appropriately licensed waste facility in accordance with EPA requirements.
Decommissioning of the Plant will be managed in accordance with the following:
Fulton Hogan East Ridgley Mobile Asphalt Plant Environmental Management Plan (EMP) (refer Appendix 3).
Specific management commitments relating to decommissioning outlined in Part D of the EER.

Environmental Effects Report – Fulton Hogan
50 |FH_East Ridgley Asphalt Plant_EER_Final_260814
PART D – MANAGEMENT COMMITTMENTS
This section provides a summary of key management commitments to address the potential environment impacts outlined in Part C. Full details of management measures are outlined in the Fulton Hogan East Ridgley Mobile Asphalt Plant Environmental Management Plan (EMP) (refer Appendix 3). 6.0 FLORA AND FAUNA MANAGEMENT ACTIVITY / PROCESS NO. MANAGEMENT COMMITTMENT PROCEDURE RESPONSIBILITY COMPLETION
DATE Flora and Fauna
1 If threatened fauna is encountered during the operation of the asphalt plant Fulton Hogan shall notify applicable agencies for proposed actions of management.
Flora and Fauna Management Procedure Incident and Emergency Response Flowchart‐ Encountering Wildlife
Plant Foreman Always
Weed Control
2 Monitor for weeds as part of the monthly environmental inspection. Record observations and actions on the Environmental Checklist
Noxious Weed Control Procedure
Plant Foreman Monthly
7.0 AIR QUALITY AND ODOUR MANAGEMENT ACTIVITY / PROCESS NO. MANAGEMENT COMMITTMENT PROCEDURE RESPONSIBILITY COMPLETION
DATE General Operations
3 Maintain stringent quality control on the asphalt plant temperature
Air Quality Procedure Incident and Emergency Response Flowchart‐ Extreme Dust
Plant Foreman From Start‐up of plant
4 Install an insulated silo that will maintain the asphalt at a workable temperature which is lower than the original hot mix production temperature as described in Part C Section 5.6.5
As above Plant Foreman From Start‐up of plant
5 Install and asphalt feed conveyor and silo that is enclosed as described in Part C Section 5.6.5
As above Plant Foreman From Start‐up of plant
6 Load out of trucks to occur in an efficient manner (load out times approx. 2 minutes).
As above Plant Foreman Ongoing during plant operation

Environmental Effects Report – Fulton Hogan
51 |FH_East Ridgley Asphalt Plant_EER_Final_260814
7 The asphalt tray trucks will be immediately tarped and driven off‐site after loading.
As above Plant Foreman Ongoing during plant operation
8 Construct the exhaust stack so emission are treated through the bag house as described in Part C Section 5.6.5
As above Plant Foreman Prior to start of operation
9 Visually inspect operations for visible dust emissions as part of the monthly environmental inspection and record observations and actions on the Environment Checklist
As above Plant Foreman Monthly
10 Regularly clean dust deposits from under the asphalt plant to minimise the presence of dust sources.
As above Plant Foreman Ongoing during plant operation
11 Maintenance of dust management equipment is not to be conducted during hot, dry, windy conditions when the equipment is most needed.
As above Plant Foreman Ongoing during plant operation
12 Haulage and plant movement on site will be restricted to confined paths of travel and a max speed of 10 km/h.
As above Plant Foreman Ongoing during plant operation
13 A water cart will be used as required to minimise airborne dust.
As above Plant Foreman Ongoing during plant operation
14 In the event of a dust suppression failure, management shall consider ceasing works in the affected areas that have the potential to generate dust (e.g. maintenance, loader movements)
As above Plant Foreman Ongoing during plant operation
Stockpiles 15 Maximum stockpile height at the asphalt plant shall not exceed 8m in height
As above Plant Foreman Ongoing during plant operation
16 Stockpiles of any fine material with dust potential will be wet down as required so as to form a surface crust.
As above Plant Foreman Ongoing during plant operation
Traffic 17 Incoming and outgoing loads shall be covered to minimise dust generation while transported on public roads.
As above Plant Foreman Ongoing during plant operation
18 Maintain vehicles as per maintenance schedules.
As above Plant Foreman Ongoing during plant operation

Environmental Effects Report – Fulton Hogan
52 |FH_East Ridgley Asphalt Plant_EER_Final_260814
8.0 STORMWATER MANAGEMENT ACTIVITY / PROCESS NO. MANAGEMENT COMMITTMENT PROCEDURE RESPONSIBILITY COMPLETION
DATE Surface Water Run‐off
19 Construct stormwater channels and sediment fences as described in Part C Section 5.2 of the EER.
Erosion and Sediment Control Procedure Water Discharges Procedure
Plant Foreman Prior to start of operation
20 Construct two crossovers (at the entry and exit points of the site ) over the exiting roadside drain as described in Part C Section 5.2 of the EER
As above Plant Foreman Prior to startof operation
21 Construct bunding for all chemical and fuel storage areas as described as described in Part C Section 5.2 of the EER
As above Plant Foreman Prior to startof operation
22 Maintain the aggregate surfacing so that any mud tracked onto the surface does not become a stormwater pollutant.
As above Plant Foreman Ongoing during plant operation
23 Conduct visual inspections of any water runoff from the site to verify that no pollutants are leaving the site and record findings/actions on the Environmental Inspection Checklist.
As above Plant Foreman During rainfall event with runoff from the site
9.0 WASTE MANAGEMENT ACTIVITY / PROCESS NO. MANAGEMENT COMMITTMENT PROCEDURE RESPONSIBILITY COMPLETION
DATE Waste 24 The waste hierarchy AVOID‐
REDUCE‐ REUSE‐ RECYCLE will be used by the site
Waste Management Procedure Resource Use Procedure
Plant Foreman Ongoing during plant operation
25 A bin shall be maintained in the site office to ensure safe storage and disposal of any waste generated on the site.
As above Plant Foreman Ongoing during plant operation
26 All sediment waste is to be placed in gravel stockpile.
As above Plant Foreman Ongoing during plant operation
27 All used spill material is to be disposed of in accordance with EPA guidelines.
As above Plant Foreman Ongoing during plant operation
28 All waste disposed of from the site shall be taken to an appropriate facility in accordance with EPA guidelines.
As above Plant Foreman Ongoing during plant operation

Environmental Effects Report – Fulton Hogan
53 |FH_East Ridgley Asphalt Plant_EER_Final_260814
10.0 NOISE MANAGEMENT ACTIVITY / PROCESS NO. MANAGEMENT COMMITTMENT PROCEDURE RESPONSIBILITY COMPLETION
DATE Noise 29 Confine Loader operations to the
northern end of the site Noise Procedure Plant Foreman Ongoing
during plant operation
30 All machinery on site shall be appropriately maintained to minimise noise emissions
As above Plant Foreman Ongoing during plant operation
31 Vehicles shall not be kept idling unnecessarily, and will not be operated during noise sensitive hours (i.e. 6pm – 7am). This will be communicated through site inductions.
As above Plant Foreman Ongoing during plant operation
11.0 TRAFFIC AND TRANSPORT MANAGEMENT ACTIVITY / PROCESS NO. MANAGEMENT COMMITTMENT PROCEDURE RESPONSIBILITY COMPLETION
DATE Traffic and Transport
32 All traffic will enter and exit the site via the Quarry Access Road.
‐‐‐ Plant Foreman Ongoing during plant operation
33 Prior to the commencement of an asphalt processing and pouring campaign surrounding residents and the Ridgley Primary School will be notified to advice of truck movements and to be aware of this during school pick up and drop off times.
‐‐‐ Plant Foreman Ongoing during plant operation
12.0 HAZARDOUS SUBSTANCES AND CHEMICAL STORAGE MANAGEMENT ACTIVITY / PROCESS NO. MANAGEMENT COMMITTMENT PROCEDURE RESPONSIBILITY COMPLETION
DATE Chemical Storage
34 Construct an impervious, geotextile lined, earthen bund for the bitumen and hot oil tank storage as described in Part C Section 5.12 of the EER.
Chemical Management Procedure Incident and Emergency Response Flowchart‐ Chemical, Oil and Fuel Spills Incident and Emergency Response Flowchart‐ Bitumen Spills
Plant Foreman Prior to start of operation

Environmental Effects Report – Fulton Hogan
54 |FH_East Ridgley Asphalt Plant_EER_Final_260814
35 Construct an impervious, geotextile lined, earthen bund at the diesel tank refill point where the hose connects to the truck and the tank as described in Part C Section 5.12 of the EER.
As above Plant Foreman Prior to start of operation
36 Store the “Truck Slip” IBC on a portabund or construct an impervious, geotextile lined, earthen bund.
As above Plant Foreman Prior to start of operation
37 Servicing oils will be removed by contractor in accordance with EPA Guidelines.
As above Plant Foreman Ongoing during plant operation
38 Establish designated refuelling and refilling areas for diesel, bitumen and hot oil as described in Part C Section 5.12 of the EER
As above Plant Foreman Ongoing during plant operation
39 Tanker delivery drivers will remain at the truck at all times during refilling of the diesel, bitumen and hot oil tanks.
As above Plant Foreman Ongoing during plant operation
40 Spill response equipment will be available at the refill point during refilling.
As above Plant Foreman Ongoing during plant operation
41 Any spill will be responded to and contained in accordance with the Fulton Hogan Incident and Emergency Respond Flowchart – Chemical Oil and Fuel Spills.
As above Plant Foreman Ongoing during plant operation
42 A Spill Response Kit will be located at the Laboratory.
As above Plant Foreman Ongoing during plant operation
43 Maintain and MSDS Register for chemicals to on site.
As above Plant Foreman Ongoing during plant operation
13.0 CULTURAL HERITAGE MANAGEMENT ACTIVITY / PROCESS NO. MANAGEMENT COMMITTMENT PROCEDURE RESPONSIBILITY COMPLETION
DATE Cultural and Historical Heritage
44 If a cultural heritage site is discovered during work, Fulton Hogan will cease work immediately in the vicinity of the discovery and notify the site owner and Aboriginal Heritage Tasmania.
Heritage Procedure Incident and Emergency Response Flowchart‐ Encountering Cultural Heritage Sites or Remains
Plant Foreman Ongoing during plant operation

Environmental Effects Report – Fulton Hogan
55 |FH_East Ridgley Asphalt Plant_EER_Final_260814
14.0 REHABILITATION AND DECOMISSIONING MANAGEMENT ACTIVITY / PROCESS NO. MANAGEMENT
COMMITTMENT PROCEDURE RESPONSIBILITY COMPLETION DATE
Plant Removal
54 Remove all associated plant and equipment including all materials and bunds as described in Part C Section 5.17 of the EER.
‐‐‐ Plant Foreman Within 30 days of operation ceasing
55 Leave the imported crushed rock base on which the plant had been placed for use by the land as described in Part C Section 5.17 of the EER.
‐‐‐ Plant Foreman Upon completion of operation
56 Conduct a site contamination assessment upon closure of the asphalt plant as described in Part C Section 5.17 of the EER
‐‐‐ Plant Foreman Within 3 months of plant removal

Environmental Effects Report – Fulton Hogan
56 |FH_East Ridgley Asphalt Plant_EER_Final_260814
PART E – PUBLIC CONSULTATION 16.0 STAKEHOLDER CONSULTATION 16.1 Land Owner, Neighbouring Operations and Government Agencies
Fulton Hogan has consulted with the landowner (Gary and Pat Clarke) and the Mining leaseholder (BIS Industries Limited) in recent months regarding the project and both are supportive of the project progressing. BIS industries see that having the Asphalt Plant located immediately adjacent to the quarry operation is mutually beneficial to both Fulton Hogan and BIS Industries. Separately Fulton Hogan has also: Met with the landowner on Friday 20 June 2014 who entered into a Notice of Intent to lease with Fulton Hogan
Met with BIS Industries Limited to discuss how the proposed asphalt plant and the existing quarry will operate under the existing Mining Lease and associated approvals.
Consultation with relevant government agencies throughout the preparation of the approval documents to date has included: A meeting with the Environment Protection Authority (EPA) and the Burnie City Council (BCC) to discuss proposed project and approval pathways; and
A site visit and walkover by the EPA of the site to provide a physical context and discuss required information to address any identified issues associated with the development.
Further ongoing consultation will include: regular updates of the approval progress provided to relevant government agencies; and phone calls, emails and written correspondence with EPA and BCC.
16.2 Additional Key Stakeholders
Fulton Hogan has identified the following additional key stakeholders of the project: Land owner from which the property is leased; Immediate neighbours of the asphalt plant (i.e. including residents and quarry operation); Clients of, and suppliers to, the Asphalt plant; and Employees and contractors.
Proposed methods of consultation with these key stakeholders is anticipated to be: The distribution of a ‘Community Information Bulletin’ by Fulton Hogan in person to surrounding immediate neighbouring properties. This will provide an opportunity for Fulton Hogan to discuss the proposed development with the neighbouring land owners and discuss any questions or concerns they may have. The Community information Bulletin and records of visits with surrounding neighbours will be kept.
Notification to neighbours prior to the commencement of any asphalt production event referred to in Section 5 above.

Environmental Effects Report – Fulton Hogan
57 |FH_East Ridgley Asphalt Plant_EER_Final_260814
17.0 REFERENCES 1. Burnie Interim Planning Scheme 2013
2. Land Information System Tasmania (LIST) accessed on Wednesday 18 June 2014 at http://maps.thelist.tas.gov.au/listmap/app/list/map
3. Natural Values Atlas accessed on Friday 20 June 2014 at https://www.naturalvaluesatlas.tas.gov.au/pls/apex/f?p=200:101:1993896696100411
4. Commonwealth Department of the Environment Protected Matters Search Tool’ accessed on Friday 13th June 2014 at http://www.environment.gov.au/webgis‐framework/apps/pmst/pmst.jsf
5. Tasmanian Heritage Register accessed on Wednesday 25 June 2014 at http://www.heritage.tas.gov.au/thr.html
6. Mineral Resources Tasmania Online Map Viewer accessed on Thursday 26 June 2014 at http://www.mrt.tas.gov.au/Viewer/Exposure/E3?REQUEST=Entry&PRJ=Blank&MODE=mrt&DELETE_DEFAULT=Y&SID=77245060&REQUEST=Entry&reload=1
7. Tasmanian State Road Hierarchy, prepared by Department of Infrastructure, Energy and Resources, 2007

APPENDIX 1 Natural Values Atlas Report

Natural Values Atlas ReportAuthoritative, comprehensive information on Tasmania's natural values.
Report Number: 60802
Reference:
Requested For: EnviroRisk Management Pty Ltd
Timestamp: 11:45:17 AM Friday 20 June 2014
Raptors: buffers 500m and 1000m
Threatened Flora: buffers 500m and 1000m
Threatened Fauna: buffers 500m and 1000m
Conservation Significance Flora: buffers 500m and 1000m
Conservation Significance Fauna: buffers 500m and 1000m
Conservation Significance filtered by:
Species Sensitivity
Tasmanian Weed Management Act Weeds: buffers 500m and 1000m
Priority Weeds: buffers 500m and 1000m
TASVEG: buffer 1000m
Threatened Communities: buffer 1000m
Geoconservation: buffer 1000m
Tasmanian Reserve Estate: buffer 1000m
Biosecurity Risks: buffer 1000m
The centroid for this query GDA94 403740.0,5444094.0 falls within:
Page 1 of 31
Department of Primary Industries, Parks, Water and Environment

1:25000 Map: 4044 STOWPORT
Property: 7387623 195 CIRCULAR RD EASTRIDGLEY TAS 7321
Page 2 of 31
Department of Primary Industries, Parks, Water and Environment

*** No threatened flora found within 500 metres ***
Threatened flora within 500 metres
Page 3 of 31
Department of Primary Industries, Parks, Water and Environment

*** No threatened flora found within 1000 metres ***
Threatened flora within 1000 metres
Page 4 of 31
Department of Primary Industries, Parks, Water and Environment

Legend: Parcels
Legend: Verified and Unverified observations
Threatened fauna within 500 metres403040, 5444794 404440, 5444794
403040, 5443394 404440, 5443394
Page 5 of 31
Department of Primary Industries, Parks, Water and Environment

Threatened fauna within 500 metres
(based on Habitat Mapping)
For more information about threatened species, please contact the Manager, Threatened Species and Marine Section.
Telephone: (03) 6165 4340
Email: [email protected]
Address: GPO Box 44, Hobart, Tasmania, Australia, 7000
Threatened fauna within 500 metres
Species Common Name SS NS Potential Known Core
Dasyurus maculatus spotted-tailed quoll r VU 1 0 1
Perameles gunnii eastern barred bandicoot VU 1 0 0
Pseudemoia pagenstecheri tussock skink v 1 0 0
Astacopsis gouldi giant freshwater crayfish v VU 1 0 0
Lathamus discolor swift parrot e EN 1 0 0
Sarcophilus harrisii tasmanian devil e EN 1 0 0
Prototroctes maraena australian grayling v VU 1 0 0
Page 6 of 31
Department of Primary Industries, Parks, Water and Environment
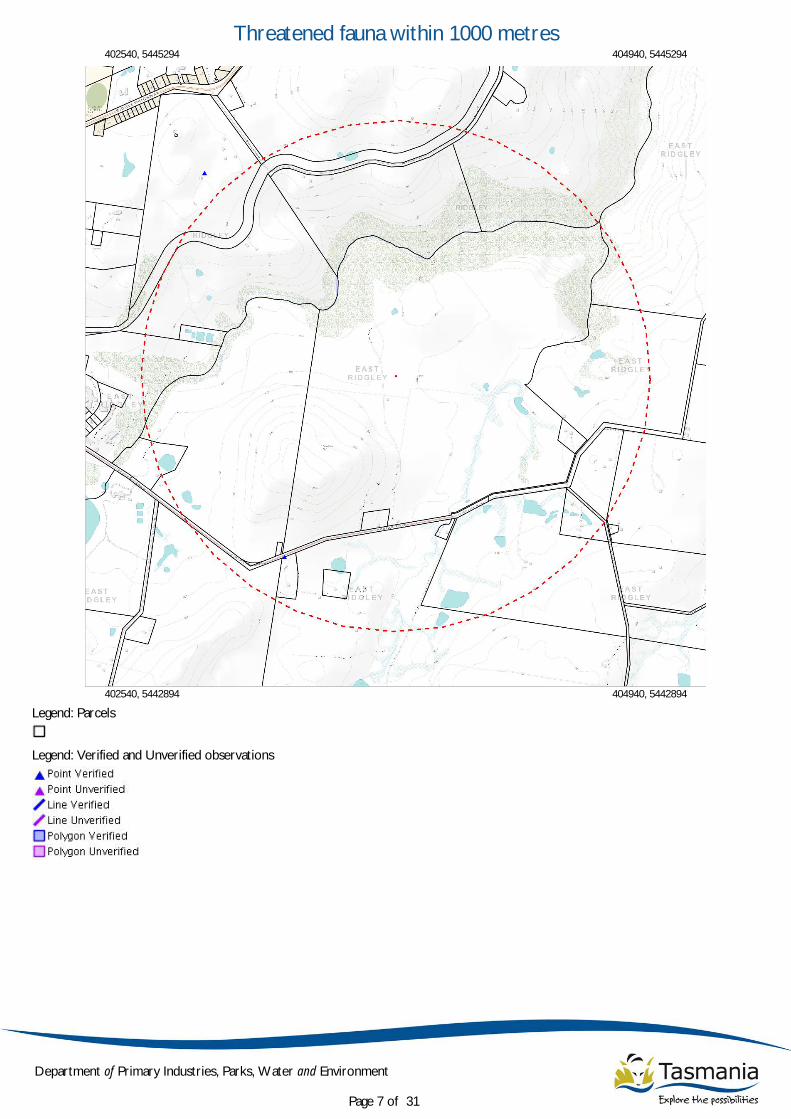
Legend: Parcels
Legend: Verified and Unverified observations
Threatened fauna within 1000 metres402540, 5445294 404940, 5445294
402540, 5442894 404940, 5442894
Page 7 of 31
Department of Primary Industries, Parks, Water and Environment

Verified Records
Unverified Records
No unverified records were found!
Threatened fauna within 1000 metres
(based on Habitat Mapping)
For more information about threatened species, please contact the Manager, Threatened Species and Marine Section.
Telephone: (03) 6165 4340
Email: [email protected]
Address: GPO Box 44, Hobart, Tasmania, Australia, 7000
Threatened fauna within 1000 metres
Id Species Common Name SS NS Observers Date Obs Type Position (GDA94)
883007 Dasyurus maculatussubsp. maculatus
spotted-tailed quoll r VU Nick Mooney(16443)
01-Dec-1991? Sighting Point (403312,5443383) +/-100m.
Species Common Name SS NS Potential Known Core
Dasyurus maculatus spotted-tailed quoll r VU 1 0 1
Perameles gunnii eastern barred bandicoot VU 1 0 0
Alcedo azurea subsp. diemenensis azure kingfisher or azure kingfisher(tasmanian)
e EN 0 0 1
Pseudemoia pagenstecheri tussock skink v 1 0 0
Astacopsis gouldi giant freshwater crayfish v VU 1 0 0
Lathamus discolor swift parrot e EN 1 0 0
Sarcophilus harrisii tasmanian devil e EN 1 0 0
Prototroctes maraena australian grayling v VU 1 0 0
Page 8 of 31
Department of Primary Industries, Parks, Water and Environment

*** No Raptor nests or sightings found within 500 metres. ***
Raptor nests and sightings within 500 metres
Page 9 of 31
Department of Primary Industries, Parks, Water and Environment

*** No Raptor nests or sightings found within 1000 metres. ***
Raptor nests and sightings within 1000 metres
Page 10 of 31
Department of Primary Industries, Parks, Water and Environment

*** No non-threatened flora of conservation significance found within 500 metres ***
Non-threatened flora of conservation significance within 500 metres
Page 11 of 31
Department of Primary Industries, Parks, Water and Environment

*** No non-threatened flora of conservation significance found within 1000 metres ***
Non-threatened flora of conservation significance within 1000 metres
Page 12 of 31
Department of Primary Industries, Parks, Water and Environment

*** No non-threatened fauna of conservation significance found within 500 metres ***
Non-threatened fauna of conservation significance within 500 metres
Page 13 of 31
Department of Primary Industries, Parks, Water and Environment

*** No non-threatened fauna of conservation significance found within 1000 metres ***
Non-threatened fauna of conservation significance within 1000 metres
Page 14 of 31
Department of Primary Industries, Parks, Water and Environment

*** No Tas Management Act Weeds found within 500 metres ***
Tas Management Act Weeds within 500 m
Page 15 of 31
Department of Primary Industries, Parks, Water and Environment

*** No Tas Management Act Weeds found within 1000 metres ***
Tas Management Act Weeds within 1000 m
Page 16 of 31
Department of Primary Industries, Parks, Water and Environment

*** No Priority Weeds found within 500 metres ***
Priority Weeds within 500 m
Page 17 of 31
Department of Primary Industries, Parks, Water and Environment

*** No Priority Weeds found within 1000 metres ***
Priority Weeds within 1000 m
Page 18 of 31
Department of Primary Industries, Parks, Water and Environment

Legend: Parcels
Legend: Threatened Communities
Threatened Communities (TNVC 2.0) within 1000 metres402540, 5445294 404940, 5445294
402540, 5442894 404940, 5442894
Page 19 of 31
Department of Primary Industries, Parks, Water and Environment

Threatened Communities (TNVC 2.0) within 1000 metres
Page 20 of 31
Department of Primary Industries, Parks, Water and Environment

Conservation Status: R = rare, V = vulnerable, E = endangered.
For more information contact: Coordinator, Tasmanian Vegetation Monitoring and Mapping Program, Conservation Values Information Section.
Telephone: (03) 6165 4320
Email: [email protected]
Address: GPO Box 44, Hobart, Tasmania, Australia, 7000
Threatened Communities (TNVC 2.0) within 1000 metres
Tasveg Code Vegetation community title Conservation status
SRI Riparian scrub V
AWU wetland (undifferentiated) V
WVI Eucalyptus viminalis wet forest E
Page 21 of 31
Department of Primary Industries, Parks, Water and Environment

Legend: Parcels
Legend: Tasveg_3_0
TASVEG 3.0 Communities within 1000 metres402540, 5445294 404940, 5445294
402540, 5442894 404940, 5442894
Page 22 of 31
Department of Primary Industries, Parks, Water and Environment

TASVEG 3.0 Communities within 1000 metres
Page 23 of 31
Department of Primary Industries, Parks, Water and Environment

For more information contact: Coordinator, Tasmanian Vegetation Monitoring and Mapping Program, Conservation Values Information Section.
Telephone: (03) 6165 4320
Email: [email protected]
Address: GPO Box 44, Hobart, Tasmania, Australia, 7000
TASVEG 3.0 Communities within 1000 metresCode Community Emergent Species
WOU (WOU) Eucalyptus obliqua wet forest (undifferentiated)
OAQ (OAQ) Water, sea
FPL (FPL) Plantations for silviculture
FAG (FAG) Agricultural land
FPL (FPL) Plantations for silviculture
FPU (FPU) Unverified plantations for silviculture
OAQ (OAQ) Water, sea
FPU (FPU) Unverified plantations for silviculture
AWU (AWU) Wetland (undifferentiated)
RMS (RMS) Nothofagus - Phyllocladus short rainforest
FPU (FPU) Unverified plantations for silviculture
WVI (WVI) Eucalyptus viminalis wet forest
FPU (FPU) Unverified plantations for silviculture
FUM (FUM) Extra-urban miscellaneous
RMS (RMS) Nothofagus - Phyllocladus short rainforest
FPU (FPU) Unverified plantations for silviculture
FPU (FPU) Unverified plantations for silviculture
FAG (FAG) Agricultural land
FPU (FPU) Unverified plantations for silviculture
FPF (FPF) Pteridium esculentum fernland
FPL (FPL) Plantations for silviculture
FAG (FAG) Agricultural land
RMS (RMS) Nothofagus - Phyllocladus short rainforest
FPU (FPU) Unverified plantations for silviculture
FPL (FPL) Plantations for silviculture
FPU (FPU) Unverified plantations for silviculture
FPL (FPL) Plantations for silviculture
Page 24 of 31
Department of Primary Industries, Parks, Water and Environment

*** No Geoconservation sites found within 1000 metres. ***
Geoconservation sites within 1000 metres
Page 25 of 31
Department of Primary Industries, Parks, Water and Environment

Legend: Parcels
Legend: Tasmanian Reserves Estate
Reserves within 1000 metres402540, 5445294 404940, 5445294
402540, 5442894 404940, 5442894
Page 26 of 31
Department of Primary Industries, Parks, Water and Environment

Reserves within 1000 metres
Page 27 of 31
Department of Primary Industries, Parks, Water and Environment

For more information about the Tasmanian Reserve Estate, please contact the Sustainable Land Use and Information Management Branch.
Telephone: (03) 6233 2744
Fax: (03) 6223 8603
Address: GPO Box 44, Hobart, Tasmania, Australia, 7000
Reserves within 1000 metresName Classification Status
Other Private Reserve Private Reserve (Variable Term)
Other Private Reserve Private Reserve (Variable Term)
Page 28 of 31
Department of Primary Industries, Parks, Water and Environment

Legend: Parcels
Legend: Verified and Unverified observations
Legend: Verified and Unverified locations
Known biosecurity risks within 1000 meters402540, 5445294 404940, 5445294
402540, 5442894 404940, 5442894
Page 29 of 31
Department of Primary Industries, Parks, Water and Environment

Known biosecurity risks within 1000 meters
Page 30 of 31
Department of Primary Industries, Parks, Water and Environment

-
-
-
-
-
-
-
-
-
-
-
-
Species of biosecurity risk
No known species of biosecurity risk found within 1000 metres
Generic Biosecurity Guidelines
The level and type of hygiene protocols required will vary depending on the tenure, activity and land use of the area. In all cases adhere to the land manager's
biosecurity (hygiene) protocols. As a minimum always Check / Clean / Dry (Disinfect) clothing and equipment before trips and between sites within a trip as needed
http://www.dpipwe.tas.gov.au/inter.nsf/Publications/LBUN-8896DT?open
On Reserved land, the more remote, infrequently visited and undisturbed areas require tighter biosecurity measures.
In addition, where susceptible species and communities are known to occur, tighter biosecurity measures are required.
Apply controls relevant to the area / activity:
Don't access sites infested with pathogen or weed species unless absolutely necessary. If it is necessary to visit, adopt high level hygiene protocols.
Consider not accessing non-infested sites containing known susceptible species / communities. If it is necessary to visit, adopt high level hygiene protocols.
Don't undertake activities that might spread pest / pathogen / weed species such as deliberately moving soil or water between areas.
Modify / restrict activities to reduce the chance of spreading pest / pathogen / weed species e.g. avoid periods when weeds are seeding, avoid clothing/equipment
that excessively collects soil and plant material e.g. Velcro, excessive tread on boots.
Plan routes to visit clean (uninfested) sites prior to dirty (infested) sites. Do not travel through infested areas when moving between sites.
Minimise the movement of soil, water, plant material and hitchhiking wildlife between areas by using the Check / Clean / Dry (Disinfect when drying is not possible)
procedure for all clothing, footwear, equipment, hand tools and vehicles http://www.dpipwe.tas.gov.au/inter.nsf/ThemeNodes/SLEN-5NU68G?open
Neoprene and netting can take 48 hours to dry, use non-porous gear wherever possible.
Use walking track boot wash stations where available.
Keep a hygiene kit in the vehicle that includes a scrubbing brush, boot pick, and disinfectant http://www.dpipwe.tas.gov.au/inter.nsf/Publications/LBUN-8896DT?open
Dispose of all freshwater away from natural water bodies e.g. do not empty water into streams or ponds.
Dispose of used disinfectant ideally in town though a treatment or septic system. Always keep disinfectant well away from natural water systems.
Securely contain any high risk pest / pathogen / weed species that must be collected and moved e.g. biological samples.
Hygiene Infrastructure
No known hygiene infrastructure found within 1000 metres
Known biosecurity risks within 1000 meters
Page 31 of 31
Department of Primary Industries, Parks, Water and Environment

APPENDIX 2 Environment Protected Matters Search Tool Report

EPBC Act Protected Matters Report
This report provides general guidance on matters of national environmental significance and othermatters protected by the EPBC Act in the area you have selected.
Information on the coverage of this report and qualifications on data supporting this report arecontained in the caveat at the end of the report.
Information is available about Environment Assessments and the EPBC Act including significanceguidelines, forms and application process details.
Other Matters Protected by the EPBC Act
Acknowledgements
Buffer: 1.0Km
Matters of NES
Report created: 13/06/14 10:56:38
Coordinates
This map may contain data which are©Commonwealth of Australia(Geoscience Australia), ©PSMA 2010
CaveatExtra Information
DetailsSummary

Summary
This part of the report summarises the matters of national environmental significance that may occurin, or may relate to, the area you nominated. Further information is available in the detail part of thereport, which can be accessed by scrolling or following the links below. If you are proposing toundertake an activity that may have a significant impact on one or more matters of nationalenvironmental significance then you should consider the Administrative Guidelines on Significance.
Matters of National Environmental Significance
Listed Threatened Ecological Communities:
Listed Migratory Species:
None
Great Barrier Reef Marine Park:
Wetlands of International Importance:
Listed Threatened Species:
None
11
None
None
National Heritage Places:
Commonwealth Marine Areas:
World Heritage Properties:
None
None
7
This part of the report summarises other matters protected under the Act that may relate to the areayou nominated. Approval may be required for a proposed activity that significantly affects theenvironment on Commonwealth land, when the action is outside the Commonwealth land, or theenvironment anywhere when the action is taken on Commonwealth land. Approval may also berequired for the Commonwealth or Commonwealth agencies proposing to take an action that is likelyto have a significant impact on the environment anywhere.
The EPBC Act protects the environment on Commonwealth land, the environment from the actionstaken on Commonwealth land, and the environment from actions taken by Commonwealth agencies.As heritage values of a place are part of the 'environment', these aspects of the EPBC Act protect theCommonwealth Heritage values of a Commonwealth Heritage place and the heritage values of aplace on the Register of the National Estate.
This part of the report summarises other matters protected under the Act that may relate to the areayou nominated. Approval may be required for a proposed activity that significantly affects theenvironment on Commonwealth land, when the action is outside the Commonwealth land, or theenvironment anywhere when the action is taken on Commonwealth land. Approval may also berequired for the Commonwealth or Commonwealth agencies proposing to take an action that is likelyto have a significant impact on the environment anywhere.
A permit may be required for activities in or on a Commonwealth area that may affect a member of alisted threatened species or ecological community, a member of a listed migratory species, whalesand other cetaceans, or a member of a listed marine species.
Other Matters Protected by the EPBC Act
None
None
None
Listed Marine Species:
Whales and Other Cetaceans:
8
Commonwealth Heritage Places:
None
None
Critical Habitats:
Commonwealth Land:
Commonwealth Reserves Terrestrial:
NoneCommonwealth Reserves Marine

Details
Listed Threatened Species [ Resource Information ]Name Status Type of PresenceBirds
Wedge-tailed Eagle (Tasmanian) [64435] Endangered Species or specieshabitat likely to occurwithin area
Aquila audax fleayi
Tasmanian Azure Kingfisher [25977] Endangered Species or specieshabitat likely to occurwithin area
Ceyx azureus diemenensis
Swift Parrot [744] Endangered Breeding likely to occurwithin area
Lathamus discolor
Gould's Petrel [26033] Endangered Species or specieshabitat may occur withinarea
Pterodroma leucoptera leucoptera
Masked Owl (Tasmanian) [67051] Vulnerable Species or specieshabitat known to occurwithin area
Tyto novaehollandiae castanops (Tasmanian population)
Crustaceans
Tasmanian Giant Freshwater Lobster, GiantLobster, Giant Freshwater Crayfish [64415]
Vulnerable Species or specieshabitat may occur withinarea
Astacopsis gouldi
Fish
Eastern Dwarf Galaxias, Dwarf Galaxias [56790] Vulnerable Species or specieshabitat may occur withinarea
Galaxiella pusilla
Australian Grayling [26179] Vulnerable Species or specieshabitat may occur withinarea
Prototroctes maraena
Mammals
Spotted-tail Quoll, Spot-tailed Quoll, Tiger Quoll(Tasmanian population) [75183]
Vulnerable Species or specieshabitat known to occur
Dasyurus maculatus maculatus (Tasmanian population)
Matters of National Environmental Significance
This part of the report provides information that may also be relevant to the area you have nominated.
Extra Information
Regional Forest Agreements:
22
Place on the RNE:
None
None
Invasive Species:
1
Nationally Important Wetlands:
State and Territory Reserves:
None
Key Ecological Features (Marine) None

Name Status Type of Presencewithin area
Eastern Barred Bandicoot (Tasmania) [66651] Vulnerable Species or specieshabitat likely to occurwithin area
Perameles gunnii gunnii
Tasmanian Devil [299] Endangered Species or specieshabitat likely to occurwithin area
Sarcophilus harrisii
Listed Migratory Species [ Resource Information ]* Species is listed under a different scientific name on the EPBC Act - Threatened Species list.Name Threatened Type of PresenceMigratory Marine Birds
Fork-tailed Swift [678] Species or specieshabitat likely to occurwithin area
Apus pacificus
Migratory Terrestrial Species
White-bellied Sea-Eagle [943] Species or specieshabitat likely to occurwithin area
Haliaeetus leucogaster
White-throated Needletail [682] Species or specieshabitat may occur withinarea
Hirundapus caudacutus
Satin Flycatcher [612] Species or specieshabitat known to occurwithin area
Myiagra cyanoleuca
Migratory Wetlands Species
Great Egret, White Egret [59541] Species or specieshabitat likely to occurwithin area
Ardea alba
Cattle Egret [59542] Species or specieshabitat likely to occurwithin area
Ardea ibis
Latham's Snipe, Japanese Snipe [863] Species or specieshabitat may occur withinarea
Gallinago hardwickii
Listed Marine Species [ Resource Information ]* Species is listed under a different scientific name on the EPBC Act - Threatened Species list.Name Threatened Type of PresenceBirds
Fork-tailed Swift [678] Species or specieshabitat likely to occurwithin area
Apus pacificus
Great Egret, White Egret [59541] Species or specieshabitat likely to occurwithin area
Ardea alba
Cattle Egret [59542] Species or specieshabitat likely to occurwithin area
Ardea ibis
Latham's Snipe, Japanese Snipe [863] Species or specieshabitat may occur withinarea
Gallinago hardwickii
Other Matters Protected by the EPBC Act

Name Threatened Type of Presence
White-bellied Sea-Eagle [943] Species or specieshabitat likely to occurwithin area
Haliaeetus leucogaster
White-throated Needletail [682] Species or specieshabitat may occur withinarea
Hirundapus caudacutus
Swift Parrot [744] Endangered Breeding likely to occurwithin area
Lathamus discolor
Satin Flycatcher [612] Species or specieshabitat known to occurwithin area
Myiagra cyanoleuca
Regional Forest Agreements [ Resource Information ]
Note that all areas with completed RFAs have been included.
Name StateTasmania RFA Tasmania
Extra Information
Invasive Species [ Resource Information ]Weeds reported here are the 20 species of national significance (WoNS), along with other introducedplants that are considered by the States and Territories to pose a particularly significant threat tobiodiversity. The following feral animals are reported: Goat, Red Fox, Cat, Rabbit, Pig, Water Buffaloand Cane Toad. Maps from Landscape Health Project, National Land and Water Resouces Audit,2001.
Name Status Type of PresenceBirds
Skylark [656] Species or specieshabitat likely to occurwithin area
Alauda arvensis
Mallard [974] Species or specieshabitat likely to occurwithin area
Anas platyrhynchos
European Goldfinch [403] Species or specieshabitat likely to occurwithin area
Carduelis carduelis
European Greenfinch [404] Species or specieshabitat likely to occurwithin area
Carduelis chloris
Rock Pigeon, Rock Dove, Domestic Pigeon [803] Species or specieshabitat likely to occurwithin area
Columba livia
House Sparrow [405] Species or specieshabitat likely to occurwithin area
Passer domesticus
Common Starling [389] Species or specieshabitat likely to occurwithin area
Sturnus vulgaris

Name Status Type of Presence
Common Blackbird, Eurasian Blackbird [596] Species or specieshabitat likely to occurwithin area
Turdus merula
Mammals
Cat, House Cat, Domestic Cat [19] Species or specieshabitat likely to occurwithin area
Felis catus
Brown Hare [127] Species or specieshabitat likely to occurwithin area
Lepus capensis
House Mouse [120] Species or specieshabitat likely to occurwithin area
Mus musculus
Rabbit, European Rabbit [128] Species or specieshabitat likely to occurwithin area
Oryctolagus cuniculus
Black Rat, Ship Rat [84] Species or specieshabitat likely to occurwithin area
Rattus rattus
Red Fox, Fox [18] Species or specieshabitat likely to occurwithin area
Vulpes vulpes
Plants
Bridal Creeper, Bridal Veil Creeper, Smilax,Florist's Smilax, Smilax Asparagus [22473]
Species or specieshabitat likely to occurwithin area
Asparagus asparagoides
Bitou Bush, Boneseed [18983] Species or specieshabitat may occur withinarea
Chrysanthemoides monilifera
Boneseed [16905] Species or specieshabitat likely to occurwithin area
Chrysanthemoides monilifera subsp. monilifera
Broom, English Broom, Scotch Broom, CommonBroom, Scottish Broom, Spanish Broom [5934]
Species or specieshabitat likely to occurwithin area
Cytisus scoparius
Montpellier Broom, Cape Broom, Canary Broom,Common Broom, French Broom, Soft Broom[20126]
Species or specieshabitat likely to occurwithin area
Genista monspessulana
Blackberry, European Blackberry [68406] Species or specieshabitat likely to occurwithin area
Rubus fruticosus aggregate
Willows except Weeping Willow, Pussy Willow andSterile Pussy Willow [68497]
Species or specieshabitat likely to occurwithin area
Salix spp. except S.babylonica, S.x calodendron & S.x reichardtii
Gorse, Furze [7693] Species or specieshabitat likely to occurwithin area
Ulex europaeus

-41.14796 145.85262
Coordinates
- non-threatened seabirds which have only been mapped for recorded breeding sites
- migratory species that are very widespread, vagrant, or only occur in small numbers
- some species and ecological communities that have only recently been listed
Not all species listed under the EPBC Act have been mapped (see below) and therefore a report is a generalguide only. Where available data supports mapping, the type of presence that can be determined from thedata is indicated in general terms. People using this information in making a referral may need to considerthe qualifications below and may need to seek and consider other information sources.
For threatened ecological communities where the distribution is well known, maps are derived fromrecovery plans, State vegetation maps, remote sensing imagery and other sources. Where threatenedecological community distributions are less well known, existing vegetation maps and point location dataare used to produce indicative distribution maps.
- seals which have only been mapped for breeding sites near the Australian continentSuch breeding sites may be important for the protection of the Commonwealth Marine environment.
For species where the distributions are well known, maps are digitised from sources such as recovery plansand detailed habitat studies. Where appropriate, core breeding, foraging and roosting areas are indicatedunder 'type of presence'. For species whose distributions are less well known, point locations are collatedfrom government wildlife authorities, museums, and non-government organisations; bioclimaticdistribution models are generated and these validated by experts. In some cases, the distribution maps arebased solely on expert knowledge.
The information presented in this report has been provided by a range of data sources as acknowledged atthe end of the report.
Caveat
- migratory and
The following species and ecological communities have not been mapped and do not appear in reportsproduced from this database:
- marine
This report is designed to assist in identifying the locations of places which may be relevant in determiningobligations under the Environment Protection and Biodiversity Conservation Act 1999. It holds mappedlocations of World Heritage and Register of National Estate properties, Wetlands of InternationalImportance, Commonwealth and State/Territory reserves, listed threatened, migratory and marine speciesand listed threatened ecological communities. Mapping of Commonwealth land is not complete at thisstage. Maps have been collated from a range of sources at various resolutions.
- threatened species listed as extinct or considered as vagrants
- some terrestrial species that overfly the Commonwealth marine area
The following groups have been mapped, but may not cover the complete distribution of the species:
Only selected species covered by the following provisions of the EPBC Act have been mapped:

-Department of the Environment, Climate Change, Energy and Water-Birds Australia-Australian Bird and Bat Banding Scheme
-Department of Environment and Conservation, Western Australia
Acknowledgements
-Department of Environment, Climate Change and Water, New South Wales
-Department of Primary Industries, Parks, Water and Environment, Tasmania
-Parks and Wildlife Service NT, NT Dept of Natural Resources, Environment and the Arts-Environmental and Resource Management, Queensland
-Department of Sustainability and Environment, Victoria
-Australian National Wildlife Collection
-Department of Environment and Natural Resources, South Australia
This database has been compiled from a range of data sources. The department acknowledges thefollowing custodians who have contributed valuable data and advice:
-Australian Museum
-National Herbarium of NSW
-State Forests of NSW-Australian Government, Department of Defence
-State Herbarium of South Australia
The Department is extremely grateful to the many organisations and individuals who providedexpert advice and information on numerous draft distributions.
-Natural history museums of Australia
-Queensland Museum
-Australian National Herbarium, Atherton and Canberra
-Royal Botanic Gardens and National Herbarium of Victoria
-Geoscience Australia
-Ocean Biogeographic Information System
-Online Zoological Collections of Australian Museums-Queensland Herbarium
-Western Australian Herbarium
-Tasmanian Herbarium
-Northern Territory Herbarium
-SA Museum
-Museum Victoria
-University of New England
-CSIRO-Other groups and individuals
© Commonwealth of Australia
+61 2 6274 1111
Canberra ACT 2601 Australia
GPO Box 787
Department of the Environment
Please feel free to provide feedback via the Contact Us page.

APPENDIX 3 Fulton Hogan East Ridgley Mobile Asphalt Plant Environmental Management Plan

Current as of 28/07/2014
CO
NSE
QU
ENC
E
LIK
ELIH
OO
D
RIS
K R
ATI
NG
CO
NSE
QU
ENC
E
LIK
ELIH
OO
D
RIS
K R
ATI
NG
Operating Asphalt Plant Disturbance to neighbours Sig. Li. 17 H1. Noise 6. CommunityManagement Comittments outlined in Environmental Effects Report
Min. U.Li. 5 L1. CAMs Reports 2. Environmental Inspection Checklists
Asphalt Plant Supervisor Ongoing
Truck and Vehicle Movements Disturbance to neighbours Sig. Li. 17 H1. Noise 6. CommunityManagement Comittments outlined in Environmental Effects Report
Min. U.Li. 5 L1. CAMs Reports 2. Environmental Inspection Checklists
Asphalt Plant Supervisor Ongoing
Storage of Aggregates and Sand (Stockpiling)
Generation of fugitive dust from stockpiles Sig. Li. 17 H
2. Air Quality, 6. Community, Management Comittments outlined in Environmental Effects Report
Min. Rare 3 L1. CAMs Reports 2. Environmental Inspection Checklists
Asphalt Plant Supervisor Ongoing
Loader Operation Generation of fugitive dust (in particular during stockpile material movement)
Sig. Li. 17 H2. Air Quality, 6. Community, Management Comittments outlined in Environmental Effects Report
Min. Rare 3 L1. CAMs Reports 2. Environmental Inspection Checklists
Asphalt Plant Supervisor Ongoing
Operating Asphalt Plant Emission of greenhouse gas and other pollutants Ins. A.Cert. 11 M 2. Air Quality
Management Comittments outlined in Environmental Effects Report Ins. A.Cert. 11 M1. CAMs Reports 2. Environmental Inspection Checklists
Asphalt Plant Supervisor Ongoing
Operating Asphalt PlantGeneration of fugitive dust from conveyors and drop points
Ins. A.Cert. 11 M 2. Air QualityManagement Comittments outlined in Environmental Effects Report Ins. A.Cert. 11 M
1. CAMs Reports 2. Environmental Inspection Checklists
Asphalt Plant Supervisor Ongoing
Operating Asphalt Plant Electricity, Gas and Fuel Consumption Ins. A.Cert. 11 M
2. Air Quality, 4. Resource UseManagement Comittments outlined in Environmental Effects Report
Ins. A.Cert. 11 M1. CAMs Reports 2. Environmental Inspection Checklists
Asphalt Plant Supervisor Ongoing
Manufacture of Bituminous Products Odour Sig. Li. 17 H
2. Air Quality, 6. Community, Management Comittments outlined in Environmental Effects Report
Sig. U.Li. 9 M1. CAMs Reports 2. Environmental Inspection Checklists
Asphalt Plant Supervisor Ongoing
Truck and Mobile Vehicle Movements Emissions from engines Ins. A.Cert. 11 M 2. Air Quality
Management Comittments outlined in Environmental Effects Report Ins. A.Cert. 11 M1. CAMs Reports 2. Environmental Inspection Checklists
Asphalt Plant Supervisor Ongoing
Truck and Vehicle Movements
Generation of dust (in particular from the main driveways and internal haulage routes)
Sig. Li. 17 H2. Air Quality, 6. Community, Management Comittments outlined in Environmental Effects Report
Ins. U.Li. 2 L1. CAMs Reports 2. Environmental Inspection Checklists
Asphalt Plant Supervisor Ongoing
Maintenance Generation of dust and airborne pollutants Ins. A.Cert. 11 M 2. Air Quality
Management Comittments outlined in Environmental Effects Report Min. U.Li. 5 L1. CAMs Reports 2. Environmental Inspection Checklists
Asphalt Plant Supervisor Ongoing
Stockpiling and Handling of Materials
Pollution of Stormwater from Aggregates and Bitumen Sig. Pos. 13 M
5.Chemicals3. Water QualityManagement Comittments outlined in Environmental Effects Report
Sig. U.Li. 9 M1. CAMs Reports 2. Environmental Inspection Checklists
Asphalt Plant Supervisor Ongoing
Truck and Vehicle Movements Pollution of Stormwater with hydrocarbons Sig. Pos. 13 M
5.Chemicals3. Water QualityManagement Comittments outlined in Environmental Effects Report
Sig. Rare 6 L1. CAMs Reports 2. Environmental Inspection Checklists
Asphalt Plant Supervisor Ongoing
Consumption of Food and Drinks/ smoking Litter Ins. A.Cert. 11 M 4. Waste and Resource Use
Management Comittments outlined in Environmental Effects Report Ins. Pos. 4 L1. CAMs Reports 2. Environmental Inspection Checklists
Asphalt Plant Supervisor Ongoing
Maintenance Illegal disposal of wastes Sig. Pos. 13 M 4. Waste and Resource UseManagement Comittments outlined in Environmental Effects Report Sig. Rare 6 L
1. CAMs Reports 2. Environmental Inspection Checklists3. Prescribed Waste Certificates
Asphalt Plant Supervisor Ongoing
Office waste (eg Printing and Copying) Depletion of natural resource Ins. A.Cert. 11 M 4. Waste and Resource Use
Management Comittments outlined in Environmental Effects Report Ins. U.Li. 2 L1. CAMs Reports 2. Environmental Inspection Checklists
Asphalt Plant Supervisor Ongoing
Storage and use of Fuels and Chemicals (includes Bitumen Tanks, diesel, slip agent, oil)
Contamination of land and stormwater Sig. Li. 17 H 5.Chemicals
Management Comittments outlined in Environmental Effects Report Sig. Rare 6 L1. CAMs Reports 2. Environmental Inspection Checklists
Asphalt Plant Supervisor Ongoing
Truck and Vehicle Movements Pollution of Stormwater with hydrocarbons Sig. Li. 17 H 5.Chemicals
Management Comittments outlined in Environmental Effects Report Sig. Rare 6 L1. CAMs Reports 2. Environmental Inspection Checklists
Asphalt Plant Supervisor Ongoing
Truck and Vehicle Movements Spread of weeds off site Sig. Pos. 13 M 8. WeedsManagement Comittments outlined in Environmental Effects Report Min. Rare 3 L
1. CAMs Reports 2. Environmental Inspection Checklists
Asphalt Plant Supervisor Ongoing
Weeds on Site Spread of weeds on site Min. Pos. 8 M 8. WeedsManagement Comittments outlined in Environmental Effects Report Min. Rare 3 L
1. CAMs Reports 2. Environmental Inspection Checklists
Asphalt Plant Supervisor Ongoing
Operating Asphalt Plant CommunityCreating a nuisance/ammenity impact to neighbouring properties
All of the above/belowTo operate the asphalt plant without causing nuisance to neighbouring properties
No significant complaints (rated high by the risk matrix)) from neighbours
Sig. Li. 17 H 6. CommunityManagement Comittments outlined in Environmental Effects Report Sig. U.Li. 9 M
1. CAMs Reports 2. Environmental Inspection Checklists
Asphalt Plant Supervisor Ongoing
All Activities Flora and Fauna Encountering unexpected threatened fauna
1. Environmental Management and Pollution Control Act (EMPCA) 2. Environment Protection Notice 3. Development Approval
Activities associated with the operation of the asphalt plant to have no impact on flora or fauna
No significant incidents (rated med or greater by the risk matrix) in relation to flora or fauna
Min. U.Li. 5 L 7. Flora and FaunaManagement Comittments outlined in Environmental Effects Report Min. U.Li. 5 L
1. CAMs Reports 2. Environmental Inspection Checklists
Asphalt Plant Supervisor Ongoing
All Activities Cultural Heritage Encountering cultural heriatge items
1. Environmental Management and Pollution Control Act (EMPCA) 2. Environment Protection Notice 3. Development Approval
Activities associated with the operation of the asphalt plant to have no impact on cultural heriatge
No significant incidents (rated med or greater by the risk matrix) in relation to flora or fauna
Min. U.Li. 5 L Management Comittments outlined in Environmental Effects Report Min. Rare 3 L1. CAMs Reports 2. Environmental Inspection Checklists
Asphalt Plant Supervisor Ongoing
All Activities Fire Risk Operation of Plant causes a fire
1. Environmental Management and Pollution Control Act (EMPCA) 2. Environment Protection Notice 3. Development Approval
Activities associated with the operation of the asphalt plant to minimise fire risk
No significant incidents (rated med or greater by the risk matrix) in relation to flora or fauna
Maj. Pos. 18 H Management Comittments outlined in Environmental Effects Report Min. Rare 3 L1. CAMs Reports 2. Environmental Inspection Checklists
Asphalt Plant Supervisor Ongoing
NOTE: all pre-control risk scores greater than 7 are deemed to be significant
Weeds
Water Quality
Waste and Resource Use
No significant incidents (rated high by the risk matrix) in relation to noxious weeds.
No significant incidents (rated high by the risk matrix) in relation to fuels and chemicals
No significant incidents (rated high by the risk matrix) in relation to pollution of waters
No significant incidents (rated high by the risk matrix) in relation to waste and resource use
Chemicals
1. No pollution of stormwater 2. No storage of fuels and chemicals in a place where they have the potential to pollute
1. To minimise the resources required to operate the plant. 2. Site produced wastes to not impact on the environment
To store fuels and chemicals where they do not have potential to contaminate soil or water
To have no noxious weeds present on site
1. Environmental Management and Pollution Control Act (EMPCA) 2. Environment Protection Notice 3. Development Approval
1. Environmental Management and Pollution Control Act (EMPCA) 2. State Policies and Projects Act 19933. State Policy on Water Qualkity Management 19974. Environment Protection Notice 5. Development Approval
1. Environmental Management and Pollution Control Act (EMPCA) 2. Environment Protection Notice 3. Development Approval
1. Environmental Management and Pollution Control Act (EMPCA) 2. Environment Protection Notice 3. Development Approval
No significant incidents (rated high by the risk matrix) in relation to air quality
OBJECTIVES TARGETS
Noise
Air Quality
1. Environmental Management and Pollution Control Act (EMPCA) 2. Environment Protection Policy (Air Quality) 20043. National Greenhouse and Energy Reporting Act (2007) 4. Environment Protection Notice5. Development Approval
To carry out operations without noise impact on neighbours
1. To ensure the generation of dust, emissions and odour does not cause nuisance to neighbouring properties 2. To comply with all legislative reporting requirements
1. Environmental Management and Pollution Control Act (EMPCA) 2. Environment Protection Policy (Noise) 20093. Environment Protection Notice 4. Development Approval
POST-CONTROL RISK
No significant noise complaints (rated high by the risk matrix) from neighbours
TIMEFRAME
EAST RIDGLEY MOBILE ASPHALT PLANTENVIRONMENTAL ASPECTS & IMPACTS AND RISK ASSESSMENT
ASPECT/HAZARD CONTROL MEASURES TO BE IMPLEMENTED RESPONSIBLE PERSON
REFERENCES (RECORDS TO BE KEPT AND RELEVANT
INFORMATION)IMPACT LEGISLATIVE AND OTHER REQUIREMENTSACTIVITY
PRE-CONTROL RISK

Content ID: AU_00009249DRAFT Revision: 1
This is an uncontrolled copy if photocopied or printed from the Intranet. Copyright © 2011, Fulton Hogan Ltd. All rights reserved.
Revised:18-07-2014 Page 1 of 3
Environmental Management Plan (1) – Management Items & Locations of Environmental Protection Measures Name of Operation: Mobile Asphalt Plant 195 Circular Road, East Ridgley, Tasmania Date and Revision: 26/08/2014, Revision 1 Prepared By: Lok Nethercott Reviewed By: Stephen Jenkins Approved By: Rachel Lowe
Scope / Purpose
All works at the mobile asphalt plant located at 195 Circular Road, East Ridgley, Tasmania shall be undertaken in accordance with this EMP and the associated documents and approvals (i.e. Environmental Effects Report (EER), and the Development Approval (DA) granted by the Burnie City Council.
Project Environmental Aspects The following have been identified as significant environmental aspects for the site: ▪ Air Quality – specifically Dust and Odour ▪ Noise ▪ Water Quality These aspects shall be managed with the environmental protection measures outlined on this plan.
Requirements All work undertaken by site personnel must comply with company and legislative requirements. Working in accordance with measures specified in the Environmental Management Strategy - Southern Region Metro Surfacing and this Site EMP will help you comply with these requirements. The Objectives and Targets for this site will be detailed in the site Aspects and Impacts and Risk Register. This details our requirements around no significant environmental incidents or complaints for the site. Assessment against the Objectives and Targets shall be made annually during the annual review of this Plan.
Responsibilities Personnel shall undertake their works in a manner consistent with defined responsibilities in Section 3 of the Environmental Management Strategy - Southern Region Metro Surfacing. Particular responsibilities of note for this site include: ▪ Overall responsibility for Environment Management of this site rests with the Department Manager Asphalt Production. ▪ Responsibility for the direction of onsite operations, including planning and management of the environmental protection
measures, rests with the Plant Foreman. ▪ Day to day environmental duties are undertaken by the Plant Foreman. Day to day environmental duties include supporting
the planning and management of the environmental protection measures, inspections, monitoring and reporting.
All personnel have a responsibility to undertake their work in a sustainable manner and in a way which causes no pollution or harm to the environment.
Key Environmental Emergency Contacts 1. Phil Olsson (Department Manager Asphalt Production): 2. Rachel Lowe (Environment Manager- Offsite Support)- 0408 910 740
Additional emergency contacts including external contacts are included on the Emergency Response Handbook.
Communication of Site EMP Requirements This Environmental Management Plan needs to be communicated to all staff to help improve awareness and also inform staff of the environmental requirements of working at the mobile asphalt plant site. Communication is undertaken in accordance with Section 7 of the Environmental Management Strategy - Southern Region Metro Surfacing. In particular: Copies of this Site EMP shall be displayed on the wall of the site office. This will ensure the accessibility of information for all persons on site. Prior to commencing on site, all persons shall complete an induction. Toolbox meetings shall be used to communicate specific topics where an innovation or issue has occurred. These meetings shall also provide a conduit for feedback for all persons working on the site. Dust Management is a standard item that must be discussed at each toolbox meeting.
Inspections and Maintenance Inspections and Maintenance at the site are to be undertaken in accordance with Section 8 of the Environmental Management Strategy - Southern Region Metro Surfacing. Formal environmental inspections shall be undertaken on a monthly basis. Those inspections shall be recorded on the site specific Environmental Checklist. In addition to formal monthly inspections, monitoring shall be conducted if required. Records of monitoring observations shall only be retained in the event of a significant issue or observation. This may be recorded as a file note, diary note or incident, as appropriate to the nature of the observation. Additional monitoring shall be undertaken on an as-needed basis. This may be undertaken internally or by external companies should a risk arise. This may include noise, dust, odour, resource use or waste production monitoring. Assistance shall be sought from the Regional Environment Team in the event that specialist monitoring is required. Any identified deficiencies in measures must be fixed before any environmental impact can occur.
Incident Management and Emergency Response All incidents shall be managed in accordance with Section 9 & 10 of the Environmental Management Strategy - Southern Region Metro Surfacing. In Particular:
All incidents must be reported and a record of the incident must be made in CAMs. The site shall conduct environmental emergency drills at a frequency of 1 per year. These shall be documented using AU_00003562 (Incident & Emergency Response Drill Record) and findings discussed during toolbox meetings. Procedures for the management of emergencies are detailed in the Emergency Response Handbook. The Emergency Response Handbook shall be displayed at prominent locations around the site, including the lunchroom. The locations of environmental emergency response equipment (including spill kits) are shown on the site plan on page 2 of the EMP.
Associated Documents Ideas & Innovation The following documents are associated with this Environmental Management Plan: ▪ Environment Manual ▪ Environmental Management Strategy - Southern Region
Metro Surfacing ▪ Mobile Asphalt Plant East Ridgley Aspects and Impacts
Register (to be added to Strategy) ▪ Mobile Asphalt Plant East Ridgley Environment Inspection
Checklist ▪ Fulton Hogan Mobile Asphalt Plant East Ridgley
Environmental Effects Report
All staff are encouraged to seek innovative ideas. Any ideas should be raised at Toolbox Meetings.

Content ID: AU_00009249DRAFT Revision: 1
This is an uncontrolled copy if photocopied or printed from the Intranet. Copyright © 2011, Fulton Hogan Ltd. All rights reserved.
Revised:18-07-2014 Page 2 of 3
Environmental Management Plan (2) – Management Items & Locations of Environmental Protection Measures Name of Operation: Mobile Asphalt Plant 195 Circular Road, East Ridgley, Tasmania Date and Revision: 26/08/2014, Revision 1 Prepared By: Lok Nethercott Reviewed By: Stephen Jenkins Approved By: Rachel Lowe
1. Noise
1.1 Working Hours: The Plant will operate during the day period between 7:30am – 6:00pm Monday to Friday and 7:30am – 12pm on Saturdays. The plant will not be operational on Sunday or Public Holidays
1.3 Other: The noise emissions of the site are Regulated by the Environment Protection (Noise) 2009. Full analysis of noise limits (with background considerations) shall be made in the event of noise non-compliance with the above.
1.2 Noise Minimisation Methods: ▪ Implement the specific management commitments relating to noise
management are outlined in Part D of the EER ▪ All machinery utilised on site shall be appropriately maintained to minimise
noise emissions. ▪ Loader operations will be confined to the northern end of the site ▪ Vehicles shall not be kept idling unnecessarily, and will not be operated
during noise sensitive hours (i.e. 6pm – 7am). This will be communicated through site inductions.
▪ All mobile plant needs to minimise reversing, so as to not make unnecessary reversing notification noise.
1.4 Noise Procedures Noise Procedure
2. Air Quality 2.1 Energy Use and Emissions Data: Keep all utility bills as a record of energy used for reporting purposes: ▪ National Greenhouse and Energy Reporting (NGER) Reporting due 31st of
October.
2.5 Minimising Dust Generation (Stockpiles): All stockpiled materials are to be located within the allocated areas shown
on the adjacent site plan. Stockpile heights will be managed at the asphalt plant such that stockpiles
shall not exceed 8m in height. The stockpile height at the site shall be managed to minimise impacts on visual amenity. Stockpiles of any fine material with dust potential will be wet down as required so as to form a surface crust, which minimises release of airborne dust
2.2 Emissions from the Site: Maintain vehicles as per maintenance schedules.
2.3 Emissions from Processing Visually inspect operations for visible dust emissions as part of the monthly environmental inspection and record observations and actions on the Environment Checklist.
2.6 Minimising Odour Generation: Use of low-sulphur bitumen Maintain stringent quality control on the asphalt plant temperature so as to
control and minimise odour emissions Install an insulated silo that will maintain the asphalt at a workable
temperature which is lower than the original hot mix production temperature
Install and asphalt feed conveyor and silo that is enclosed Load out of trucks to occur in an efficient manner (load out times approx. 2 minutes).
Asphalt tray trucks will be immediately tarped and driven off-site after loading.
2.4 Minimising Dust Generation (General): Implement the specific management commitments relating to air quality
management are outlined in Part D of the EER Induction training will be used to control all vehicle speeds to below 10km/hr
when on site. Airborne dust emissions from unpaved surfaces on the site will be controlled by maintaining a suitable aggregate cover and by using truck water sprays as required during dry, windy weather conditions.
On days of unfavourable weather conditions, a review of onsite practices will be undertaken to schedule activities so as to mitigate dust generation.
The site will be sheeted with crushed rock and all traffic movement on site will be restricted to the crushed rock surface and a max speed of 10 km/h to reduce dust generation. Travel routes will be clearly defined to minimise the impact on existing conditions. Incoming and outgoing loads shall be covered to minimise dust generation while transported on public road
2.6 Dust Suppression and Monitoring:A water cart will be used as required to minimise airborne dust. Visual monitoring to continue by Foreman during daily activities.
2.7 Contingencies: In the event of a dust suppression failure, management shall consider ceasing works in the affected areas that have the potential to generate dust (e.g. maintenance, loader movements) 2.8 Air Quality Procedure Air Quality Procedure
3. Water Quality 3.1 Drainage Management and Treatment Any stormwater run-off shall be treated using sedimentation fencing which is shown on the site plan on Plan 2 of this EMP.
3.3 Stockpiles: All raw material will be inspected to ensure it contains gravel only.
3.4 Vehicle and Road Management: Aggregate surfacing is to be maintained so that mud tracked onto the surface does not become a stormwater pollutant.
3.2 Water Treatment Maintenance Implement the specific management commitments relating to stormwater
management are outlined in Part D of the EER Sediment traps and a maintenance checklist and records shall be kept on this
inspection checklist. Visual inspections of any water runoff from the site shall be undertaken to
verify that no pollutants are leaving the site. This shall be recorded on the Environmental Inspection Checklist.
3.5 Water Discharges Procedure Erosion and Sediment Control Procedure Water Discharges Procedure
4. Waste and Resource Use 4.1 Waste Minimisation Methods: Implement the specific management commitments relating to waste management are outlined in Part D of the EER The waste hierarchy AVOID- REDUCE- REUSE- RECYCLE will be used by the site. As a minimum the following shall apply: ▪ All sediment waste is to be placed in gravel stockpile. ▪ Use electronic means of communication where ever possible.
4.4 Waste Management and Resource Use procedures Waste Management Procedure Resource Use Procedure
4.2 Waste Storage and Disposal : A bin shall be maintained in the site office to ensure safe storage and
disposal of any waste generated on the site. All used spill material is to be disposed of in accordance with EPA guidelines. All waste disposed of from the site shall be taken to an appropriate facility in
accordance with EPA’s waste guidelines.
4.3 Producing Sustainable Products- RAP: Promote use of asphalt within product to increase recycling opportunities. Quantities of asphalt supplied are to be recorded.
5. Hazardous Substances, Chemicals and Fire Management 5.1 Chemical Storage: Implement specific management commitments relating to Hazardous
Substances and Chemicals Management as outlined in Part D of the EER Fuel will be delivered to the site by a mobile supplier only and the supplier
vehicle will leave the site after fuel delivery. Servicing oils to be removed by contractor in accordance with EPA
Guidelines. 5.2 Refuelling / Reloading Procedure: The diesel tank will have an impervious, geotextile lined, earthen bund
constructed at the refill point where hose connects to the truck and the tank. All refuelling of plant and equipment will occur onsite at the diesel tank. All refilling of bitumen and hot oil tanks will occur at fill points for these tanks The tanker delivery drivers will remain at the truck at all times during refilling
of the diesel, bitumen and hot oil tanks.
5.3 Spill Management: As shown on the location plan, this site has spill kits located at the laboratory Site specific spill clean up requirements are: ▪ Spill response equipment will be located on the site and will be readily
available during refilling of tanks. ▪ Any spill will be immediately cleaned up and responded to in accordance
with the Fulton Hogan Incident and Emergency Respond Flowchart – Chemical Oil and Fuel Spills.
▪ Hydrocarbon contaminated dust can be returned to the fine processed material for reuse.
▪ Spill Kit absorbent material is to be disposed of in accordance with EPA Guidelines Cultural Heritage & Flora and Fauna 8. Weeds 9. Decommissioning
5.4 Fire Management As part of good operational management Fulton Hogan will establish fire
prevention measures and a Bushfire Hazard Management Plan to be followed during periods of high fire risk.
5.5 Hazardous Substances, Chemical and Fire Management Procedures Chemical Management Procedure Incident and Emergency Respond Flowchart – Chemical Oil and Fuel Spills Incident and Emergency Response Flowchart- Bushfire Incident and Emergency Response Flowchart-Fires and Explosions Bushfire Hazard Management Plan
7.2 Cultural HeritageImplement specific management commitments relating to cultural heritage as outlined in Part D of the EER. 7.3 Flora and Fauna Implement specific management commitments relating to flora and fauna as outlined in Part D of the EER. Heritage Procedure Incident and Emergency Response Flowchart- Encountering Cultural Heritage Sites or Remains Flora and Fauna Management Procedure Incident and Emergency Response Flowchart- Encountering Wildlife
8.1 Noxious Weeds: Monitor for weeds as part of the monthly environmental inspection. Record observations and actions on the Environmental Checklist 8.2 Noxious Weeds Procedure Noxious Weeds Procedure
9.1 Removal of Plant Removal of all associated plant and equipment including all materials and bunds. The imported crushed rock base on which the plant had been placed will remain for use by the land owner for storage of farming equipment and supplies. This will ensure the sites continued use is consistent with the ‘Rural Resource’ zoning of the land allowing for continued primary industry and/or agricultural use. The site will be subject to a complete site contamination assessment upon closure of the asphalt plant. Any identified contamination will be appropriately remediated either onsite using land farming techniques and or disposed off site at an appropriately licensed waste facility in accordance with EPA requirements
6. Community Representatives of the site shall be involved with community and local industry consultation as required.
Any community complaints must be reported and recorded in CAMs.
Records of complaints in CAMS will form a complaints register for the site and shall be made available upon request by applicable agencies.
LEGEND: Spill Kit Cross Over Drain Bag House Discharge Point Fugitive Dust Source Odour Source Noise Source Sediment Fencing Channel Drain Bunded Chemicals Storage Area and Diesel tank refill point bunded area 1,000 Litre Bunded “Truck Slip” IBC
BHDP
BHDP
OS
OS
OS
FDS
FDS
NS
NS
NS
NS
NS
NS NS

Environmental Inspection Checklist East Ridgley (TAS) Mobile Asphalt Plant
Content ID: ex1_00409380 Revision: 1
This is an uncontrolled copy if photocopied or printed from the Intranet. Copyright © 2011, Fulton Hogan Ltd. All rights reserved.
Revised:14-02-2014 Page 1 of 1
ASPECT INSPECTED
CONSIDERATIONS/POTENTIAL PROBLEMS S U
N/A
CORRECTIVE ACTION REQUIRED / COMMENTS
ACTION COMPLETED
DATE 1. Noise • Excessive noise being generated
• Noise complaints. CAMs entry Y/N CAMs No.:
2. Air Quality- Emissions
• Visible smoke emissions from mobile plant: > 10 consecutive seconds
• Unusual visible emissions from fixed plant
3. Air Quality- Dust
• Visible dust generation not excessive • Dust not contained within site boundaries • Inadequate dust prevention • Inadequate dust suppression • Stockpiles not generating dust • Neighbours encountering dust • Dust complaints • Maximum stockpile height at the asphalt
plant shall not exceed 8m in height • Incoming and outgoing loads shall be
covered to minimise dust
4. Water Quality-Drainage Channels
• no pollutants are leaving the site • Other drainage observations • Erosion or sediment fencing in place • Check cross over drains
5. Water Quality-Public Roads
• Mud on road that requires sweeping Date of Last Sweeping: / /
6. Resources and Waste Management
• Bin being used • Bin requires emptying • Litter/ waste strewn about the work area • Waste washed or blown offsite • General housekeeping maintained
7. Chemicals (including Fuels)
• Inadequate bunding of chemical storage area • Cracks or damage to bund walls • Chemical staining/spillage on bunded floor or
wall • Refuelling in unsuitable locations • Spills / leaks in around the plant • Spill kits not maintained or available
8. Community • Complaints received. CAMs entry Y/N • Community being impacted upon by our
operations
CAMs No.:
9. Flora and Fauna
• Damage to flora/ fauna
10. Weeds • Fresh weed infestations • Vehicles driving on the crushed rock surface
Date of spraying: / /
Other notes or observations: (the reverse side of this page can also be used) INSPECTED BY: DATE OF INSPECTION:
…… / …… / …………
LEGEND: S: satisfactory U: unsatisfactory – corrective action required N/A: not applicable

APPENDIX 4 Air Quality Assessment

EML AIR PTY LTD ABN 98 006 878 342
Melbourne (Head Office)
PO Box 466, Canterbury VIC 3126 427 Canterbury Road Surrey Hills VIC 3127
Telephone +61 3 9813 7200 Facsimile +61 3 9830 0670
Air Emission Specialists MELBOURNE • SYDNEY • PERTH • BRISBANE
Proposed Temporary Asphalt Plant Circular Road, East Ridgley, Tasmania
AIR QUALITY ASSESSMENT
Prepared for
EnviroRisk Pty Ltd
Report No 93062r4
26 August 2014

EML Air Pty Ltd
Air Emission Specialists MELBOURNE • SYDNEY • PERTH • BRISBANE
Contents 1. INTRODUCTION...............................................................................................................................1
2. MODELLING INPUTS .......................................................................................................................3
2.1 Meteorology..............................................................................................................................3
2.2 Sources ....................................................................................................................................5
2.2.1 Activities and Mitigation Measures .......................................................................................5
2.2.2 Discharge Point Emission Rates.........................................................................................6
2.2.3 Loadout odour emission rates .............................................................................................6
2.3 Dispersion Model Configuration ...............................................................................................7
3. ASSESSMENT CRITERIA................................................................................................................8
3.1 Policy........................................................................................................................................8
3.1.1 Design Criteria .....................................................................................................................8
3.1.2 Odour Criteria.......................................................................................................................9
3.2 Existing Ambient Background................................................................................................10
3.3 Land use and Receivers ........................................................................................................10
4. RESULTS .......................................................................................................................................11
4.1 Classified Indicator Pollutants ................................................................................................11
4.2 Odour .....................................................................................................................................12
5. CONCLUSIONS..............................................................................................................................13
6. LIMITATIONS...................................................................................................................................16
Appendix A: Emissions data for Continuous Drum Mix Emissions (supplied by Fulton Hogan)
Appendix B: CALPUFF input configuration file – unit vent stack emissions
Appendix C: CALPUFF input configuration file – adopted odour emissions

EML Air Pty Ltd Page 1 of 16
Air Emission Specialists MELBOURNE • SYDNEY • PERTH • BRISBANE
1. INTRODUCTION
This study represents an air quality modelling assessment of various emissions to air from a proposed mobile diesel fuel fired drum-mix asphalt plant to be temporarily located on a leased portion of 195 Circular Road, East Ridgley, Tasmania. The proposed plant is to be located on-site for approximately 18 months total apart from 2 months where it will be relocated to Launceston before returning to the temporary site. The plant is to be located next to an existing hard rock quarry operation from where feedstock may be sourced. Figure 1 illustrates the plant location adjacent to the quarry site and also the surrounding land-use, with the three nearest sensitive receiver dwellings indicated. The location of the plant within the site boundary is indicated.
This mobile plant is to operate only between the hours of 7.30am to 6pm Monday to Friday, 7.30am to 12pm on Saturdays, but not on Sundays or public holidays. The design capacity of the plant is 180 tons per hour, and current production forecasts indicate that the plant will produce 20,000 tons per year, running for only approximately 120 hours per year equivalent at full capacity. The plant is expected to operate in approximately six 2-week windows at varying times of the day depending upon demand. Asphalt is to be transferred from the drum mix plant up and into a storage silo via a covered conveyor. This will allow flexibility in the distribution of asphalt throughout the day.
The mobile plant is to incorporate a baghouse for particulate removal and vent stack emissions. The vent stack height is 6.09 m above ground level. It is expected that the main source of odour will be the dryer exhaust emissions vented through this baghouse and stack. A secondary source of odour will be from the load out process when the stored asphalt is dumped from the silos into waiting tray trucks positioned underneath which results in short periods of fugitive odour released close to ground level.
The adopted modelling methodology is consistent with the requirements in the Environment Protection Policy (Air Quality) 2004 (EPP-AIR) and relevant modelling guidelines typically adopted by other jurisdictions throughout Australia. One year of hourly three-dimensional meteorological data was synthesised and modelled to the local undulating terrain as detailed in Section 2.1. Various pollutant emissions from the plant’s single discharge point and load-out area were estimated as detailed in Section 2.2. The current approved CALPUFF dispersion model was used to predict peak ground level concentrations resulting from the estimated emissions to air of all significant classified indicator pollutants, plus odour, as detailed in Section 2.3. The assessment goals are detailed in Section 3 with consideration to the EPP-AIR scheduled ground level concentration criteria, estimates of existing ambient conditions and land use. The peak predicted ground level concentrations were compared with corresponding criteria in Sections 4, and results are summarised in Section 5.
Fugitive dust and odour emissions from the site are to be mitigated by design and managed as per the requirements detailed within separately detailed site environmental management procedures.
This report has been prepared for EnviroRisk Pty Ltd and should be read in conjunction with the scope and limitations as detailed in Section 6.
This report has been updated to address comments from EPA Tasmania on the 22/8/14 version of the report, received by EnviroRisk on 25/8/14.

EML Air Pty Ltd Page 2 of 16
Air Emission Specialists MELBOURNE • SYDNEY • PERTH • BRISBANE
Figure 1
402.5 403 403.5 404 404.5 405
Eastings (m)
5443.5
5444
5444.5
5445N
orth
ings
(m)
Temporary plant location, site boundary and nearest sensitive receivers
Site boundary andtemporary plant location
SR1
SR3
SR2

EML Air Pty Ltd Page 3 of 16
Air Emission Specialists MELBOURNE • SYDNEY • PERTH • BRISBANE
2. MODELLING INPUTS
2.1 Meteorology
The mobile plant is to be temporarily located in a region of undulating terrain. Elevated terrain is to the west, south-west and south of the plant. Note Figure 1. The line of site to the nearest sensitive receiver dwellings (SR1-3) is obscured by terrain and these receivers are at elevations higher than the source. These geophysical features precluded the use of a steady state dispersion model informed by a single hourly wind vector (i.e. Ausplume or AERMOD), and necessitated the adoption of a three dimensional approach with hourly and spatially varying winds throughout the assessment area.
Hourly varying three-dimensional meteorological data for the Year 2012 was produced in the format required for the CALPUFF dispersion model. 12 km resolution data from the MM5 prognostic meteorological model (informed by synoptic weather data provided by the Bureau of Meteorology) was nested to the local terrain at a 100 m resolution using the CALMET meteorological model. The meteorological and dispersion modelling methodology and model settings were adopted as per the guidelines detailed in the NSW Office of Environment and Heritage publication “Generic Guidance and Optimum Model Settings for the CALPUFF Modelling System for Inclusion into the ‘Approved Methods for the Modelling and Assessments of Air Pollutants in NSW, Australia’, 2011.”
Figure 2 below illustrates the distribution of hourly wind speed and direction at the location of the plant. The worst case dispersion conditions for a 6 m high vent stack, which will not be significantly affected by flow wake eddies from nearby block form structures, will be light to moderate winds that occur during neutral to slightly unstable atmospheric conditions. These typically occur early or later in the day, or during periods of significant cloud cover. The wind distribution indicates that these conditions are common. The worst case wind directions will be those towards the elevated terrain to the west and south whereupon plume strikes may occur with elevated ground level concentrations distant from the location of the vent stack. These are seen to occur the least frequently, with predominant winds being from the west and south-west away from this elevated terrain.
For the loadout odour emissions the poorest dispersion conditions occur during the nocturnal hours however these are avoided as the plant will not operate during hours of darkness. The next poorest conditions are light winds during the morning or afternoon however these are infrequent as the average wind speed at the site is 4.8 m/s (17 km/hr) and the frequency of overall light winds (<2 m/s) is low at ~5%.
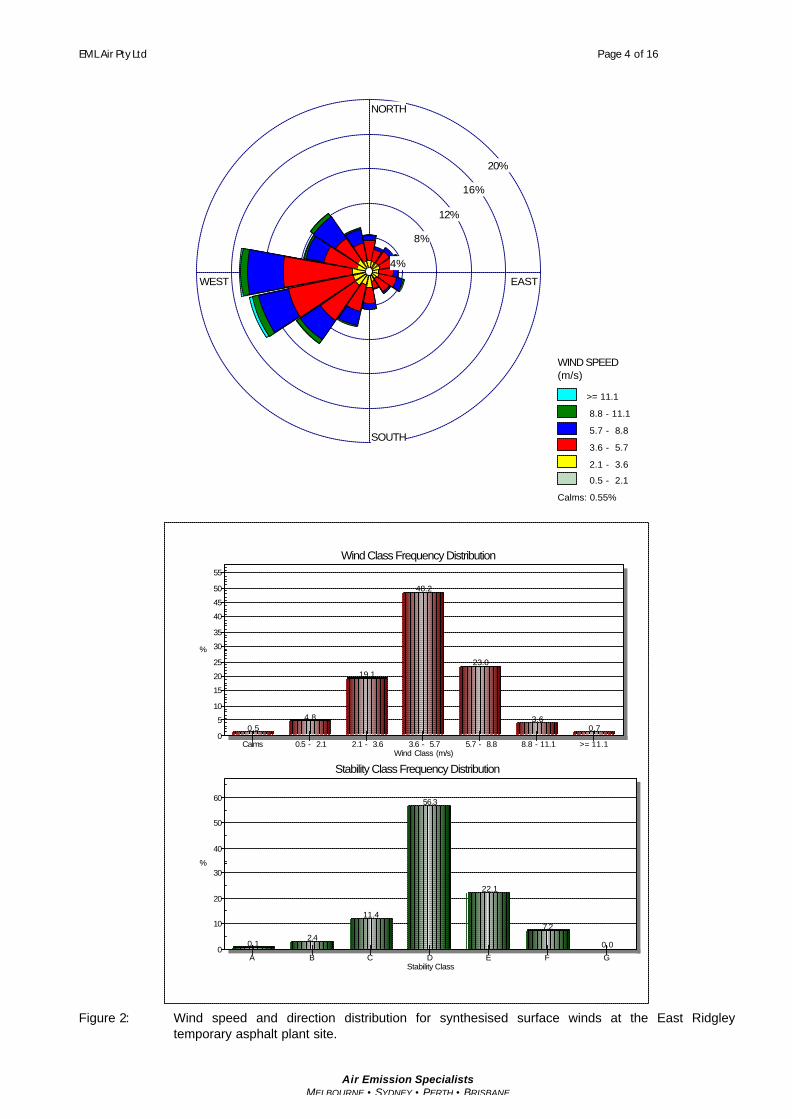
EML Air Pty Ltd Page 4 of 16
Air Emission Specialists MELBOURNE • SYDNEY • PERTH • BRISBANE
NORTH
SOUTH
WEST EAST
4%
8%
12%
16%
20%
WIND SPEED (m/s)
>= 11.1
8.8 - 11.1
5.7 - 8.8
3.6 - 5.7
2.1 - 3.6
0.5 - 2.1
Calms: 0.55%
0.54.8
19.1
48.2
23.0
3.60.7
0
5
10
15
20
25
30
35
40
45
50
55
%
Wind Class Frequency Distribution
Wind Class (m/s)Calms 0.5 - 2.1 2.1 - 3.6 3.6 - 5.7 5.7 - 8.8 8.8 - 11.1 >= 11.1
0.12.4
11.4
56.3
22.1
7.2
0.00
10
20
30
40
50
60
%
Stability Class Frequency Distribution
Stability ClassA B C D E F G
Figure 2: Wind speed and direction distribution for synthesised surface winds at the East Ridgley
temporary asphalt plant site.

EML Air Pty Ltd Page 5 of 16
Air Emission Specialists MELBOURNE • SYDNEY • PERTH • BRISBANE
2.2 Sources
2.2.1 Activities and Mitigation Measures
The mobile drum mix asphalt plant that is proposed to be temporarily located at the site will produce up to a maximum of 180 tons per hour of asphalt. The temporary plant will operate for approximately six 2-week production windows for periods between the daylight hours of 7.30am to 6pm Monday to Friday and 7.30am to 12pm Saturday (not on Sundays or public holidays) during the year depending upon regional demand for asphalt. The forecast demand for the asphalt product is approximately 20,000 tons per year, which at the maximum production plant production rate is 120 hours of operaton, although the plant may operate for longer at a reduced capacity.
Emissions from the site of odour and dust will be abated using a range of design and management methods that will include the following:
• Particulates in the aggregate drying process air flow are to be abated by a baghouse filter system. The emissions to air from the mobile baghouse vent stack are assessed with a vent height of 6.09 m above ground level;
• Covers will be fitted to the drum mix load-out conveyor that transports asphalt up to the top of the storage silos. This will mitigate any residual blue smoke odorous emissions from dispersing into the atmosphere;
• The manufactured asphalt will be stored in a heated silo at a manageable temperature, and loaded out to trucks from this silo. This will avoid the blue smoke odorous emissions from load out that typically occur when the product is loaded onto tray trucks immediately after production when the asphalt composite material is still hot. These visible emissions cease when the product cools and is kept warmed just enough to make the product manageable. This will enable the distribution of asphalt product from the site throughout the day when the drum mix plant is not operating. The duration of the fugitive emissions are further abated by quick-loading from the silo onto tray trucks rather than a prolonged load direct from the drum mix plant as the product is mixed;
• The SAMI or Shell bitumen product is to be used. This is a low sulphur bitumen that has been “cut” during production of shorter chain odorous hydrocarbons specifically to reduce odour, and this is now widely used in asphalt manufacture around Victoria;
• Component aggregate will typically be sourced locally and stored onsite within bund walls to shield the raw material from winds and so to reduce erosion;
• Defined unsealed roadways will be constructed for vehicle ingress and egress from the site. These will be regularly maintained to minimise surface silt that may be eroded by winds and watered when necessary;
• Trucks entering the site are to have covered loads and will move at reduced speeds;
• Trucks with asphalt are to leave the site with the trays tarped to reduce odour emissions; and
• The bitumen is stored in bitumen kettles. Vapour return lines are to be used to vent the head space of an empty kettle back into the delivery tank truck thus avoiding odorous emissions to air.
Various pollutant emissions from the plant’s single discharge point are either estimated or based on direct measurements as detailed in Section 2.2.2.
Fugitive dust and odour emissions from the site are to be mitigated by design and managed as per the requirements detailed within separately detailed site environmental management procedures.

EML Air Pty Ltd Page 6 of 16
Air Emission Specialists MELBOURNE • SYDNEY • PERTH • BRISBANE
2.2.2 Discharge Point Emission Rates
Emissions for the plant are based on the following:
• Emissions data for particulates, combustion gases, volatile organic hydrocarbons (VOC’s) and other significant classified indicator emissions have been provided by Fulton Hogan (the plant operators) and are attached in Appendix A. These have been estimated using emission factors specific to drum mix asphalt plant using fuel oil for a plant maximum capacity of 180 ton/hr, as contained in the USEPA AP-42 emission factor datasets. Based on USEPA AP-42 particle size distributions1 downstream of a fabric filter, 60% of respirable particulate matter smaller than 10 micron (PM10) has been assumed to be smaller than 2.5 micron (PM2.5). This is conservative as the mobile plant will be actually run on refined diesel fuel which is not expected to be as polluting compared to a less refined fuel oil.
• Emissions rate data for Polycyclic Aromatic Hydrocarbons as Benzo-a-Pyrene equivalent (PAH as BaP TEQ) from the vent stack was based on measurements for a comparable drum mix plant fuelled by diesel fuel2.
• Emissions measurement data for odour from the vent stack was based on measurements for a comparable plant operated by Fulton Hogan using a comparable low sulphur bitumen. An emission rate of 3,600,000 OUV/min (60,000 OUV/sec) has been adopted.
The design discharge conditions are as follows:
• Stack height, 6.09 m agl.
• Circular flue, 0.73 m internal diameter.
• Discharge temperature, 120 deg. C.
• Discharge velocity, 20 m/s.
Emission rates of significant constituents may be tested and confirmed subsequent to installation and commissioning of the replacement plant.
2.2.3 Loadout odour emission rates
Asphalt is to be temporarily stored in an elevated silo for load out into tray trucks which pass beneath them. The silos are insulated to maintain the asphalt at a workable temperature which is lower than the original hot mix production temperature.
During the load out onto the tray trucks low levels of fugitive odour are expected to be released to atmosphere. However, as the asphalt will be at a temperature cooler than immediately after exiting the drum mix plant there is not expected to be any blue smoke fugitive emissions present. Further, as the asphalt is accumulated in the hopper, a truck may be loaded quickly (about 2 minutes) before the tray trucks are promptly tarped and driven off-site.
The fugitive odour emission data has been estimated based on data in EML Air’s archive of measurements at drum mix asphalt plants. A load out fugitive emission rate of 24,000 OUV/min, or 400 OUV/sec, has been estimated3. This was based on measuring fugitive odour in close proximity to a tray truck as asphalt was loaded direct from a drum mix plant and where some blue smoke emissions were in evidence. The odour was measured over 30 minutes within which approximately 6 dumps were made from a drum mix plant hopper into a tray truck, with asphalt produced using a modern low-odour bitumen binder with low sulphur levels.
1 USEPA AP-42 Table 11-1.4, 2004. 2 Emission rate for total PAH's (as BaP TEQ) based on EML Air test report N84299 for a diesel fuel fired drum mix asphalt plant. Emission rate = 140,000 ng/min = 0.14 mg/min = 8.4e-06 kg/hr 3 44 OU concentration as measured at a load out location at a comp arable plant type, by 540 Nm3/min horizontal wind wet flow rate = 24,000 OUV/min.

EML Air Pty Ltd Page 7 of 16
Air Emission Specialists MELBOURNE • SYDNEY • PERTH • BRISBANE
2.3 Dispersion Model Configuration
The CALPUFF modelling systems were configured in accordance with the guidelines detailed in the NSW Office of Environment and Heritage publication “Generic Guidance and Optimum Model Settings for the CALPUFF Modelling System for Inclusion into the ‘Approved Methods for the Modelling and Assessments of Air Pollutants in NSW, Australia’, 2011.” Key points are as follows:
• Default model configuration;
• The undulating terrain in the region of the site has been characterised by 100m resolution terrain elevation data based on terrain model data sourced from AusLig. Landuse and soil data were imported from the TAPM model database and adjusted based upon inspection of aerial imagery of the site and surrounding landuses.
• Structures located near to the stack are elevated above the ground and are not enclosed in a block form structure thus negating the influence of shedded wakes on the initial dispersion of the vent stack plume. Therefore the affect of building wakes on the proposed vent stack source are not included in the model;
• The dispersion relations of Pasquil and Gifford were adopted to characterise the dispersion of the emissions to air from the site in accordance with the guidance. These were adopted in a manner consistent with how they are used in the Australian Ausplume model;
• A receptor grid resolution of 50 m was adopted with a 4 km extent. Peak ground level concentrations were determined to occur within 300 m of the source;
• Note section 3.1.1 below. Comparison with design criteria for pollutants classified for their toxic, bio-accumulative or carcinogenic potential are assessed at the 99.9th percentile. For 1-hour or 3-minute averages the maximum of the 9th highest of 8784 predictions at each receptor was determined. For averaging periods of more than 1-hour the maximum prediction at each receptor was adopted. A unit emission rate from the vent stack was simulated and scaled by the adopted emission rate, and a representative background was added where applicable;
• Note section 3.1.2 below. Comparison with the amenity design criteria for odour (2 odour units) was assessed at the 99.5th percentile as a 1-hour average for this site as representative three-dimensional meteorological data was adopted for a more realistic characterisation of flows in the area. Emissions from the vent stack and loadout were simulated directly. The number of predicted exceedances of the 2 OU criteria was assessed and the spatial distribution of 45 exceedances of amenity criteria were examined (equivalent to the 99.5th percentile for 8784 hours of data). The emissions to air were conservatively simulated for 10 hours per day throughout the year, or for 3650 daylight hours. However, the actual operating hours are forecast to be much less than this, being confined to approximately 6 fortnightly production periods, and therefore the spatial distribution of the 99.5th percentile may be seen as very conservative for a direct comparison with the EPP-AIR amenity criteria for odour; and
• The modelling for particulate emissions (and hence PM2.5 and PM10) assumed no mass depletion of the dispersed plume.
Further information on the CALPUFF configuration is provided in the attached input files for a unit scenario and the odour scenario in Appendices B and C. Modelling files can be provided in electronic form upon request.

EML Air Pty Ltd Page 8 of 16
Air Emission Specialists MELBOURNE • SYDNEY • PERTH • BRISBANE
3. ASSESSMENT CRITERIA
3.1 Policy
3.1.1 Design Criteria
The Tasmanian Environment Protection Policy (Air Quality) 2004 (EPP-AIR), defines design ground level concentrations that must not be exceeded inclusive of representative existing background concentrations at relevant receptor locations.
Design ground level concentrations are specified to protect the public health and amenity, or other environmental factors if they are more sensitive than human health, such as certain types of vegetation. For particulate matter, the air quality goals of the National Environment Protection Measure for Ambient Air Quality (NEPM-AAQ) have been adopted. For other significant emission constituents that are not listed in the EPP-AIR, criteria from the Victorian Environmental Protection Policy Air Quality Management (SEPP-AQM) have been used. The adopted ground level concentration criteria for the classified indicator pollutants emitted from the plant are summarised in Table 1 below with the source and reason for each criteria indicated.
Table 1: Applicable design ground level concentrations
Classified Indicator SpeciesCriteria3 min, ug/m3
Criteria1 hour, ug/m3
Criteria8 hour, ug/m3
Criteria24 hour, ug/m3
Criteria90 day, ug/m3
Source Reason for classification
PM10 5.0E+01 NEPM-AAQ ToxicityPM2.5 2.5E+01 NEPM-AAQ Toxicity
CO 1.1E+04 EPP-AIR ToxicityNOX as NO2 3.3E+02 EPP-AIR Toxicity
SO2 5.7E+02 EPP-AIR ToxicityAsphalt fume (as 100% of VOC's) 1.7E+02 EPP-AIR Toxicity
Chromium (total) as Cr (III) 1.7E+01 EPP-AIR ToxicityHexavalent Chromium 1.7E-01 SEPP-AQM IARC Group 1 carcinogen
Copper 6.7E+00 EPP-AIR ToxicityLead 1.5E+00 EPP-AIR Toxicity
Manganese 3.3E+02 SEPP-AQM ToxicityMercury (as organic) 3.0E-01 EPP-AIR Bioaccumulation
Antimony 1.7E+01 SEPP-AQM ToxicityBarium 1.7E+01 EPP-AIR ToxicitySilver 3.3E-01 EPP-AIR ToxicityZinc 1.7E+02 EPP-AIR Toxicity
Benzene 1.0E+02 EPP-AIR IARC Group 1 carcinogenEthylbenzene 1.5E+04 EPP-AIR ToxicityFormaldehyde 5.0E+01 EPP-AIR Toxicity
Hexane 6.0E+03 EPP-AIR ToxicityToluene 6.5E+02 EPP-AIR OdourXylenes 3.5E+02 EPP-AIR Odour
Total PAH's (as BaP TEQ) 7.3E-01 SEPP-AQM IARC Group 2A carcinogenNotes:Gas volumes converted at zero degrees Celcius and at 1 atm:Nitrogen dioxide: 0.16ppm = 328 ug/m3Sulphur dioxide: 0.2 ppm = 570 ug/m3Carbon monoxide: 9 ppm = 11250 ug/m3

EML Air Pty Ltd Page 9 of 16
Air Emission Specialists MELBOURNE • SYDNEY • PERTH • BRISBANE
3.1.2 Odour Criteria
The Environment Protection Policy (Air Quality) 2004 also addresses odour. Clause 13 of the policy states that if the EPA considers that an activity is likely to cause an environmental nuisance then the EPA will require that the applicable criteria be met at and beyond the site boundary of the facility. In this case, an environmental nuisance would arise only if a sensitive receiver is exposed to an offensive odour from the plant. For this rural area the nearest sensitive receiver is an isolated residence located ~360 m to the south of the plant boundary (occupied by the lessee of the land upon which Fulton Hogan has negotiated to have the asphalt plant located). Figure 1 illustrates the location of the nearest sensitive receivers around the plant location.
The applicable compliance criterion is as defined in Schedule 3. For general odour, the criterion is 2 odour units (OU) as a 1-hour average. This applies at the 99.5th percentile when meteorological data is used that is highly representative of local conditions or at the 100th percentile where adequately representative data is not available. In this case, site representative three-dimensional meteorological data was simulated based on synoptic scale data provided by the Bureau of Meteorology using guideline methods so that a realistic characterisation of flows in the area could be used for the assessment of the transport, dispersion and impact of odour over the undulating terrain around the site. Therefore the assessment was based on peak model predictions at the 99.5th percentile and the assessment for compliance was based on the potential to cause an environmental nuisance at the nearest sensitive receivers in this rural area.

EML Air Pty Ltd Page 10 of 16
Air Emission Specialists MELBOURNE • SYDNEY • PERTH • BRISBANE
3.2 Existing Ambient Background
No formal ambient air monitoring has been conducted near East Ridgley. As a representative regional city, EML Air note that EPA Victoria conducted air monitoring in Ballarat from August 2005 to August 2006 (see EPA Victoria Publication 1111) and in Shepparton from December 2003 to December 2004 (see EPA Victoria Publication 992). The following determination for a representative fixed background concentration for relevant pollutant species are made:
• For PM10, a concentration of 25 ug/m3 was adopted viz. an air quality goal of 50 ug/m3. A value of 12 ug/m3 was adopted for PM2.5.
• For NO2, a concentration of 25 ppb (51 ug/m3) was adopted viz. a design criteria of 160 ppb (328 ug/m3).
• For CO, a concentration of 3 ppm (3.75 mg/m3) was adopted for use as a background, viz an objective of 11.25 mg/m3 as an 8 hour average.
3.3 Land use and Receivers
The mobile plant is to be temporarily located in a region of rural undulating terrain consisting predominantly of grass rangeland. Elevated terrain is to the west, south-east and south of the plant. Note the aerial photo of the site and surrounds in Figure 1 and that used as an underlay to the contour plots illustrated below. The line of site to the nearest sensitive receiver dwellings (SR1-3) is obscured by terrain and these receivers are at elevations higher than the source.
The nearest sensitive receiver is represented by an isolated rural residence 360 m to the south of the plant boundary (the owner is the lessee of the site for the mobile asphalt plant). Further afield, there exists rural residences 750 m to the north-west and 700 m to the east-south-east.
The plant is to be located next to an existing hard rock quarry operation from where feedstock may be sourced.

EML Air Pty Ltd Page 11 of 16
Air Emission Specialists MELBOURNE • SYDNEY • PERTH • BRISBANE
4. RESULTS
4.1 Classified Indicator Pollutants
Table 2 summarises the 99.9th percentile peak predicted ground level concentrations for the 6.09m vent height configuration. These have been initially derived from the highest prediction from the dataset of 99.9th percentile predictions at each receptor using a unity emission rate with CALPUFF and then compounded with the individual species emission rates as detailed in the same tables.
For the particulate, metal, organic and inorganic compounds compliance with specified design concentration criteria is predicted over the entire modelling domain. For particulates, nitrogen dioxide and carbon monoxide, this compliance is inclusive of conservatively estimated fixed background levels. It may be noted that the peak predicted ground level concentration of PM10 amounted to 6 ug/m3 excluding background, viz. a 24 hour goal of 50 ug/m3.
The species with the lowest safety factor of compliance was Asphalt Fume conservatively assessed as 100% of estimated VOC’s. The design criteria was reached but not significantly exceeded at a single location in the adjacent quarry site to the west of the mobile plant location. Figure 3 illustrates the spatial distribution of the 99.9th percentile predicted ground level concentrations of asphalt fume for an assumed 10 hours of operation per day. It can be seen that the peak predictions occur in the area of elevated terrain to the west and south of the site, away from the plant location. The plume strikes from the elevated emissions occur during the low frequency of light to moderate winds from the east and north-east. At the nearest sensitive receiver location to the south the peak prediction represents only 25% of the design criteria.
Table 2: Peak predicted ground level concentrations using a 6.09 m flue height for emitted classified indicator pollutants.
Classified Indicator Species
kg/hr species emission rate (1)
peak 99.9th %ile,3 min, ug/m3
peak 99.9th %ile,
1 hour, ug/m3
peak 100th %ile, 24
hour, ug/m3
Background ug/m3
Total peak 99.9th %ile,3 min, ug/m3
Total peak 99.9th %ile,
1 hour, ug/m3
Total peak 100th
%ile, 24 hour, ug/m3
Criteria3 min, ug/m3
Criteria1 hour, ug/m3
Criteria 24 hour, ug/m3
Compliant ?Compliance
Factor
PM10 3.8E-01 6.3E+00 25 3.1E+01 5.0E+01 YES 2PM2.5 2.5E-01 4.2E+00 12 1.6E+01 2.5E+01 YES 2
CO (2) 1.2E+01 4.6E+02 3750 4.2E+03 1.1E+04 YES 3NOX as NO2 4.9E+00 1.9E+02 51 2.4E+02 3.3E+02 YES 1
SO2 5.7E+00 2.2E+02 0 2.2E+02 5.7E+02 YES 3Asphalt Fume (as 100% of VOC's) 2.9E+00 1.7E+02 0 1.7E+02 1.7E+02 YES 1
Chromium (total) as Cr (III) 5.0E-04 3.0E-02 0 3.0E-02 1.7E+01 YES 570Hexavalent Chromium 4.1E-05 2.4E-03 0 2.4E-03 1.7E-01 YES 70
Copper 2.8E-04 1.7E-02 0 1.7E-02 6.7E+00 YES 398Lead (3) 1.4E-03 2.2E-02 0 2.2E-02 1.5E+00 YES 67
Manganese 6.9E-04 4.2E-02 0 4.2E-02 3.3E+02 YES 7900Mercury (as organic) 2.3E-04 1.4E-02 0 1.4E-02 3.0E-01 YES 21
Antimony 1.6E-05 9.8E-04 0 9.8E-04 1.7E+01 YES 17409Barium 5.2E-04 3.1E-02 0 3.1E-02 1.7E+01 YES 540Silver 4.3E-05 2.6E-03 0 2.6E-03 3.3E-01 YES 127Zinc 5.5E-03 3.3E-01 0 3.3E-01 1.7E+02 YES 514
Benzene 3.5E-02 2.1E+00 0 2.1E+00 1.0E+02 YES 47Ethylbenzene 2.2E-02 1.3E+00 0 1.3E+00 1.5E+04 YES 10934Formaldehyde 2.8E-01 1.7E+01 0 1.7E+01 5.0E+01 YES 3
Hexane 8.3E-02 5.0E+00 0 5.0E+00 6.0E+03 YES 1199Toluene 2.6E-01 1.6E+01 0 1.6E+01 6.5E+02 YES 41Xylenes 1.8E-02 1.1E+00 0 1.1E+00 3.5E+02 YES 323
Total PAH's (as BaP TEQ) (4) 8.4E-06 5.1E-04 0 5.1E-04 7.3E-01 YES 1442Notes:1. Design data provided by Fulton Hogan derived from USEPA AP-42 emissions estimation tables for fuel oil fired drum mix plant.Emission calculated on maximum plant capacity of 180 Tonnes/hour. The plant may operate between 7.30am - 6pm, up to 6 days/wk.The temporary plant will operate for several production periods of 2 weeks each. For a forecast 20,000 tonnes/year only 111 hours is required at peak capacity of 180 tonnes/hr (1.3% of time).2. Carbon Monoxide criteria is an 8-hour average and is noted to be compliant as a peak 1-hour average3. Lead criteria is a 90-day average and is noted to be compliant as a peak 24-hour average4. Emission rate for total PAH's (as BaP TEQ) based on EMLAIR test report N84299 for a diesel fuel fired drum mix asphalt plant. Emission rate = 140000 ng/min = 0.14 mg/min = 8.4e-06 kg/hr

EML Air Pty Ltd Page 12 of 16
Air Emission Specialists MELBOURNE • SYDNEY • PERTH • BRISBANE
4.2 Odour Figure 4 illustrates the contour of the predicted peak 1 hour average 2 OU level at the 99.5th percentile level with the plant assumed to be operating continuously for 10 hours per day within the 7am to 6pm period, 7 days per week.
It can be seen that the 99.5th percentile contour overlaps the rangeland and quarry site to the west and south of the plant location (due to plume strikes on the elevated terrain adjacent to the plant), however does not overlap any identified sensitive receiver locations. The predicted criteria level does not extend as far south at the nearest sensitive receiver (SR3).
The 2 OU EPP-AIR criteria contour at the 99.5th percentile level equates to 45 predicted hourly exceedances per year. It may therefore be surmised that with forecast operating hours far less than that simulated the actual extent of the impact will be substantially less than that predicted over the grass fields to the west and south of the plant.
This would indicate that for the adopted odorous emissions to air from the proposed temporary asphalt production and loadout operations, and for the low forecast operational hours for this temporary plant, the identified sensitive receivers in the area are very unlikely to be exposed to offensive odour.

EML Air Pty Ltd Page 13 of 16
Air Emission Specialists MELBOURNE • SYDNEY • PERTH • BRISBANE
5. CONCLUSIONS The proposed temporary drum mix asphalt plant has been assessed at a maximum throughput capacity of 180 tons per hour, operating at any hour of the day between 7am to 6pm, with constituent emissions estimated using AP42 emission estimation tables, apart from emissions of odour and PAH’s that were based on measurements from comparable plants and bitumen.
The predictions for inspirable and respirable dust (as PM10 and PM2.5), nitrogen dioxide and carbon monoxide, inclusive of representative background levels, indicate that the emissions from the temporary plant would not exceed their respective EPP-AIR design concentrations in the area around the plant, with each pollutant having a significant margin of safety . The predictions for individual metal, organic and inorganic pollutants also indicate that the emissions from the temporary plant would not exceed their respective EPP-AIR design concentrations in the area around the plant. Compliance with all EPP-AIR classified indicator pollutants was demonstrated with the adopted assumptions.
The emission constituent with the lowest margin of safety was asphalt fume (assessed as 100% of VOC emissions from the vent stack). Peak predicted levels were at the EPP-AIR design criteria however these occurred to the west of the site within the quarry area, and only 25% of the criteria level was predicted at the nearest sensitive receiver location.
Odour was also a critically constraining criterion for this air quality assessment. However, if the plant were to operate every day for 10 hours per day then the 2 OU criteria level at the 99.5th percentile level was not predicted to extend as far from the plant to the nearest sensitive receiver, located to the south. This was a very conservative assessment as the actual operating hours per year are forecast to be much less than that adopted within the constraints of the modelling methodology. This would indicate that for the adopted odorous emissions to air from the production and loadout operations the identified sensitive receivers in the area of the plant are very unlikely to be exposed to offensive odour. Therefore it may be concluded that this plant will be unlikely to cause an environmental nuisance as described in Clause 13 of the EPP-AIR, based on the assessment criteria detailed in Schedule 3 of the policy.
These predictions of ground level odour included a conservative estimate of fugitive load out emissions of 24,000 OUV/min and 3,600,000 OUV/min from the vent stack. Further, the predictions of ground level asphalt fume (as volatile organic compounds) included a conservative emission estimate of 2.9 kg/hr. Upon commissioning of the mobile plant, emission testing may be conducted to confirm that these emission rates are comparable with these levels.

EML Air Pty Ltd Page 14 of 16
Air Emission Specialists MELBOURNE • SYDNEY • PERTH • BRISBANE
Figure 3
402.5 403 403.5 404 404.5 405
Eastings (m)
5443.5
5444
5444.5
5445
Nor
thin
gs (m
)
Plant
Predicted 3-minute average ground level concentrations the 99.9th percentile.VOC emissions from drum mix vent stack for assumed 10 hour per day operations.
Contour 25 ug/m3 intervals. EPP-Air Asphalt Fume criteria level: 170 ug/m3
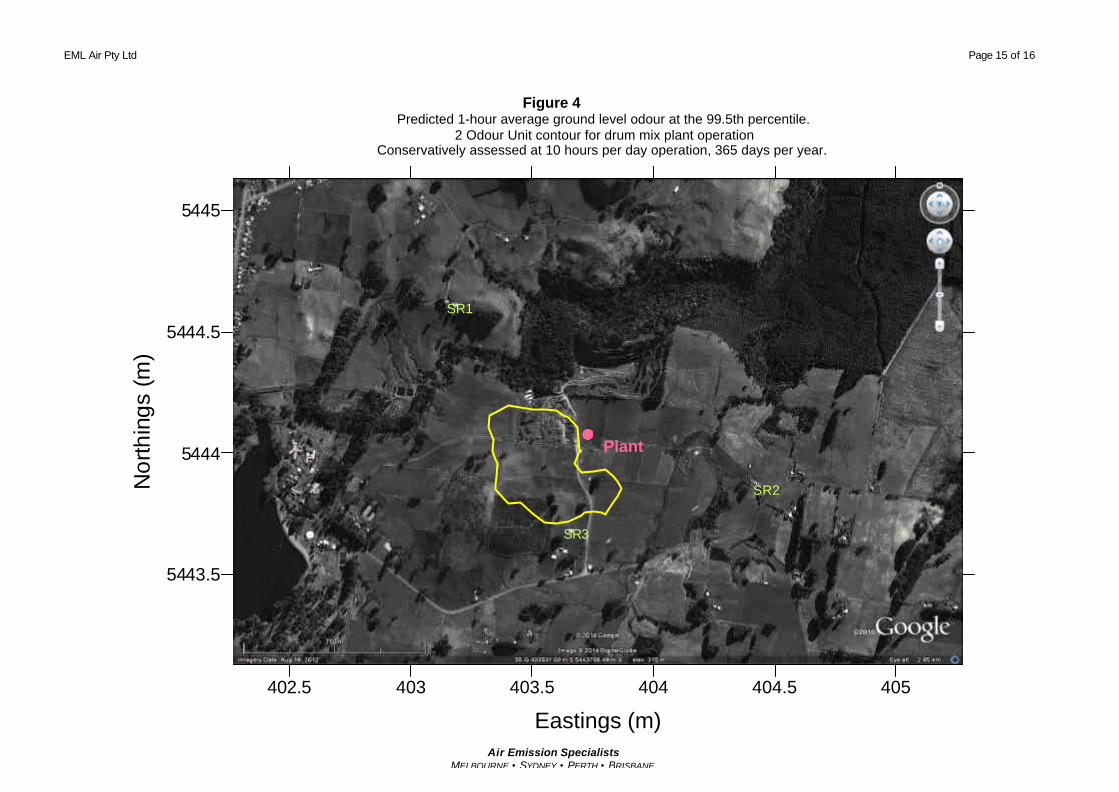
EML Air Pty Ltd Page 15 of 16
Air Emission Specialists MELBOURNE • SYDNEY • PERTH • BRISBANE
Figure 4
402.5 403 403.5 404 404.5 405
Eastings (m)
5443.5
5444
5444.5
5445
Nor
thin
gs (
m)
Plant
Predicted 1-hour average ground level odour at the 99.5th percentile.2 Odour Unit contour for drum mix plant operation
Conservatively assessed at 10 hours per day operation, 365 days per year.
SR3
SR2
SR1
EML Air Pty Ltd Page 16 of 16
Air Emission Specialists MELBOURNE • SYDNEY • PERTH • BRISBANE
6. LIMITATIONS
This report represents the results of an air dispersion modelling impact assessment for the purposes of this commission. The data and assessment outcomes provided herein relate only to the project and structures described herein and must be reviewed by a competent engineer/scientist before being used for any other purpose. EML Air accept no responsibility for other use of the data and assessment outcomes.
Where monitoring results, physical measurements and tests, data collection and similar work have been performed and recorded by others the data is included and used in the form provided by others. The responsibility for the accuracy of such data remains with the issuing authority, not with EML Air.
An understanding of a site’s air quality impact depends on the integration of many pieces of information, some regional, some site specific, some structure specific and some experienced based. Hence this report should not be altered, amended or abbreviated, issued in part or issued incomplete in any way without prior checking and approval by EML Air. EML Air accepts no responsibility for any circumstances which arise from the issue of the report which has been modified in any way as outlined above.
Written and approved for release by Andrew Lewis, Environmental Consultant, 26/8/14.

EML Air Pty Ltd
Air Emission Specialists MELBOURNE • SYDNEY • PERTH • BRISBANE
Appendix A: Emissions data for Continuous Drum Mix Ducted Emissions (supplied by Fulton Hogan)


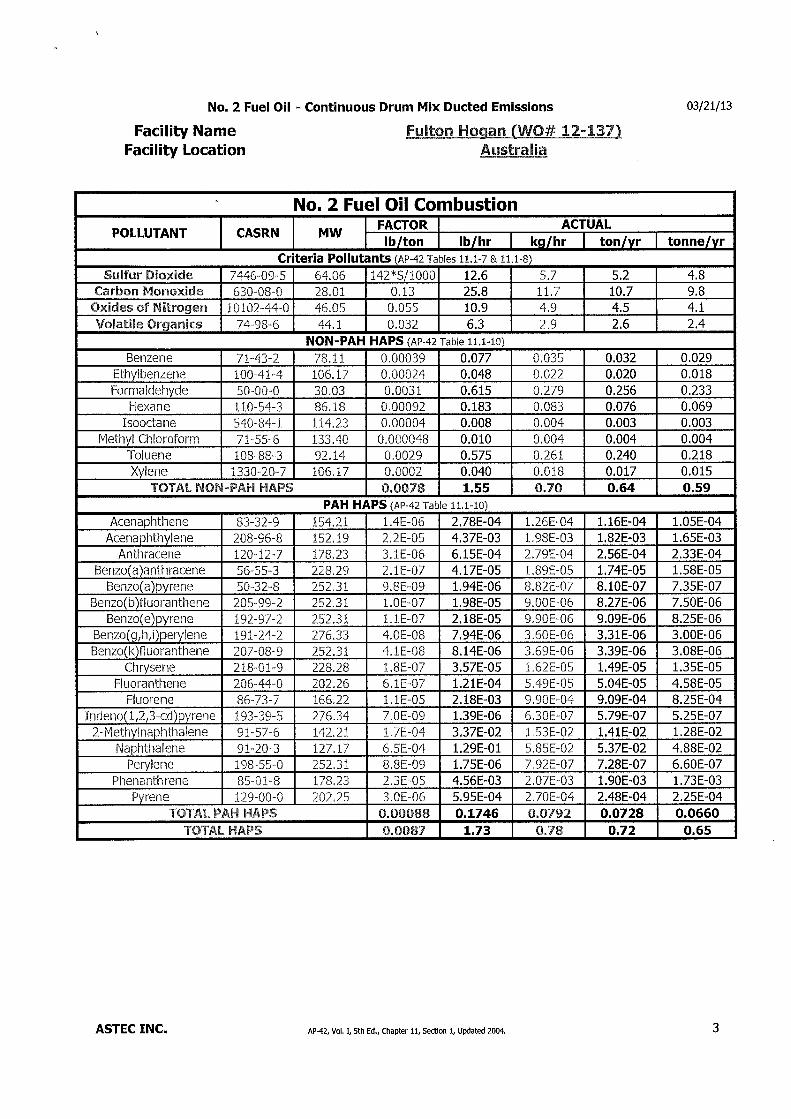


EML Air Pty Ltd Appendix B page 1
Air Emission Specialists MELBOURNE • SYDNEY • PERTH • BRISBANE
Appendix B CALPUFF input configuration file – unit vent stack emission rate
East Rigley Temporary Asphalt Plant Unit emission rate from vent stack only - 3 MIN AVERAGE ---------------- Run title (3 lines) ------------------------------------------ CALPUFF MODEL CONTROL FILE -------------------------- ------------------------------------------------------------------------------- INPUT GROUP: 0 -- Input and Output File Names -------------- Default Name Type File Name ------------ ---- --------- CALMET.DAT input ! METDAT =..\..\CMET100-part1.DAT ! or ISCMET.DAT input * ISCDAT = * or PLMMET.DAT input * PLMDAT = * or PROFILE.DAT input * PRFDAT = * SURFACE.DAT input * SFCDAT = * RESTARTB.DAT input * RSTARTB= * -------------------------------------------------------------------------------- CALPUFF.LST output ! PUFLST =vent-unit-3MIN.LST ! CONC.DAT output ! CONDAT =vent-unit-3MIN.CON ! DFLX.DAT output * DFDAT =CPUF.DRY * WFLX.DAT output * WFDAT =CPUF.WET * VISB.DAT output * VISDAT =CPUF.VIS * TK2D.DAT output * T2DDAT = * RHO2D.DAT output * RHODAT = * RESTARTE.DAT output * RSTARTE= * -------------------------------------------------------------------------------- Emission Files -------------- PTEMARB.DAT input * PTDAT = * VOLEMARB.DAT input * VOLDAT = * BAEMARB.DAT input * ARDAT = * LNEMARB.DAT input * LNDAT = * -------------------------------------------------------------------------------- Other Files ----------- OZONE.DAT input * OZDAT =OZONE.DAT * VD.DAT input * VDDAT = * CHEM.DAT input * CHEMDAT= * H2O2.DAT input * H2O2DAT= * HILL.DAT input * HILDAT= * HILLRCT.DAT input * RCTDAT= * COASTLN.DAT input * CSTDAT= * FLUXBDY.DAT input * BDYDAT= * BCON.DAT input * BCNDAT= * DEBUG.DAT output * DEBUG = * MASSFLX.DAT output * FLXDAT= * MASSBAL.DAT output * BALDAT= * FOG.DAT output * FOGDAT= * -------------------------------------------------------------------------------- All file names will be converted to lower case if LCFILES = T Otherwise, if LCFILES = F, file names will be converted to UPPER CASE T = lower case ! LCFILES = F ! F = UPPER CASE NOTE: (1) file/path names can be up to 70 characters in length
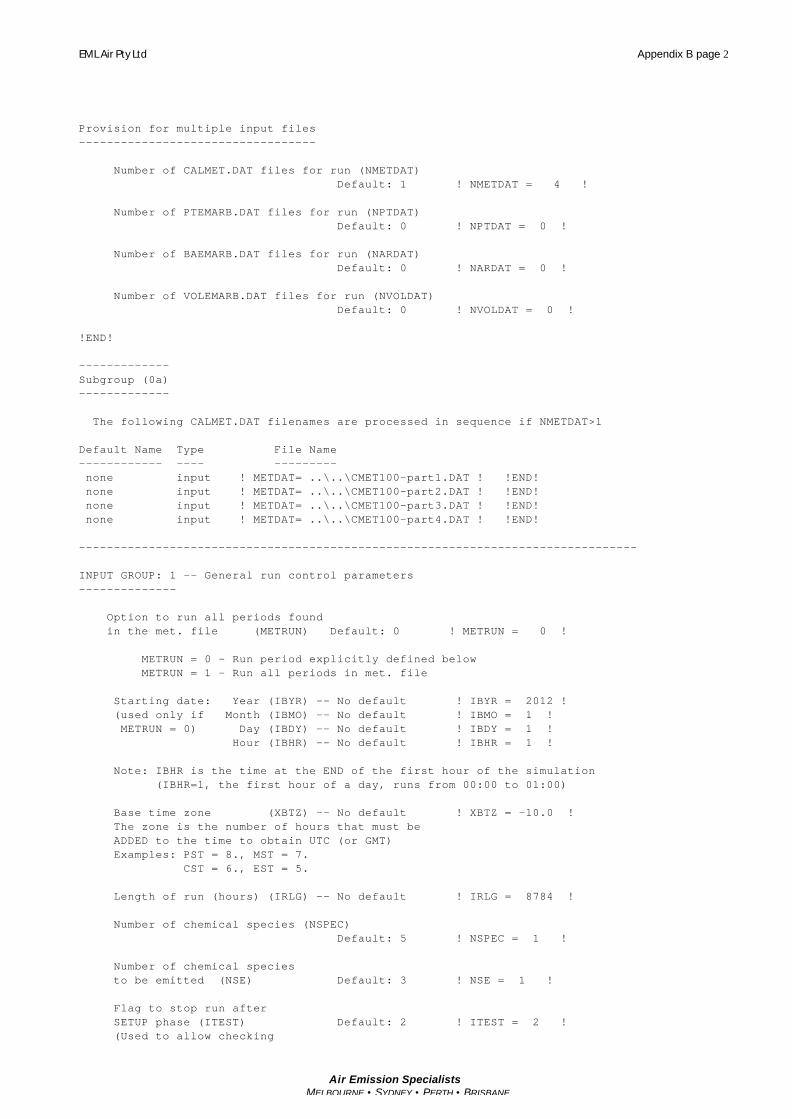
EML Air Pty Ltd Appendix B page 2
Air Emission Specialists MELBOURNE • SYDNEY • PERTH • BRISBANE
Provision for multiple input files ---------------------------------- Number of CALMET.DAT files for run (NMETDAT) Default: 1 ! NMETDAT = 4 ! Number of PTEMARB.DAT files for run (NPTDAT) Default: 0 ! NPTDAT = 0 ! Number of BAEMARB.DAT files for run (NARDAT) Default: 0 ! NARDAT = 0 ! Number of VOLEMARB.DAT files for run (NVOLDAT) Default: 0 ! NVOLDAT = 0 ! !END! ------------- Subgroup (0a) ------------- The following CALMET.DAT filenames are processed in sequence if NMETDAT>1 Default Name Type File Name ------------ ---- --------- none input ! METDAT= ..\..\CMET100-part1.DAT ! !END! none input ! METDAT= ..\..\CMET100-part2.DAT ! !END! none input ! METDAT= ..\..\CMET100-part3.DAT ! !END! none input ! METDAT= ..\..\CMET100-part4.DAT ! !END! -------------------------------------------------------------------------------- INPUT GROUP: 1 -- General run control parameters -------------- Option to run all periods found in the met. file (METRUN) Default: 0 ! METRUN = 0 ! METRUN = 0 - Run period explicitly defined below METRUN = 1 - Run all periods in met. file Starting date: Year (IBYR) -- No default ! IBYR = 2012 ! (used only if Month (IBMO) -- No default ! IBMO = 1 ! METRUN = 0) Day (IBDY) -- No default ! IBDY = 1 ! Hour (IBHR) -- No default ! IBHR = 1 ! Note: IBHR is the time at the END of the first hour of the simulation (IBHR=1, the first hour of a day, runs from 00:00 to 01:00) Base time zone (XBTZ) -- No default ! XBTZ = -10.0 ! The zone is the number of hours that must be ADDED to the time to obtain UTC (or GMT) Examples: PST = 8., MST = 7. CST = 6., EST = 5. Length of run (hours) (IRLG) -- No default ! IRLG = 8784 ! Number of chemical species (NSPEC) Default: 5 ! NSPEC = 1 ! Number of chemical species to be emitted (NSE) Default: 3 ! NSE = 1 ! Flag to stop run after SETUP phase (ITEST) Default: 2 ! ITEST = 2 ! (Used to allow checking

EML Air Pty Ltd Appendix B page 3
Air Emission Specialists MELBOURNE • SYDNEY • PERTH • BRISBANE
of the model inputs, files, etc.) ITEST = 1 - STOPS program after SETUP phase ITEST = 2 - Continues with execution of program after SETUP Restart Configuration: Control flag (MRESTART) Default: 0 ! MRESTART = 0 ! 0 = Do not read or write a restart file 1 = Read a restart file at the beginning of the run 2 = Write a restart file during run 3 = Read a restart file at beginning of run and write a restart file during run Number of periods in Restart output cycle (NRESPD) Default: 0 ! NRESPD = 0 ! 0 = File written only at last period >0 = File updated every NRESPD periods Meteorological Data Format (METFM) Default: 1 ! METFM = 1 ! METFM = 1 - CALMET binary file (CALMET.MET) METFM = 2 - ISC ASCII file (ISCMET.MET) METFM = 3 - AUSPLUME ASCII file (PLMMET.MET) METFM = 4 - CTDM plus tower file (PROFILE.DAT) and surface parameters file (SURFACE.DAT) METFM = 5 - AERMET tower file (PROFILE.DAT) and surface parameters file (SURFACE.DAT) Meteorological Profile Data Format (MPRFFM) (used only for METFM = 1, 2, 3) Default: 1 ! MPRFFM = 1 ! MPRFFM = 1 - CTDM plus tower file (PROFILE.DAT) MPRFFM = 2 - AERMET tower file (PROFILE.DAT) PG sigma-y is adjusted by the factor (AVET/PGTIME)**0.2 Averaging Time (minutes) (AVET) Default: 60.0 ! AVET = 3. ! PG Averaging Time (minutes) (PGTIME) Default: 60.0 ! PGTIME = 3. ! !END! ------------------------------------------------------------------------------- INPUT GROUP: 2 -- Technical options -------------- Vertical distribution used in the near field (MGAUSS) Default: 1 ! MGAUSS = 1 ! 0 = uniform 1 = Gaussian Terrain adjustment method (MCTADJ) Default: 3 ! MCTADJ = 3 ! 0 = no adjustment 1 = ISC-type of terrain adjustment 2 = simple, CALPUFF-type of terrain adjustment 3 = partial plume path adjustment

EML Air Pty Ltd Appendix B page 4
Air Emission Specialists MELBOURNE • SYDNEY • PERTH • BRISBANE
Subgrid-scale complex terrain flag (MCTSG) Default: 0 ! MCTSG = 0 ! 0 = not modeled 1 = modeled Near-field puffs modeled as elongated slugs? (MSLUG) Default: 0 ! MSLUG = 0 ! 0 = no 1 = yes (slug model used) Transitional plume rise modeled? (MTRANS) Default: 1 ! MTRANS = 1 ! 0 = no (i.e., final rise only) 1 = yes (i.e., transitional rise computed) Stack tip downwash? (MTIP) Default: 1 ! MTIP = 1 ! 0 = no (i.e., no stack tip downwash) 1 = yes (i.e., use stack tip downwash) Method used to simulate building downwash? (MBDW) Default: 1 ! MBDW = 1 ! 1 = ISC method 2 = PRIME method Vertical wind shear modeled above stack top? (MSHEAR) Default: 0 ! MSHEAR = 0 ! 0 = no (i.e., vertical wind shear not modeled) 1 = yes (i.e., vertical wind shear modeled) Puff splitting allowed? (MSPLIT) Default: 0 ! MSPLIT = 0 ! 0 = no (i.e., puffs not split) 1 = yes (i.e., puffs are split) Chemical mechanism flag (MCHEM) Default: 1 ! MCHEM = 0 ! 0 = chemical transformation not modeled 1 = transformation rates computed internally (MESOPUFF II scheme) 2 = user-specified transformation rates used 3 = transformation rates computed internally (RIVAD/ARM3 scheme) 4 = secondary organic aerosol formation computed (MESOPUFF II scheme for OH) Aqueous phase transformation flag (MAQCHEM) (Used only if MCHEM = 1, or 3) Default: 0 ! MAQCHEM = 0 ! 0 = aqueous phase transformation not modeled 1 = transformation rates adjusted for aqueous phase reactions Wet removal modeled ? (MWET) Default: 1 ! MWET = 0 ! 0 = no 1 = yes Dry deposition modeled ? (MDRY) Default: 1 ! MDRY = 0 ! 0 = no 1 = yes (dry deposition method specified for each species in Input Group 3) Gravitational settling (plume tilt) modeled ? (MTILT) Default: 0 ! MTILT = 0 ! 0 = no 1 = yes

EML Air Pty Ltd Appendix B page 5
Air Emission Specialists MELBOURNE • SYDNEY • PERTH • BRISBANE
(puff center falls at the gravitational settling velocity for 1 particle species) Restrictions: - MDRY = 1 - NSPEC = 1 (must be particle species as well) - sg = 0 GEOMETRIC STANDARD DEVIATION in Group 8 is set to zero for a single particle diameter Method used to compute dispersion coefficients (MDISP) Default: 3 ! MDISP = 3 ! 1 = dispersion coefficients computed from measured values of turbulence, sigma v, sigma w 2 = dispersion coefficients from internally calculated sigma v, sigma w using micrometeorological variables (u*, w*, L, etc.) 3 = PG dispersion coefficients for RURAL areas (computed using the ISCST multi-segment approximation) and MP coefficients in urban areas 4 = same as 3 except PG coefficients computed using the MESOPUFF II eqns. 5 = CTDM sigmas used for stable and neutral conditions. For unstable conditions, sigmas are computed as in MDISP = 3, described above. MDISP = 5 assumes that measured values are read Sigma-v/sigma-theta, sigma-w measurements used? (MTURBVW) (Used only if MDISP = 1 or 5) Default: 3 ! MTURBVW = 3 ! 1 = use sigma-v or sigma-theta measurements from PROFILE.DAT to compute sigma-y (valid for METFM = 1, 2, 3, 4, 5) 2 = use sigma-w measurements from PROFILE.DAT to compute sigma-z (valid for METFM = 1, 2, 3, 4, 5) 3 = use both sigma-(v/theta) and sigma-w from PROFILE.DAT to compute sigma-y and sigma-z (valid for METFM = 1, 2, 3, 4, 5) 4 = use sigma-theta measurements from PLMMET.DAT to compute sigma-y (valid only if METFM = 3) Back-up method used to compute dispersion when measured turbulence data are missing (MDISP2) Default: 3 ! MDISP2 = 3 ! (used only if MDISP = 1 or 5) 2 = dispersion coefficients from internally calculated sigma v, sigma w using micrometeorological variables (u*, w*, L, etc.) 3 = PG dispersion coefficients for RURAL areas (computed using the ISCST multi-segment approximation) and MP coefficients in urban areas 4 = same as 3 except PG coefficients computed using the MESOPUFF II eqns. [DIAGNOSTIC FEATURE] Method used for Lagrangian timescale for Sigma-y (used only if MDISP=1,2 or MDISP2=1,2) (MTAULY) Default: 0 ! MTAULY = 0 ! 0 = Draxler default 617.284 (s) 1 = Computed as Lag. Length / (.75 q) -- after SCIPUFF 10 < Direct user input (s) -- e.g., 306.9 [DIAGNOSTIC FEATURE] Method used for Advective-Decay timescale for Turbulence (used only if MDISP=2 or MDISP2=2) (MTAUADV) Default: 0 ! MTAUADV = 0 !

EML Air Pty Ltd Appendix B page 6
Air Emission Specialists MELBOURNE • SYDNEY • PERTH • BRISBANE
0 = No turbulence advection 1 = Computed (OPTION NOT IMPLEMENTED) 10 < Direct user input (s) -- e.g., 300 Method used to compute turbulence sigma-v & sigma-w using micrometeorological variables (Used only if MDISP = 2 or MDISP2 = 2) (MCTURB) Default: 1 ! MCTURB = 1 ! 1 = Standard CALPUFF subroutines 2 = AERMOD subroutines PG sigma-y,z adj. for roughness? Default: 0 ! MROUGH = 0 ! (MROUGH) 0 = no 1 = yes Partial plume penetration of Default: 1 ! MPARTL = 1 ! elevated inversion? (MPARTL) 0 = no 1 = yes Strength of temperature inversion Default: 0 ! MTINV = 0 ! provided in PROFILE.DAT extended records? (MTINV) 0 = no (computed from measured/default gradients) 1 = yes PDF used for dispersion under convective conditions? Default: 0 ! MPDF = 0 ! (MPDF) 0 = no 1 = yes Sub-Grid TIBL module used for shore line? Default: 0 ! MSGTIBL = 0 ! (MSGTIBL) 0 = no 1 = yes Boundary conditions (concentration) modeled? Default: 0 ! MBCON = 0 ! (MBCON) 0 = no 1 = yes, using formatted BCON.DAT file 2 = yes, using unformatted CONC.DAT file Note: MBCON > 0 requires that the last species modeled be 'BCON'. Mass is placed in species BCON when generating boundary condition puffs so that clean air entering the modeling domain can be simulated in the same way as polluted air. Specify zero emission of species BCON for all regular sources. Individual source contributions saved? Default: 0 ! MSOURCE = 0 ! (MSOURCE) 0 = no 1 = yes Analyses of fogging and icing impacts due to emissions from arrays of mechanically-forced cooling towers can be performed using CALPUFF in conjunction with a cooling tower emissions processor (CTEMISS) and its associated postprocessors. Hourly emissions of water vapor and temperature from each cooling tower cell are computed for the current cell configuration and ambient

EML Air Pty Ltd Appendix B page 7
Air Emission Specialists MELBOURNE • SYDNEY • PERTH • BRISBANE
conditions by CTEMISS. CALPUFF models the dispersion of these emissions and provides cloud information in a specialized format for further analysis. Output to FOG.DAT is provided in either 'plume mode' or 'receptor mode' format. Configure for FOG Model output? Default: 0 ! MFOG = 0 ! (MFOG) 0 = no 1 = yes - report results in PLUME Mode format 2 = yes - report results in RECEPTOR Mode format Test options specified to see if they conform to regulatory values? (MREG) Default: 1 ! MREG = 0 ! 0 = NO checks are made 1 = Technical options must conform to USEPA Long Range Transport (LRT) guidance METFM 1 or 2 AVET 60. (min) PGTIME 60. (min) MGAUSS 1 MCTADJ 3 MTRANS 1 MTIP 1 MCHEM 1 or 3 (if modeling SOx, NOx) MWET 1 MDRY 1 MDISP 2 or 3 MPDF 0 if MDISP=3 1 if MDISP=2 MROUGH 0 MPARTL 1 SYTDEP 550. (m) MHFTSZ 0 SVMIN 0.5 (m/s) !END! ------------------------------------------------------------------------------- INPUT GROUP: 3a, 3b -- Species list ------------------- ------------ Subgroup (3a) ------------ The following species are modeled: ! CSPEC = SO2 ! !END! Dry OUTPUT GROUP SPECIES MODELED EMITTED DEPOSITED NUMBER NAME (0=NO, 1=YES) (0=NO, 1=YES) (0=NO, (0=NONE, (Limit: 12 1=COMPUTED-GAS 1=1st CGRUP, Characters 2=COMPUTED-PARTICLE 2=2nd CGRUP, in length) 3=USER-SPECIFIED) 3= etc.) ! SO2 = 1, 1, 0, 0 ! !END! Note: The last species in (3a) must be 'BCON' when using the
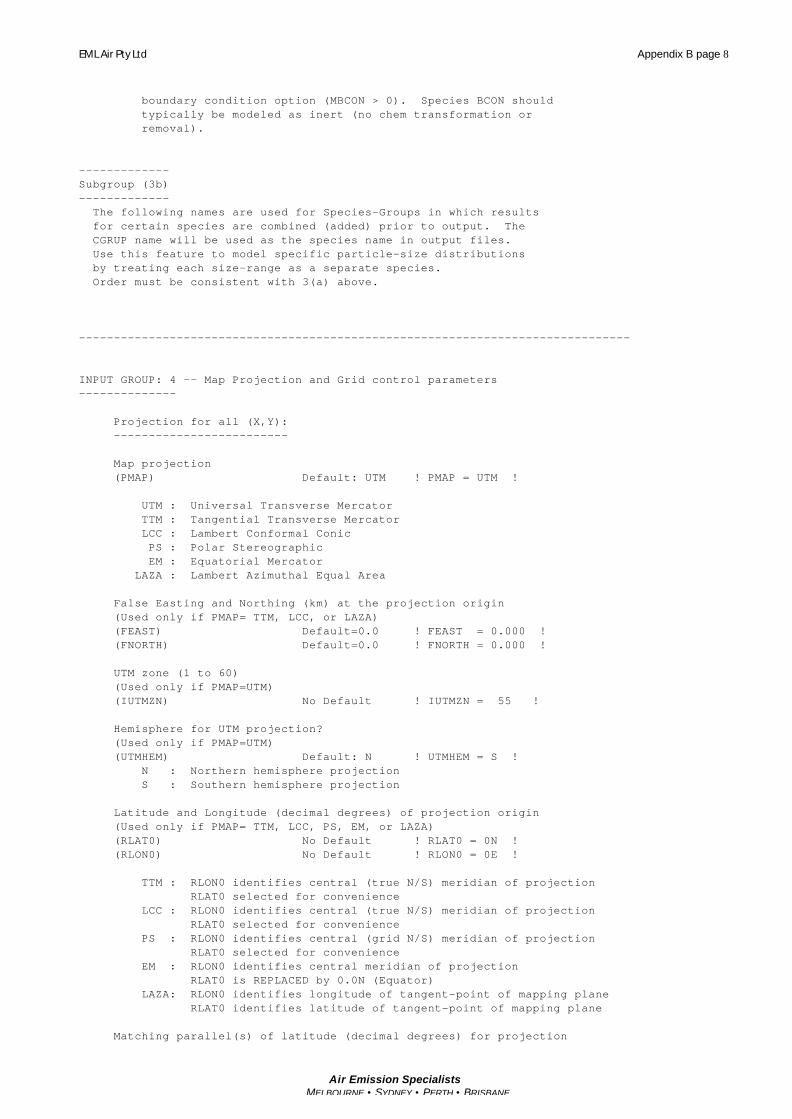
EML Air Pty Ltd Appendix B page 8
Air Emission Specialists MELBOURNE • SYDNEY • PERTH • BRISBANE
boundary condition option (MBCON > 0). Species BCON should typically be modeled as inert (no chem transformation or removal). ------------- Subgroup (3b) ------------- The following names are used for Species-Groups in which results for certain species are combined (added) prior to output. The CGRUP name will be used as the species name in output files. Use this feature to model specific particle-size distributions by treating each size-range as a separate species. Order must be consistent with 3(a) above. ------------------------------------------------------------------------------- INPUT GROUP: 4 -- Map Projection and Grid control parameters -------------- Projection for all (X,Y): ------------------------- Map projection (PMAP) Default: UTM ! PMAP = UTM ! UTM : Universal Transverse Mercator TTM : Tangential Transverse Mercator LCC : Lambert Conformal Conic PS : Polar Stereographic EM : Equatorial Mercator LAZA : Lambert Azimuthal Equal Area False Easting and Northing (km) at the projection origin (Used only if PMAP= TTM, LCC, or LAZA) (FEAST) Default=0.0 ! FEAST = 0.000 ! (FNORTH) Default=0.0 ! FNORTH = 0.000 ! UTM zone (1 to 60) (Used only if PMAP=UTM) (IUTMZN) No Default ! IUTMZN = 55 ! Hemisphere for UTM projection? (Used only if PMAP=UTM) (UTMHEM) Default: N ! UTMHEM = S ! N : Northern hemisphere projection S : Southern hemisphere projection Latitude and Longitude (decimal degrees) of projection origin (Used only if PMAP= TTM, LCC, PS, EM, or LAZA) (RLAT0) No Default ! RLAT0 = 0N ! (RLON0) No Default ! RLON0 = 0E ! TTM : RLON0 identifies central (true N/S) meridian of projection RLAT0 selected for convenience LCC : RLON0 identifies central (true N/S) meridian of projection RLAT0 selected for convenience PS : RLON0 identifies central (grid N/S) meridian of projection RLAT0 selected for convenience EM : RLON0 identifies central meridian of projection RLAT0 is REPLACED by 0.0N (Equator) LAZA: RLON0 identifies longitude of tangent-point of mapping plane RLAT0 identifies latitude of tangent-point of mapping plane Matching parallel(s) of latitude (decimal degrees) for projection

EML Air Pty Ltd Appendix B page 9
Air Emission Specialists MELBOURNE • SYDNEY • PERTH • BRISBANE
(Used only if PMAP= LCC or PS) (XLAT1) No Default ! XLAT1 = 0N ! (XLAT2) No Default ! XLAT2 = 0N ! LCC : Projection cone slices through Earth's surface at XLAT1 and XLAT2 PS : Projection plane slices through Earth at XLAT1 (XLAT2 is not used) ---------- Note: Latitudes and longitudes should be positive, and include a letter N,S,E, or W indicating north or south latitude, and east or west longitude. For example, 35.9 N Latitude = 35.9N 118.7 E Longitude = 118.7E Datum-region ------------ The Datum-Region for the coordinates is identified by a character string. Many mapping products currently available use the model of the Earth known as the World Geodetic System 1984 (WGS-84). Other local models may be in use, and their selection in CALMET will make its output consistent with local mapping products. The list of Datum-Regions with official transformation parameters is provided by the National Imagery and Mapping Agency (NIMA). NIMA Datum - Regions(Examples) ------------------------------------------------------------------------------ WGS-84 WGS-84 Reference Ellipsoid and Geoid, Global coverage (WGS84) NAS-C NORTH AMERICAN 1927 Clarke 1866 Spheroid, MEAN FOR CONUS (NAD27) NAR-C NORTH AMERICAN 1983 GRS 80 Spheroid, MEAN FOR CONUS (NAD83) NWS-84 NWS 6370KM Radius, Sphere ESR-S ESRI REFERENCE 6371KM Radius, Sphere Datum-region for output coordinates (DATUM) Default: WGS-84 ! DATUM = WGS-84 ! METEOROLOGICAL Grid: Rectangular grid defined for projection PMAP, with X the Easting and Y the Northing coordinate No. X grid cells (NX) No default ! NX = 100 ! No. Y grid cells (NY) No default ! NY = 100 ! No. vertical layers (NZ) No default ! NZ = 10 ! Grid spacing (DGRIDKM) No default ! DGRIDKM = 0.1 ! Units: km Cell face heights (ZFACE(nz+1)) No defaults Units: m ! ZFACE = .0, 20.0, 40.0, 80.0, 160.0, 300.0, 600.0, 1000.0, 1500.0, 2200.0, 3000.0 ! Reference Coordinates of SOUTHWEST corner of grid cell(1, 1): X coordinate (XORIGKM) No default ! XORIGKM = 398.552 ! Y coordinate (YORIGKM) No default ! YORIGKM = 5439.004 ! Units: km COMPUTATIONAL Grid:

EML Air Pty Ltd Appendix B page 10
Air Emission Specialists MELBOURNE • SYDNEY • PERTH • BRISBANE
The computational grid is identical to or a subset of the MET. grid. The lower left (LL) corner of the computational grid is at grid point (IBCOMP, JBCOMP) of the MET. grid. The upper right (UR) corner of the computational grid is at grid point (IECOMP, JECOMP) of the MET. grid. The grid spacing of the computational grid is the same as the MET. grid. X index of LL corner (IBCOMP) No default ! IBCOMP = 1 ! (1 <= IBCOMP <= NX) Y index of LL corner (JBCOMP) No default ! JBCOMP = 1 ! (1 <= JBCOMP <= NY) X index of UR corner (IECOMP) No default ! IECOMP = 100 ! (1 <= IECOMP <= NX) Y index of UR corner (JECOMP) No default ! JECOMP = 100 ! (1 <= JECOMP <= NY) SAMPLING Grid (GRIDDED RECEPTORS): The lower left (LL) corner of the sampling grid is at grid point (IBSAMP, JBSAMP) of the MET. grid. The upper right (UR) corner of the sampling grid is at grid point (IESAMP, JESAMP) of the MET. grid. The sampling grid must be identical to or a subset of the computational grid. It may be a nested grid inside the computational grid. The grid spacing of the sampling grid is DGRIDKM/MESHDN. Logical flag indicating if gridded receptors are used (LSAMP) Default: T ! LSAMP = T ! (T=yes, F=no) X index of LL corner (IBSAMP) No default ! IBSAMP = 30 ! (IBCOMP <= IBSAMP <= IECOMP) Y index of LL corner (JBSAMP) No default ! JBSAMP = 30 ! (JBCOMP <= JBSAMP <= JECOMP) X index of UR corner (IESAMP) No default ! IESAMP = 70 ! (IBCOMP <= IESAMP <= IECOMP) Y index of UR corner (JESAMP) No default ! JESAMP = 70 ! (JBCOMP <= JESAMP <= JECOMP) Nesting factor of the sampling grid (MESHDN) Default: 1 ! MESHDN = 2 ! (MESHDN is an integer >= 1) !END! ------------------------------------------------------------------------------- INPUT GROUP: 5 -- Output Options -------------- * * FILE DEFAULT VALUE VALUE THIS RUN ---- ------------- -------------- Concentrations (ICON) 1 ! ICON = 1 ! Dry Fluxes (IDRY) 1 ! IDRY = 0 ! Wet Fluxes (IWET) 1 ! IWET = 0 ! 2D Temperature (IT2D) 0 ! IT2D = 0 !

EML Air Pty Ltd Appendix B page 11
Air Emission Specialists MELBOURNE • SYDNEY • PERTH • BRISBANE
2D Density (IRHO) 0 ! IRHO = 0 ! Relative Humidity (IVIS) 1 ! IVIS = 0 ! (relative humidity file is required for visibility analysis) Use data compression option in output file? (LCOMPRS) Default: T ! LCOMPRS = T ! * 0 = Do not create file, 1 = create file QA PLOT FILE OUTPUT OPTION: Create a standard series of output files (e.g. locations of sources, receptors, grids ...) suitable for plotting? (IQAPLOT) Default: 1 ! IQAPLOT = 1 ! 0 = no 1 = yes DIAGNOSTIC MASS FLUX OUTPUT OPTIONS: Mass flux across specified boundaries for selected species reported? (IMFLX) Default: 0 ! IMFLX = 0 ! 0 = no 1 = yes (FLUXBDY.DAT and MASSFLX.DAT filenames are specified in Input Group 0) Mass balance for each species reported? (IMBAL) Default: 0 ! IMBAL = 0 ! 0 = no 1 = yes (MASSBAL.DAT filename is specified in Input Group 0) LINE PRINTER OUTPUT OPTIONS: Print concentrations (ICPRT) Default: 0 ! ICPRT = 0 ! Print dry fluxes (IDPRT) Default: 0 ! IDPRT = 0 ! Print wet fluxes (IWPRT) Default: 0 ! IWPRT = 0 ! (0 = Do not print, 1 = Print) Concentration print interval (ICFRQ) in timesteps Default: 1 ! ICFRQ = 1 ! Dry flux print interval (IDFRQ) in timesteps Default: 1 ! IDFRQ = 1 ! Wet flux print interval (IWFRQ) in timesteps Default: 1 ! IWFRQ = 1 ! Units for Line Printer Output (IPRTU) Default: 1 ! IPRTU = 1 ! for for Concentration Deposition 1 = g/m**3 g/m**2/s 2 = mg/m**3 mg/m**2/s 3 = ug/m**3 ug/m**2/s 4 = ng/m**3 ng/m**2/s 5 = Odour Units Messages tracking progress of run written to the screen ? (IMESG) Default: 2 ! IMESG = 2 ! 0 = no 1 = yes (advection step, puff ID) 2 = yes (YYYYJJJHH, # old puffs, # emitted puffs)

EML Air Pty Ltd Appendix B page 12
Air Emission Specialists MELBOURNE • SYDNEY • PERTH • BRISBANE
SPECIES (or GROUP for combined species) LIST FOR OUTPUT OPTIONS ---- CONCENTRATIONS ---- ------ DRY FLUXES ------ ------ WET FLUXES ------ -- MASS FLUX -- SPECIES /GROUP PRINTED? SAVED ON DISK? PRINTED? SAVED ON DISK? PRINTED? SAVED ON DISK? SAVED ON DISK? ------- ------------------------ ------------------------ ------------------------ --------------- ! SO2 = 1, 1, 0, 0, 0, 0, 0 ! Note: Species BCON (for MBCON > 0) does not need to be saved on disk. OPTIONS FOR PRINTING "DEBUG" QUANTITIES (much output) Logical for debug output (LDEBUG) Default: F ! LDEBUG = F ! First puff to track (IPFDEB) Default: 1 ! IPFDEB = 1 ! Number of puffs to track (NPFDEB) Default: 1 ! NPFDEB = 1 ! Met. period to start output (NN1) Default: 1 ! NN1 = 1 ! Met. period to end output (NN2) Default: 10 ! NN2 = 10 ! !END! ------------------------------------------------------------------------------- INPUT GROUP: 6a, 6b, & 6c -- Subgrid scale complex terrain inputs ------------------------- --------------- Subgroup (6a) --------------- Number of terrain features (NHILL) Default: 0 ! NHILL = 0 ! Number of special complex terrain receptors (NCTREC) Default: 0 ! NCTREC = 0 ! Terrain and CTSG Receptor data for CTSG hills input in CTDM format ? (MHILL) No Default ! MHILL = 2 ! 1 = Hill and Receptor data created by CTDM processors & read from HILL.DAT and HILLRCT.DAT files 2 = Hill data created by OPTHILL & input below in Subgroup (6b); Receptor data in Subgroup (6c) Factor to convert horizontal dimensions Default: 1.0 ! XHILL2M = 1.0 ! to meters (MHILL=1) Factor to convert vertical dimensions Default: 1.0 ! ZHILL2M = 1.0 ! to meters (MHILL=1) X-origin of CTDM system relative to No Default ! XCTDMKM = 0 !

EML Air Pty Ltd Appendix B page 13
Air Emission Specialists MELBOURNE • SYDNEY • PERTH • BRISBANE
CALPUFF coordinate system, in Kilometers (MHILL=1) Y-origin of CTDM system relative to No Default ! YCTDMKM = 0 ! CALPUFF coordinate system, in Kilometers (MHILL=1) ! END ! --------------- Subgroup (6b) --------------- 1 ** HILL information HILL XC YC THETAH ZGRID RELIEF EXPO 1 EXPO 2 SCALE 1 SCALE 2 AMAX1 AMAX2 NO. (km) (km) (deg.) (m) (m) (m) (m) (m) (m) (m) (m) ---- ---- ---- ------ ----- ------ ------ ------ ------- ------- ----- ----- --------------- Subgroup (6c) --------------- COMPLEX TERRAIN RECEPTOR INFORMATION XRCT YRCT ZRCT XHH (km) (km) (m) ------ ----- ------ ---- ------------------- 1 Description of Complex Terrain Variables: XC, YC = Coordinates of center of hill THETAH = Orientation of major axis of hill (clockwise from North) ZGRID = Height of the 0 of the grid above mean sea level RELIEF = Height of the crest of the hill above the grid elevation EXPO 1 = Hill-shape exponent for the major axis EXPO 2 = Hill-shape exponent for the major axis SCALE 1 = Horizontal length scale along the major axis SCALE 2 = Horizontal length scale along the minor axis AMAX = Maximum allowed axis length for the major axis BMAX = Maximum allowed axis length for the major axis XRCT, YRCT = Coordinates of the complex terrain receptors ZRCT = Height of the ground (MSL) at the complex terrain Receptor XHH = Hill number associated with each complex terrain receptor (NOTE: MUST BE ENTERED AS A REAL NUMBER) ** NOTE: DATA for each hill and CTSG receptor are treated as a separate input subgroup and therefore must end with an input group terminator. ------------------------------------------------------------------------------- INPUT GROUP: 7 -- Chemical parameters for dry deposition of gases -------------- SPECIES DIFFUSIVITY ALPHA STAR REACTIVITY MESOPHYLL RESISTANCE HENRY'S LAW COEFFICIENT

EML Air Pty Ltd Appendix B page 14
Air Emission Specialists MELBOURNE • SYDNEY • PERTH • BRISBANE
NAME (cm**2/s) (s/cm) (dimensionless) ------- ----------- ---------- ---------- -------------------- ----------------------- ! SO2 = .1509, 1000.0, 8.0, .0, .04 ! !END! ------------------------------------------------------------------------------- INPUT GROUP: 8 -- Size parameters for dry deposition of particles -------------- For SINGLE SPECIES, the mean and standard deviation are used to compute a deposition velocity for NINT (see group 9) size-ranges, and these are then averaged to obtain a mean deposition velocity. For GROUPED SPECIES, the size distribution should be explicitly specified (by the 'species' in the group), and the standard deviation for each should be entered as 0. The model will then use the deposition velocity for the stated mean diameter. SPECIES GEOMETRIC MASS MEAN GEOMETRIC STANDARD NAME DIAMETER DEVIATION (microns) (microns) ------- ------------------- ------------------ ! SO4 = .48, 2.0 ! !END! ------------------------------------------------------------------------------- INPUT GROUP: 9 -- Miscellaneous dry deposition parameters -------------- Reference cuticle resistance (s/cm) (RCUTR) Default: 30 ! RCUTR = 30.0 ! Reference ground resistance (s/cm) (RGR) Default: 10 ! RGR = 5.0 ! Reference pollutant reactivity (REACTR) Default: 8 ! REACTR = 8.0 ! Number of particle-size intervals used to evaluate effective particle deposition velocity (NINT) Default: 9 ! NINT = 9 ! Vegetation state in unirrigated areas (IVEG) Default: 1 ! IVEG = 1 ! IVEG=1 for active and unstressed vegetation IVEG=2 for active and stressed vegetation IVEG=3 for inactive vegetation !END! ------------------------------------------------------------------------------- INPUT GROUP: 10 -- Wet Deposition Parameters ---------------

EML Air Pty Ltd Appendix B page 15
Air Emission Specialists MELBOURNE • SYDNEY • PERTH • BRISBANE
Scavenging Coefficient -- Units: (sec)**(-1) Pollutant Liquid Precip. Frozen Precip. --------- -------------- -------------- ! SO2 = 3.0E-05, 0.0E00 ! !END! ------------------------------------------------------------------------------- INPUT GROUP: 11 -- Chemistry Parameters --------------- Ozone data input option (MOZ) Default: 1 ! MOZ = 1 ! (Used only if MCHEM = 1, 3, or 4) 0 = use a monthly background ozone value 1 = read hourly ozone concentrations from the OZONE.DAT data file Monthly ozone concentrations (Used only if MCHEM = 1, 3, or 4 and MOZ = 0 or MOZ = 1 and all hourly O3 data missing) (BCKO3) in ppb Default: 12*80. ! BCKO3 = 40.00, 40.00, 40.00, 40.00, 40.00, 40.00, 40.00, 40.00, 40.00, 40.00, 40.00, 40.00 ! Monthly ammonia concentrations (Used only if MCHEM = 1, or 3) (BCKNH3) in ppb Default: 12*10. ! BCKNH3 = 10.00, 10.00, 10.00, 10.00, 10.00, 10.00, 10.00, 10.00, 10.00, 10.00, 10.00, 10.00 ! Nighttime SO2 loss rate (RNITE1) in percent/hour Default: 0.2 ! RNITE1 = .2 ! Nighttime NOx loss rate (RNITE2) in percent/hour Default: 2.0 ! RNITE2 = 2.0 ! Nighttime HNO3 formation rate (RNITE3) in percent/hour Default: 2.0 ! RNITE3 = 2.0 ! H2O2 data input option (MH2O2) Default: 1 ! MH2O2 = 1 ! (Used only if MAQCHEM = 1) 0 = use a monthly background H2O2 value 1 = read hourly H2O2 concentrations from the H2O2.DAT data file Monthly H2O2 concentrations (Used only if MQACHEM = 1 and MH2O2 = 0 or MH2O2 = 1 and all hourly H2O2 data missing) (BCKH2O2) in ppb Default: 12*1. ! BCKH2O2 = 1.00, 1.00, 1.00, 1.00, 1.00, 1.00, 1.00, 1.00, 1.00, 1.00, 1.00, 1.00 ! --- Data for SECONDARY ORGANIC AEROSOL (SOA) Option (used only if MCHEM = 4) The SOA module uses monthly values of: Fine particulate concentration in ug/m^3 (BCKPMF) Organic fraction of fine particulate (OFRAC) VOC / NOX ratio (after reaction) (VCNX) to characterize the air mass when computing the formation of SOA from VOC emissions. Typical values for several distinct air mass types are: Month 1 2 3 4 5 6 7 8 9 10 11 12

EML Air Pty Ltd Appendix B page 16
Air Emission Specialists MELBOURNE • SYDNEY • PERTH • BRISBANE
Jan Feb Mar Apr May Jun Jul Aug Sep Oct Nov Dec Clean Continental BCKPMF 1. 1. 1. 1. 1. 1. 1. 1. 1. 1. 1. 1. OFRAC .15 .15 .20 .20 .20 .20 .20 .20 .20 .20 .20 .15 VCNX 50. 50. 50. 50. 50. 50. 50. 50. 50. 50. 50. 50. Clean Marine (surface) BCKPMF .5 .5 .5 .5 .5 .5 .5 .5 .5 .5 .5 .5 OFRAC .25 .25 .30 .30 .30 .30 .30 .30 .30 .30 .30 .25 VCNX 50. 50. 50. 50. 50. 50. 50. 50. 50. 50. 50. 50. Urban - low biogenic (controls present) BCKPMF 30. 30. 30. 30. 30. 30. 30. 30. 30. 30. 30. 30. OFRAC .20 .20 .25 .25 .25 .25 .25 .25 .20 .20 .20 .20 VCNX 4. 4. 4. 4. 4. 4. 4. 4. 4. 4. 4. 4. Urban - high biogenic (controls present) BCKPMF 60. 60. 60. 60. 60. 60. 60. 60. 60. 60. 60. 60. OFRAC .25 .25 .30 .30 .30 .55 .55 .55 .35 .35 .35 .25 VCNX 15. 15. 15. 15. 15. 15. 15. 15. 15. 15. 15. 15. Regional Plume BCKPMF 20. 20. 20. 20. 20. 20. 20. 20. 20. 20. 20. 20. OFRAC .20 .20 .25 .35 .25 .40 .40 .40 .30 .30 .30 .20 VCNX 15. 15. 15. 15. 15. 15. 15. 15. 15. 15. 15. 15. Urban - no controls present BCKPMF 100. 100. 100. 100. 100. 100. 100. 100. 100. 100. 100. 100. OFRAC .30 .30 .35 .35 .35 .55 .55 .55 .35 .35 .35 .30 VCNX 2. 2. 2. 2. 2. 2. 2. 2. 2. 2. 2. 2. Default: Clean Continental ! BCKPMF = 1.00, 1.00, 1.00, 1.00, 1.00, 1.00, 1.00, 1.00, 1.00, 1.00, 1.00, 1.00 ! ! OFRAC = 0.15, 0.15, 0.20, 0.20, 0.20, 0.20, 0.20, 0.20, 0.20, 0.20, 0.20, 0.15 ! ! VCNX = 50.00, 50.00, 50.00, 50.00, 50.00, 50.00, 50.00, 50.00, 50.00, 50.00, 50.00, 50.00 ! !END! ------------------------------------------------------------------------------- INPUT GROUP: 12 -- Misc. Dispersion and Computational Parameters --------------- Horizontal size of puff (m) beyond which time-dependent dispersion equations (Heffter) are used to determine sigma-y and sigma-z (SYTDEP) Default: 550. ! SYTDEP = 5.5E02 ! Switch for using Heffter equation for sigma z as above (0 = Not use Heffter; 1 = use Heffter (MHFTSZ) Default: 0 ! MHFTSZ = 0 ! Stability class used to determine plume growth rates for puffs above the boundary layer (JSUP) Default: 5 ! JSUP = 5 ! Vertical dispersion constant for stable conditions (k1 in Eqn. 2.7-3) (CONK1) Default: 0.01 ! CONK1 = .01 ! Vertical dispersion constant for neutral/ unstable conditions (k2 in Eqn. 2.7-4) (CONK2) Default: 0.1 ! CONK2 = .1 !

EML Air Pty Ltd Appendix B page 17
Air Emission Specialists MELBOURNE • SYDNEY • PERTH • BRISBANE
Factor for determining Transition-point from Schulman-Scire to Huber-Snyder Building Downwash scheme (SS used for Hs < Hb + TBD * HL) (TBD) Default: 0.5 ! TBD = .5 ! TBD < 0 ==> always use Huber-Snyder TBD = 1.5 ==> always use Schulman-Scire TBD = 0.5 ==> ISC Transition-point Range of land use categories for which urban dispersion is assumed (IURB1, IURB2) Default: 10 ! IURB1 = 10 ! 19 ! IURB2 = 19 ! Site characterization parameters for single-point Met data files --------- (needed for METFM = 2,3,4,5) Land use category for modeling domain (ILANDUIN) Default: 20 ! ILANDUIN = 20 ! Roughness length (m) for modeling domain (Z0IN) Default: 0.25 ! Z0IN = .25 ! Leaf area index for modeling domain (XLAIIN) Default: 3.0 ! XLAIIN = 3.0 ! Elevation above sea level (m) (ELEVIN) Default: 0.0 ! ELEVIN = .0 ! Latitude (degrees) for met location (XLATIN) Default: -999. ! XLATIN = .0 ! Longitude (degrees) for met location (XLONIN) Default: -999. ! XLONIN = .0 ! Specialized information for interpreting single-point Met data files ----- Anemometer height (m) (Used only if METFM = 2,3) (ANEMHT) Default: 10. ! ANEMHT = 10.0 ! Form of lateral turbulance data in PROFILE.DAT file (Used only if METFM = 4,5 or MTURBVW = 1 or 3) (ISIGMAV) Default: 1 ! ISIGMAV = 1 ! 0 = read sigma-theta 1 = read sigma-v Choice of mixing heights (Used only if METFM = 4) (IMIXCTDM) Default: 0 ! IMIXCTDM = 0 ! 0 = read PREDICTED mixing heights 1 = read OBSERVED mixing heights Maximum length of a slug (met. grid units) (XMXLEN) Default: 1.0 ! XMXLEN = 1.0 ! Maximum travel distance of a puff/slug (in grid units) during one sampling step (XSAMLEN) Default: 1.0 ! XSAMLEN = 1.0 ! Maximum Number of slugs/puffs release from one source during one time step (MXNEW) Default: 99 ! MXNEW = 99 ! Maximum Number of sampling steps for one puff/slug during one time step (MXSAM) Default: 99 ! MXSAM = 99 ! Number of iterations used when computing the transport wind for a sampling step that includes gradual rise (for CALMET

EML Air Pty Ltd Appendix B page 18
Air Emission Specialists MELBOURNE • SYDNEY • PERTH • BRISBANE
and PROFILE winds) (NCOUNT) Default: 2 ! NCOUNT = 2 ! Minimum sigma y for a new puff/slug (m) (SYMIN) Default: 1.0 ! SYMIN = 1.0 ! Minimum sigma z for a new puff/slug (m) (SZMIN) Default: 1.0 ! SZMIN = 1.0 ! Default minimum turbulence velocities sigma-v and sigma-w for each stability class over land and over water (m/s) (SVMIN(12) and SWMIN(12)) ---------- LAND ---------- --------- WATER ---------- Stab Class : A B C D E F A B C D E F --- --- --- --- --- --- --- --- --- --- --- --- Default SVMIN : .50, .50, .50, .50, .50, .50, .37, .37, .37, .37, .37, .37 Default SWMIN : .20, .12, .08, .06, .03, .016, .20, .12, .08, .06, .03, .016 ! SVMIN = 0.500, 0.500, 0.500, 0.500, 0.500, 0.500, 0.370, 0.370, 0.370, 0.370, 0.370, 0.370! ! SWMIN = 0.200, 0.120, 0.080, 0.060, 0.030, 0.016, 0.200, 0.120, 0.080, 0.060, 0.030, 0.016! Divergence criterion for dw/dz across puff used to initiate adjustment for horizontal convergence (1/s) Partial adjustment starts at CDIV(1), and full adjustment is reached at CDIV(2) (CDIV(2)) Default: 0.0,0.0 ! CDIV = .0, .0 ! Minimum wind speed (m/s) allowed for non-calm conditions. Also used as minimum speed returned when using power-law extrapolation toward surface (WSCALM) Default: 0.5 ! WSCALM = .5 ! Maximum mixing height (m) (XMAXZI) Default: 3000. ! XMAXZI = 3000.0 ! Minimum mixing height (m) (XMINZI) Default: 50. ! XMINZI = 80.0 ! Default wind speed classes -- 5 upper bounds (m/s) are entered; the 6th class has no upper limit (WSCAT(5)) Default : ISC RURAL : 1.54, 3.09, 5.14, 8.23, 10.8 (10.8+) Wind Speed Class : 1 2 3 4 5 --- --- --- --- --- ! WSCAT = 1.54, 3.09, 5.14, 8.23, 10.80 ! Default wind speed profile power-law exponents for stabilities 1-6 (PLX0(6)) Default : ISC RURAL values ISC RURAL : .07, .07, .10, .15, .35, .55 ISC URBAN : .15, .15, .20, .25, .30, .30 Stability Class : A B C D E F --- --- --- --- --- --- ! PLX0 = 0.07, 0.07, 0.10, 0.15, 0.35, 0.55 ! Default potential temperature gradient for stable classes E, F (degK/m) (PTG0(2)) Default: 0.020, 0.035 ! PTG0 = 0.020, 0.035 !

EML Air Pty Ltd Appendix B page 19
Air Emission Specialists MELBOURNE • SYDNEY • PERTH • BRISBANE
Default plume path coefficients for each stability class (used when option for partial plume height terrain adjustment is selected -- MCTADJ=3) (PPC(6)) Stability Class : A B C D E F Default PPC : .50, .50, .50, .50, .35, .35 --- --- --- --- --- --- ! PPC = 0.50, 0.50, 0.50, 0.50, 0.35, 0.35 ! Slug-to-puff transition criterion factor equal to sigma-y/length of slug (SL2PF) Default: 10. ! SL2PF = 10.0 ! Puff-splitting control variables ------------------------ VERTICAL SPLIT -------------- Number of puffs that result every time a puff is split - nsplit=2 means that 1 puff splits into 2 (NSPLIT) Default: 3 ! NSPLIT = 3 ! Time(s) of a day when split puffs are eligible to be split once again; this is typically set once per day, around sunset before nocturnal shear develops. 24 values: 0 is midnight (00:00) and 23 is 11 PM (23:00) 0=do not re-split 1=eligible for re-split (IRESPLIT(24)) Default: Hour 17 = 1 ! IRESPLIT = 0,0,0,0,0,0,0,0,0,0,0,0,0,0,0,0,0,1,0,0,0,0,0,0 ! Split is allowed only if last hour's mixing height (m) exceeds a minimum value (ZISPLIT) Default: 100. ! ZISPLIT = 100.0 ! Split is allowed only if ratio of last hour's mixing ht to the maximum mixing ht experienced by the puff is less than a maximum value (this postpones a split until a nocturnal layer develops) (ROLDMAX) Default: 0.25 ! ROLDMAX = 0.25 ! HORIZONTAL SPLIT ---------------- Number of puffs that result every time a puff is split - nsplith=5 means that 1 puff splits into 5 (NSPLITH) Default: 5 ! NSPLITH = 5 ! Minimum sigma-y (Grid Cells Units) of puff before it may be split (SYSPLITH) Default: 1.0 ! SYSPLITH = 1.0 ! Minimum puff elongation rate (SYSPLITH/hr) due to wind shear, before it may be split (SHSPLITH) Default: 2. ! SHSPLITH = 2.0 ! Minimum concentration (g/m^3) of each species in puff before it may be split Enter array of NSPEC values; if a single value is entered, it will be used for ALL species (CNSPLITH) Default: 1.0E-07 ! CNSPLITH = 1.0E-07 ! Integration control variables ------------------------ Fractional convergence criterion for numerical SLUG sampling integration

EML Air Pty Ltd Appendix B page 20
Air Emission Specialists MELBOURNE • SYDNEY • PERTH • BRISBANE
(EPSSLUG) Default: 1.0e-04 ! EPSSLUG = 1.0E-04 ! Fractional convergence criterion for numerical AREA source integration (EPSAREA) Default: 1.0e-06 ! EPSAREA = 1.0E-06 ! Trajectory step-length (m) used for numerical rise integration (DSRISE) Default: 1.0 ! DSRISE = 1.0 ! Boundary Condition (BC) Puff control variables ------------------------ Minimum height (m) to which BC puffs are mixed as they are emitted (MBCON=2 ONLY). Actual height is reset to the current mixing height at the release point if greater than this minimum. (HTMINBC) Default: 500. ! HTMINBC = 500.0 ! Search radius (km) about a receptor for sampling nearest BC puff. BC puffs are typically emitted with a spacing of one grid cell length, so the search radius should be greater than DGRIDKM. (RSAMPBC) Default: 10. ! RSAMPBC = 10.0 ! Near-Surface depletion adjustment to concentration profile used when sampling BC puffs? (MDEPBC) Default: 1 ! MDEPBC = 1 ! 0 = Concentration is NOT adjusted for depletion 1 = Adjust Concentration for depletion !END! ------------------------------------------------------------------------------- INPUT GROUPS: 13a, 13b, 13c, 13d -- Point source parameters -------------------------------- --------------- Subgroup (13a) --------------- Number of point sources with parameters provided below (NPT1) No default ! NPT1 = 1 ! Units used for point source emissions below (IPTU) Default: 1 ! IPTU = 1 ! 1 = g/s 2 = kg/hr 3 = lb/hr 4 = tons/yr 5 = Odour Unit * m**3/s (vol. flux of odour compound) 6 = Odour Unit * m**3/min 7 = metric tons/yr Number of source-species combinations with variable emissions scaling factors provided below in (13d) (NSPT1) Default: 0 ! NSPT1 = 1 ! Number of point sources with variable emission parameters provided in external file (NPT2) No default ! NPT2 = 0 ! (If NPT2 > 0, these point source emissions are read from the file: PTEMARB.DAT) !END!

EML Air Pty Ltd Appendix B page 21
Air Emission Specialists MELBOURNE • SYDNEY • PERTH • BRISBANE
--------------- Subgroup (13b) --------------- a POINT SOURCE: CONSTANT DATA ----------------------------- b c Source X Y Stack Base Stack Exit Exit Bldg. Emission No. Coordinate Coordinate Height Elevation Diameter Vel. Temp. Dwash Rates (km) (km) (m) (m) (m) (m/s) (deg. K) ------ ---------- ---------- ------ ------ -------- ----- -------- ----- -------- 1 ! SRCNAM = VENT ! 1 ! X = 403.724, 5444.079, 6.09, 246., 0.73, 20.0, 393.0, .0, 1. ! 1 ! ZPLTFM = .0 ! 1 ! FMFAC = 1.0 ! !END! -------- a Data for each source are treated as a separate input subgroup and therefore must end with an input group terminator. SRCNAM is a 12-character name for a source (No default) X is an array holding the source data listed by the column headings (No default) SIGYZI is an array holding the initial sigma-y and sigma-z (m) (Default: 0.,0.) FMFAC is a vertical momentum flux factor (0. or 1.0) used to represent the effect of rain-caps or other physical configurations that reduce momentum rise associated with the actual exit velocity. (Default: 1.0 -- full momentum used) ZPLTFM is the platform height (m) for sources influenced by an isolated structure that has a significant open area between the surface and the bulk of the structure, such as an offshore oil platform. The Base Elevation is that of the surface (ground or ocean), and the Stack Height is the release height above the Base (not above the platform). Building heights entered in Subgroup 13c must be those of the buildings on the platform, measured from the platform deck. ZPLTFM is used only with MBDW=1 (ISC downwash method) for sources with building downwash. (Default: 0.0) b 0. = No building downwash modeled 1. = Downwash modeled for buildings resting on the surface 2. = Downwash modeled for buildings raised above the surface (ZPLTFM > 0.) NOTE: must be entered as a REAL number (i.e., with decimal point) c An emission rate must be entered for every pollutant modeled. Enter emission rate of zero for secondary pollutants that are modeled, but not emitted. Units are specified by IPTU (e.g. 1 for g/s). --------------- Subgroup (13c) --------------- BUILDING DIMENSION DATA FOR SOURCES SUBJECT TO DOWNWASH ------------------------------------------------------- Source a No. Effective building height, width, length and X/Y offset (in meters) every 10 degrees. LENGTH, XBADJ, and YBADJ are only needed for MBDW=2 (PRIME downwash option) ------ --------------------------------------------------------------------

EML Air Pty Ltd Appendix B page 22
Air Emission Specialists MELBOURNE • SYDNEY • PERTH • BRISBANE
-------- a Building height, width, length, and X/Y offset from the source are treated as a separate input subgroup for each source and therefore must end with an input group terminator. The X/Y offset is the position, relative to the stack, of the center of the upwind face of the projected building, with the x-axis pointing along the flow direction. --------------- Subgroup (13d) --------------- a POINT SOURCE: VARIABLE EMISSIONS DATA --------------------------------------- Use this subgroup to describe temporal variations in the emission rates given in 13b. Factors entered multiply the rates in 13b. Skip sources here that have constant emissions. For more elaborate variation in source parameters, use PTEMARB.DAT and NPT2 > 0. IVARY determines the type of variation, and is source-specific: (IVARY) Default: 0 0 = Constant 1 = Diurnal cycle (24 scaling factors: hours 1-24) 2 = Monthly cycle (12 scaling factors: months 1-12) 3 = Hour & Season (4 groups of 24 hourly scaling factors, where first group is DEC-JAN-FEB) 4 = Speed & Stab. (6 groups of 6 scaling factors, where first group is Stability Class A, and the speed classes have upper bounds (m/s) defined in Group 12 5 = Temperature (12 scaling factors, where temperature classes have upper bounds (C) of: 0, 5, 10, 15, 20, 25, 30, 35, 40, 45, 50, 50+) !SRCNAM = VENT ! !IVARY = 1! !SO2 = 0,0,0,0,0,0,0,1,1,1,1,1,1,1,1,1,1,1,0,0,0,0,0,0 ! !END! -------- a Data for each species are treated as a separate input subgroup and therefore must end with an input group terminator. ------------------------------------------------------------------------------- INPUT GROUPS: 14a, 14b, 14c, 14d -- Area source parameters -------------------------------- --------------- Subgroup (14a) --------------- Number of polygon area sources with parameters specified below (NAR1) No default ! NAR1 = 0 ! Units used for area source emissions below (IARU) Default: 1 ! IARU = 1 ! 1 = g/m**2/s 2 = kg/m**2/hr 3 = lb/m**2/hr 4 = tons/m**2/yr 5 = Odour Unit * m/s (vol. flux/m**2 of odour compound)

EML Air Pty Ltd Appendix B page 23
Air Emission Specialists MELBOURNE • SYDNEY • PERTH • BRISBANE
6 = Odour Unit * m/min 7 = metric tons/m**2/yr Number of source-species combinations with variable emissions scaling factors provided below in (14d) (NSAR1) Default: 0 ! NSAR1 = 0 ! Number of buoyant polygon area sources with variable location and emission parameters (NAR2) No default ! NAR2 = 0 ! (If NAR2 > 0, ALL parameter data for these sources are read from the file: BAEMARB.DAT) !END! --------------- Subgroup (14b) --------------- a AREA SOURCE: CONSTANT DATA ---------------------------- b Source Effect. Base Initial Emission No. Height Elevation Sigma z Rates (m) (m) (m) ------- ------ ------ -------- --------- -------- a Data for each source are treated as a separate input subgroup and therefore must end with an input group terminator. b An emission rate must be entered for every pollutant modeled. Enter emission rate of zero for secondary pollutants that are modeled, but not emitted. Units are specified by IARU (e.g. 1 for g/m**2/s). --------------- Subgroup (14c) --------------- COORDINATES (km) FOR EACH VERTEX(4) OF EACH POLYGON -------------------------------------------------------- Source a No. Ordered list of X followed by list of Y, grouped by source ------ ------------------------------------------------------------ -------- a Data for each source are treated as a separate input subgroup and therefore must end with an input group terminator. --------------- Subgroup (14d) --------------- a AREA SOURCE: VARIABLE EMISSIONS DATA -------------------------------------- Use this subgroup to describe temporal variations in the emission rates given in 14b. Factors entered multiply the rates in 14b. Skip sources here that have constant emissions. For more elaborate variation in source parameters, use BAEMARB.DAT and NAR2 > 0.

EML Air Pty Ltd Appendix B page 24
Air Emission Specialists MELBOURNE • SYDNEY • PERTH • BRISBANE
IVARY determines the type of variation, and is source-specific: (IVARY) Default: 0 0 = Constant 1 = Diurnal cycle (24 scaling factors: hours 1-24) 2 = Monthly cycle (12 scaling factors: months 1-12) 3 = Hour & Season (4 groups of 24 hourly scaling factors, where first group is DEC-JAN-FEB) 4 = Speed & Stab. (6 groups of 6 scaling factors, where first group is Stability Class A, and the speed classes have upper bounds (m/s) defined in Group 12 5 = Temperature (12 scaling factors, where temperature classes have upper bounds (C) of: 0, 5, 10, 15, 20, 25, 30, 35, 40, 45, 50, 50+) -------- a Data for each species are treated as a separate input subgroup and therefore must end with an input group terminator. ------------------------------------------------------------------------------- INPUT GROUPS: 15a, 15b, 15c -- Line source parameters --------------------------- --------------- Subgroup (15a) --------------- Number of buoyant line sources with variable location and emission parameters (NLN2) No default ! NLN2 = 0 ! (If NLN2 > 0, ALL parameter data for these sources are read from the file: LNEMARB.DAT) Number of buoyant line sources (NLINES) No default ! NLINES = 0 ! Units used for line source emissions below (ILNU) Default: 1 ! ILNU = 1 ! 1 = g/s 2 = kg/hr 3 = lb/hr 4 = tons/yr 5 = Odour Unit * m**3/s (vol. flux of odour compound) 6 = Odour Unit * m**3/min 7 = metric tons/yr Number of source-species combinations with variable emissions scaling factors provided below in (15c) (NSLN1) Default: 0 ! NSLN1 = 0 ! Maximum number of segments used to model each line (MXNSEG) Default: 7 ! MXNSEG = 7 ! The following variables are required only if NLINES > 0. They are used in the buoyant line source plume rise calculations. Number of distances at which Default: 6 ! NLRISE = 6 ! transitional rise is computed Average building length (XL) No default ! XL = .0 ! (in meters)

EML Air Pty Ltd Appendix B page 25
Air Emission Specialists MELBOURNE • SYDNEY • PERTH • BRISBANE
Average building height (HBL) No default ! HBL = .0 ! (in meters) Average building width (WBL) No default ! WBL = .0 ! (in meters) Average line source width (WML) No default ! WML = .0 ! (in meters) Average separation between buildings (DXL) No default ! DXL = .0 ! (in meters) Average buoyancy parameter (FPRIMEL) No default ! FPRIMEL = .0 ! (in m**4/s**3) !END! --------------- Subgroup (15b) --------------- BUOYANT LINE SOURCE: CONSTANT DATA ---------------------------------- a Source Beg. X Beg. Y End. X End. Y Release Base Emission No. Coordinate Coordinate Coordinate Coordinate Height Elevation Rates (km) (km) (km) (km) (m) (m) ------ ---------- ---------- --------- ---------- ------- --------- --------- -------- a Data for each source are treated as a separate input subgroup and therefore must end with an input group terminator. b An emission rate must be entered for every pollutant modeled. Enter emission rate of zero for secondary pollutants that are modeled, but not emitted. Units are specified by ILNTU (e.g. 1 for g/s). --------------- Subgroup (15c) --------------- a BUOYANT LINE SOURCE: VARIABLE EMISSIONS DATA ---------------------------------------------- Use this subgroup to describe temporal variations in the emission rates given in 15b. Factors entered multiply the rates in 15b. Skip sources here that have constant emissions. IVARY determines the type of variation, and is source-specific: (IVARY) Default: 0 0 = Constant 1 = Diurnal cycle (24 scaling factors: hours 1-24) 2 = Monthly cycle (12 scaling factors: months 1-12) 3 = Hour & Season (4 groups of 24 hourly scaling factors, where first group is DEC-JAN-FEB) 4 = Speed & Stab. (6 groups of 6 scaling factors, where first group is Stability Class A, and the speed classes have upper bounds (m/s) defined in Group 12 5 = Temperature (12 scaling factors, where temperature classes have upper bounds (C) of: 0, 5, 10, 15, 20, 25, 30, 35, 40, 45, 50, 50+)

EML Air Pty Ltd Appendix B page 26
Air Emission Specialists MELBOURNE • SYDNEY • PERTH • BRISBANE
-------- a Data for each species are treated as a separate input subgroup and therefore must end with an input group terminator. ------------------------------------------------------------------------------- INPUT GROUPS: 16a, 16b, 16c -- Volume source parameters --------------------------- --------------- Subgroup (16a) --------------- Number of volume sources with parameters provided in 16b,c (NVL1) No default ! NVL1 = 0 ! Units used for volume source emissions below in 16b (IVLU) Default: 1 ! IVLU = 1 ! 1 = g/s 2 = kg/hr 3 = lb/hr 4 = tons/yr 5 = Odour Unit * m**3/s (vol. flux of odour compound) 6 = Odour Unit * m**3/min 7 = metric tons/yr Number of source-species combinations with variable emissions scaling factors provided below in (16c) (NSVL1) Default: 0 ! NSVL1 = 0 ! Number of volume sources with variable location and emission parameters (NVL2) No default ! NVL2 = 0 ! (If NVL2 > 0, ALL parameter data for these sources are read from the VOLEMARB.DAT file(s) ) !END! --------------- Subgroup (16b) --------------- a VOLUME SOURCE: CONSTANT DATA ------------------------------ b X Y Effect. Base Initial Initial Emission Coordinate Coordinate Height Elevation Sigma y Sigma z Rates (km) (km) (m) (m) (m) (m) ---------- ---------- ------ ------ -------- -------- -------- -------- a Data for each source are treated as a separate input subgroup and therefore must end with an input group terminator. b An emission rate must be entered for every pollutant modeled. Enter emission rate of zero for secondary pollutants that are modeled, but not emitted. Units are specified by IVLU (e.g. 1 for g/s).

EML Air Pty Ltd Appendix B page 27
Air Emission Specialists MELBOURNE • SYDNEY • PERTH • BRISBANE
--------------- Subgroup (16c) --------------- a VOLUME SOURCE: VARIABLE EMISSIONS DATA ---------------------------------------- Use this subgroup to describe temporal variations in the emission rates given in 16b. Factors entered multiply the rates in 16b. Skip sources here that have constant emissions. For more elaborate variation in source parameters, use VOLEMARB.DAT and NVL2 > 0. IVARY determines the type of variation, and is source-specific: (IVARY) Default: 0 0 = Constant 1 = Diurnal cycle (24 scaling factors: hours 1-24) 2 = Monthly cycle (12 scaling factors: months 1-12) 3 = Hour & Season (4 groups of 24 hourly scaling factors, where first group is DEC-JAN-FEB) 4 = Speed & Stab. (6 groups of 6 scaling factors, where first group is Stability Class A, and the speed classes have upper bounds (m/s) defined in Group 12 5 = Temperature (12 scaling factors, where temperature classes have upper bounds (C) of: 0, 5, 10, 15, 20, 25, 30, 35, 40, 45, 50, 50+) -------- a Data for each species are treated as a separate input subgroup and therefore must end with an input group terminator. ------------------------------------------------------------------------------- INPUT GROUPS: 17a & 17b -- Non-gridded (discrete) receptor information ----------------------- --------------- Subgroup (17a) --------------- Number of non-gridded receptors (NREC) No default ! NREC = 0 ! !END! --------------- Subgroup (17b) --------------- a NON-GRIDDED (DISCRETE) RECEPTOR DATA ------------------------------------ X Y Ground Height b Receptor Coordinate Coordinate Elevation Above Ground No. (km) (km) (m) (m) -------- ---------- ---------- --------- ------------ ------------- a Data for each receptor are treated as a separate input subgroup and therefore must end with an input group terminator.

EML Air Pty Ltd Appendix B page 28
Air Emission Specialists MELBOURNE • SYDNEY • PERTH • BRISBANE
b Receptor height above ground is optional. If no value is entered, the receptor is placed on the ground.

EML Air Pty Ltd Appendix C page 1
Air Emission Specialists MELBOURNE • SYDNEY • PERTH • BRISBANE
Appendix C CALPUFF input configuration file – adopted odour emissions
East Rigley Temporary Asphalt Plant Odour emissions from vent stack and loadout ---------------- Run title (3 lines) ------------------------------------------ CALPUFF MODEL CONTROL FILE -------------------------- ------------------------------------------------------------------------------- INPUT GROUP: 0 -- Input and Output File Names -------------- Default Name Type File Name ------------ ---- --------- CALMET.DAT input ! METDAT =CMET100-part1.DAT ! or ISCMET.DAT input * ISCDAT = * or PLMMET.DAT input * PLMDAT = * or PROFILE.DAT input * PRFDAT = * SURFACE.DAT input * SFCDAT = * RESTARTB.DAT input * RSTARTB= * -------------------------------------------------------------------------------- CALPUFF.LST output ! PUFLST =odour.LST ! CONC.DAT output ! CONDAT =odour.CON ! DFLX.DAT output * DFDAT =CPUF.DRY * WFLX.DAT output * WFDAT =CPUF.WET * VISB.DAT output * VISDAT =CPUF.VIS * TK2D.DAT output * T2DDAT = * RHO2D.DAT output * RHODAT = * RESTARTE.DAT output * RSTARTE= * -------------------------------------------------------------------------------- Emission Files -------------- PTEMARB.DAT input * PTDAT = * VOLEMARB.DAT input * VOLDAT = * BAEMARB.DAT input * ARDAT = * LNEMARB.DAT input * LNDAT = * -------------------------------------------------------------------------------- Other Files ----------- OZONE.DAT input * OZDAT =OZONE.DAT * VD.DAT input * VDDAT = * CHEM.DAT input * CHEMDAT= * H2O2.DAT input * H2O2DAT= * HILL.DAT input * HILDAT= * HILLRCT.DAT input * RCTDAT= * COASTLN.DAT input * CSTDAT= * FLUXBDY.DAT input * BDYDAT= * BCON.DAT input * BCNDAT= * DEBUG.DAT output * DEBUG = * MASSFLX.DAT output * FLXDAT= * MASSBAL.DAT output * BALDAT= * FOG.DAT output * FOGDAT= * -------------------------------------------------------------------------------- All file names will be converted to lower case if LCFILES = T Otherwise, if LCFILES = F, file names will be converted to UPPER CASE T = lower case ! LCFILES = F ! F = UPPER CASE NOTE: (1) file/path names can be up to 70 characters in length

EML Air Pty Ltd Appendix C page 2
Air Emission Specialists MELBOURNE • SYDNEY • PERTH • BRISBANE
Provision for multiple input files ---------------------------------- Number of CALMET.DAT files for run (NMETDAT) Default: 1 ! NMETDAT = 4 ! Number of PTEMARB.DAT files for run (NPTDAT) Default: 0 ! NPTDAT = 0 ! Number of BAEMARB.DAT files for run (NARDAT) Default: 0 ! NARDAT = 0 ! Number of VOLEMARB.DAT files for run (NVOLDAT) Default: 0 ! NVOLDAT = 0 ! !END! ------------- Subgroup (0a) ------------- The following CALMET.DAT filenames are processed in sequence if NMETDAT>1 Default Name Type File Name ------------ ---- --------- none input ! METDAT= CMET100-part1.DAT ! !END! none input ! METDAT= CMET100-part2.DAT ! !END! none input ! METDAT= CMET100-part3.DAT ! !END! none input ! METDAT= CMET100-part4.DAT ! !END! -------------------------------------------------------------------------------- INPUT GROUP: 1 -- General run control parameters -------------- Option to run all periods found in the met. file (METRUN) Default: 0 ! METRUN = 0 ! METRUN = 0 - Run period explicitly defined below METRUN = 1 - Run all periods in met. file Starting date: Year (IBYR) -- No default ! IBYR = 2012 ! (used only if Month (IBMO) -- No default ! IBMO = 1 ! METRUN = 0) Day (IBDY) -- No default ! IBDY = 1 ! Hour (IBHR) -- No default ! IBHR = 1 ! Note: IBHR is the time at the END of the first hour of the simulation (IBHR=1, the first hour of a day, runs from 00:00 to 01:00) Base time zone (XBTZ) -- No default ! XBTZ = -10.0 ! The zone is the number of hours that must be ADDED to the time to obtain UTC (or GMT) Examples: PST = 8., MST = 7. CST = 6., EST = 5. Length of run (hours) (IRLG) -- No default ! IRLG = 8784 ! Number of chemical species (NSPEC) Default: 5 ! NSPEC = 1 ! Number of chemical species to be emitted (NSE) Default: 3 ! NSE = 1 ! Flag to stop run after SETUP phase (ITEST) Default: 2 ! ITEST = 2 ! (Used to allow checking of the model inputs, files, etc.)
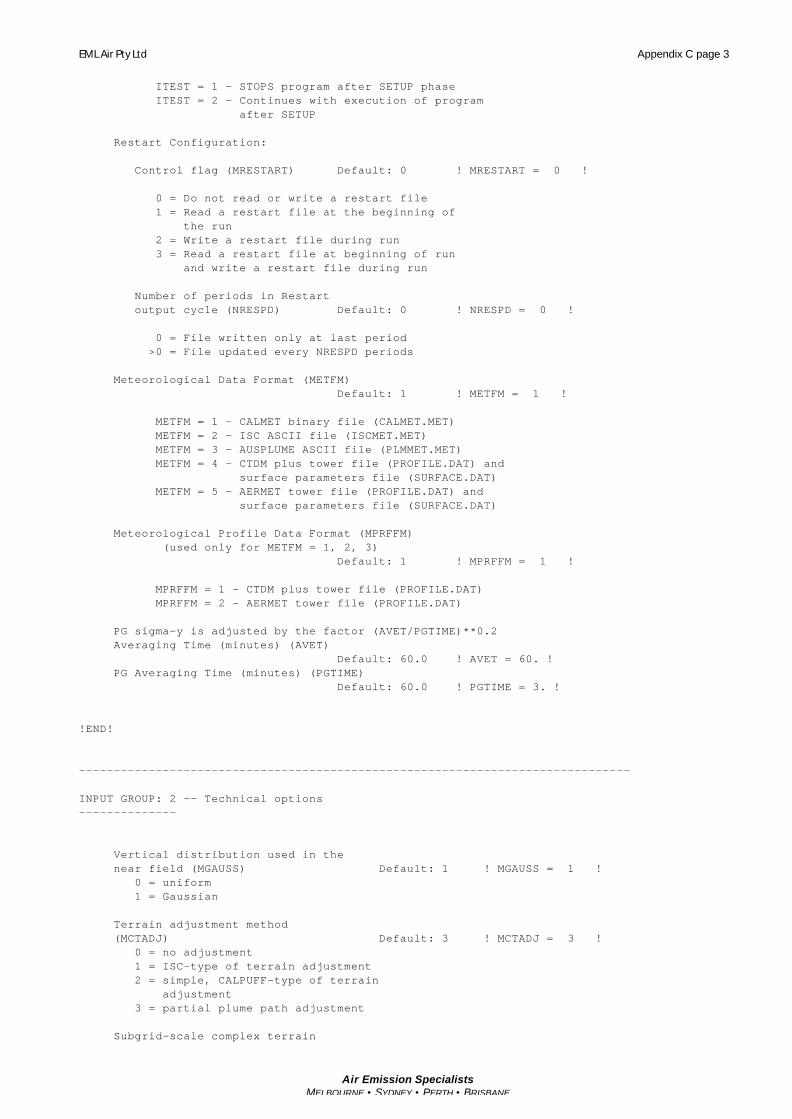
EML Air Pty Ltd Appendix C page 3
Air Emission Specialists MELBOURNE • SYDNEY • PERTH • BRISBANE
ITEST = 1 - STOPS program after SETUP phase ITEST = 2 - Continues with execution of program after SETUP Restart Configuration: Control flag (MRESTART) Default: 0 ! MRESTART = 0 ! 0 = Do not read or write a restart file 1 = Read a restart file at the beginning of the run 2 = Write a restart file during run 3 = Read a restart file at beginning of run and write a restart file during run Number of periods in Restart output cycle (NRESPD) Default: 0 ! NRESPD = 0 ! 0 = File written only at last period >0 = File updated every NRESPD periods Meteorological Data Format (METFM) Default: 1 ! METFM = 1 ! METFM = 1 - CALMET binary file (CALMET.MET) METFM = 2 - ISC ASCII file (ISCMET.MET) METFM = 3 - AUSPLUME ASCII file (PLMMET.MET) METFM = 4 - CTDM plus tower file (PROFILE.DAT) and surface parameters file (SURFACE.DAT) METFM = 5 - AERMET tower file (PROFILE.DAT) and surface parameters file (SURFACE.DAT) Meteorological Profile Data Format (MPRFFM) (used only for METFM = 1, 2, 3) Default: 1 ! MPRFFM = 1 ! MPRFFM = 1 - CTDM plus tower file (PROFILE.DAT) MPRFFM = 2 - AERMET tower file (PROFILE.DAT) PG sigma-y is adjusted by the factor (AVET/PGTIME)**0.2 Averaging Time (minutes) (AVET) Default: 60.0 ! AVET = 60. ! PG Averaging Time (minutes) (PGTIME) Default: 60.0 ! PGTIME = 3. ! !END! ------------------------------------------------------------------------------- INPUT GROUP: 2 -- Technical options -------------- Vertical distribution used in the near field (MGAUSS) Default: 1 ! MGAUSS = 1 ! 0 = uniform 1 = Gaussian Terrain adjustment method (MCTADJ) Default: 3 ! MCTADJ = 3 ! 0 = no adjustment 1 = ISC-type of terrain adjustment 2 = simple, CALPUFF-type of terrain adjustment 3 = partial plume path adjustment Subgrid-scale complex terrain
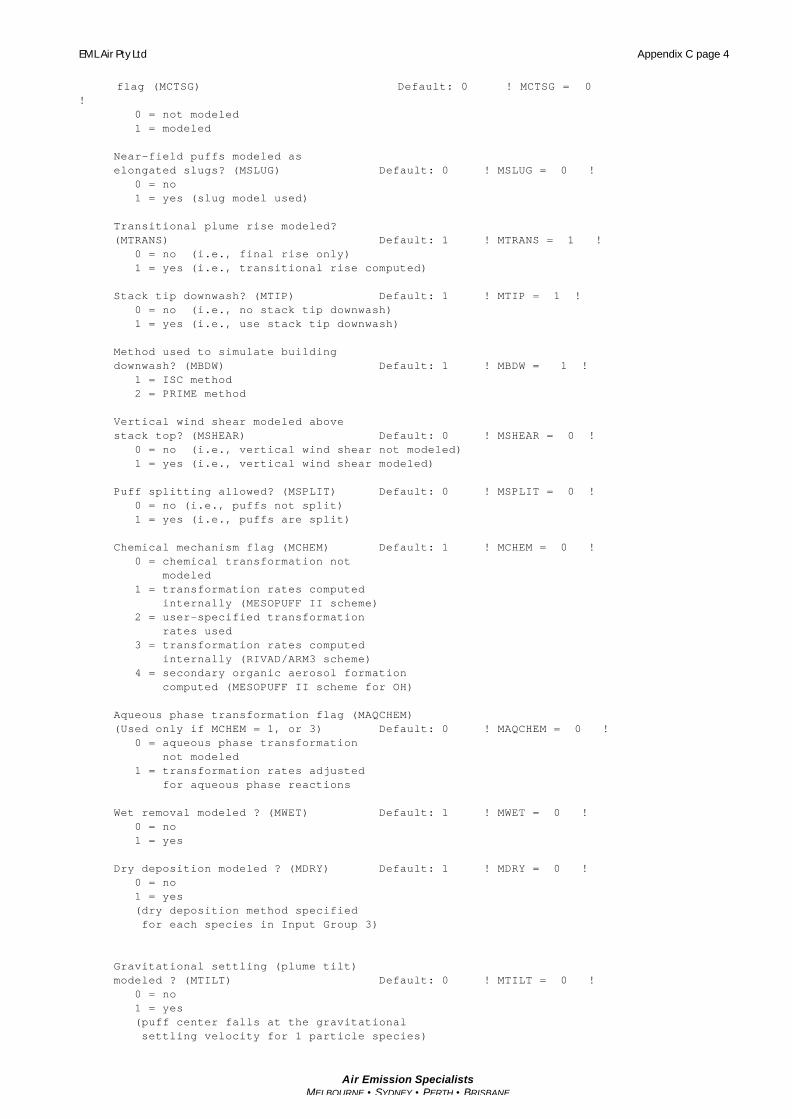
EML Air Pty Ltd Appendix C page 4
Air Emission Specialists MELBOURNE • SYDNEY • PERTH • BRISBANE
flag (MCTSG) Default: 0 ! MCTSG = 0 ! 0 = not modeled 1 = modeled Near-field puffs modeled as elongated slugs? (MSLUG) Default: 0 ! MSLUG = 0 ! 0 = no 1 = yes (slug model used) Transitional plume rise modeled? (MTRANS) Default: 1 ! MTRANS = 1 ! 0 = no (i.e., final rise only) 1 = yes (i.e., transitional rise computed) Stack tip downwash? (MTIP) Default: 1 ! MTIP = 1 ! 0 = no (i.e., no stack tip downwash) 1 = yes (i.e., use stack tip downwash) Method used to simulate building downwash? (MBDW) Default: 1 ! MBDW = 1 ! 1 = ISC method 2 = PRIME method Vertical wind shear modeled above stack top? (MSHEAR) Default: 0 ! MSHEAR = 0 ! 0 = no (i.e., vertical wind shear not modeled) 1 = yes (i.e., vertical wind shear modeled) Puff splitting allowed? (MSPLIT) Default: 0 ! MSPLIT = 0 ! 0 = no (i.e., puffs not split) 1 = yes (i.e., puffs are split) Chemical mechanism flag (MCHEM) Default: 1 ! MCHEM = 0 ! 0 = chemical transformation not modeled 1 = transformation rates computed internally (MESOPUFF II scheme) 2 = user-specified transformation rates used 3 = transformation rates computed internally (RIVAD/ARM3 scheme) 4 = secondary organic aerosol formation computed (MESOPUFF II scheme for OH) Aqueous phase transformation flag (MAQCHEM) (Used only if MCHEM = 1, or 3) Default: 0 ! MAQCHEM = 0 ! 0 = aqueous phase transformation not modeled 1 = transformation rates adjusted for aqueous phase reactions Wet removal modeled ? (MWET) Default: 1 ! MWET = 0 ! 0 = no 1 = yes Dry deposition modeled ? (MDRY) Default: 1 ! MDRY = 0 ! 0 = no 1 = yes (dry deposition method specified for each species in Input Group 3) Gravitational settling (plume tilt) modeled ? (MTILT) Default: 0 ! MTILT = 0 ! 0 = no 1 = yes (puff center falls at the gravitational settling velocity for 1 particle species)

EML Air Pty Ltd Appendix C page 5
Air Emission Specialists MELBOURNE • SYDNEY • PERTH • BRISBANE
Restrictions: - MDRY = 1 - NSPEC = 1 (must be particle species as well) - sg = 0 GEOMETRIC STANDARD DEVIATION in Group 8 is set to zero for a single particle diameter Method used to compute dispersion coefficients (MDISP) Default: 3 ! MDISP = 3 ! 1 = dispersion coefficients computed from measured values of turbulence, sigma v, sigma w 2 = dispersion coefficients from internally calculated sigma v, sigma w using micrometeorological variables (u*, w*, L, etc.) 3 = PG dispersion coefficients for RURAL areas (computed using the ISCST multi-segment approximation) and MP coefficients in urban areas 4 = same as 3 except PG coefficients computed using the MESOPUFF II eqns. 5 = CTDM sigmas used for stable and neutral conditions. For unstable conditions, sigmas are computed as in MDISP = 3, described above. MDISP = 5 assumes that measured values are read Sigma-v/sigma-theta, sigma-w measurements used? (MTURBVW) (Used only if MDISP = 1 or 5) Default: 3 ! MTURBVW = 3 ! 1 = use sigma-v or sigma-theta measurements from PROFILE.DAT to compute sigma-y (valid for METFM = 1, 2, 3, 4, 5) 2 = use sigma-w measurements from PROFILE.DAT to compute sigma-z (valid for METFM = 1, 2, 3, 4, 5) 3 = use both sigma-(v/theta) and sigma-w from PROFILE.DAT to compute sigma-y and sigma-z (valid for METFM = 1, 2, 3, 4, 5) 4 = use sigma-theta measurements from PLMMET.DAT to compute sigma-y (valid only if METFM = 3) Back-up method used to compute dispersion when measured turbulence data are missing (MDISP2) Default: 3 ! MDISP2 = 3 ! (used only if MDISP = 1 or 5) 2 = dispersion coefficients from internally calculated sigma v, sigma w using micrometeorological variables (u*, w*, L, etc.) 3 = PG dispersion coefficients for RURAL areas (computed using the ISCST multi-segment approximation) and MP coefficients in urban areas 4 = same as 3 except PG coefficients computed using the MESOPUFF II eqns. [DIAGNOSTIC FEATURE] Method used for Lagrangian timescale for Sigma-y (used only if MDISP=1,2 or MDISP2=1,2) (MTAULY) Default: 0 ! MTAULY = 0 ! 0 = Draxler default 617.284 (s) 1 = Computed as Lag. Length / (.75 q) -- after SCIPUFF 10 < Direct user input (s) -- e.g., 306.9 [DIAGNOSTIC FEATURE] Method used for Advective-Decay timescale for Turbulence (used only if MDISP=2 or MDISP2=2) (MTAUADV) Default: 0 ! MTAUADV = 0 ! 0 = No turbulence advection 1 = Computed (OPTION NOT IMPLEMENTED) 10 < Direct user input (s) -- e.g., 300

EML Air Pty Ltd Appendix C page 6
Air Emission Specialists MELBOURNE • SYDNEY • PERTH • BRISBANE
Method used to compute turbulence sigma-v & sigma-w using micrometeorological variables (Used only if MDISP = 2 or MDISP2 = 2) (MCTURB) Default: 1 ! MCTURB = 1 ! 1 = Standard CALPUFF subroutines 2 = AERMOD subroutines PG sigma-y,z adj. for roughness? Default: 0 ! MROUGH = 0 ! (MROUGH) 0 = no 1 = yes Partial plume penetration of Default: 1 ! MPARTL = 1 ! elevated inversion? (MPARTL) 0 = no 1 = yes Strength of temperature inversion Default: 0 ! MTINV = 0 ! provided in PROFILE.DAT extended records? (MTINV) 0 = no (computed from measured/default gradients) 1 = yes PDF used for dispersion under convective conditions? Default: 0 ! MPDF = 0 ! (MPDF) 0 = no 1 = yes Sub-Grid TIBL module used for shore line? Default: 0 ! MSGTIBL = 0 ! (MSGTIBL) 0 = no 1 = yes Boundary conditions (concentration) modeled? Default: 0 ! MBCON = 0 ! (MBCON) 0 = no 1 = yes, using formatted BCON.DAT file 2 = yes, using unformatted CONC.DAT file Note: MBCON > 0 requires that the last species modeled be 'BCON'. Mass is placed in species BCON when generating boundary condition puffs so that clean air entering the modeling domain can be simulated in the same way as polluted air. Specify zero emission of species BCON for all regular sources. Individual source contributions saved? Default: 0 ! MSOURCE = 0 ! (MSOURCE) 0 = no 1 = yes Analyses of fogging and icing impacts due to emissions from arrays of mechanically-forced cooling towers can be performed using CALPUFF in conjunction with a cooling tower emissions processor (CTEMISS) and its associated postprocessors. Hourly emissions of water vapor and temperature from each cooling tower cell are computed for the current cell configuration and ambient conditions by CTEMISS. CALPUFF models the dispersion of these emissions and provides cloud information in a specialized format for further analysis. Output to FOG.DAT is provided in either 'plume mode' or 'receptor mode' format.
EML Air Pty Ltd Appendix C page 7
Air Emission Specialists MELBOURNE • SYDNEY • PERTH • BRISBANE
Configure for FOG Model output? Default: 0 ! MFOG = 0 ! (MFOG) 0 = no 1 = yes - report results in PLUME Mode format 2 = yes - report results in RECEPTOR Mode format Test options specified to see if they conform to regulatory values? (MREG) Default: 1 ! MREG = 0 ! 0 = NO checks are made 1 = Technical options must conform to USEPA Long Range Transport (LRT) guidance METFM 1 or 2 AVET 60. (min) PGTIME 60. (min) MGAUSS 1 MCTADJ 3 MTRANS 1 MTIP 1 MCHEM 1 or 3 (if modeling SOx, NOx) MWET 1 MDRY 1 MDISP 2 or 3 MPDF 0 if MDISP=3 1 if MDISP=2 MROUGH 0 MPARTL 1 SYTDEP 550. (m) MHFTSZ 0 SVMIN 0.5 (m/s) !END! ------------------------------------------------------------------------------- INPUT GROUP: 3a, 3b -- Species list ------------------- ------------ Subgroup (3a) ------------ The following species are modeled: ! CSPEC = SO2 ! !END! Dry OUTPUT GROUP SPECIES MODELED EMITTED DEPOSITED NUMBER NAME (0=NO, 1=YES) (0=NO, 1=YES) (0=NO, (0=NONE, (Limit: 12 1=COMPUTED-GAS 1=1st CGRUP, Characters 2=COMPUTED-PARTICLE 2=2nd CGRUP, in length) 3=USER-SPECIFIED) 3= etc.) ! SO2 = 1, 1, 0, 0 ! !END! Note: The last species in (3a) must be 'BCON' when using the boundary condition option (MBCON > 0). Species BCON should typically be modeled as inert (no chem transformation or removal).

EML Air Pty Ltd Appendix C page 8
Air Emission Specialists MELBOURNE • SYDNEY • PERTH • BRISBANE
------------- Subgroup (3b) ------------- The following names are used for Species-Groups in which results for certain species are combined (added) prior to output. The CGRUP name will be used as the species name in output files. Use this feature to model specific particle-size distributions by treating each size-range as a separate species. Order must be consistent with 3(a) above. ------------------------------------------------------------------------------- INPUT GROUP: 4 -- Map Projection and Grid control parameters -------------- Projection for all (X,Y): ------------------------- Map projection (PMAP) Default: UTM ! PMAP = UTM ! UTM : Universal Transverse Mercator TTM : Tangential Transverse Mercator LCC : Lambert Conformal Conic PS : Polar Stereographic EM : Equatorial Mercator LAZA : Lambert Azimuthal Equal Area False Easting and Northing (km) at the projection origin (Used only if PMAP= TTM, LCC, or LAZA) (FEAST) Default=0.0 ! FEAST = 0.000 ! (FNORTH) Default=0.0 ! FNORTH = 0.000 ! UTM zone (1 to 60) (Used only if PMAP=UTM) (IUTMZN) No Default ! IUTMZN = 55 ! Hemisphere for UTM projection? (Used only if PMAP=UTM) (UTMHEM) Default: N ! UTMHEM = S ! N : Northern hemisphere projection S : Southern hemisphere projection Latitude and Longitude (decimal degrees) of projection origin (Used only if PMAP= TTM, LCC, PS, EM, or LAZA) (RLAT0) No Default ! RLAT0 = 0N ! (RLON0) No Default ! RLON0 = 0E ! TTM : RLON0 identifies central (true N/S) meridian of projection RLAT0 selected for convenience LCC : RLON0 identifies central (true N/S) meridian of projection RLAT0 selected for convenience PS : RLON0 identifies central (grid N/S) meridian of projection RLAT0 selected for convenience EM : RLON0 identifies central meridian of projection RLAT0 is REPLACED by 0.0N (Equator) LAZA: RLON0 identifies longitude of tangent-point of mapping plane RLAT0 identifies latitude of tangent-point of mapping plane Matching parallel(s) of latitude (decimal degrees) for projection (Used only if PMAP= LCC or PS) (XLAT1) No Default ! XLAT1 = 0N ! (XLAT2) No Default ! XLAT2 = 0N ! LCC : Projection cone slices through Earth's surface at XLAT1 and XLAT2 PS : Projection plane slices through Earth at XLAT1

EML Air Pty Ltd Appendix C page 9
Air Emission Specialists MELBOURNE • SYDNEY • PERTH • BRISBANE
(XLAT2 is not used) ---------- Note: Latitudes and longitudes should be positive, and include a letter N,S,E, or W indicating north or south latitude, and east or west longitude. For example, 35.9 N Latitude = 35.9N 118.7 E Longitude = 118.7E Datum-region ------------ The Datum-Region for the coordinates is identified by a character string. Many mapping products currently available use the model of the Earth known as the World Geodetic System 1984 (WGS-84). Other local models may be in use, and their selection in CALMET will make its output consistent with local mapping products. The list of Datum-Regions with official transformation parameters is provided by the National Imagery and Mapping Agency (NIMA). NIMA Datum - Regions(Examples) ------------------------------------------------------------------------------ WGS-84 WGS-84 Reference Ellipsoid and Geoid, Global coverage (WGS84) NAS-C NORTH AMERICAN 1927 Clarke 1866 Spheroid, MEAN FOR CONUS (NAD27) NAR-C NORTH AMERICAN 1983 GRS 80 Spheroid, MEAN FOR CONUS (NAD83) NWS-84 NWS 6370KM Radius, Sphere ESR-S ESRI REFERENCE 6371KM Radius, Sphere Datum-region for output coordinates (DATUM) Default: WGS-84 ! DATUM = WGS-84 ! METEOROLOGICAL Grid: Rectangular grid defined for projection PMAP, with X the Easting and Y the Northing coordinate No. X grid cells (NX) No default ! NX = 100 ! No. Y grid cells (NY) No default ! NY = 100 ! No. vertical layers (NZ) No default ! NZ = 10 ! Grid spacing (DGRIDKM) No default ! DGRIDKM = 0.1 ! Units: km Cell face heights (ZFACE(nz+1)) No defaults Units: m ! ZFACE = .0, 20.0, 40.0, 80.0, 160.0, 300.0, 600.0, 1000.0, 1500.0, 2200.0, 3000.0 ! Reference Coordinates of SOUTHWEST corner of grid cell(1, 1): X coordinate (XORIGKM) No default ! XORIGKM = 398.552 ! Y coordinate (YORIGKM) No default ! YORIGKM = 5439.004 ! Units: km COMPUTATIONAL Grid: The computational grid is identical to or a subset of the MET. grid. The lower left (LL) corner of the computational grid is at grid point (IBCOMP, JBCOMP) of the MET. grid. The upper right (UR) corner of the computational grid is at grid point (IECOMP, JECOMP) of the MET. grid. The grid spacing of the computational grid is the same as the MET. grid. X index of LL corner (IBCOMP) No default ! IBCOMP = 1 !

EML Air Pty Ltd Appendix C page 10
Air Emission Specialists MELBOURNE • SYDNEY • PERTH • BRISBANE
(1 <= IBCOMP <= NX) Y index of LL corner (JBCOMP) No default ! JBCOMP = 1 ! (1 <= JBCOMP <= NY) X index of UR corner (IECOMP) No default ! IECOMP = 100 ! (1 <= IECOMP <= NX) Y index of UR corner (JECOMP) No default ! JECOMP = 100 ! (1 <= JECOMP <= NY) SAMPLING Grid (GRIDDED RECEPTORS): The lower left (LL) corner of the sampling grid is at grid point (IBSAMP, JBSAMP) of the MET. grid. The upper right (UR) corner of the sampling grid is at grid point (IESAMP, JESAMP) of the MET. grid. The sampling grid must be identical to or a subset of the computational grid. It may be a nested grid inside the computational grid. The grid spacing of the sampling grid is DGRIDKM/MESHDN. Logical flag indicating if gridded receptors are used (LSAMP) Default: T ! LSAMP = T ! (T=yes, F=no) X index of LL corner (IBSAMP) No default ! IBSAMP = 30 ! (IBCOMP <= IBSAMP <= IECOMP) Y index of LL corner (JBSAMP) No default ! JBSAMP = 30 ! (JBCOMP <= JBSAMP <= JECOMP) X index of UR corner (IESAMP) No default ! IESAMP = 70 ! (IBCOMP <= IESAMP <= IECOMP) Y index of UR corner (JESAMP) No default ! JESAMP = 70 ! (JBCOMP <= JESAMP <= JECOMP) Nesting factor of the sampling grid (MESHDN) Default: 1 ! MESHDN = 2 ! (MESHDN is an integer >= 1) !END! ------------------------------------------------------------------------------- INPUT GROUP: 5 -- Output Options -------------- * * FILE DEFAULT VALUE VALUE THIS RUN ---- ------------- -------------- Concentrations (ICON) 1 ! ICON = 1 ! Dry Fluxes (IDRY) 1 ! IDRY = 0 ! Wet Fluxes (IWET) 1 ! IWET = 0 ! 2D Temperature (IT2D) 0 ! IT2D = 0 ! 2D Density (IRHO) 0 ! IRHO = 0 ! Relative Humidity (IVIS) 1 ! IVIS = 0 ! (relative humidity file is required for visibility analysis) Use data compression option in output file? (LCOMPRS) Default: T ! LCOMPRS = T !

EML Air Pty Ltd Appendix C page 11
Air Emission Specialists MELBOURNE • SYDNEY • PERTH • BRISBANE
* 0 = Do not create file, 1 = create file QA PLOT FILE OUTPUT OPTION: Create a standard series of output files (e.g. locations of sources, receptors, grids ...) suitable for plotting? (IQAPLOT) Default: 1 ! IQAPLOT = 1 ! 0 = no 1 = yes DIAGNOSTIC MASS FLUX OUTPUT OPTIONS: Mass flux across specified boundaries for selected species reported? (IMFLX) Default: 0 ! IMFLX = 0 ! 0 = no 1 = yes (FLUXBDY.DAT and MASSFLX.DAT filenames are specified in Input Group 0) Mass balance for each species reported? (IMBAL) Default: 0 ! IMBAL = 0 ! 0 = no 1 = yes (MASSBAL.DAT filename is specified in Input Group 0) LINE PRINTER OUTPUT OPTIONS: Print concentrations (ICPRT) Default: 0 ! ICPRT = 0 ! Print dry fluxes (IDPRT) Default: 0 ! IDPRT = 0 ! Print wet fluxes (IWPRT) Default: 0 ! IWPRT = 0 ! (0 = Do not print, 1 = Print) Concentration print interval (ICFRQ) in timesteps Default: 1 ! ICFRQ = 1 ! Dry flux print interval (IDFRQ) in timesteps Default: 1 ! IDFRQ = 1 ! Wet flux print interval (IWFRQ) in timesteps Default: 1 ! IWFRQ = 1 ! Units for Line Printer Output (IPRTU) Default: 1 ! IPRTU = 5 ! for for Concentration Deposition 1 = g/m**3 g/m**2/s 2 = mg/m**3 mg/m**2/s 3 = ug/m**3 ug/m**2/s 4 = ng/m**3 ng/m**2/s 5 = Odour Units Messages tracking progress of run written to the screen ? (IMESG) Default: 2 ! IMESG = 2 ! 0 = no 1 = yes (advection step, puff ID) 2 = yes (YYYYJJJHH, # old puffs, # emitted puffs) SPECIES (or GROUP for combined species) LIST FOR OUTPUT OPTIONS ---- CONCENTRATIONS ---- ------ DRY FLUXES ------ ------ WET FLUXES ------ -- MASS FLUX -- SPECIES /GROUP PRINTED? SAVED ON DISK? PRINTED? SAVED ON DISK? PRINTED? SAVED ON DISK? SAVED ON DISK?

EML Air Pty Ltd Appendix C page 12
Air Emission Specialists MELBOURNE • SYDNEY • PERTH • BRISBANE
------- ------------------------ ------------------------ ------------------------ --------------- ! SO2 = 1, 1, 0, 0, 0, 0, 0 ! Note: Species BCON (for MBCON > 0) does not need to be saved on disk. OPTIONS FOR PRINTING "DEBUG" QUANTITIES (much output) Logical for debug output (LDEBUG) Default: F ! LDEBUG = F ! First puff to track (IPFDEB) Default: 1 ! IPFDEB = 1 ! Number of puffs to track (NPFDEB) Default: 1 ! NPFDEB = 1 ! Met. period to start output (NN1) Default: 1 ! NN1 = 1 ! Met. period to end output (NN2) Default: 10 ! NN2 = 10 ! !END! ------------------------------------------------------------------------------- INPUT GROUP: 6a, 6b, & 6c -- Subgrid scale complex terrain inputs ------------------------- --------------- Subgroup (6a) --------------- Number of terrain features (NHILL) Default: 0 ! NHILL = 0 ! Number of special complex terrain receptors (NCTREC) Default: 0 ! NCTREC = 0 ! Terrain and CTSG Receptor data for CTSG hills input in CTDM format ? (MHILL) No Default ! MHILL = 2 ! 1 = Hill and Receptor data created by CTDM processors & read from HILL.DAT and HILLRCT.DAT files 2 = Hill data created by OPTHILL & input below in Subgroup (6b); Receptor data in Subgroup (6c) Factor to convert horizontal dimensions Default: 1.0 ! XHILL2M = 1.0 ! to meters (MHILL=1) Factor to convert vertical dimensions Default: 1.0 ! ZHILL2M = 1.0 ! to meters (MHILL=1) X-origin of CTDM system relative to No Default ! XCTDMKM = 0 ! CALPUFF coordinate system, in Kilometers (MHILL=1) Y-origin of CTDM system relative to No Default ! YCTDMKM = 0 ! CALPUFF coordinate system, in Kilometers (MHILL=1) ! END ! --------------- Subgroup (6b) ---------------

EML Air Pty Ltd Appendix C page 13
Air Emission Specialists MELBOURNE • SYDNEY • PERTH • BRISBANE
1 ** HILL information HILL XC YC THETAH ZGRID RELIEF EXPO 1 EXPO 2 SCALE 1 SCALE 2 AMAX1 AMAX2 NO. (km) (km) (deg.) (m) (m) (m) (m) (m) (m) (m) (m) ---- ---- ---- ------ ----- ------ ------ ------ ------- ------- ----- ----- --------------- Subgroup (6c) --------------- COMPLEX TERRAIN RECEPTOR INFORMATION XRCT YRCT ZRCT XHH (km) (km) (m) ------ ----- ------ ---- ------------------- 1 Description of Complex Terrain Variables: XC, YC = Coordinates of center of hill THETAH = Orientation of major axis of hill (clockwise from North) ZGRID = Height of the 0 of the grid above mean sea level RELIEF = Height of the crest of the hill above the grid elevation EXPO 1 = Hill-shape exponent for the major axis EXPO 2 = Hill-shape exponent for the major axis SCALE 1 = Horizontal length scale along the major axis SCALE 2 = Horizontal length scale along the minor axis AMAX = Maximum allowed axis length for the major axis BMAX = Maximum allowed axis length for the major axis XRCT, YRCT = Coordinates of the complex terrain receptors ZRCT = Height of the ground (MSL) at the complex terrain Receptor XHH = Hill number associated with each complex terrain receptor (NOTE: MUST BE ENTERED AS A REAL NUMBER) ** NOTE: DATA for each hill and CTSG receptor are treated as a separate input subgroup and therefore must end with an input group terminator. ------------------------------------------------------------------------------- INPUT GROUP: 7 -- Chemical parameters for dry deposition of gases -------------- SPECIES DIFFUSIVITY ALPHA STAR REACTIVITY MESOPHYLL RESISTANCE HENRY'S LAW COEFFICIENT NAME (cm**2/s) (s/cm) (dimensionless) ------- ----------- ---------- ---------- -------------------- ----------------------- ! SO2 = .1509, 1000.0, 8.0, .0, .04 ! !END! -------------------------------------------------------------------------------

EML Air Pty Ltd Appendix C page 14
Air Emission Specialists MELBOURNE • SYDNEY • PERTH • BRISBANE
INPUT GROUP: 8 -- Size parameters for dry deposition of particles -------------- For SINGLE SPECIES, the mean and standard deviation are used to compute a deposition velocity for NINT (see group 9) size-ranges, and these are then averaged to obtain a mean deposition velocity. For GROUPED SPECIES, the size distribution should be explicitly specified (by the 'species' in the group), and the standard deviation for each should be entered as 0. The model will then use the deposition velocity for the stated mean diameter. SPECIES GEOMETRIC MASS MEAN GEOMETRIC STANDARD NAME DIAMETER DEVIATION (microns) (microns) ------- ------------------- ------------------ ! SO4 = .48, 2.0 ! !END! ------------------------------------------------------------------------------- INPUT GROUP: 9 -- Miscellaneous dry deposition parameters -------------- Reference cuticle resistance (s/cm) (RCUTR) Default: 30 ! RCUTR = 30.0 ! Reference ground resistance (s/cm) (RGR) Default: 10 ! RGR = 5.0 ! Reference pollutant reactivity (REACTR) Default: 8 ! REACTR = 8.0 ! Number of particle-size intervals used to evaluate effective particle deposition velocity (NINT) Default: 9 ! NINT = 9 ! Vegetation state in unirrigated areas (IVEG) Default: 1 ! IVEG = 1 ! IVEG=1 for active and unstressed vegetation IVEG=2 for active and stressed vegetation IVEG=3 for inactive vegetation !END! ------------------------------------------------------------------------------- INPUT GROUP: 10 -- Wet Deposition Parameters --------------- Scavenging Coefficient -- Units: (sec)**(-1) Pollutant Liquid Precip. Frozen Precip. --------- -------------- -------------- ! SO2 = 3.0E-05, 0.0E00 ! !END! ------------------------------------------------------------------------------- INPUT GROUP: 11 -- Chemistry Parameters

EML Air Pty Ltd Appendix C page 15
Air Emission Specialists MELBOURNE • SYDNEY • PERTH • BRISBANE
--------------- Ozone data input option (MOZ) Default: 1 ! MOZ = 1 ! (Used only if MCHEM = 1, 3, or 4) 0 = use a monthly background ozone value 1 = read hourly ozone concentrations from the OZONE.DAT data file Monthly ozone concentrations (Used only if MCHEM = 1, 3, or 4 and MOZ = 0 or MOZ = 1 and all hourly O3 data missing) (BCKO3) in ppb Default: 12*80. ! BCKO3 = 40.00, 40.00, 40.00, 40.00, 40.00, 40.00, 40.00, 40.00, 40.00, 40.00, 40.00, 40.00 ! Monthly ammonia concentrations (Used only if MCHEM = 1, or 3) (BCKNH3) in ppb Default: 12*10. ! BCKNH3 = 10.00, 10.00, 10.00, 10.00, 10.00, 10.00, 10.00, 10.00, 10.00, 10.00, 10.00, 10.00 ! Nighttime SO2 loss rate (RNITE1) in percent/hour Default: 0.2 ! RNITE1 = .2 ! Nighttime NOx loss rate (RNITE2) in percent/hour Default: 2.0 ! RNITE2 = 2.0 ! Nighttime HNO3 formation rate (RNITE3) in percent/hour Default: 2.0 ! RNITE3 = 2.0 ! H2O2 data input option (MH2O2) Default: 1 ! MH2O2 = 1 ! (Used only if MAQCHEM = 1) 0 = use a monthly background H2O2 value 1 = read hourly H2O2 concentrations from the H2O2.DAT data file Monthly H2O2 concentrations (Used only if MQACHEM = 1 and MH2O2 = 0 or MH2O2 = 1 and all hourly H2O2 data missing) (BCKH2O2) in ppb Default: 12*1. ! BCKH2O2 = 1.00, 1.00, 1.00, 1.00, 1.00, 1.00, 1.00, 1.00, 1.00, 1.00, 1.00, 1.00 ! --- Data for SECONDARY ORGANIC AEROSOL (SOA) Option (used only if MCHEM = 4) The SOA module uses monthly values of: Fine particulate concentration in ug/m^3 (BCKPMF) Organic fraction of fine particulate (OFRAC) VOC / NOX ratio (after reaction) (VCNX) to characterize the air mass when computing the formation of SOA from VOC emissions. Typical values for several distinct air mass types are: Month 1 2 3 4 5 6 7 8 9 10 11 12 Jan Feb Mar Apr May Jun Jul Aug Sep Oct Nov Dec Clean Continental BCKPMF 1. 1. 1. 1. 1. 1. 1. 1. 1. 1. 1. 1. OFRAC .15 .15 .20 .20 .20 .20 .20 .20 .20 .20 .20 .15 VCNX 50. 50. 50. 50. 50. 50. 50. 50. 50. 50. 50. 50. Clean Marine (surface) BCKPMF .5 .5 .5 .5 .5 .5 .5 .5 .5 .5 .5 .5 OFRAC .25 .25 .30 .30 .30 .30 .30 .30 .30 .30 .30 .25 VCNX 50. 50. 50. 50. 50. 50. 50. 50. 50. 50. 50. 50. Urban - low biogenic (controls present) BCKPMF 30. 30. 30. 30. 30. 30. 30. 30. 30. 30. 30. 30.
EML Air Pty Ltd Appendix C page 16
Air Emission Specialists MELBOURNE • SYDNEY • PERTH • BRISBANE
OFRAC .20 .20 .25 .25 .25 .25 .25 .25 .20 .20 .20 .20 VCNX 4. 4. 4. 4. 4. 4. 4. 4. 4. 4. 4. 4. Urban - high biogenic (controls present) BCKPMF 60. 60. 60. 60. 60. 60. 60. 60. 60. 60. 60. 60. OFRAC .25 .25 .30 .30 .30 .55 .55 .55 .35 .35 .35 .25 VCNX 15. 15. 15. 15. 15. 15. 15. 15. 15. 15. 15. 15. Regional Plume BCKPMF 20. 20. 20. 20. 20. 20. 20. 20. 20. 20. 20. 20. OFRAC .20 .20 .25 .35 .25 .40 .40 .40 .30 .30 .30 .20 VCNX 15. 15. 15. 15. 15. 15. 15. 15. 15. 15. 15. 15. Urban - no controls present BCKPMF 100. 100. 100. 100. 100. 100. 100. 100. 100. 100. 100. 100. OFRAC .30 .30 .35 .35 .35 .55 .55 .55 .35 .35 .35 .30 VCNX 2. 2. 2. 2. 2. 2. 2. 2. 2. 2. 2. 2. Default: Clean Continental ! BCKPMF = 1.00, 1.00, 1.00, 1.00, 1.00, 1.00, 1.00, 1.00, 1.00, 1.00, 1.00, 1.00 ! ! OFRAC = 0.15, 0.15, 0.20, 0.20, 0.20, 0.20, 0.20, 0.20, 0.20, 0.20, 0.20, 0.15 ! ! VCNX = 50.00, 50.00, 50.00, 50.00, 50.00, 50.00, 50.00, 50.00, 50.00, 50.00, 50.00, 50.00 ! !END! ------------------------------------------------------------------------------- INPUT GROUP: 12 -- Misc. Dispersion and Computational Parameters --------------- Horizontal size of puff (m) beyond which time-dependent dispersion equations (Heffter) are used to determine sigma-y and sigma-z (SYTDEP) Default: 550. ! SYTDEP = 5.5E02 ! Switch for using Heffter equation for sigma z as above (0 = Not use Heffter; 1 = use Heffter (MHFTSZ) Default: 0 ! MHFTSZ = 0 ! Stability class used to determine plume growth rates for puffs above the boundary layer (JSUP) Default: 5 ! JSUP = 5 ! Vertical dispersion constant for stable conditions (k1 in Eqn. 2.7-3) (CONK1) Default: 0.01 ! CONK1 = .01 ! Vertical dispersion constant for neutral/ unstable conditions (k2 in Eqn. 2.7-4) (CONK2) Default: 0.1 ! CONK2 = .1 ! Factor for determining Transition-point from Schulman-Scire to Huber-Snyder Building Downwash scheme (SS used for Hs < Hb + TBD * HL) (TBD) Default: 0.5 ! TBD = .5 ! TBD < 0 ==> always use Huber-Snyder TBD = 1.5 ==> always use Schulman-Scire TBD = 0.5 ==> ISC Transition-point Range of land use categories for which urban dispersion is assumed (IURB1, IURB2) Default: 10 ! IURB1 = 10 ! 19 ! IURB2 = 19 ! Site characterization parameters for single-point Met data files --------- (needed for METFM = 2,3,4,5)

EML Air Pty Ltd Appendix C page 17
Air Emission Specialists MELBOURNE • SYDNEY • PERTH • BRISBANE
Land use category for modeling domain (ILANDUIN) Default: 20 ! ILANDUIN = 20 ! Roughness length (m) for modeling domain (Z0IN) Default: 0.25 ! Z0IN = .25 ! Leaf area index for modeling domain (XLAIIN) Default: 3.0 ! XLAIIN = 3.0 ! Elevation above sea level (m) (ELEVIN) Default: 0.0 ! ELEVIN = .0 ! Latitude (degrees) for met location (XLATIN) Default: -999. ! XLATIN = .0 ! Longitude (degrees) for met location (XLONIN) Default: -999. ! XLONIN = .0 ! Specialized information for interpreting single-point Met data files ----- Anemometer height (m) (Used only if METFM = 2,3) (ANEMHT) Default: 10. ! ANEMHT = 10.0 ! Form of lateral turbulance data in PROFILE.DAT file (Used only if METFM = 4,5 or MTURBVW = 1 or 3) (ISIGMAV) Default: 1 ! ISIGMAV = 1 ! 0 = read sigma-theta 1 = read sigma-v Choice of mixing heights (Used only if METFM = 4) (IMIXCTDM) Default: 0 ! IMIXCTDM = 0 ! 0 = read PREDICTED mixing heights 1 = read OBSERVED mixing heights Maximum length of a slug (met. grid units) (XMXLEN) Default: 1.0 ! XMXLEN = 1.0 ! Maximum travel distance of a puff/slug (in grid units) during one sampling step (XSAMLEN) Default: 1.0 ! XSAMLEN = 1.0 ! Maximum Number of slugs/puffs release from one source during one time step (MXNEW) Default: 99 ! MXNEW = 99 ! Maximum Number of sampling steps for one puff/slug during one time step (MXSAM) Default: 99 ! MXSAM = 99 ! Number of iterations used when computing the transport wind for a sampling step that includes gradual rise (for CALMET and PROFILE winds) (NCOUNT) Default: 2 ! NCOUNT = 2 ! Minimum sigma y for a new puff/slug (m) (SYMIN) Default: 1.0 ! SYMIN = 1.0 ! Minimum sigma z for a new puff/slug (m) (SZMIN) Default: 1.0 ! SZMIN = 1.0 ! Default minimum turbulence velocities sigma-v and sigma-w for each stability class over land and over water (m/s) (SVMIN(12) and SWMIN(12)) ---------- LAND ---------- --------- WATER ---------- Stab Class : A B C D E F A B C D E F --- --- --- --- --- --- --- --- --- --- --- ---

EML Air Pty Ltd Appendix C page 18
Air Emission Specialists MELBOURNE • SYDNEY • PERTH • BRISBANE
Default SVMIN : .50, .50, .50, .50, .50, .50, .37, .37, .37, .37, .37, .37 Default SWMIN : .20, .12, .08, .06, .03, .016, .20, .12, .08, .06, .03, .016 ! SVMIN = 0.500, 0.500, 0.500, 0.500, 0.500, 0.500, 0.370, 0.370, 0.370, 0.370, 0.370, 0.370! ! SWMIN = 0.200, 0.120, 0.080, 0.060, 0.030, 0.016, 0.200, 0.120, 0.080, 0.060, 0.030, 0.016! Divergence criterion for dw/dz across puff used to initiate adjustment for horizontal convergence (1/s) Partial adjustment starts at CDIV(1), and full adjustment is reached at CDIV(2) (CDIV(2)) Default: 0.0,0.0 ! CDIV = .0, .0 ! Minimum wind speed (m/s) allowed for non-calm conditions. Also used as minimum speed returned when using power-law extrapolation toward surface (WSCALM) Default: 0.5 ! WSCALM = .5 ! Maximum mixing height (m) (XMAXZI) Default: 3000. ! XMAXZI = 3000.0 ! Minimum mixing height (m) (XMINZI) Default: 50. ! XMINZI = 80.0 ! Default wind speed classes -- 5 upper bounds (m/s) are entered; the 6th class has no upper limit (WSCAT(5)) Default : ISC RURAL : 1.54, 3.09, 5.14, 8.23, 10.8 (10.8+) Wind Speed Class : 1 2 3 4 5 --- --- --- --- --- ! WSCAT = 1.54, 3.09, 5.14, 8.23, 10.80 ! Default wind speed profile power-law exponents for stabilities 1-6 (PLX0(6)) Default : ISC RURAL values ISC RURAL : .07, .07, .10, .15, .35, .55 ISC URBAN : .15, .15, .20, .25, .30, .30 Stability Class : A B C D E F --- --- --- --- --- --- ! PLX0 = 0.07, 0.07, 0.10, 0.15, 0.35, 0.55 ! Default potential temperature gradient for stable classes E, F (degK/m) (PTG0(2)) Default: 0.020, 0.035 ! PTG0 = 0.020, 0.035 ! Default plume path coefficients for each stability class (used when option for partial plume height terrain adjustment is selected -- MCTADJ=3) (PPC(6)) Stability Class : A B C D E F Default PPC : .50, .50, .50, .50, .35, .35 --- --- --- --- --- --- ! PPC = 0.50, 0.50, 0.50, 0.50, 0.35, 0.35 ! Slug-to-puff transition criterion factor equal to sigma-y/length of slug (SL2PF) Default: 10. ! SL2PF = 10.0 ! Puff-splitting control variables ------------------------ VERTICAL SPLIT

EML Air Pty Ltd Appendix C page 19
Air Emission Specialists MELBOURNE • SYDNEY • PERTH • BRISBANE
-------------- Number of puffs that result every time a puff is split - nsplit=2 means that 1 puff splits into 2 (NSPLIT) Default: 3 ! NSPLIT = 3 ! Time(s) of a day when split puffs are eligible to be split once again; this is typically set once per day, around sunset before nocturnal shear develops. 24 values: 0 is midnight (00:00) and 23 is 11 PM (23:00) 0=do not re-split 1=eligible for re-split (IRESPLIT(24)) Default: Hour 17 = 1 ! IRESPLIT = 0,0,0,0,0,0,0,0,0,0,0,0,0,0,0,0,0,1,0,0,0,0,0,0 ! Split is allowed only if last hour's mixing height (m) exceeds a minimum value (ZISPLIT) Default: 100. ! ZISPLIT = 100.0 ! Split is allowed only if ratio of last hour's mixing ht to the maximum mixing ht experienced by the puff is less than a maximum value (this postpones a split until a nocturnal layer develops) (ROLDMAX) Default: 0.25 ! ROLDMAX = 0.25 ! HORIZONTAL SPLIT ---------------- Number of puffs that result every time a puff is split - nsplith=5 means that 1 puff splits into 5 (NSPLITH) Default: 5 ! NSPLITH = 5 ! Minimum sigma-y (Grid Cells Units) of puff before it may be split (SYSPLITH) Default: 1.0 ! SYSPLITH = 1.0 ! Minimum puff elongation rate (SYSPLITH/hr) due to wind shear, before it may be split (SHSPLITH) Default: 2. ! SHSPLITH = 2.0 ! Minimum concentration (g/m^3) of each species in puff before it may be split Enter array of NSPEC values; if a single value is entered, it will be used for ALL species (CNSPLITH) Default: 1.0E-07 ! CNSPLITH = 1.0E-07 ! Integration control variables ------------------------ Fractional convergence criterion for numerical SLUG sampling integration (EPSSLUG) Default: 1.0e-04 ! EPSSLUG = 1.0E-04 ! Fractional convergence criterion for numerical AREA source integration (EPSAREA) Default: 1.0e-06 ! EPSAREA = 1.0E-06 ! Trajectory step-length (m) used for numerical rise integration (DSRISE) Default: 1.0 ! DSRISE = 1.0 ! Boundary Condition (BC) Puff control variables ------------------------ Minimum height (m) to which BC puffs are mixed as they are emitted (MBCON=2 ONLY). Actual height is reset to the current mixing height at the release point if greater than this minimum. (HTMINBC) Default: 500. ! HTMINBC = 500.0 !

EML Air Pty Ltd Appendix C page 20
Air Emission Specialists MELBOURNE • SYDNEY • PERTH • BRISBANE
Search radius (km) about a receptor for sampling nearest BC puff. BC puffs are typically emitted with a spacing of one grid cell length, so the search radius should be greater than DGRIDKM. (RSAMPBC) Default: 10. ! RSAMPBC = 10.0 ! Near-Surface depletion adjustment to concentration profile used when sampling BC puffs? (MDEPBC) Default: 1 ! MDEPBC = 1 ! 0 = Concentration is NOT adjusted for depletion 1 = Adjust Concentration for depletion !END! ------------------------------------------------------------------------------- INPUT GROUPS: 13a, 13b, 13c, 13d -- Point source parameters -------------------------------- --------------- Subgroup (13a) --------------- Number of point sources with parameters provided below (NPT1) No default ! NPT1 = 1 ! Units used for point source emissions below (IPTU) Default: 1 ! IPTU = 6 ! 1 = g/s 2 = kg/hr 3 = lb/hr 4 = tons/yr 5 = Odour Unit * m**3/s (vol. flux of odour compound) 6 = Odour Unit * m**3/min 7 = metric tons/yr Number of source-species combinations with variable emissions scaling factors provided below in (13d) (NSPT1) Default: 0 ! NSPT1 = 1 ! Number of point sources with variable emission parameters provided in external file (NPT2) No default ! NPT2 = 0 ! (If NPT2 > 0, these point source emissions are read from the file: PTEMARB.DAT) !END! --------------- Subgroup (13b) --------------- a POINT SOURCE: CONSTANT DATA ----------------------------- b c Source X Y Stack Base Stack Exit Exit Bldg. Emission No. Coordinate Coordinate Height Elevation Diameter Vel. Temp. Dwash Rates (km) (km) (m) (m) (m) (m/s) (deg. K) ------ ---------- ---------- ------ ------ -------- ----- -------- ----- -------- 1 ! SRCNAM = VENT ! 1 ! X = 403.724, 5444.079, 6.06, 246., 0.73, 20.0, 393.0, .0, 3600000. ! 1 ! ZPLTFM = .0 ! 1 ! FMFAC = 1.0 ! !END! --------

EML Air Pty Ltd Appendix C page 21
Air Emission Specialists MELBOURNE • SYDNEY • PERTH • BRISBANE
a Data for each source are treated as a separate input subgroup and therefore must end with an input group terminator. SRCNAM is a 12-character name for a source (No default) X is an array holding the source data listed by the column headings (No default) SIGYZI is an array holding the initial sigma-y and sigma-z (m) (Default: 0.,0.) FMFAC is a vertical momentum flux factor (0. or 1.0) used to represent the effect of rain-caps or other physical configurations that reduce momentum rise associated with the actual exit velocity. (Default: 1.0 -- full momentum used) ZPLTFM is the platform height (m) for sources influenced by an isolated structure that has a significant open area between the surface and the bulk of the structure, such as an offshore oil platform. The Base Elevation is that of the surface (ground or ocean), and the Stack Height is the release height above the Base (not above the platform). Building heights entered in Subgroup 13c must be those of the buildings on the platform, measured from the platform deck. ZPLTFM is used only with MBDW=1 (ISC downwash method) for sources with building downwash. (Default: 0.0) b 0. = No building downwash modeled 1. = Downwash modeled for buildings resting on the surface 2. = Downwash modeled for buildings raised above the surface (ZPLTFM > 0.) NOTE: must be entered as a REAL number (i.e., with decimal point) c An emission rate must be entered for every pollutant modeled. Enter emission rate of zero for secondary pollutants that are modeled, but not emitted. Units are specified by IPTU (e.g. 1 for g/s). --------------- Subgroup (13c) --------------- BUILDING DIMENSION DATA FOR SOURCES SUBJECT TO DOWNWASH ------------------------------------------------------- Source a No. Effective building height, width, length and X/Y offset (in meters) every 10 degrees. LENGTH, XBADJ, and YBADJ are only needed for MBDW=2 (PRIME downwash option) ------ -------------------------------------------------------------------- -------- a Building height, width, length, and X/Y offset from the source are treated as a separate input subgroup for each source and therefore must end with an input group terminator. The X/Y offset is the position, relative to the stack, of the center of the upwind face of the projected building, with the x-axis pointing along the flow direction. --------------- Subgroup (13d) --------------- a POINT SOURCE: VARIABLE EMISSIONS DATA --------------------------------------- Use this subgroup to describe temporal variations in the emission rates given in 13b. Factors entered multiply the rates in 13b.

EML Air Pty Ltd Appendix C page 22
Air Emission Specialists MELBOURNE • SYDNEY • PERTH • BRISBANE
Skip sources here that have constant emissions. For more elaborate variation in source parameters, use PTEMARB.DAT and NPT2 > 0. IVARY determines the type of variation, and is source-specific: (IVARY) Default: 0 0 = Constant 1 = Diurnal cycle (24 scaling factors: hours 1-24) 2 = Monthly cycle (12 scaling factors: months 1-12) 3 = Hour & Season (4 groups of 24 hourly scaling factors, where first group is DEC-JAN-FEB) 4 = Speed & Stab. (6 groups of 6 scaling factors, where first group is Stability Class A, and the speed classes have upper bounds (m/s) defined in Group 12 5 = Temperature (12 scaling factors, where temperature classes have upper bounds (C) of: 0, 5, 10, 15, 20, 25, 30, 35, 40, 45, 50, 50+) !SRCNAM = VENT ! !IVARY = 1! !SO2 = 0,0,0,0,0,0,0,1,1,1,1,1,1,1,1,1,1,1,0,0,0,0,0,0 ! !END! -------- a Data for each species are treated as a separate input subgroup and therefore must end with an input group terminator. ------------------------------------------------------------------------------- INPUT GROUPS: 14a, 14b, 14c, 14d -- Area source parameters -------------------------------- --------------- Subgroup (14a) --------------- Number of polygon area sources with parameters specified below (NAR1) No default ! NAR1 = 0 ! Units used for area source emissions below (IARU) Default: 1 ! IARU = 1 ! 1 = g/m**2/s 2 = kg/m**2/hr 3 = lb/m**2/hr 4 = tons/m**2/yr 5 = Odour Unit * m/s (vol. flux/m**2 of odour compound) 6 = Odour Unit * m/min 7 = metric tons/m**2/yr Number of source-species combinations with variable emissions scaling factors provided below in (14d) (NSAR1) Default: 0 ! NSAR1 = 0 ! Number of buoyant polygon area sources with variable location and emission parameters (NAR2) No default ! NAR2 = 0 ! (If NAR2 > 0, ALL parameter data for these sources are read from the file: BAEMARB.DAT) !END! --------------- Subgroup (14b) --------------- a

EML Air Pty Ltd Appendix C page 23
Air Emission Specialists MELBOURNE • SYDNEY • PERTH • BRISBANE
AREA SOURCE: CONSTANT DATA ---------------------------- b Source Effect. Base Initial Emission No. Height Elevation Sigma z Rates (m) (m) (m) ------- ------ ------ -------- --------- -------- a Data for each source are treated as a separate input subgroup and therefore must end with an input group terminator. b An emission rate must be entered for every pollutant modeled. Enter emission rate of zero for secondary pollutants that are modeled, but not emitted. Units are specified by IARU (e.g. 1 for g/m**2/s). --------------- Subgroup (14c) --------------- COORDINATES (km) FOR EACH VERTEX(4) OF EACH POLYGON -------------------------------------------------------- Source a No. Ordered list of X followed by list of Y, grouped by source ------ ------------------------------------------------------------ -------- a Data for each source are treated as a separate input subgroup and therefore must end with an input group terminator. --------------- Subgroup (14d) --------------- a AREA SOURCE: VARIABLE EMISSIONS DATA -------------------------------------- Use this subgroup to describe temporal variations in the emission rates given in 14b. Factors entered multiply the rates in 14b. Skip sources here that have constant emissions. For more elaborate variation in source parameters, use BAEMARB.DAT and NAR2 > 0. IVARY determines the type of variation, and is source-specific: (IVARY) Default: 0 0 = Constant 1 = Diurnal cycle (24 scaling factors: hours 1-24) 2 = Monthly cycle (12 scaling factors: months 1-12) 3 = Hour & Season (4 groups of 24 hourly scaling factors, where first group is DEC-JAN-FEB) 4 = Speed & Stab. (6 groups of 6 scaling factors, where first group is Stability Class A, and the speed classes have upper bounds (m/s) defined in Group 12 5 = Temperature (12 scaling factors, where temperature classes have upper bounds (C) of: 0, 5, 10, 15, 20, 25, 30, 35, 40, 45, 50, 50+) -------- a Data for each species are treated as a separate input subgroup
EML Air Pty Ltd Appendix C page 24
Air Emission Specialists MELBOURNE • SYDNEY • PERTH • BRISBANE
and therefore must end with an input group terminator. ------------------------------------------------------------------------------- INPUT GROUPS: 15a, 15b, 15c -- Line source parameters --------------------------- --------------- Subgroup (15a) --------------- Number of buoyant line sources with variable location and emission parameters (NLN2) No default ! NLN2 = 0 ! (If NLN2 > 0, ALL parameter data for these sources are read from the file: LNEMARB.DAT) Number of buoyant line sources (NLINES) No default ! NLINES = 0 ! Units used for line source emissions below (ILNU) Default: 1 ! ILNU = 1 ! 1 = g/s 2 = kg/hr 3 = lb/hr 4 = tons/yr 5 = Odour Unit * m**3/s (vol. flux of odour compound) 6 = Odour Unit * m**3/min 7 = metric tons/yr Number of source-species combinations with variable emissions scaling factors provided below in (15c) (NSLN1) Default: 0 ! NSLN1 = 0 ! Maximum number of segments used to model each line (MXNSEG) Default: 7 ! MXNSEG = 7 ! The following variables are required only if NLINES > 0. They are used in the buoyant line source plume rise calculations. Number of distances at which Default: 6 ! NLRISE = 6 ! transitional rise is computed Average building length (XL) No default ! XL = .0 ! (in meters) Average building height (HBL) No default ! HBL = .0 ! (in meters) Average building width (WBL) No default ! WBL = .0 ! (in meters) Average line source width (WML) No default ! WML = .0 ! (in meters) Average separation between buildings (DXL) No default ! DXL = .0 ! (in meters) Average buoyancy parameter (FPRIMEL) No default ! FPRIMEL = .0 ! (in m**4/s**3) !END! --------------- Subgroup (15b) ---------------

EML Air Pty Ltd Appendix C page 25
Air Emission Specialists MELBOURNE • SYDNEY • PERTH • BRISBANE
BUOYANT LINE SOURCE: CONSTANT DATA ---------------------------------- a Source Beg. X Beg. Y End. X End. Y Release Base Emission No. Coordinate Coordinate Coordinate Coordinate Height Elevation Rates (km) (km) (km) (km) (m) (m) ------ ---------- ---------- --------- ---------- ------- --------- --------- -------- a Data for each source are treated as a separate input subgroup and therefore must end with an input group terminator. b An emission rate must be entered for every pollutant modeled. Enter emission rate of zero for secondary pollutants that are modeled, but not emitted. Units are specified by ILNTU (e.g. 1 for g/s). --------------- Subgroup (15c) --------------- a BUOYANT LINE SOURCE: VARIABLE EMISSIONS DATA ---------------------------------------------- Use this subgroup to describe temporal variations in the emission rates given in 15b. Factors entered multiply the rates in 15b. Skip sources here that have constant emissions. IVARY determines the type of variation, and is source-specific: (IVARY) Default: 0 0 = Constant 1 = Diurnal cycle (24 scaling factors: hours 1-24) 2 = Monthly cycle (12 scaling factors: months 1-12) 3 = Hour & Season (4 groups of 24 hourly scaling factors, where first group is DEC-JAN-FEB) 4 = Speed & Stab. (6 groups of 6 scaling factors, where first group is Stability Class A, and the speed classes have upper bounds (m/s) defined in Group 12 5 = Temperature (12 scaling factors, where temperature classes have upper bounds (C) of: 0, 5, 10, 15, 20, 25, 30, 35, 40, 45, 50, 50+) -------- a Data for each species are treated as a separate input subgroup and therefore must end with an input group terminator. ------------------------------------------------------------------------------- INPUT GROUPS: 16a, 16b, 16c -- Volume source parameters --------------------------- --------------- Subgroup (16a) --------------- Number of volume sources with parameters provided in 16b,c (NVL1) No default ! NVL1 = 1 ! Units used for volume source

EML Air Pty Ltd Appendix C page 26
Air Emission Specialists MELBOURNE • SYDNEY • PERTH • BRISBANE
emissions below in 16b (IVLU) Default: 1 ! IVLU = 6 ! 1 = g/s 2 = kg/hr 3 = lb/hr 4 = tons/yr 5 = Odour Unit * m**3/s (vol. flux of odour compound) 6 = Odour Unit * m**3/min 7 = metric tons/yr Number of source-species combinations with variable emissions scaling factors provided below in (16c) (NSVL1) Default: 0 ! NSVL1 = 1 ! Number of volume sources with variable location and emission parameters (NVL2) No default ! NVL2 = 0 ! (If NVL2 > 0, ALL parameter data for these sources are read from the VOLEMARB.DAT file(s) ) !END! --------------- Subgroup (16b) --------------- a VOLUME SOURCE: CONSTANT DATA ------------------------------ b X Y Effect. Base Initial Initial Emission Coordinate Coordinate Height Elevation Sigma y Sigma z Rates (km) (km) (m) (m) (m) (m) ---------- ---------- ------ ------ -------- -------- -------- !SRCNAM = LOAD ! !X = 403.744, 5444.079, 0., 246., 2., 2., 24000. ! !END! -------- a Data for each source are treated as a separate input subgroup and therefore must end with an input group terminator. b An emission rate must be entered for every pollutant modeled. Enter emission rate of zero for secondary pollutants that are modeled, but not emitted. Units are specified by IVLU (e.g. 1 for g/s). --------------- Subgroup (16c) --------------- a VOLUME SOURCE: VARIABLE EMISSIONS DATA ---------------------------------------- Use this subgroup to describe temporal variations in the emission rates given in 16b. Factors entered multiply the rates in 16b. Skip sources here that have constant emissions. For more elaborate variation in source parameters, use VOLEMARB.DAT and NVL2 > 0. IVARY determines the type of variation, and is source-specific: (IVARY) Default: 0 0 = Constant 1 = Diurnal cycle (24 scaling factors: hours 1-24) 2 = Monthly cycle (12 scaling factors: months 1-12) 3 = Hour & Season (4 groups of 24 hourly scaling factors, where first group is DEC-JAN-FEB) 4 = Speed & Stab. (6 groups of 6 scaling factors, where first group is Stability Class A,

EML Air Pty Ltd Appendix C page 27
Air Emission Specialists MELBOURNE • SYDNEY • PERTH • BRISBANE
and the speed classes have upper bounds (m/s) defined in Group 12 5 = Temperature (12 scaling factors, where temperature classes have upper bounds (C) of: 0, 5, 10, 15, 20, 25, 30, 35, 40, 45, 50, 50+) -------- a Data for each species are treated as a separate input subgroup and therefore must end with an input group terminator. !SRCNAM = LOAD ! !IVARY = 1! !SO2 = 0,0,0,0,0,0,0,1,1,1,1,1,1,1,1,1,1,1,0,0,0,0,0,0 ! !END! ------------------------------------------------------------------------------- INPUT GROUPS: 17a & 17b -- Non-gridded (discrete) receptor information ----------------------- --------------- Subgroup (17a) --------------- Number of non-gridded receptors (NREC) No default ! NREC = 0 ! !END! --------------- Subgroup (17b) --------------- a NON-GRIDDED (DISCRETE) RECEPTOR DATA ------------------------------------ X Y Ground Height b Receptor Coordinate Coordinate Elevation Above Ground No. (km) (km) (m) (m) -------- ---------- ---------- --------- ------------ ------------- a Data for each receptor are treated as a separate input subgroup and therefore must end with an input group terminator. b Receptor height above ground is optional. If no value is entered, the receptor is placed on the ground.

APPENDIX 5 Environmental Noise Assessment
AAAC Member of the Association of Australian Acoustical Consultants
Project: Fulton Hogan Pty Ltd Proposed Mobile Asphalt Plant Environmental Noise Evaluation Subject Site: 195 Circular Road East Ridgley,
Tasmania Addressee: Fulton Hogan Pty Ltd C/- EnviroRisk Management Pty Ltd PO Box 183 Lara Vic 3212
Issued To: Lok Nethercott Date: 30 July 2014 Reference: 16067-1 Prepared by: David Dolly (Director) B.App.Sc. M.A.A.S

Acoustic Consulting Australia Pty Ltd. Page 2 of 8
CONTENTS
1.0 INTRODUCTION AND CONSULTING SCOPE ................................................................ 3
2.0 NOISE SENSITIVE RECEIVERS ...................................................................................... 3
3.0 ENVIRONMENTAL NOISE LEVEL OBJECTIVES ........................................................... 4
3.1 Existing Site Licence Condition ............................................................................................ 4
3.2 Design Goal for the Noise from Asphalt Plant Operations ................................................... 4
4.0 ENVIRONMENTAL NOISE MODELLING ......................................................................... 4
4.1 Model Used .......................................................................................................................... 4
4.2 Model Data ........................................................................................................................... 4
4.3 Assumptions Made .............................................................................................................. 5 4.3.1 Operating Mode .................................................................................................................................. 5
5.0 MODELLING RESULTS .................................................................................................... 5
5.1 Predicted Noise levels Each Receiver Point ........................................................................ 5
5.2 Noise Sources Rankings and Noise Control Opportunities ................................................. 6
6.0 NOISE LEVEL CONTOURS .............................................................................................. 7
7.0 SUMMARY AND CONCLUSIONS .................................................................................... 7

Acoustic Consulting Australia Pty Ltd. Page 3 of 8 1.0 Introduction and Consulting Scope
Fulton Hogan Pty Ltd proposes the operation of a temporary mobile asphalt batching and distribution operation on land adjacent to an existing quarry operation located at the East Ridgley site in Tasmania (shown below).
Acoustic Consulting Australia Pty Ltd has been engaged to make and evaluation of the future emissions associated with the proposed batching plant operations at this site.
2.0 Noise Sensitive Receivers The noise sensitive receivers (residences nearest to the proposal site) are shown in the area plan below:

Acoustic Consulting Australia Pty Ltd. Page 4 of 8 3.0 Environmental Noise Level Objectives 3.1 Existing Site Licence Condition
It is understood that the site proposed for the asphalt batching operation is within the boundaries of the licence issued for the existing quarry operation. We are instructed that the licence for the premises requires that noise emitted from the licenced premises not exceed 45dB(A) during the day period (7am to 7pm). This limit is to be applied to the Equivalent Continuous Noise Level (LAeq) measured over a period of not less than 60 minutes.
3.2 Design Goal for the Noise from Asphalt Plant Operations
We understand that during the day period the quarry and asphalt plant could operate concurrently. Overall noise from the licenced premises must meet 45dB(A) during the day period. Therefore it will be necessary for noise from the asphalt plant to be notably less than 45dB(A) to account for additive effects of the two sites. Our preliminary advice would be that noise from the asphalt plant operations should be maintained below 40dB(A) LAeq during the day period operation.
4.0 Environmental Noise Modelling 4.1 Model Used
Noise emissions from the proposed operations have been modelled using “Soundplan Essentials” environmental noise modelling software. This model applies for a condition of assisted sound propagation from the source to the prediction point assuming an assisting breeze and therefore represents the typical higher noise levels predicted at each receiver point. Influence of Wind It is important to note that the model assumes a downwind condition from the noise source to the residences for all predictions and represents a worst case in respect of wind assistance. During calm conditions the resulting noise levels could be at least 5dB(A) lower. When the wind is opposing the direction of sound propagation the predicted level would be substantially lower by 10dB(A); or more in some cases. The above is important in this case due to the temporary and short-term nature of the proposed operation asphalt plant.
4.2 Model Data
Acoustic data used for the modelling process for all nominated noise producing sources/activities is provided in the table below:

Acoustic Consulting Australia Pty Ltd. Page 5 of 8
Description Sound Power level, dB(A) [10-‐12W]
Mobile Asphalt Plant (including burner) 105
Baghouse/Filter 99
Truck Inbound 96
Truck Outbound 96
Front End Loader 100
Note: The sound power level for the trucks and loader has been adjusted to
represent an equivalent continuous noise over a 30minute period allowing for the fact that these sources are not operating on an ongoing basis over this time. An “on-time” of 30% has been assumed for the frontend loader. An on time of 30% is assumed for each truck movement.
4.3 Assumptions Made
4.3.1 Operating Mode
We have assumed that all of the above-tabulated noise sources would operate during a typical operational cycle including intermittent operation of the frontend loader, mixing, truck arrival, load-out and truck departure. Overall, 4 truck movements are allowed for in any sample. Semi - continuous operation is assumed for the batching plant including the burner as well as conveyors and mixing. Continuous operation has been assumed for the bag house/filtering operation.
5.0 Modelling Results 5.1 Predicted Noise levels Each Receiver Point
This refers to the LAeq (60min) noise levels predicted outside each dwelling based on the above mentioned noise data. (Together with spectrum details obtained from file data and surveys of equivalent plant and vehicles). The modelling results incorporate no special noise controls at this stage. The following table summarizes the results that have been obtained from the modelling process:
Residence/ Location
Predicted Noise Level, dB(A )LAeq
Interim Design Goal Noise Level,
dB(A)
Comment
SR1 35 40 Note 1
SR2 38 40 Note 1

Acoustic Consulting Australia Pty Ltd. Page 6 of 8
Residence/ Location
Predicted Noise Level, dB(A )LAeq
Interim Design Goal Noise Level,
dB(A)
Comment
SR3 44 40 Note 2
SR4 30 40 Note 1
Notes:
1. Noise propagation to this direction/receiver is not likely to require any additional sound attenuation.
2. Some dedicated sound attenuation is may be required in the direction of this receiver
Discussion:
The modelling outcomes indicate that predicted noise from the proposed asphalt plant operation are unlikely to cause non-compliance with the existing licence requirement of 45dB(A) during the daytime period in the directions of residences SR1, SR2 and SR4. In considering the result for SR3 we note that the predicted noise levels at this residence requires the combination of the plant operating with the presence of breezes blowing in that direction. We understand that prevailing winds are from the west and that the actual operation of the asphalt plant will be limited to 5 to 6 events over the 18 months, each having a two week duration. This leads us to conclude the asphalt facility generated noise levels at SR3 are unlikely to exceed 40dB(A) during the temporary existence of this facility. However, as the predicted noise levels from the proposed asphalt batching operations are greater than 36dB(A) at two of the locations we recommend that Fulton Hogan be prepared to make a post installation noise assessment, as required. This assessment would be undertaken to validate that combined noise from the quarry and asphalt plant meets the 45dB(A) licence limit, under typical operating conditions.
5.2 Noise Sources Rankings and Noise Control Opportunities
The mobile asphalt plant is the most significant noise source (dominated by the burner operation). Noise from the frontend loader is the second most dominant source. We anticipate that a 4dB(A) or greater noise reduction in the direction of SR3 is achievable with good site planning and the provision of sound attenuating screening elements on the south side of the mobile plant burner and load out zone. The noise emission from the frontend loader should be considered closely for this site. Effective and well-maintained sound suppression systems are recommended for this vehicle.
Acoustic Consulting Australia Pty Ltd. Page 7 of 8
We recommend that the pre-commencement site planning include a consideration of acoustic screening opportunities that could be taken up if required based on direct assessment after commencement of operations.
Based on our review of the modelling results, it is expected that noise from day period operation of the proposed asphalt batching plant can be adequately reduced (if required) by using strategically placed acoustic screening on the southern side of the burner and load out zone. It would be recommended that the frontend loader be primarily operated on the north side of the batching line.
6.0 Noise Level Contours
Refer to Appendix A for colour coded noise level contour plots produced by the Sound Plan model for the pre-attenuated scenarios.
7.0 Summary and Conclusions An evaluation has been made of noise from the asphalt plant proposed at the subject site using proprietary environmental noise prediction software based on real source sound level data. It is concluded from the evaluation that: Site layout planning is needed to ensure that noise to the south can be adequately reduced for daytime operations if required based on direct assessment. Sound attenuation screening may be required locally on the south side of plant.
David Dolly Acoustic Consulting Australia Pty Ltd

Acoustic Consulting Australia Pty Ltd. Page 8 of 8 Appendix A: Environmental Noise Contours – Pre-application of Additional Noise Control

APPENDIX 6 Fulton Hogan Case and Management Action Procedure

Case and Action Management Procedure
Content ID: AU_00010899 Revision: 5
This is an uncontrolled copy if photocopied or printed from the Intranet. Copyright © 2010, Fulton Hogan Ltd. All rights reserved.
Revised:14-10-2013 Page 1 of 15
Case and Action Management Procedure
Contents 1. Purpose ............................................................................................................. 2
2. Scope ................................................................................................................ 2
3. Case and Action Management System (CAMs) ................................................. 3
4. Responsibilities ................................................................................................. 4
4.1. Responsible Manager ................................................................................ 4
4.2. Case Owner ............................................................................................... 4
4.3. Assignees .................................................................................................. 5
4.4. Employees ................................................................................................. 5
5. Case and Action Management Process ............................................................. 5
6. Creating a Case ................................................................................................ 6
6.1. General ...................................................................................................... 6
6.2. Reporting a Case ....................................................................................... 6
6.3. Recording a Case ...................................................................................... 6
6.3.1. Attributing a Case ...................................................................................... 6
6.4. Risk Assessment ....................................................................................... 7
6.5. Notifications ............................................................................................... 7
6.5.1. Internal ...................................................................................................... 7
6.5.2. External ..................................................................................................... 7
7. Managing a Case .............................................................................................. 7
7.1. Review ....................................................................................................... 7
7.1.1. General ...................................................................................................... 7
7.1.2. Record Only Cases .................................................................................... 8
7.1.3. Confidential Information ............................................................................. 8
7.1.4. Changing the Risk Level ............................................................................ 8
7.1.5. Setting the Investigation Level ................................................................... 8
7.1.6. Changing the Principle Stakeholders ......................................................... 8
7.2. Investigation .............................................................................................. 8
7.2.1. General ...................................................................................................... 8
7.2.2. Low Level Investigation .............................................................................. 9
7.2.3. Medium Level Investigation........................................................................ 9
7.2.4. High Level Investigation (Tripod) ............................................................... 9
7.2.5. Root Cause and Contributing Factors ........................................................ 9
7.2.6. Review of Effectiveness of Corrective Action ........................................... 10
7.3. Actions (Tasks) ........................................................................................ 10
7.3.1. Immediate Actions ................................................................................... 10
7.3.2. Corrections .............................................................................................. 10
7.3.3. Corrective and Preventive Actions ........................................................... 10
8. Closing a Case ................................................................................................ 10
9. Definitions ....................................................................................................... 11
10. Related Documents ......................................................................................... 13
10.1. IMS Documents ....................................................................................... 13
10.2. Standards and Codes of Practice ............................................................ 13
11. Revision History .............................................................................................. 13
Appendix A – Case and Action Management system (CAMs) Flowchart ................. 14
Appendix B – CAMs Notifications Summary ............................................................ 15

Case and Action Management Procedure
Content ID: AU_00010899 Revision: 5
This is an uncontrolled copy if photocopied or printed from the Intranet. Copyright © 2010, Fulton Hogan Ltd. All rights reserved.
Revised:14-10-2013 Page 2 of 15
1. Purpose The purpose of this procedure is to:
� define the process and responsibilities associated with the recording and management of incidents, nonconformities and other opportunities for improvement
� ensure that data generated from CAMs is available for statistical reporting/ trend analysis and to capture applicable details of potential and actual nonconformities, incidents and opportunities for improvement that can be raised, monitored and discussed at Management Review Meetings
� ensure the success of Fulton Hogan and the wellbeing of people and the environment through a process of change and continuous improvement as illustrated in Figure 1
Figure 1 The case and action management concept
2. Scope This procedure applies nationally to all operations, management and administration associated with construction, surfacing and infrastructure services at Fulton Hogan Australia. It describes the required process for the recording, management and action for actual and potential incidents and nonconformities, and opportunities for improvement.
The types of cases addressed by this procedure are shown in Figure 2.
Reference should be made to one of the following supporting IMS procedures for guidance on the detailed requirements of specific case types:
� Incident Investigation, Reporting and Notification Procedure
� Nonconformity Procedure
� QuIP Procedure
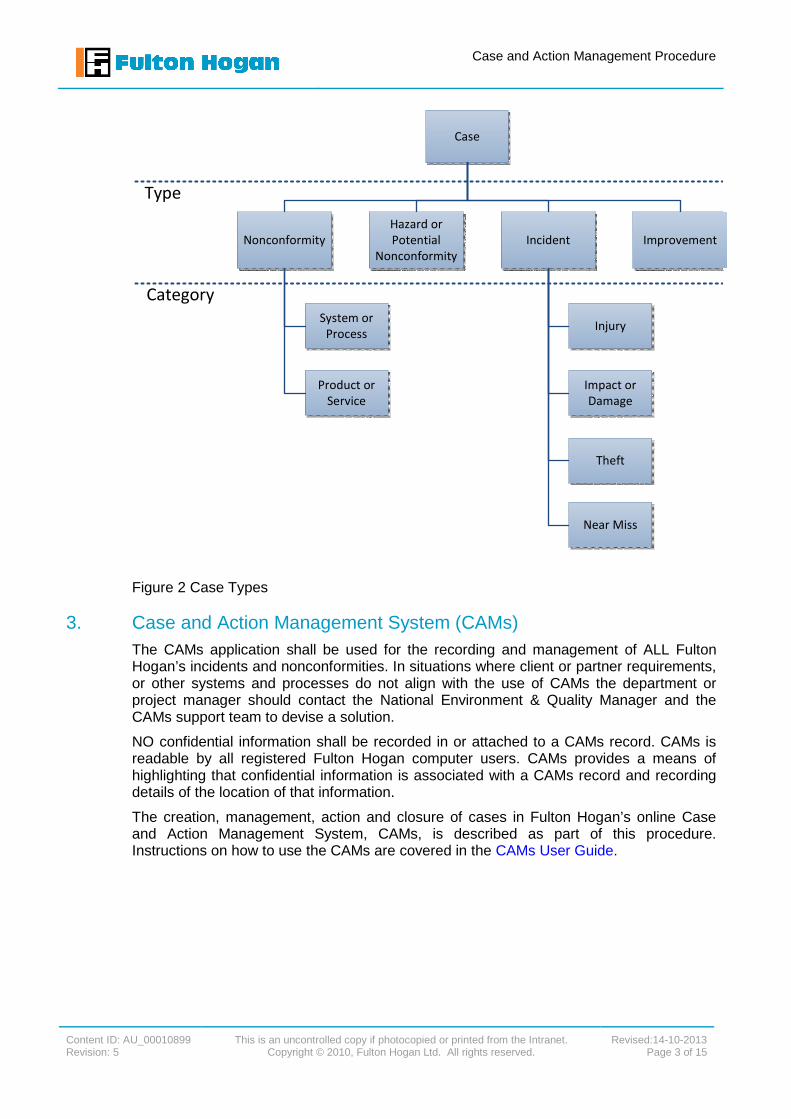
Case and Action Management Procedure
Content ID: AU_00010899 Revision: 5
This is an uncontrolled copy if photocopied or printed from the Intranet. Copyright © 2010, Fulton Hogan Ltd. All rights reserved.
Revised:14-10-2013 Page 3 of 15
Case
Nonconformity
Hazard or
Potential
Nonconformity
Incident Improvement
System or
Process
Product or
Service
Injury
Impact or
Damage
Theft
Type
Category
Near Miss
Figure 2 Case Types
3. Case and Action Management System (CAMs) The CAMs application shall be used for the recording and management of ALL Fulton Hogan’s incidents and nonconformities. In situations where client or partner requirements, or other systems and processes do not align with the use of CAMs the department or project manager should contact the National Environment & Quality Manager and the CAMs support team to devise a solution.
NO confidential information shall be recorded in or attached to a CAMs record. CAMs is readable by all registered Fulton Hogan computer users. CAMs provides a means of highlighting that confidential information is associated with a CAMs record and recording details of the location of that information.
The creation, management, action and closure of cases in Fulton Hogan’s online Case and Action Management System, CAMs, is described as part of this procedure. Instructions on how to use the CAMs are covered in the CAMs User Guide.
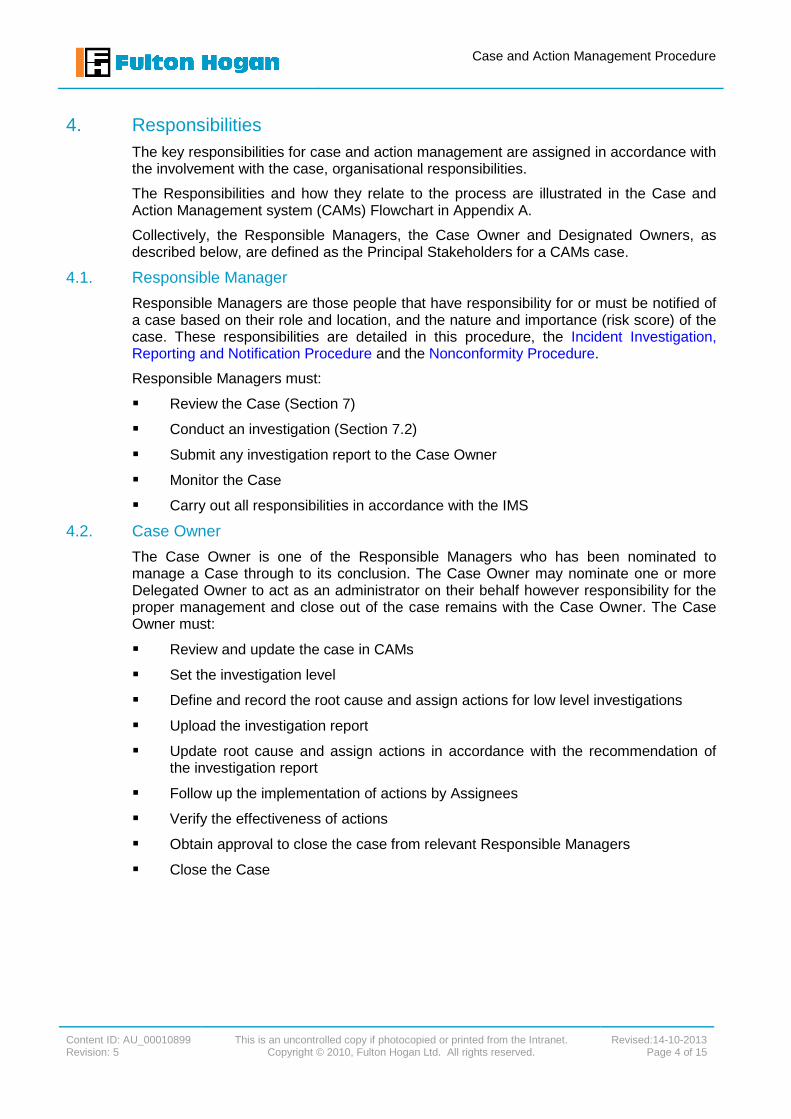
Case and Action Management Procedure
Content ID: AU_00010899 Revision: 5
This is an uncontrolled copy if photocopied or printed from the Intranet. Copyright © 2010, Fulton Hogan Ltd. All rights reserved.
Revised:14-10-2013 Page 4 of 15
4. Responsibilities The key responsibilities for case and action management are assigned in accordance with the involvement with the case, organisational responsibilities.
The Responsibilities and how they relate to the process are illustrated in the Case and Action Management system (CAMs) Flowchart in Appendix A.
Collectively, the Responsible Managers, the Case Owner and Designated Owners, as described below, are defined as the Principal Stakeholders for a CAMs case.
4.1. Responsible Manager
Responsible Managers are those people that have responsibility for or must be notified of a case based on their role and location, and the nature and importance (risk score) of the case. These responsibilities are detailed in this procedure, the Incident Investigation, Reporting and Notification Procedure and the Nonconformity Procedure.
Responsible Managers must:
� Review the Case (Section 7)
� Conduct an investigation (Section 7.2)
� Submit any investigation report to the Case Owner
� Monitor the Case
� Carry out all responsibilities in accordance with the IMS
4.2. Case Owner
The Case Owner is one of the Responsible Managers who has been nominated to manage a Case through to its conclusion. The Case Owner may nominate one or more Delegated Owner to act as an administrator on their behalf however responsibility for the proper management and close out of the case remains with the Case Owner. The Case Owner must:
� Review and update the case in CAMs
� Set the investigation level
� Define and record the root cause and assign actions for low level investigations
� Upload the investigation report
� Update root cause and assign actions in accordance with the recommendation of the investigation report
� Follow up the implementation of actions by Assignees
� Verify the effectiveness of actions
� Obtain approval to close the case from relevant Responsible Managers
� Close the Case

Case and Action Management Procedure
Content ID: AU_00010899 Revision: 5
This is an uncontrolled copy if photocopied or printed from the Intranet. Copyright © 2010, Fulton Hogan Ltd. All rights reserved.
Revised:14-10-2013 Page 5 of 15
4.3. Assignees
An Assignee can be any Fulton Hogan employee who is allocated a Task to complete an action. An Assignee must:
� Accept a Task or Reject a Task with reason
� If required, obtain approval from a Client or Authority for a proposed action as required
� Record, implement, verify and the action in the CAMs Task
� If required, obtain verification from a Client or Authority for a completed action
� Set the status of the Task to ‘Verified and complete’
4.4. Employees
All Fulton Hogan employees are responsible for:
� Identifying cases
� Carrying out immediate actions
� Reporting Cases
� Completing an initial risk assessment
� Making notifications
� Recording Cases
� Nominating a appropriate Case Owner
5. Case and Action Management Process The high level process outlined in this procedure is illustrated in 3 and described in the following sections.
Figure 3 High level case and action management process

Case and Action Management Procedure
Content ID: AU_00010899 Revision: 5
This is an uncontrolled copy if photocopied or printed from the Intranet. Copyright © 2010, Fulton Hogan Ltd. All rights reserved.
Revised:14-10-2013 Page 6 of 15
6. Creating a Case 6.1. General
Details of a Case should be entered directly into CAMs. When this is not possible or practical it may be necessary to initially capture the details on a paper form such as the CAMs Report Form.
Every Case must be recorded in CAMs. If a paper form is completed, a copy needs to be added as an attachment to the Case or otherwise filed and cross-referenced for record purposes.
A paper form does not need to be completed if the details are entered directly into CAMs.
All Cases are to be reported or recorded in accordance within the timeframes given in the Incident Investigation, Reporting and Notification Flowchart.
6.2. Reporting a Case
The person who completes the CAMs Report Form or other approved paper form is known as the Reporter. The Reporter may be the person who actually identified or observed the Case, but if not, details of that person (the Originator) must be captured so that they can be contacted if further details are required.
There may be a number of versions of paper form used in different situations to prompt for the relevant information. As a minimum the paper form should capture all pertinent details, including but not limited to:
� location
� date
� time
� details of those involved
� other information to fit the context
Completed report forms must be passed onto an appropriate person to record the case in CAMs. It is the responsibility of offices, departments and projects throughout the business to establish a reliable process for capturing, recording and filing CAMs report forms.
The Case number generated by CAMs when the case is recorded must be written on all associated forms and documents.
6.3. Recording a Case
It is possible for all Fulton Hogan computer users to record a Case. A Case is recorded by entering the required details into CAMs either from a completed paper form or based directly on information from the Originator. The person who carries out this step is known as the Recorder, their details are captured automatically by CAMs.
All mandatory fields, indicated by a red bar, are required to save and therefore create a Case in CAMs. If for any reason the Recorder needs to leave a Case before it is complete, the Recorder may either cancel the entry or enter appropriate placeholder text such as “TBA” or “TBC” in the mandatory fields and complete the information at a later point.
6.3.1. Attributing a Case
There may be the situation when more than one organisational entity in Fulton Hogan has reason to be attributed responsibility for a case in CAMs. Typically this occurs when there
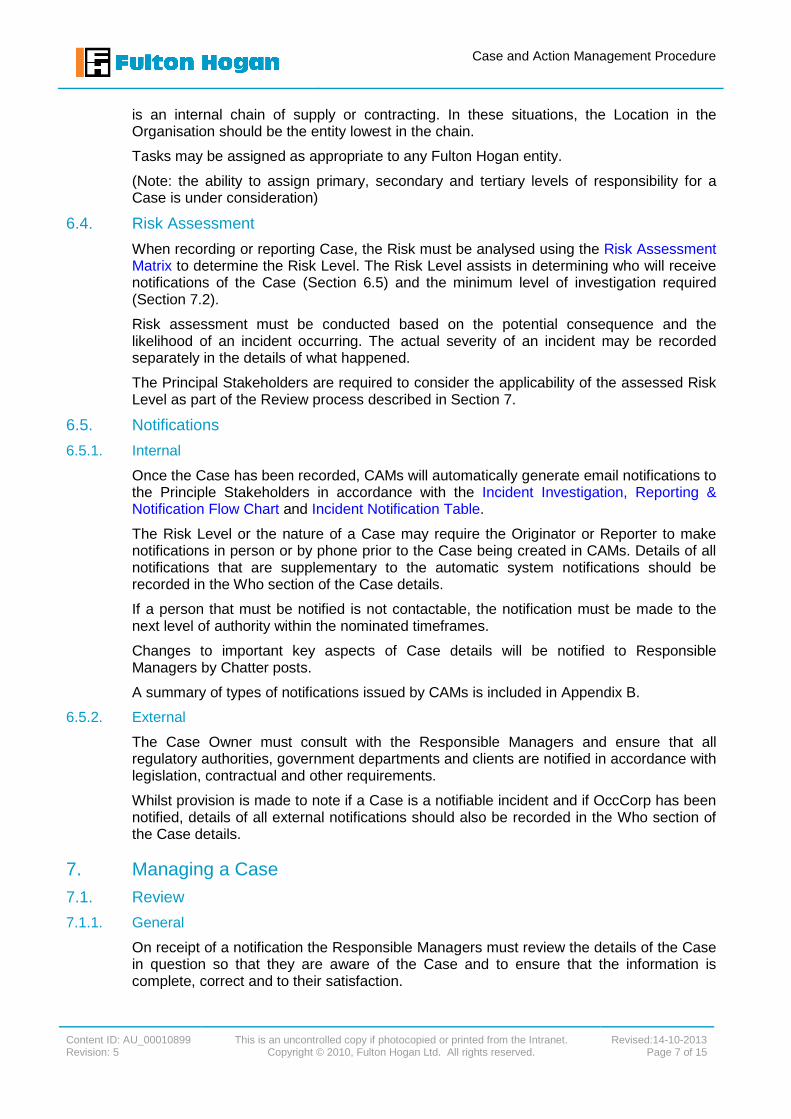
Case and Action Management Procedure
Content ID: AU_00010899 Revision: 5
This is an uncontrolled copy if photocopied or printed from the Intranet. Copyright © 2010, Fulton Hogan Ltd. All rights reserved.
Revised:14-10-2013 Page 7 of 15
is an internal chain of supply or contracting. In these situations, the Location in the Organisation should be the entity lowest in the chain.
Tasks may be assigned as appropriate to any Fulton Hogan entity.
(Note: the ability to assign primary, secondary and tertiary levels of responsibility for a Case is under consideration)
6.4. Risk Assessment
When recording or reporting Case, the Risk must be analysed using the Risk Assessment Matrix to determine the Risk Level. The Risk Level assists in determining who will receive notifications of the Case (Section 6.5) and the minimum level of investigation required (Section 7.2).
Risk assessment must be conducted based on the potential consequence and the likelihood of an incident occurring. The actual severity of an incident may be recorded separately in the details of what happened.
The Principal Stakeholders are required to consider the applicability of the assessed Risk Level as part of the Review process described in Section 7.
6.5. Notifications
6.5.1. Internal
Once the Case has been recorded, CAMs will automatically generate email notifications to the Principle Stakeholders in accordance with the Incident Investigation, Reporting & Notification Flow Chart and Incident Notification Table.
The Risk Level or the nature of a Case may require the Originator or Reporter to make notifications in person or by phone prior to the Case being created in CAMs. Details of all notifications that are supplementary to the automatic system notifications should be recorded in the Who section of the Case details.
If a person that must be notified is not contactable, the notification must be made to the next level of authority within the nominated timeframes.
Changes to important key aspects of Case details will be notified to Responsible Managers by Chatter posts.
A summary of types of notifications issued by CAMs is included in Appendix B.
6.5.2. External
The Case Owner must consult with the Responsible Managers and ensure that all regulatory authorities, government departments and clients are notified in accordance with legislation, contractual and other requirements.
Whilst provision is made to note if a Case is a notifiable incident and if OccCorp has been notified, details of all external notifications should also be recorded in the Who section of the Case details.
7. Managing a Case 7.1. Review
7.1.1. General
On receipt of a notification the Responsible Managers must review the details of the Case in question so that they are aware of the Case and to ensure that the information is complete, correct and to their satisfaction.

Case and Action Management Procedure
Content ID: AU_00010899 Revision: 5
This is an uncontrolled copy if photocopied or printed from the Intranet. Copyright © 2010, Fulton Hogan Ltd. All rights reserved.
Revised:14-10-2013 Page 8 of 15
A full record of any changes made to a Case is visible under the CAMs Case History, and the Responsible Managers will receive Chatter posts when key details of a Case are updated (refer to Appendix B).
7.1.2. Record Only Cases
A Case that has been assessed as having a low Risk Level and that requires no further investigation or action may be marked as ‘For Record Only. This will close the Case.
7.1.3. Confidential Information
The Case Owner should ensure that no information that could be considered confidential is included in the details of the Case or attached to the Case. For Cases of this nature, the Case must be marked as “Confidential” and a file of the confidential information is to be managed outside of CAMs. Notes on the way the confidential information is being handled should be included for reference.
For advice and guidance on this aspect consult the General Manager and/or National Safety/Environment/Quality Manager or refer to the Fulton Hogan Legal Procedure for more information.
7.1.4. Changing the Risk Level
If a Responsible Manager considers that the Risk Level needs to be changed, the Responsible Manager will discuss this with the Case Owner who will amend the record as agreed. Changing the risk level may generate another round of notifications.
7.1.5. Setting the Investigation Level
The Case Owner, in consultation with the other Responsible Managers will determine what type of investigation is required. The minimum Investigation Level is set to the Risk Level by default, however the Responsible Managers should consider whether that is adequate for the Case in question, and raise the Investigation Level if they consider this necessary.
7.1.6. Changing the Principle Stakeholders
If the Case Owner determines that additional managers not listed as a Principal Stakeholder should be made aware of the Case, they may add that person as a new stakeholder with the role of Responsible Manager.
The Case Owner may assign one or more Delegated Owners to assist with the administration of a Case. The Recorder is automatically created as a Delegated Owner however additional Delegated Owners may be created as new stakeholders.
7.2. Investigation
7.2.1. General
The extent of an investigation into root causes varies due to the likelihood of the Case and the severity of its potential consequence.
The Incident Investigation, Reporting & Notification Flow Chart outlines the investigation process to be followed when an incident occurs. Employees should be familiar with this chart and it should be readily accessible.
When an investigation is completed the Case Owner or their delegate will:
� attach the completed investigation report to CAMs (medium and high Investigation Level only)
� record the root cause and contributing factors in accordance with the findings of the investigation

Case and Action Management Procedure
Content ID: AU_00010899 Revision: 5
This is an uncontrolled copy if photocopied or printed from the Intranet. Copyright © 2010, Fulton Hogan Ltd. All rights reserved.
Revised:14-10-2013 Page 9 of 15
� define actions and assign Tasks arising from the investigation
7.2.2. Low Level Investigation
Low level investigations require no more than simple logical analysis into why the Case has happened using root cause analysis. An investigation report does not need to be completed however the 5 Whys Worksheet may be used to assist in the process as required.
7.2.3. Medium Level Investigation
Medium level investigations require a more structured approach than low level investigations and must consider each of the possible root cause categories as a minimum. The Investigation Summary Report may be used to record this process.
The following steps should be used a guide for a medium level investigation.
� Discuss the Case with a cross section of people e.g. operators, management, client.
� Consider the possible contributing factors for each Root Cause, the Cause and Effect Worksheet can be used to help guide this process, try to get as many as possible.
� Prioritise and eliminate the possible contributing factors to get one or two of the most important for each Root Cause.
� For each remaining contributing factor, conduct a root cause analysis as described for a low level investigation.
Record the results of the investigation in CAMs and attach the completed worksheet or investigation report.
7.2.4. High Level Investigation (Tripod)
A Tripod investigation may be conducted for any level incident at the discretion of Zone Safety/Quality/Environment Managers, General Manager, National Safety/Environment/Quality Manager, General Manager - Corporate Services, COO (as applicable).
The Investigation team shall consist of, one person trained in Tripod facilitation as a minimum, and other team members as determined by the General Manager, National Safety/Environment/Quality Manager, COO (as applicable).
The person leading the investigation will give the Project/Department Manager a comprehensive written report using the Tripod Investigation template within the timeframe required by the person requesting the Tripod.
The Project/Department Manager and/or the person requesting the Tripod shall be assigned as the Case Owner and will therefore be responsible for ensuring that corrective actions are implemented.
7.2.5. Root Cause and Contributing Factors
Investigation outcomes must be summarised in CAMs by recording the Root Cause and Contributing Factors.
A cause can be considered a Root Cause if:
� it stands out as a major cause of the Case
� continuing to ask why is not meaningful
� it can have an action assigned to it
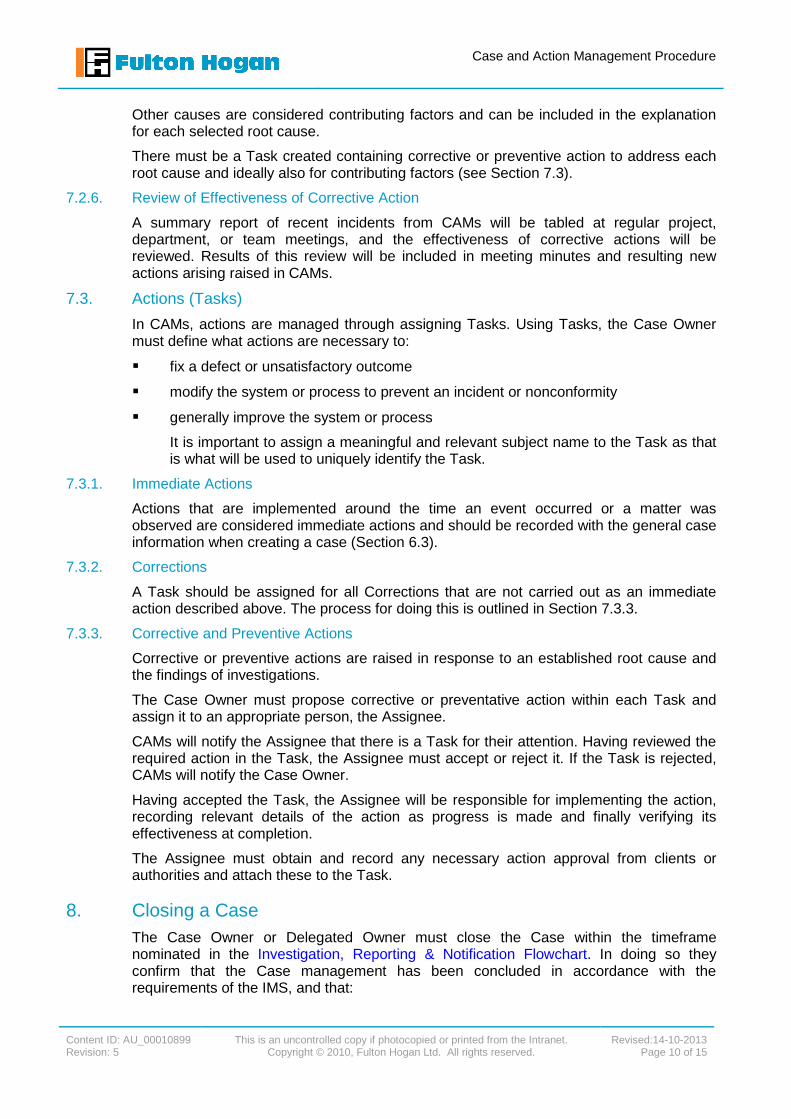
Case and Action Management Procedure
Content ID: AU_00010899 Revision: 5
This is an uncontrolled copy if photocopied or printed from the Intranet. Copyright © 2010, Fulton Hogan Ltd. All rights reserved.
Revised:14-10-2013 Page 10 of 15
Other causes are considered contributing factors and can be included in the explanation for each selected root cause.
There must be a Task created containing corrective or preventive action to address each root cause and ideally also for contributing factors (see Section 7.3).
7.2.6. Review of Effectiveness of Corrective Action
A summary report of recent incidents from CAMs will be tabled at regular project, department, or team meetings, and the effectiveness of corrective actions will be reviewed. Results of this review will be included in meeting minutes and resulting new actions arising raised in CAMs.
7.3. Actions (Tasks)
In CAMs, actions are managed through assigning Tasks. Using Tasks, the Case Owner must define what actions are necessary to:
� fix a defect or unsatisfactory outcome
� modify the system or process to prevent an incident or nonconformity
� generally improve the system or process
It is important to assign a meaningful and relevant subject name to the Task as that is what will be used to uniquely identify the Task.
7.3.1. Immediate Actions
Actions that are implemented around the time an event occurred or a matter was observed are considered immediate actions and should be recorded with the general case information when creating a case (Section 6.3).
7.3.2. Corrections
A Task should be assigned for all Corrections that are not carried out as an immediate action described above. The process for doing this is outlined in Section 7.3.3.
7.3.3. Corrective and Preventive Actions
Corrective or preventive actions are raised in response to an established root cause and the findings of investigations.
The Case Owner must propose corrective or preventative action within each Task and assign it to an appropriate person, the Assignee.
CAMs will notify the Assignee that there is a Task for their attention. Having reviewed the required action in the Task, the Assignee must accept or reject it. If the Task is rejected, CAMs will notify the Case Owner.
Having accepted the Task, the Assignee will be responsible for implementing the action, recording relevant details of the action as progress is made and finally verifying its effectiveness at completion.
The Assignee must obtain and record any necessary action approval from clients or authorities and attach these to the Task.
8. Closing a Case The Case Owner or Delegated Owner must close the Case within the timeframe nominated in the Investigation, Reporting & Notification Flowchart. In doing so they confirm that the Case management has been concluded in accordance with the requirements of the IMS, and that:
Case and Action Management Procedure
Content ID: AU_00010899 Revision: 5
This is an uncontrolled copy if photocopied or printed from the Intranet. Copyright © 2010, Fulton Hogan Ltd. All rights reserved.
Revised:14-10-2013 Page 11 of 15
� All relevant details have been captured
� The case was assigned a suitable level of risk and investigation
� All the required persons have been made aware of the case
� All actions are complete and have been effective at addressing the cause(s) of the case
� All attachments are included as required
� The relevant Responsible Managers have provided their approval to close the case
9. Definitions � Corrective Action: Corrective Action is one taken to eliminate the cause of a Case.
� Preventive Action: Preventive Action is one taken to eliminate that which has the potential to cause a nonconformity or incident.
� Assignee: An Assignee is the person assigned responsibility for a Task in association with a Case.
� Case: A Case is a reported event or observation. A Case may refer to:
� something that happened
� an observation
� a comment, suggestion or idea
� a query or problem.
� Case Owner: The Case Owner is the person designated as responsible for managing a Case through to its conclusion.
� Category: The Category, in combination with the Type and Subtype, defines the nature of the Case.
Categorising a Case enables Fulton Hogan to look at Subject areas and consider such detail as risk level, frequency and injuries associated with that area. To make this information as accurate and useful as possible “Other” should only be selected as a last option.
� Correction: Also referred to as a Disposition or Rectification, a Correction is an action to fix a nonconforming product, service or system. This may involve repair, upgrade, replacement, or modification, and may require the approval from a client or authority before the correction can be implemented.
� Recorder: The Recorder is person who inputs the details of the Case into CAMs.
� Reporter: The Reporter is the person, if any, that fills in a paper form such as the CAMs Report Form and submits this to be recorded in CAMs.
� Responsible Managers: Responsible Managers are Principle Stakeholders and are those managers that are defined as having responsibility for a particular Case by virtue of their role, location and areas of responsibility.
� Risk Assessment: The identification, analysis and evaluation of the potential for something to go wrong.
� Risk Level: The Risk Level represents likelihood and potential consequence of an event. It is calculated in accordance with the Risk Assessment Matrix. The Risk Level determines the level of escalation of the Case to the Responsible Managers

Case and Action Management Procedure
Content ID: AU_00010899 Revision: 5
This is an uncontrolled copy if photocopied or printed from the Intranet. Copyright © 2010, Fulton Hogan Ltd. All rights reserved.
Revised:14-10-2013 Page 12 of 15
and is also an indicator for the Investigation Level – the type of investigation required.
� Root Cause: The root cause is the point at which change needs to be made to improve a process or situation through corrective or preventive action. It is the starting point for a chain of effects that results in an incident, nonconformity or undesirable outcome.
� Source: How a Case was identified.
� Incident: An incident is any unplanned event that downgrades the business operation. The definition includes, but is not limited to, those incidents defined as near misses, accidents, serious incidents and notifiable incidents.
� CAMs: CAMs is the Case and Action Management system, Fulton Hogan’s electronic system for recording and managing incidents, nonconformities and other opportunities for improvement.
� Location in the Organisation: This is the location to which a Case will be attributed to. It is important for determining who needs to be notified, who the Principle Stakeholders will be and therefore where the Case will be managed from.
The selections available are linked to Fulton Hogan’s financial management system, JDE, to promote uniformity and eliminate the need to maintain separate lists.
� Notifiable incident: A notifiable incident is an incident that is required by legislation to be notified to legislation regulatory authority.
� Principal Stakeholders: Principal Stakeholders include the Responsible Managers, Case Owner and Delegated Owners. Those managers that are defined as having responsibility for a particular case by virtue of their role, location and areas of responsibility
� Source: The source of the case is where it was identified. Identifying the Source of a Case allows for greater reporting capabilities. When used with additional detail or a reference, it is possible to group many Cases based on a particular Source e.g. Source “Audit”; reference “Safe Acts” or Source “Inspection” reference “Weekly Site.”
� Type and Subtype: The Type and Subtype of the case dictate the information that must be captured and how the event will be managed. In combination with the Category, they define the nature of the case. Figure 2Error! Reference source not found. shows types and subtypes of Case that are identified in the case and action management process.
� Subject: Selecting a Subject for a Case ensures the people within Fulton Hogan who provide advice and support in this area are notified. It also allows for the further definition of the Case through categorisation (�).
Cases involving vandalism or theft should be considered as “Other”.
� Tripod: A Multiple Causation investigation analysis tool used to determine the root cause of High risk level incidents and other incidents as determined by the General Manager, National Safety / Environment / Quality Manager, COO’s (as applicable) or CFO.

Case and Action Management Procedure
Content ID: AU_00010899 Revision: 5
This is an uncontrolled copy if photocopied or printed from the Intranet. Copyright © 2010, Fulton Hogan Ltd. All rights reserved.
Revised:14-10-2013 Page 13 of 15
10. Related Documents 10.1. IMS Documents
5 Whys Worksheet
CAMs Report Form
Cause and Effect Worksheet
Incident Investigation, Reporting & Notification Flow Chart
Incident Notification Table
Investigation Summary Report
Nonconformity, Corrective and Preventative Action Procedure
Risk Assessment for CAMs cases
Tripod Investigation Template
10.2. Standards and Codes of Practice
AS/NZS 4801 Health and safety management systems – General guidelines
AS/NZS ISO 9001
AS/NZS ISO 14001 Environmental management systems - Requirements with guidance for use
11. Revision History This document shall be reviewed on an annual basis or earlier where indicated
Date Author Brief Description of Change 06/09/2013 Dru Oxley Updated Risk Assessment Matrix hyperlink 17/12/2012 Sara Hansen Added section 7.2.6. 01/08/2012 S Dowsett Added additional content to the Purpose outlining why
the data is collected. Also changed references to CEO/COO. Modified formatting to Definitions section to make them bullet points rather than Level 2 headings.
12/04/12 J Ziccardi Minor format change. 6.4 – updated hyperlink to Risk Assessment for CAMs Cases
20/02/2012 K McElhone New document to support release of CAMs

Case and Action Management Procedure
Content ID: AU_00010899 Revision: 5
This is an uncontrolled copy if photocopied or printed from the Intranet. Copyright © 2010, Fulton Hogan Ltd. All rights reserved.
Revised:14-10-2013 Page 14 of 15
Appendix A – Case and Action Management system (CAMs) Flowchart

Case and Action Management Procedure
Content ID: AU_00010899 Revision: 5
This is an uncontrolled copy if photocopied or printed from the Intranet. Copyright © 2010, Fulton Hogan Ltd. All rights reserved.
Revised:14-10-2013 Page 15 of 15
Appendix B – CAMs Notifications Summary
Event Email Notification Chatter Swarm Post Who
Assignment of Case Owner Yes N/A Case Owner
Assignment of Delegated
Owner Yes N/A Delegated Owner
Responsible Manager
Notification N/A Yes Responsible Managers
Field Change - Risk Level N/A Yes All followers
Field Change - Investigation
Level N/A Yes All followers
Field Change - Sub-Type N/A Yes All followers
Case Closure Yes (1) Yes (2)
(1) Case Owner &
Delegated Owners
(2) All followers
Action (Activity) Owner
Assignment Yes N/A Assignee
Action Rejection by Assignee Yes N/A Case Owner
Delegated Owners
Open Action (Activity) Due Date
Reminder (7 days) N/A
Use Reminder set by Case
Owner when assigning
Activity (std function)
Assignee
Overdue Action (Activity)
Reminder (5 days late) N/A
Use standard pop-up
reminder window Assignee
Action (Activity) set to Verified
& Complete N/A Yes
Case Owner
Delegated Owners