Environmental Efficiency of Hitachi Products Based … Efficiency of Hitachi Products Based on...
20
Environmental Efficiency of Hitachi Products Based on Factor X Toward the Creation of a Recycle-oriented Society We help customers improve lifestyle value through our eco-friendly products. The key to our success is the Factor X. Hitachi Group July 2009
Transcript of Environmental Efficiency of Hitachi Products Based … Efficiency of Hitachi Products Based on...

Environmental Efficiencyof Hitachi ProductsBased on Factor XToward the Creation of a Recycle-oriented Society
We help customers improve lifestyle valuethrough our eco-friendly products.The key to our success is the Factor X.
Hitachi GroupJuly 2009
Improved quality of life
Reduced environmental impactFactor X =
UP
DOWN
21
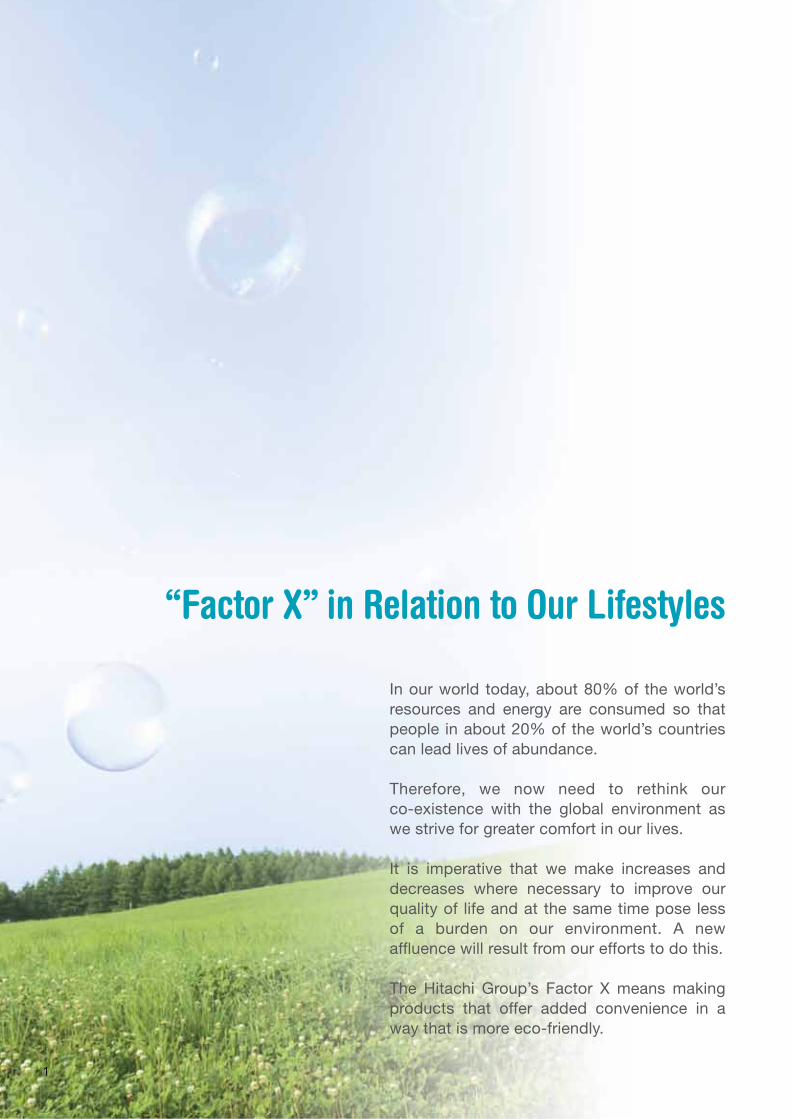
“Factor X” in Relation to Our Lifestyles
In our world today, about 80% of the world’s resources and energy are consumed so that people in about 20% of the world’s countries can lead lives of abundance.
Therefore, we now need to rethink our co-existence with the global environment as we strive for greater comfort in our lives.
It is imperative that we make increases and decreases where necessary to improve our quality of life and at the same time pose less of a burden on our environment. A new af�uence will result from our efforts to do this.
The Hitachi Group’s Factor X means making products that offer added convenience in a way that is more eco-friendly.
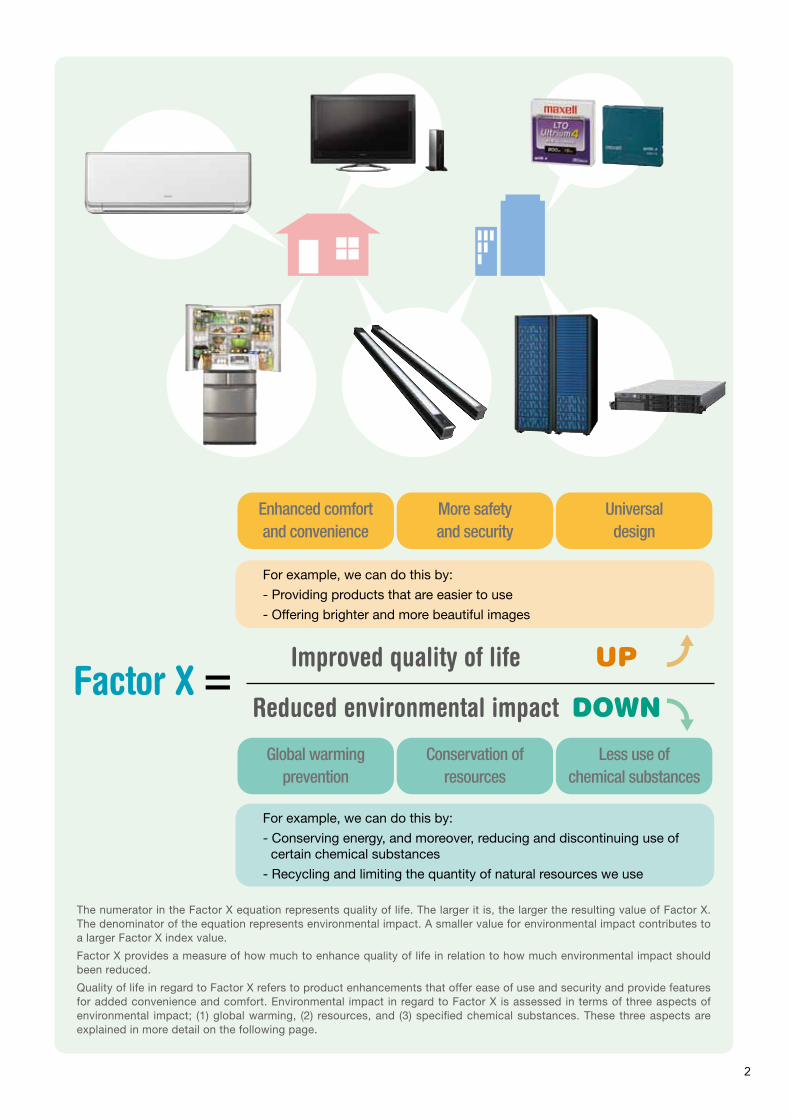
The numerator in the Factor X equation represents quality of life. The larger it is, the larger the resulting value of Factor X. The denominator of the equation represents environmental impact. A smaller value for environmental impact contributes to a larger Factor X index value.
Factor X provides a measure of how much to enhance quality of life in relation to how much environmental impact should been reduced.
Quality of life in regard to Factor X refers to product enhancements that offer ease of use and security and provide features for added convenience and comfort. Environmental impact in regard to Factor X is assessed in terms of three aspects of environmental impact; (1) global warming, (2) resources, and (3) speci�ed chemical substances. These three aspects are explained in more detail on the following page.
Enhanced comfortand convenience
More safetyand security
Universaldesign
Global warmingprevention
Conservation ofresources
Less use ofchemical substances
For example, we can do this by:
- Providing products that are easier to use
- Offering brighter and more beautiful images
For example, we can do this by:
- Conserving energy, and moreover, reducing and discontinuing use of certain chemical substances
- Recycling and limiting the quantity of natural resources we use
Improved quality of life
Reduced environmental impactFactor X =
UP
DOWN
21
“Factor X” in Relation to Our Lifestyles
In our world today, about 80% of the world’s resources and energy are consumed so that people in about 20% of the world’s countries can lead lives of abundance.
Therefore, we now need to rethink our co-existence with the global environment as we strive for greater comfort in our lives.
It is imperative that we make increases and decreases where necessary to improve our quality of life and at the same time pose less of a burden on our environment. A new af�uence will result from our efforts to do this.
The Hitachi Group’s Factor X means making products that offer added convenience in a way that is more eco-friendly.
The numerator in the Factor X equation represents quality of life. The larger it is, the larger the resulting value of Factor X. The denominator of the equation represents environmental impact. A smaller value for environmental impact contributes to a larger Factor X index value.
Factor X provides a measure of how much to enhance quality of life in relation to how much environmental impact should been reduced.
Quality of life in regard to Factor X refers to product enhancements that offer ease of use and security and provide features for added convenience and comfort. Environmental impact in regard to Factor X is assessed in terms of three aspects of environmental impact; (1) global warming, (2) resources, and (3) speci�ed chemical substances. These three aspects are explained in more detail on the following page.
Enhanced comfortand convenience
More safetyand security
Universaldesign
Global warmingprevention
Conservation ofresources
Less use ofchemical substances
For example, we can do this by:
- Providing products that are easier to use
- Offering brighter and more beautiful images
For example, we can do this by:
- Conserving energy, and moreover, reducing and discontinuing use of certain chemical substances
- Recycling and limiting the quantity of natural resources we use
Environmental impact is assessedfrom three aspects
43
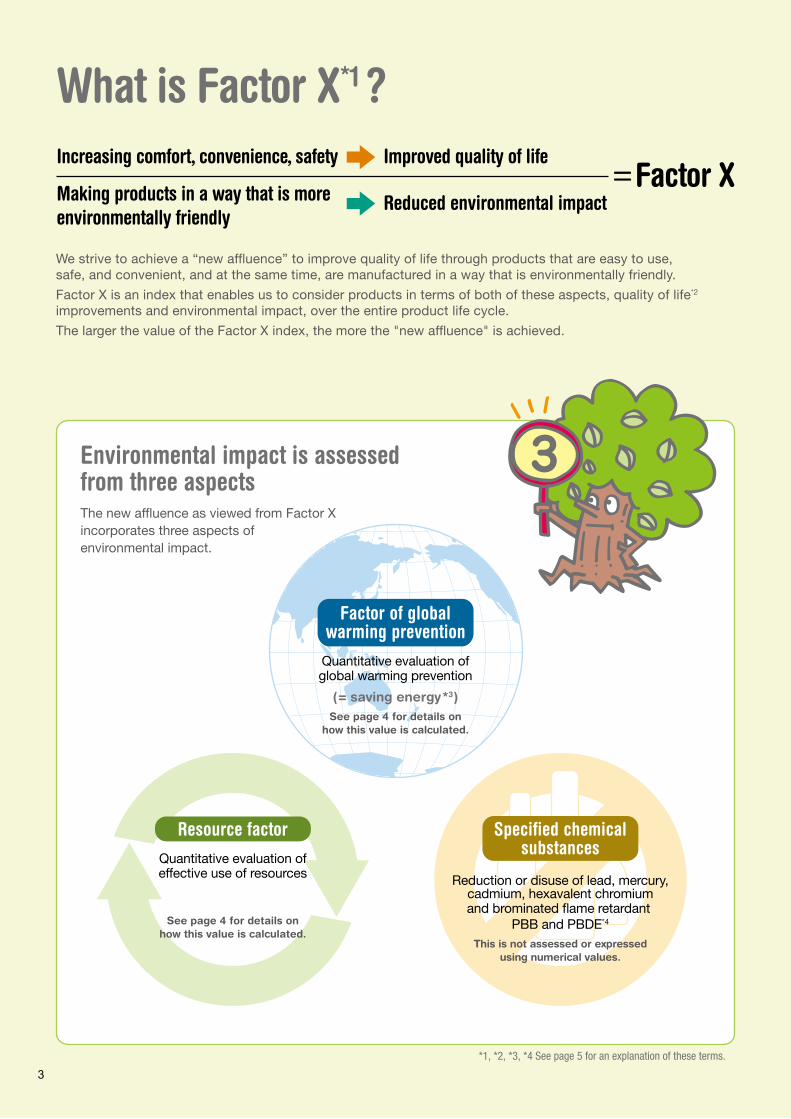
Increasing comfort, convenience, safety
Making products in a way that is moreenvironmentally friendly
Improved quality of life
Reduced environmental impactFactor X
We strive to achieve a “new af�uence” to improve quality of life through products that are easy to use,safe, and convenient, and at the same time, are manufactured in a way that is environmentally friendly.
Factor X is an index that enables us to consider products in terms of both of these aspects, quality of life*2
improvements and environmental impact, over the entire product life cycle.
The larger the value of the Factor X index, the more the "new af�uence" is achieved.
The new af�uence as viewed from Factor Xincorporates three aspects ofenvironmental impact.
*1, *2, *3, *4 See page 5 for an explanation of these terms.
How are the two environmental factors calculated?
Factor of global warming preventionFirst, calculate the ef�ciency of global warming prevention in the following formula.
Next, compare this with the existing base product.
Efficiency ofglobal warming
prevention
- Design for longer operating life and ease of maintenance and upgrade- Technology development for function or performance improvement
Product life span Product function
Amount of greenhouse gas emission through the life cycle of product- Products designed to save energy during operation- Products designed to require fewer manufacturing processes and less energy- Products designed to enable mass distribution (product downsizing)- Product parts and materials selected that emit less gas which leads to global warming over the entire product life cycle
Resourceefficiency
Factor of globalwarming prevention
The greater the numerical value of the factor of global warming prevention, the greater the Factor X value which helps achieve a new affluence.
Next, compare this value with the existing base products.
Resource factor
Resource efficiency
for product being evaluatedResource efficiency
for reference productThe greater the numeric value of the resource factor, the greater the Factor X value which helps achieve a new affluence.
Amount of resources used - amount of resources reused and recycled Amount of resources used - amount of resources that are reusable and recyclable
- Use of reused and recycled parts and materials
- Products designed for easy disassembly- Products designed for easy material’s separation - Use of parts and materials that can be reused or recycled- Reduction of material types
*5, *6 See page 5 for an explanation of these terms.
What is Factor X*1 ?
Factor of globalwarming prevention
Quantitative evaluation ofglobal warming prevention
(= saving energy*3)See page 4 for details on
how this value is calculated.
Specified chemicalsubstances
Reduction or disuse of lead, mercury,cadmium, hexavalent chromiumand brominated �ame retardant
PBB and PBDE*4
This is not assessed or expressedusing numerical values.
Resource factorQuantitative evaluation ofeffective use of resources
See page 4 for details onhow this value is calculated.
Efficiency of global warming prevention for product being evaluated
Efficiency of global warming prevention for reference product
- Compact and lightweight- Reduction of materials
for production
=
(Amount of new resources to be used + Amount of resources to be disposed)
- Design for longer operating life and ease of maintenance and upgrade- Technology development for function or performance improvement.
X
X
=
=
= =
=
=
Resource factorFirst, calculate the resource ef�ciency of the new product.
Product life span Product function
Amount of resources usedthroughout the product’s life cycle *6
Each resourcevalue coefficient *5 XΣ ( )

Environmental impact is assessedfrom three aspects
43
Increasing comfort, convenience, safety
Making products in a way that is moreenvironmentally friendly
Improved quality of life
Reduced environmental impactFactor X
We strive to achieve a “new af�uence” to improve quality of life through products that are easy to use,safe, and convenient, and at the same time, are manufactured in a way that is environmentally friendly.
Factor X is an index that enables us to consider products in terms of both of these aspects, quality of life*2
improvements and environmental impact, over the entire product life cycle.
The larger the value of the Factor X index, the more the "new af�uence" is achieved.
The new af�uence as viewed from Factor Xincorporates three aspects ofenvironmental impact.
*1, *2, *3, *4 See page 5 for an explanation of these terms.
How are the two environmental factors calculated?
Factor of global warming preventionFirst, calculate the ef�ciency of global warming prevention in the following formula.
Next, compare this with the existing base product.
Efficiency ofglobal warming
prevention
- Design for longer operating life and ease of maintenance and upgrade- Technology development for function or performance improvement
Product life span Product function
Amount of greenhouse gas emission through the life cycle of product- Products designed to save energy during operation- Products designed to require fewer manufacturing processes and less energy- Products designed to enable mass distribution (product downsizing)- Product parts and materials selected that emit less gas which leads to global warming over the entire product life cycle
Resourceefficiency
Factor of globalwarming prevention
The greater the numerical value of the factor of global warming prevention, the greater the Factor X value which helps achieve a new affluence.
Next, compare this value with the existing base products.
Resource factor
Resource efficiency
for product being evaluatedResource efficiency
for reference productThe greater the numeric value of the resource factor, the greater the Factor X value which helps achieve a new affluence.
Amount of resources used - amount of resources reused and recycled Amount of resources used - amount of resources that are reusable and recyclable
- Use of reused and recycled parts and materials
- Products designed for easy disassembly- Products designed for easy material’s separation - Use of parts and materials that can be reused or recycled- Reduction of material types
*5, *6 See page 5 for an explanation of these terms.
What is Factor X*1 ?
Factor of globalwarming prevention
Quantitative evaluation ofglobal warming prevention
(= saving energy*3)See page 4 for details on
how this value is calculated.
Specified chemicalsubstances
Reduction or disuse of lead, mercury,cadmium, hexavalent chromiumand brominated �ame retardant
PBB and PBDE*4
This is not assessed or expressedusing numerical values.
Resource factorQuantitative evaluation ofeffective use of resources
See page 4 for details onhow this value is calculated.
Efficiency of global warming prevention for product being evaluated
Efficiency of global warming prevention for reference product
- Compact and lightweight- Reduction of materials
for production
=
(Amount of new resources to be used + Amount of resources to be disposed)
- Design for longer operating life and ease of maintenance and upgrade- Technology development for function or performance improvement.
X
X
=
=
= =
=
=
Resource factorFirst, calculate the resource ef�ciency of the new product.
Product life span Product function
Amount of resources usedthroughout the product’s life cycle *6
Each resourcevalue coefficient *5 XΣ ( )

An explanation of terminology related to Factor X
5
Amount of resources in life cycle of product = Amount of new resources to be used + Amount of resource to be disposed
*1: Factor XIn 1991, Dr. Friedrich Schmidt-Bleek of the Wuppertal Institute in Germany advocated that the idea that "In order to realize a sustainable economic society, over the next 50 years it will be necessary to increase the resource productivity rate (material input per unit service) of developed counties by a factor of 10," otherwise know as "Factor 10."1) In the future, this idea needs to be introduced under the argument for "future directionality towards industrial activity that will build a sustainable economic society" as indicated in Japan's 1999 Environmental White Paper2), and must be proactively adopted by corporations. Furthermore, at the Conference on the Creation of "Wa-no-kuni" "An Eco-society Through Partnership" in the 21st Century convened by the Prime Minister Office, the opinion was put forward that "rapid improvement of environmental efficiency is necessary, and should be improved by at least a factor of ten, that is to say, we should aim for the achievement of Factor 10."3) Source: 1) Factor 10 (for realizing a revolution in eco-efficiency); written by F. Schmidt-Bleek
2) Environmental White Paper (an outline); published by the Ministry for the Environment (1999 )
3) Report on the Conference on the Creation of "Wa-no-kuni" "An Eco-society Through Partnership" in the 21st Century ( July 2001)
*4: Bromine flame retardant (PBB, PBDE)
PBB stands for polybrominated biphenyls and PBDE stands for polybromierte diphenylether. Both are additives for making the polymeric materials (plastics, elastic gums, fibers, paper and wood) fire-resistant.
*6: Amount of resources in life cycle of product
*5: Resource value coefficientWeighted coefficient determined considering the scarcity and value of utilization.Initially, this value is set to 1.
*3: Global warming prevention = saving energyCO2, steam, dinitrous monoxide (N2O), ozone and chlorofluorocarbon allow insolation energy from the sun to fully pass, but prevent the discharge of ground heat into cosmic space. As a result, global temperature increases. The gas heated in this way is called greenhouse gas.
Most greenhouse gas is CO2. CO2 is discharged in the air when coal or oil is burnt. When electricity is consumed in house, coal or oil is burnt for power generation, resulting in a large volume of CO2. In addition, oil fuel is consumed in the production and distribution stages of the product life cycle, resulting in a large volume of CO2.
Namely, if energy (electricity) consumption is reduced in each stage of product life cycle, the amount of CO2 generation will also be reduced, so that global warming can be prevented.
*2: Life cycleEach product process (material procurement, product manufacture and product usage and disposition) is likened to the period of a human life. It also covers reusing the parts or recycling the materials.
(1) Input resource (product mass)
Amount of new resources to be used =amount of input resources - amount of resources to be reused and recycled
Amount of input resources = amount of new resources to be used + amount of resources to be reused and recycled
(2) Output resource (product mass)
Amount of resources to be disposed =amount of input resources - amount of resources to be reused and recycled
Amount of input resources = amount of resources to be disposed + amount of resources to e reused and recycled
Amount of new resourcesto be used (example: 70)
Amount of reused and recycledresources (example: 30)
Amount of resourcesto be disposed (example: 80)
Amount of resources to bereused and recycled (example: 20)
(100)
(100)
(3) Amount of resources in life cycle =
Amount of new resources to be used (example: 70) + Amount of resources to be disposed (example: 80) = (example: 150)

6
■Description of Products
■Development Concept
■Outline of Products for Comparison
*1 This comparison is based on measured maximum power consumption when two processors and six HDDs are installed.
*2 Design values set based on the life span of hardware components
*3 For operation 365 days a year with an operating time of 16 hours a day and idling time of 8 hours a day
*4 Composite theoretical performance (unit: MTOPS) used by the Energy Saving Act for computers
*5 Volume ratio of the evaluated product with the volume of a reference product set to 100
■Evaluation Results for the Factor of Global Warming Prevention ■Evaluation Results for the Resource Factor
Model name : HA8000/170A2
■ Calculation results for the amount of greenhouse gas emission (ratio to the base product) ■ Calculation results for the amount of resources to be used (ratio to the base product)Reason for reduction:The use of low-power electronic parts and cooling system improvements cancel out the increased power consumption resulting from better performance and more functions.
Reason for reduction:Downsized components and high-density mounting have reduced resource use.
■ Base ■ Evaluation
■Calculation Results ■ 3,113 ■ 11,469Amount of greenhouse gas emission per unit function in product life span (kg/unit function)
■Efficiency of Global Warming Prevention ■ 86.1 ■ 1,320
Factor of Global Warming Prevention 15
■ Base ■ Evaluation
■Calculation Results ■ 30.5 ■ 15.9Amount of resources per unit function in product life span (kg/unit function)
■Resource Efficiency ■ 8,790 ■ 951,000
Resource Factor 108
■Base ■Evaluation
ProductItem ■ Base ■ Evaluation
Year of manufacture 2000 2008
Model name HA8000/170A2 HA8000/RS220AH
Product life span*2 (specified usage period (year)) 5
Product mass (kg) 35.3 20.1
Annual power consumption*3 (kWh/year) 1,194 5,230
Product function
Processing performance (MTOPS)*4 2,333 91,000
Space saving (%)*5 100 69
Manufactured in 2000 Manufactured in 2008Model name : HA8000/RS220AH
Effects of recycling
Make (manufacturing materials)
Carry (transportation)
Use (utilization)
Return (recycling)
(101%)
(369.4%)
5.8
3.0
3.0
81.1
0.1
4.46.6
0.1
(100%)
(-1%) (-1%)
(368.4%)
355.3
Make (manufacturing)
11.0
Impr
ovem
ent b
y ne
w m
ater
ials
Actu
al e
nviro
nmen
tal lo
ad
Actu
al e
nviro
nmen
tal lo
ad
Iron
Plastics
Aluminum
Others
72
16
40
25
(100%)
(68%)Copper
5
1
6
2
1
0
Hitachi Group
Environmental Efficiency Calculation Result Sheet (Factor X) HA8000 Series PC Server
The HA8000 series of PC servers, with its large selection of models, including tower models and rack-mount models, flexibly responds to a wide range of customer business styles. The servers in this series incorporate broad func-tionality across areas such as energy conservation, silent operation, perfor-mance, reliability, and customer support.
• Enhanced performance and functions by installing the latest in processor• Optimized air flow in the server chassis and optimally controlled rotational speed of the cooling fan according to the fan’s internal temperature, resulting in power savings and silent operation• Lineup of power-saving models, which are expected to reduce power consumption by up to about 20%*1

7
■Description of Products
■Development Concept
■Outline of Products for Comparison
*1 Hitachi Adaptable Modular Storage 500
*2 RoHS: Restriction of use of certain Hazardous Substances in electrical and electronic equipment
*3 The standard period of use is 5 years, but can be extended to up to 8 years with an overhaul that replaces consumables such as batteries and fans.
*4 Energy consumption efficiency is calculated by dividing the power consumed as measured with the method defined in the Energy Saving Act by the memory capacity defined in the Energy Saving Act (Ministry of Economy, Trade and Industry Announcement No. 51).
*5 Power consumption in a maximum configuration operating 24 hours a day, 365 days a year.
*6 This capacity is calculated for a RAID5 configuration. Capacity includes the management areas of the connected servers, workstations, and PCs, and the calculation assumes that one kilobyte equals 1,000 bytes.
■Evaluation Results for the Factor of Global Warming Prevention ■Evaluation Results for the Resource Factor
Model name : Thunder 9570V
■ Calculation results for the amount of greenhouse gas emission (ratio to the base product) ■ Calculation results for the amount of resources to be used (ratio to the base product)Reason for reduction:Power consumption per unit function has been reduced by using high-capacity HDDs, resulting in improved power efficiency and optimized load balancing.
Reason for reduction:Easier disassembly and a reduction in plastic materials have improved the re-cycling ratio.
■ Base ■ Evaluation
■Calculation Results ■ 100 ■ 84.7Amount of greenhouse gas emissions over the product life span (% for Base)
■Efficiency of Global Warming Prevention ■ 1,161 ■ 18,591
Factor of Global Warming Prevention 16
■ Base ■ Evaluation
■Calculation Results ■ 100 ■ 119.7Amount of resources over the product life span (% for Base)
■Resource Efficiency ■ 1,161 ■ 13,160
Resource Factor 11
■Base ■Evaluation
ProductItem ■ Base ■ Evaluation
Year of manufacture 2002 2008
Model name Thunder 9570V Hitachi Adaptable Modular Storage 2300
Product life span*3 (specified usage period (year)) 8
Product mass (kg) 43.8 55.1
Energy consumption efficiency*4 (W/GB) 0.44 0.054
Annual power consumption*5 (kWh/year) 7,709 6,482
Product function
Max. subsystem capacity (GB)*6 1,814 6,152
Max. host interface speed (Gbps) 2 4
Max. number of host interface ports 4 8
Manufactured in 2002 Manufactured in 2008Model name : Hitachi Adaptable Modular Storage 2300
(100.11%)
(84.93%)
97.95
0.01 0.02
(-0.11%) (-0.22%)
(84.71%)
82.37
(100%)1.04
1.07
0.04 1.43
1.07
0.04
Effects of recycling
Make (manufacturing materials)
Carry (transportation)
Use (utilization)
Return (recycling)
Make (manufacturing)
Impr
ovem
ent b
y ne
w m
ater
ials
Actu
al e
nviro
nmen
tal lo
ad
Actu
al e
nviro
nmen
tal lo
ad
23.8
6.89.7
34.1
25.6
34.1
15.4
3.8
34.9
27.2
(100%)
(115.4%)
Others
HDD
Plastics
Iron
Board
Hitachi Group
Environmental Efficiency Calculation Result Sheet (Factor X) Disk Array Subsystem
The disk array subsystem uses the autonomous subsystem load balancing function and online subsystem maintenance function. In addition, the Serial Attached SCSI (SAS) HDD and Serial Advanced Technology Attachment (SATA) HDD are housed on the same chas-sis. Because of the added convenience and efficient data usage environment provided by this latter feature, installing and operating the system is less burdensome for the customer.
By using high-capacity HDDs and reducing the power consumption by about 9% com-pared with our company’s model in 2005*1 the entire system, in a maximum configuration, has an energy consumption efficiency of 0.035, which meets the criteria for the year 2007 in the Energy Saving Act. Furthermore, the quantity of hazardous chemical substances has been reduced so that the disk array subsystem complies with the restriction of use of certain hazardous substances in electrical and electronic equipment (RoHS)*2 in Europe.

8
■Description of Products
■Development Concept
■Outline of Products for Comparison
■Evaluation Results for the Factor of Global Warming Prevention ■Evaluation Results for the Resource Factor
■ Calculation results for the amount of greenhouse gas emission (ratio to the base product) ■ Calculation results for the amount of resources to be used (ratio to the base product)Reason for reduction:The recycling ratio has been improved through better performance and a reduction in manufacturing costs.
Reason for reduction:The quantity of iron used has been reduced. Electrical cables and plastic materials are now recyclable.
(101%)
(66%)
82.3
0.05 0.04
(-1.3%) (-1.9%)
(64%)
47.3
(100%)13
6
0.05
13.4
5.2
0.05
Effects of recycling
Make (manufacturing materials)
Carry (transportation)
Use (utilization)
Return (recycling)
Make (manufacturing)
Impr
ovem
ent b
y ne
w m
ater
ials
Actu
al e
nviro
nmen
tal lo
ad
Actu
al e
nviro
nmen
tal lo
ad
73.9
16.9 8.5
58.0
16.4
(100%)
(88.7%)
3.4
2.4
3.4 3.4
2.4
Others
Stainless steel
Aluminum and its alloy
Steel
Copper and its alloy
Hitachi Group
Environmental Efficiency Calculation Result Sheet (Factor X) Defect Review SEM
The defect review SEM is a device that checks for pattern defects on semiconductor wafers or foreign substances on bare silicon wafers.It answers the needs of users who want to quickly and efficiently extract useful data for process and yield management from a huge amount of data on found defects.
• The basic concept is to put the defect review SEM in fully automatic inline use. The basic performance, including image quality, defect capture rate,throughput, and high-precision automatic defect sorting performance, has been improved.• The defect review SEM contributes dramatically to the improvement of yield on a device production line by instantaneously providing information directly related to yield improvement.
*1 Expected lifetime considering the reliable lifetime of components in the usage environment
*2 Value for standard-usage operation of 15 hours a day x 350 days
*3 Minimum size of the defect that the SEM can find
*4 Number of defects that the SEM can find in one hour
Model name : RS-3000
■Base ■Evaluation
ProductItem ■ Base ■ Evaluation
Year of manufacture 2002 2007
Model name RS-3000 RS-5500
Product life span*1 (specified usage period (year)) 10 7
Product mass (kg) 4,140 3,672
Volume (L) 20,214 19,852
Annual power consumption*2 (kWh/year) 58,800 48,300
Product function
Min. defect size (nm)*3 70 25
Resolution (nm) 4 2
Throughput (DPH)*4 600 1,500
Manufactured in 2002 Manufactured in 2007Model name : RS-5500
■ Base ■ Evaluation
■Calculation Results ■ 298,201 ■ 191,352Amount of greenhouse gas emission per unit function in product life span (kg/unit function)
■Efficiency of Global Warming Prevention ■ 7.19E-5 ■ 1.57E-3
Factor of Global Warming Prevention 22
■ Base ■ Evaluation
■Calculation Results ■ 3,240 ■ 2,497Amount of resources per unit function in product life span (kg/unit function)
■Resource Efficiency ■ 6.61E-3 ■ 1.21E-1
Resource Factor 18

9
Hitachi Group
Environmental Efficiency Calculation Result Sheet (Factor X) Programmable Controller
■Description of Products
■Development Concept
■Outline of Products for Comparison
*1 The product life span is assumed to be 7 years. Service parts such as consumable parts are replaced as needed.
■Evaluation Results for the Factor of Global Warming Prevention ■Evaluation Results for the Resource Factor
Model name : EH-CPU316
■ Calculation results for the amount of greenhouse gas emission (ratio to the base product) ■ Calculation results for the amount of resources to be used (ratio to the base product)Reason for reduction:Error indication with 7-segment LEDs reduces startup time.
Reason for reduction:The Ethernet port provided as standard results in downsizing of 60%.
■ Base ■ Evaluation
■Calculation Results ■ 50.1 ■ 43.8Amount of greenhouse gas emission per unit function in product life span (kg/unit function)
■Efficiency of Global Warming Prevention ■ 4.77E-5 ■ 9.38E-4
Factor of Global Warming Prevention 20
■ Base ■ Evaluation
■Calculation Results ■ 0.9 ■ 0.6Amount of resources per unit function in product life span (kg/unit function)
■Resource Efficiency ■ 0.00260 ■ 0.0676
Resource Factor 26
■Base ■Evaluation
ProductItem ■ Base ■ Evaluation
Year of manufacture 1999 2006
Model name EH-CPU316 EHV-CPU16
Product life span*1 (specified usage period (year)) 7
Product mass (kg) 0.33 0.2
Annual power consumption (kWh/year) 10.9 10.8
Product function
Installation space (mm2) 7,500 4,500
Processing speed/basic instruction (ns) 100 20
Number of control points (16 points) 256 528
Manufactured in 1999 Manufactured in 2006Model name : EHV-CPU16
(100.4%)
(87.8%)6.7
65.8
0.1
3.28.3
0.1
(-0.4%) (-0.4%)
(87.4%)
64.9
11.2 11.2
16.6
(100%)
Effects of recycling
Make (manufacturing materials)
Carry (transportation)
Use (utilization)
Return (recycling)
Make (manufacturing)
Impr
ovem
ent b
y ne
w m
ater
ials
Actu
al e
nviro
nmen
tal lo
ad
Actu
al e
nviro
nmen
tal lo
ad 54.6
43.0
34.6
25.4
(100%)
(60%)
1.8
0.5
Others
Iron and its alloy(included stainless steel)
Copper and its alloy
Plastics
0
0
Ethernet is also widespread in the factory automation. One of the pro-grammable controller’s many virtues is the contribution it makes to the energy conservation of the entire system through the visualization of production information.
The older EH-150 model needed a separate module to provide Ethernet functionality, whereas in this programmable controller, the Ethernet functionality resides in the CPU module as standard, resulting in product downsizing and lower power consumption.

10
Hitachi Group
Environmental Efficiency Calculation Result Sheet (Factor X) Ultra Thin LCD Television
■Description of Products
■Development Concept
■Outline of Products for Comparison
■Evaluation Results for the Factor of Global Warming Prevention ■Evaluation Results for the Resource Factor
■ Calculation results for the amount of greenhouse gas emission (ratio to the base product) ■ Calculation results for the amount of resources to be used (ratio to the base product)Reason for reduction:The reduction of resource use due to thinness and decrease of annual product power consumption
Reason for reduction:Rationalized internal structure and reduction of iron and aluminum resulting from a thin-frame structure and efficient heat dissipation design
(101%)
(74%)
19.3
78.2
0.6
16.4
0.3
(-0.6%) (-0.7%)
(73%)
56.0
(100%)
0.5
0.5
1.5
1
Effects of recycling
Make (manufacturing materials)
Carry (transportation)
Use (utilization)
Return (recycling)
Make (manufacturing)
Impr
ovem
ent b
y ne
w m
ater
ials
Actu
al e
nviro
nmen
tal lo
ad
Actu
al e
nviro
nmen
tal lo
ad
43.8
18.6
15.0
16.9
5.7 24.0
17.7
8.6
13.6
(100%)
(64%)
0.1
Iron
Cardboard box
Plastics
Others
Aluminum
The thinnest part 35mm* of the slim body brings “freedom of placement”of the TV including wall mounting. Furthermore, it provides such useful functions as easy video recording with a HDD (internal hard disk) and net services from “Wooo net”.*thinnest part of the monitor
It is designed to reduce environmental burdens in the overall LCA.• Reduce resource use due to thinness• Reduce CO2 in the distribution system by downsizing the packaging• Reduce annual power consumption with an energy-saving design Model name : W32L-HR8000
■Base ■Evaluation
Manufactured in 2005 Manufactured in 2008Model name : UT32-WP770(B/W)
■ Base ■ Evaluation
■Calculation Results ■ 887.9 ■ 647.6Amount of greenhouse gas emission per unit function in product life span (kg/unit function)
■Efficiency of Global Warming Prevention ■ 19.1 ■ 44.8
Factor of Global Warming Prevention 2.3
■ Base ■ Evaluation
■Calculation Results ■ 33.7 ■ 20.2Amount of resources per unit function in product life span (kg/unit function)
■Resource Efficiency ■ 502 ■ 1,439
Resource Factor 2.9
ProductItem ■ Base ■ Evaluation
Year of manufacture 2005 2008
Model name (JAPAN model) W32L-HR8000 UT32-WP770(B/W)
Product life span*1 (specified usage period (year)) 8
Product mass (kg) 26.9 16.8
Annual power consumption*2(kWh/year) 208 149
Product function
Brightness 500 450
Contrast (X:1) 880 1,200
*1 The product life span conforms to the spare parts storage term stipulated in article 5-1-5 of “The Fair Competition Rules for Labeling in the Industry of Home Electric Appliances”.
*2 Energy consumption amounts calculated for one year of television use based on a typical family’s average daily television viewing time (4.5 hours), using formulas for various television sizes and receiver types as specified by “The Law Concerning the Rational Use of Energy” (the Energy Conservation Law).
(JAPAN model) (JAPAN model)

11
*1 The product life span is 10 years including the manufacture year to meet the refrigerator spare parts storage term (9 years after end of life) stipulated in article 5-1-5 of “The Fair Competition Rules for Labeling in the Industry of Home Electric Appliances”.
*2 2.20 x three star freezer compartment volume + 1.87 x three star freezer compartment volume + refrigerator compartment volume
*3 (Rated content volume/product external volume) x 100
ProductItem ■ Base ■ Evaluation
Year of manufacture 2000 2008
Model name R-K46EPAM R-SF50YM
Product life span*1 (specified usage period (year)) 10
Product mass (kg) 91
Rated content volume (L) 456 501
Product function
Adjusted content volume (L)*2 592 675
Content volume efficiency : CER (%)*3 54.68 61.08
■Description of Products
■Development Concept
■Outline of Products for Comparison
■Evaluation Results for the Factor of Global Warming Prevention ■Evaluation Results for the Resource Factor
■ Calculation results for the amount of greenhouse gas emission (ratio to the base product) ■ Calculation results for the amount of resources to be used (ratio to the base product)Reason for reduction:The high-performance heat insulation and other components have improved heat insulation within the cabinet and reduced power consumption during operation.
Reason for reduction:Use of steel has been reduced, and we are encouraging the recycling of steel and plastic components.
Manufactured in 2000 Manufactured in 2008Model name : R-K46EPAM Model name : R-SF50YM
(101%)
(45.2%)
88.3
0.6 0.2
(-1.0%) (-1.4%)
(43.8%)
33.4
(100%)6.2
5.5
0.3
5.8
5.5
0.3
Effects of recycling
Make (manufacturing materials)
Carry (transportation)
Use (utilization)
Return (recycling)
Make (manufacturing)
Impr
ovem
ent b
y ne
w m
ater
ials
Actu
al e
nviro
nmen
tal lo
ad
Actua
l env
ironm
ental
load
Others
Plastics
Copper
Iron
Stainless steel
10.8
45.8
41.0
17.8
38.6
41.7
(100%) (100%)
0.4
1.5
0.8
1.6
Hitachi Group
Environmental Efficiency Calculation Result Sheet (Factor X) Refrigerator
A flexible vacuum heat insulation, with improved insulation performance of about 30% over last year, and a highly efficient compressor are used in the adiabatic walls of the refrigerator, reducing power consumption by about 20% and CO2 emissions by about 37 kg. The high-capacity refrigerator, at 501 liters, saves space with a width of only 685 mm.
• Annual power consumption has been reduced to 370 kWh through use of our unique energy-saving technologies, such as a flexible vacuum heat insulation with high heat insulation efficiency and high-efficiency compressor.
• This refrigerator uses R600a (Isobutane) refrigerant, and cyclopentane as a heat insulation foaming agent, resulting in a non-HFC unit with very small effect on grobal warming.
■Base ■Evaluation
■ Base ■ Evaluation
■Calculation Results ■ 4,622 ■ 2,023Amount of greenhouse gas emission per unit function in product life span (kg/unit function)
■Efficiency of Global Warming Prevention ■ 70 ■ 204
Factor of Global Warming Prevention 2.9
■ Base ■ Evaluation
■Calculation Results ■ 139 ■ 91Amount of resources per unit function in product life span (kg/unit function)
■Resource Efficiency ■ 2,322 ■ 4,526
Resource Factor 1.9

12
■Description of Products
■Development Concept
■Outline of Products for Comparison
Manufactured in 1999 Manufactured in 2008
■Evaluation Results for the Factor of Global Warming Prevention ■Evaluation Results for the Resource Factor
■ Calculation results for the amount of greenhouse gas emission (ratio to the base product) ■ Calculation results for the amount of resources to be used (ratio to the base product)Reason for reduction:The energy-saving technology in which the heat produced during drying is re-cycled reduces power consumption during operation.
Reason for reduction:In addition, since the water is re-circulated, the amount of water used is also reduced.
Model name : RAS-4010LX2 Model name : RAS-S40Y2
(100.7%)
95.6
0.4 0.2
(-0.7%) (-1.2%)
20.5
(100%)
Effects of recycling
Make (manufacturing materials)
Carry (transportation)
Use (utilization)
Return (recycling)
Make (manufacturing)
Impr
ovem
ent b
y ne
w m
ater
ials
Actu
al e
nviro
nmen
tal lo
ad
(85.0%)
94.3
(83.8%)
78.5
3.2
2.8
0.1 3.0
2.8
0.1
0.3 0.6
Other materials
Copper
Aluminum
Iron
Plastics
45.0
15.5
15.3
10.2
14.0
70.1
(100%)
(128.4%)
14.9
12.8
10.6
20.0
Hitachi Group
Environmental Efficiency Calculation Result Sheet (Factor X) Room Air Conditioner
Since a stainless material is used, the inside of the air conditioner is clean all the way to the back. An ion mist cleans the air, moisturizes the skin, and gives hair a sheen. Furthermore, air conditioning is both comfortable and ecological due to the use of the Eco-MiruMiru sensor that monitors a person’s location.
The low annual power consumption of 1336 kWh*1 is achieved by using an energy-saving motor focusing on efficiency in the low-revolution range (the most frequently used range in air conditioning) and control technology that drives the motor over a wide range.Furthermore, air conditioning is both comfortable and ecological due to the use of the Eco-MiruMiru sensor that detects a person’s motion and location.
■Base ■Evaluation
■ Base ■ Evaluation
■Calculation Results ■ 7,203 ■ 6,035Amount of greenhouse gas emission per unit function in product life span (kg/unit function)
■Efficiency of Global Warming Prevention ■ 0.03 ■ 0.06
Factor of Global Warming Prevention 1.9
■ Base ■ Evaluation
■Calculation Results ■ 65.7 ■ 57.1Amount of resources per unit function in product life span (kg/unit function)
■Resource Efficiency ■ 3.38 ■ 6.3
Resource Factor 1.8
*1 Annual power consumption based on conditions set by the Japan Refrigeration and Air Conditioning Industry Association (JRA4046).
The calculation is based on a model of ambient temperatures in Tokyo.
*2 The product life span is 10 years including the manufacture year to meet the air conditioner spare parts storage term (9 years after end of life) stipulated in article 5-1-5 of “The Fair Competition Rules for Labeling in the Industry of Home Electric Appliances”.
ProductItem ■ Base ■ Evaluation
Year of manufacture 1999 2008
Model name RAS-4010LX2 RAS-S40Y2
Product life span*2 (specified usage period (year)) 10
Product mass (kg) (Outdoor unit, indoor unit) 9 /34 12.5 /41
Specific term power consumption (kWh) 1,631 1,336
Product function
APF 4.9 6.0
Low-temperature heating (2°C) (kW)
6.0 7.4

13
■Description of Products
■Development Concept
■Outline of Products for Comparison
*1 Rated life span of fluorescent lamp: 6,000 hours. Rated life span of LED lighting ”LINESABER” : 40,000 hours. Calculated based on 10 hours of lighting a day, 356 days a year.
*2 Includes stabilizer and lighting circuit losses.
*3 Calculated by dividing the lighting intensity at a location 50 cm away from the light source by the amount of power consumed
■Evaluation Results for the Factor of Global Warming Prevention ■Evaluation Results for the Resource Factor
■ Calculation results for the amount of greenhouse gas emission (ratio to the base product) ■ Calculation results for the amount of resources to be used (ratio to the base product)Reason for reduction:Both using the LEDs simply and using a light guide plate have reduced the number of LEDs required and therefore power consumption.
Reason for reduction:The replacement of fluorescent lamps with LED lighting also drastically changes the materials used. In particular, LEDs provide a light source devoid of mercury.
ProductItem ■ Base ■ Evaluation
Year of manufacture 2000 2008
Model name FL10EX-N-A L30N2A
Product life span*1 (specified usage period (year)) 1.6 11
Product mass (kg) 0.056 0.15
Power consumption*2 (W) 13 7
Light source color (Color temperature [K]) 5,000 4,500
Lighting intensity immediately beneath (50 cm) [lx] 199 208
Product function
Average color rendering index [Ra] 84 80
Lighting intensity efficiency*3 (lx (@ 50 cm)/W) 15.3 29.7
Manufactured in 2000 Manufactured in 2008Model name : FL10EX-N-A Model name : L30N2A
(100.2%)
95.5
0.1
(-0.2%)
(100%)1.4
3.0
0.2
Effects of recycling
Make (manufacturing materials)
Carry (transportation)
Use (utilization)
Return (recycling)
Make (manufacturing)
Impr
ovem
ent b
y ne
w m
ater
ials
Actu
al e
nviro
nmen
tal lo
ad
(349.8%)
1.4
(-2.8%)
(347%)
343.5
4.9
0
0
Actu
al e
nviro
nmen
tal lo
ad
80.6
14.6
52.5
47.2
168.3
(100%)
(268%)
3.2
1.6
0
Glass
Plastics
Other metals
Others
Aluminum
0
0
Hitachi Group
Environmental Efficiency Calculation Result Sheet (Factor X) LINESABER LED Lighting
”LINESABER” is an innovative LED lighting system that provides uniform light in a line. ”LINESABER” features energy, space, and maintenance saving functions that suggest uses that are not possible with fluorescent lamps.
The existing linear LED lighting system uses multiple LEDs positioned at evenly spaced intervals that have a pebbly appearance. In addition, the light from the LEDs directly enters the eyes, causing a glare effect. The line saver uses light guide plate technology of liquid crystal backlighting to provide a highly uniform linear light source, resolving the problems with the existing LED lighting.
■ Base ■ Evaluation
■Calculation Results ■ 34 ■ 118Amount of greenhouse gas emission per unit function in product life span (kg/unit function)
■Efficiency of Global Warming Prevention ■ 0.74 ■ 2.76
Factor of Global Warming Prevention 3.7
■ Base ■ Evaluation
■Calculation Results ■ 0.056 ■ 0.155Amount of resources per unit function in product life span (kg/unit function)
■Resource Efficiency ■ 446 ■ 2,104
Resource Factor 4.7
■Base ■Evaluation

14
■Description of Products
■Development Concept
■Outline of Products for Comparison
*1 Cited: storage assumption examined by the Japan Recording-Media Industries Association
Note that it is assumed that the data is stored under appropriate temperature and humidity conditions.
Manufactured in 2000 Manufactured in 2008
■Evaluation Results for the Factor of Global Warming Prevention ■Evaluation Results for the Resource Factor
■ Calculation results for the amount of greenhouse gas emission (ratio to the base product) ■ Calculation results for the amount of resources to be used (ratio to the base product)Reason for reduction:The emission of global warming gases over the lifecycle per unit product function is reduced.
Reason for reduction:The extreme capacity (8 times greater than the reference product) facilitates the efficient use of resources.
Model name : LTOU1 Model name : LTOU4
(100%)
(65%)
6
6
(0%) (0%)
(65%)
55
87
(100%)
1
6
0
1
3
0
Effects of recycling
Make (manufacturing materials)
Carry (transportation)
Use (utilization)
Return (recycling)
Make (manufacturing)
Impr
ovem
ent b
y ne
w m
ater
ials
Actu
al e
nviro
nmen
tal lo
ad
Actu
al e
nviro
nmen
tal lo
ad 67.5
10.0 9.0
14.5 14.5
65.0
(100%)(96.5%)
4.5
3.5
4.5
3.5
Metal
Papers
Others
Package material /Cardboard
Plastics
ProductItem ■ Base ■ Evaluation
Year of manufacture 2000 2008
Model name LTOU1 LTOU4
Product life span*1 (specified usage period (year)) 30
Product mass (kg) 0.2
Number of components 18
Product function
Memory capacity (GB) 100 800
When data is compressed (GB) 200 1,600
Hitachi Group
Environmental Efficiency Calculation Result Sheet (Factor X) Computer Tape, LTO Ultrium 4
Maxell’s LTO Ultrium 4 data cartridge uses more-microparticulated magnetic material than ever to achieve a memory capacity of 1.6 TB (when data is compressed), which is 8 times greater than the LTO Ultrium 1 reference product, and twice that of the LTO Ultrium 3. The LTO Ultrium 4 can therefore store data equivalent 2,300 CDs (700MB per CD), facilitating the efficient use of resources.
• Building a highly efficient, rational data backup environment with the appropriate life-cycle management required in a corporate IT environment• Computer tape having high reliability and long storage of data• Data cartridge essential for backing up voluminously increasing information assets
■ Base ■ Evaluation
■Calculation Results ■ 32.7 ■ 21.4Amount of greenhouse gas emission per unit function in product life span (kg/unit function)
■Efficiency of Global Warming Prevention ■ 3.06 ■ 37.4
Factor of Global Warming Prevention 12
■ Base ■ Evaluation
■Calculation Results ■ 0.4 ■ 0.3Amount of resources per unit function in product life span (kg/unit function)
■Resource Efficiency ■ 253 ■ 2,490
Resource Factor 9.9
■Base ■Evaluation

15
■Description of Products
■Development Concept
■Outline of Products for Comparison
*1 Based on customer specifications (an example is provided)
*2 Power consumption needed to obtain the same light intensity (assumed use frequency based on the customer conditions).
■Evaluation Results for the Factor of Global Warming Prevention ■Evaluation Results for the Resource Factor
■ Calculation results for the amount of greenhouse gas emission (ratio to the base product) ■ Calculation results for the amount of resources to be used (ratio to the base product)Reason for reduction:Using the metal reflector (MR) to improve the luminous efficiency reduces power consumption during operation.
Reason for reduction:Because this product provides high luminous efficiency, it reduces the amount of resource use per function.
ProductItem ■ Base ■ Evaluation
Year of manufacture 2005 2008
Model name GaAs Type MR Type
Product life span (specified usage period (year)) 10
Product size*1 (mm) 0.3 x 0.3 x 0.4 0.3 x 0.3 x 0.2
Annual power consumption*2(Wh / year) 5.0 1.0
Product function
Luminous efficiency(lumen/watt)]
12 65
Manufactured in 2005 Manufactured in 2008Model name : GaAs Type Model name : MR Type
(118%)
(79%)
50
63
5
49
25
(-18%) (-18%)
(61%)
(100%)
0
05
0
0
Effects of recycling
Make (manufacturing materials)
Carry (transportation)
Use (utilization)
Return (recycling)
Make (manufacturing)
Impr
ovem
ent b
y ne
w m
ater
ials
Actu
al e
nviro
nmen
tal lo
ad
Actu
al e
nviro
nmen
tal lo
ad
Effects of recycling
100 100
(100%) (100%)Semiconductors
Hitachi Group
Environmental Efficiency Calculation Result Sheet (Factor X)High Luminous Efficiency AlGaInP
Red-Color Light-Emitting Diode
• The AlGaInP red LED chip has a luminous efficiency of 65 lumen/watt, which is 5 times that of the existing red LED chip (industry leading class).• High luminous efficiency can help conserve resources and energy.
With the existing red LED, light absorption losses due to the gallium arsenide (GaAs) substrate are large, and the luminous efficiency of red is 12 lumen / watt at the maximum. However, a new chip structure incorporating a metal reflector (MR) within the LED chip that achieves a luminous efficiency 5 times greater has been developed.
■ Base ■ Evaluation
■Calculation Results ■ 8.7 ■ 5.4Amount of greenhouse gas emission per unit function in product life span (kg/unit function)
■Efficiency of Global Warming Prevention ■ 152 ■ 1,350
Factor of Global Warming Prevention 8.8
■ Base ■ Evaluation
■Calculation Results ■ 2.4 ■ 2.3Amount of resources per unit function in product life span (mg/unit function)
■Resource Efficiency ■ 547 ■ 3,170
Resource Factor 5.8
■Base ■Evaluation

16
■Description of Products
■Development Concept
■Outline of Products for Comparison
*1 Criterion values of Hitachi Chemical Co., Ltd.
*2 For the evaluated products: Actual measurement values obtained by Hitachi Chemical Co., Ltd.
For the reference products: Values obtained from provisional calculations by Hitachi Chemical Co., Ltd.
*3 Values obtained from provisional calculations by Hitachi Chemical Co., Ltd.
■Evaluation Results for the Factor of Global Warming Prevention ■Evaluation Results for the Resource Factor
■ Calculation results for the amount of greenhouse gas emission (ratio to the base product) ■ Calculation results for the amount of resources to be used (ratio to the base product)Reason for reduction: Reason for reduction:
The number of components, such as interior and exterior components and structural parts not made of iron and steel, has been reduced.
Manufactured in 1999Model name : Steel back door
Manufactured in 2004Model name : Plastic back door module
(116%)
(87%)
111
5
77
10
(-16%)
(-7%)
(80%)
(100%)
0
0
0
0
0
0
Effects of recycling
Make (manufacturing materials)
Carry (transportation)
Use (utilization)
Return (recycling)
Make (manufacturing)
Impr
ovem
ent b
y ne
w m
ater
ials
Actu
al e
nviro
nmen
tal lo
ad
Actu
al e
nviro
nmen
tal lo
ad
64
14
13
11
(100%)
(89%)2
72
14
12
50
Others
Glass
Other plastics
Steel
Polypropylene
ProductItem ■ Base ■ Evaluation
Year of manufacture 1999 2004
Model name Steel back door Plastic back door module
Product life span*1 (specified usage period (year)) 10
Product mass (kg) 28 25
Product function
Weight reduction*2 (kg) 28 25
Assembly person-hours (number of models)*3 5 1
Hitachi Group
Environmental Efficiency Calculation Result Sheet (Factor X) Plastic Back Door Module
The weight of the plastic back door module is 10% less than that of the existing module with steel back door. The module takes advantage of the excellent formability of plastic to integrate components into a design that uses curved surfaces, which is not possible with steel back door, with no loss of strength or rigidity.
• Bonding the high-strength inner and outer panels to each other has as its aim a weight reduction of about 30% compared with the existing module with steel back door (the reduction varies according to the basic design).• The number of components has been reduced by integrating the interior and exterior components and structural parts.
■ Base ■ Evaluation
■Calculation Results ■ 62.04 ■ 49.57Amount of greenhouse gas emission per unit function in product life span (kg/unit function)
■Efficiency of Global Warming Prevention ■ 0.00115 ■ 0.00807
Factor of Global Warming Prevention 7.0
■ Base ■ Evaluation
■Calculation Results ■ 27.70 ■ 26.49Amount of resources per unit function in product life span (kg/unit function)
■Resource Efficiency ■ 0.0026 ■ 0.0151
Resource Factor 5.9
■Base/■Evaluation
The use of resin to reduce weight lessens the burden on the environment when materials are manufactured.

17
memo


This mark is used for Hitachi Group environmental activities and as a way of labeling products on datasheets that score over a certain number of points using the Design for Environment (DfE) assessment system and are registered as eco-products.
2009.07ZZ-E021P
Hitachi, Ltd. Environmental Strategy Of�ceTel: +81-3-3258-1111, Fax: +81-3-4235-5835http://www.hitachi.com/environment/