Environmental drivers on leaf phenology of ironstone ...
14
An Acad Bras Cienc (2017) 89 (1) Anais da Academia Brasileira de Ciências (2017) 89(1): 131-143 (Annals of the Brazilian Academy of Sciences) Printed version ISSN 0001-3765 / Online version ISSN 1678-2690 http://dx.doi.org/10.1590/0001-3765201720150049 www.scielo.br/aabc Environmental drivers on leaf phenology of ironstone outcrops species under seasonal climate LETÍCIA C. GARCIA 1,2 , FERNANDA V. BARROS 2,3 and JOSÉ P. LEMOS-FILHO 2 1 Laboratório de Botânica, Centro de Ciências Biológicas e da Saúde, Universidade Federal de Mato Grosso do Sul, Caixa Postal 549, 79070-900 Campo Grande, MS, Brazil 2 Departamento de Botânica, Instituto de Ciências Biológicas, Universidade Federal de Minas Gerais, Avenida Antônio Carlos, 6627, 31270-110 Belo Horizonte, MG, Brazil 3 Departamento de Biologia Vegetal, Instituto de Biologia, Universidade Estadual de Campinas Caixa Postal 6109, 13083-970 Campinas, SP, Brazil Manuscript received on January 23, 2015; accepted for publication on March 18, 2016 ABSTRACT Banded iron formations (BIF) have a particular vegetation type and provide a good model system for testing theories related to leaf phenology, due to unique stressful environmental conditions. As a consequence of the stressful conditions of BIF environment, we hypothesize that most species would retain at least some significant canopy cover, even at the end of the dry season, independently of growth form - trees, shrubs, and sub-shrubs. Considering the strong seasonality, we also hypothesize that photoperiod and rainfall act as triggers for leaf fall and leaf flushing in these environments. The majority of the fifteen studied species had a semi-deciduous behavior and shed their leaves mainly during the dry season, with a recovery at the end of this season. In general, leaf flushing increased around the spring equinox (end of the dry season and start of the rainy season). A trade-off between leaf loss and leaf maintenance is expected in a community in which most plants are naturally selected to be semi-deciduous. Our results suggest photoperiod as a dominant factor in predicting leaf phenology. Key words: Canga, day length, drought stress, evergreen, leaf shedding, tropical ecosystems. Correspondence to: Letícia Couto Garcia E-mail: [email protected] INTRODUCTION Foliar phenology has a crucial role in plants` strategy of carbon gain and plant water balance (Reich 1995, Zhang et al. 2013) since leaf arrangement in time is strongly related to photosynthetic production (Kikuzawa 1995, Jolly and Running 2004) and transpiration (Givnish 2002, Kröber and Bruelheide 2014). Leaf exchange patterns can be evaluated as a result of a change in environmental conditions (e.g., photoperiod, temperature, daily insolation, humidity, and nutrients availability) acting together with endogenous rhythm regulations (Morellato et al. 1989, Van Schaik et al. 1993, Pedroni 2002, Givnish 2002, Borchert et al. 2015). The water availability (Borchert et al. 2002), and day length (Borchert et al. 2002, Luttge and Hertel 2009, Ballestrini et al. 2011) have been reported as important drivers of leaf phenology, and can be considered as triggers to plant species response to a change in environmental conditions.
Transcript of Environmental drivers on leaf phenology of ironstone ...

An Acad Bras Cienc (2017) 89 (1)
Anais da Academia Brasileira de Ciências (2017) 89(1): 131-143(Annals of the Brazilian Academy of Sciences)Printed version ISSN 0001-3765 / Online version ISSN 1678-2690http://dx.doi.org/10.1590/0001-3765201720150049www.scielo.br/aabc
Environmental drivers on leaf phenology of ironstone outcrops species under seasonal climate
LEtícia c. Garcia1,2, FErnanda V. Barros2,3 and José P. LEmos-FiLho2
1Laboratório de Botânica, Centro de Ciências Biológicas e da Saúde, Universidade Federal de Mato Grosso do Sul, Caixa Postal 549, 79070-900 Campo Grande, MS, Brazil
2Departamento de Botânica, Instituto de Ciências Biológicas, Universidade Federal de Minas Gerais, Avenida Antônio Carlos, 6627, 31270-110 Belo Horizonte, MG, Brazil
3Departamento de Biologia Vegetal, Instituto de Biologia, Universidade Estadual de Campinas Caixa Postal 6109, 13083-970 Campinas, SP, Brazil
Manuscript received on January 23, 2015; accepted for publication on March 18, 2016
aBstractBanded iron formations (BIF) have a particular vegetation type and provide a good model system for testing theories related to leaf phenology, due to unique stressful environmental conditions. As a consequence of the stressful conditions of BIF environment, we hypothesize that most species would retain at least some significant canopy cover, even at the end of the dry season, independently of growth form - trees, shrubs, and sub-shrubs. Considering the strong seasonality, we also hypothesize that photoperiod and rainfall act as triggers for leaf fall and leaf flushing in these environments. The majority of the fifteen studied species had a semi-deciduous behavior and shed their leaves mainly during the dry season, with a recovery at the end of this season. In general, leaf flushing increased around the spring equinox (end of the dry season and start of the rainy season). A trade-off between leaf loss and leaf maintenance is expected in a community in which most plants are naturally selected to be semi-deciduous. Our results suggest photoperiod as a dominant factor in predicting leaf phenology.Key words: Canga, day length, drought stress, evergreen, leaf shedding, tropical ecosystems.
Correspondence to: Letícia Couto Garcia E-mail: [email protected]
introduction
Foliar phenology has a crucial role in plants` strategy of carbon gain and plant water balance (Reich 1995, Zhang et al. 2013) since leaf arrangement in time is strongly related to photosynthetic production (Kikuzawa 1995, Jolly and Running 2004) and transpiration (Givnish 2002, Kröber and Bruelheide 2014). Leaf exchange patterns can be evaluated as
a result of a change in environmental conditions (e.g., photoperiod, temperature, daily insolation, humidity, and nutrients availability) acting together with endogenous rhythm regulations (Morellato et al. 1989, Van Schaik et al. 1993, Pedroni 2002, Givnish 2002, Borchert et al. 2015). The water availability (Borchert et al. 2002), and day length (Borchert et al. 2002, Luttge and Hertel 2009, Ballestrini et al. 2011) have been reported as important drivers of leaf phenology, and can be considered as triggers to plant species response to a change in environmental conditions.
An Acad Bras Cienc (2017) 89 (1)
132 LeTícIA c. GArcIA, FernAndA V. BArros and JOSé P. LEMOS-FILHO
The day length or photoperiod is consistent and reliable signal of seasonality in a certain ecosystem and some species relay on photoperiod cues to sense the arrival of a productive or stressing upcoming season (Way et al. 2015). The influence of day length on leaf phenology is better understood in temperate ecosystems where there is a more distinct day-length signal. A recent work pointed out that, even in ecosystems with low or no day-length signal, the environment signal triggering flushing or flowering synchrony could be probably linked to seasonal change in daily insolation (Borchert et al. 2015).
In tropical ecosystems, leaf shedding is strongly related to seasonality in precipitation (Borchert 1998) that affects water availability (Lemos-Filho and Mendonça Filho 2000). The vegetative phenology response usually follows a conservative resources` use strategy and different ecosystems vary in resources availability (Jolly and Running 2004) resulting in a wide diversity of leaf display. Evergreen strategy is usually related to long photosynthetic season and less nutrient loss on leaf production, while deciduous species reduce their transpiration and respiration during the dry season, and off set their productivity by increasing the photosynthetic rate per unit of leaf mass (Givnish 2002). Hence, seasonal drought would favor deciduous species, whereas infertile soils would favor evergreen species (Givnish 2002).
The banded iron formation (BIF) rock outcrop, called Canga in Brazil, are isolated xeric islands within a mesic matrix (Gibson et al. 2010, Silva et al. 1996). BIF vegetation types are linked to soil characteristics, they comprise a mosaic of species with different adaptations (e.g., many BIF plants can uptake heavy metals) (Porto and Silva 1989, Teixeira and Lemos-Filho 1998), and about 6% of endemic species (Silveira et al. 2015). In BIF areas, the soil is poor in nutrients and presents low water storage capacity (Giulietti et al. 1997). They are seasonally dry environments, where it is often
observed high daily thermal amplitude (Jacobi et al. 2007, Vincent et al. 2002), with great changes in water availability (Silva et al. 1996, Vincent and Meguro 2008, silveira et al. 2015). Therefore, these environmental conditions impose stress on plants, which could result in different strategies for water, carbon, and nutrients’ maintenance and uptake (Silveira et al. 2015).
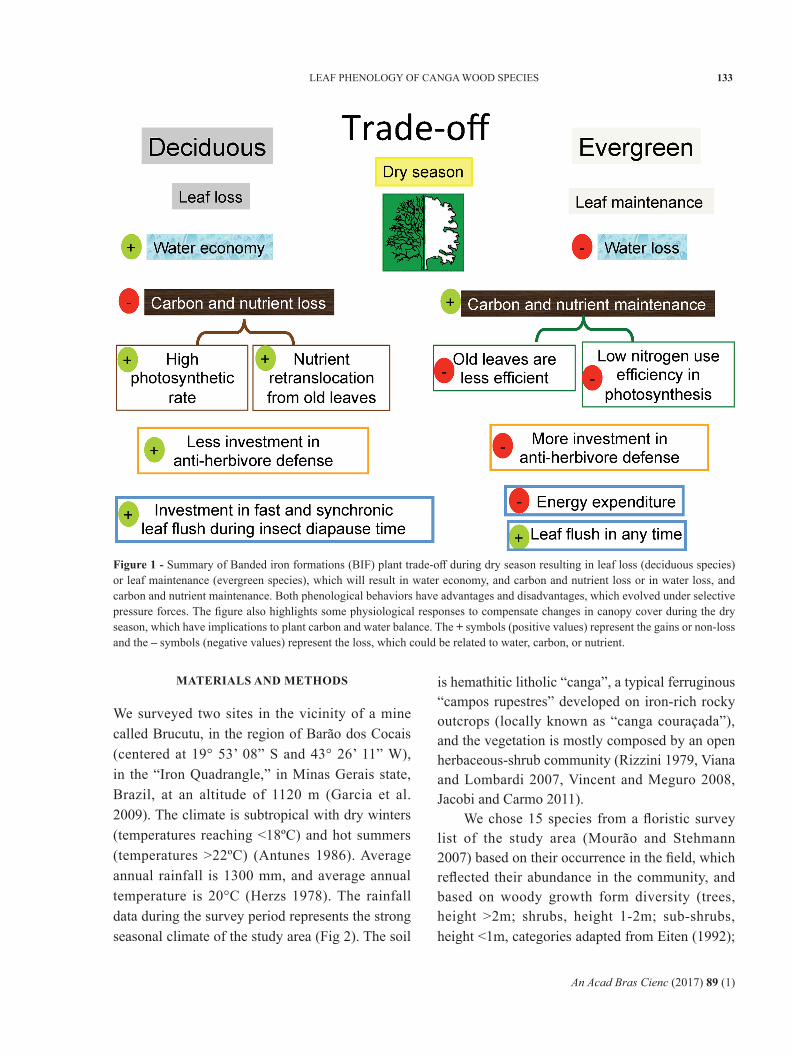
Owing to this stressful condition (e.g., water and nutrient availability) (Giulietti et al. 1997, Teixeira and Lemos-Filho 1998), it is expected traits related to water and nutrient economy, as its efficient acquisition and use (Silveira et al. 2015, Reich 2014). Regarding to leaf phenology, the strategies in BIF species must balance these aspects. There is a trade-off between maintaining the leaves during the dry season to save carbon and other nutrients, versus dropping the leaves to save water, by reducing the transpiration rate and by a synchronic and fast leaf flushing escape from herbivory (coley and Barone 1996). This trade-off is summarized in Figure 1, which is based on studies of Murali and Sukumar (1993), Coley and Barone (1996), Monk (1996), Gill et al. (1998), Givnish (2002), Escudero and Mediavilla (2003). These species would perhaps best exhibit fast-synchronized leaf flushing throughout the rainy season to maximize productivity during the most favorable period of carbon uptake, with leaf flushing concentration around the end of the dry season and the beginning of the rainy season.
To study these trade-offs on leaf display in the stressful BIF environment, we chose 15 species of nine representative plant families, ranging from sub-shrubs to trees. We tested the hypothesis that most species would retain at least some significant canopy cover even at the end of the dry season, independently of growth form, and that photoperiod and rainfall would act as triggers for leaf fall and leaf flushing. Our results aid in understanding vegetation response to stressful environments, which may affect growing conditions.
An Acad Bras Cienc (2017) 89 (1)
LEAF PHENOLOGY OF CANGA WOOD SPECIES 133
matEriaLs and mEthods
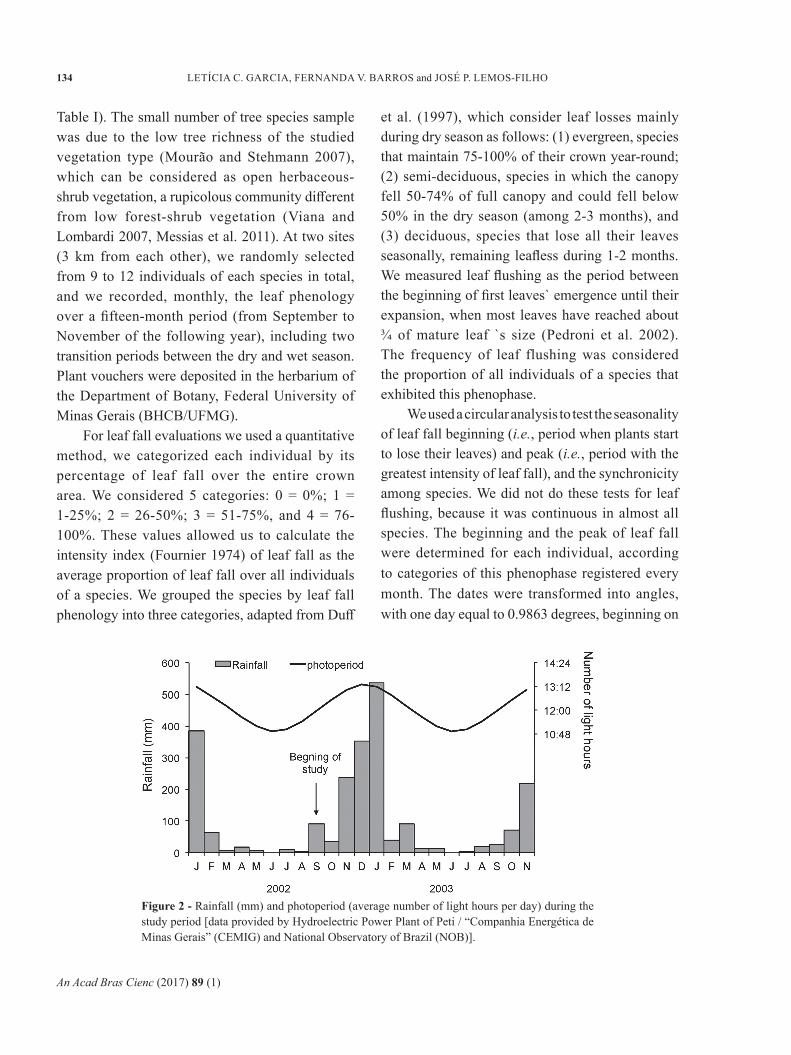
We surveyed two sites in the vicinity of a mine called Brucutu, in the region of Barão dos Cocais (centered at 19° 53’ 08” S and 43° 26’ 11” W), in the “Iron Quadrangle,” in Minas Gerais state, Brazil, at an altitude of 1120 m (Garcia et al. 2009). The climate is subtropical with dry winters (temperatures reaching <18ºC) and hot summers (temperatures >22ºC) (Antunes 1986). Average annual rainfall is 1300 mm, and average annual temperature is 20°c (Herzs 1978). The rainfall data during the survey period represents the strong seasonal climate of the study area (Fig 2). The soil
is hemathitic litholic “canga”, a typical ferruginous “campos rupestres” developed on iron-rich rocky outcrops (locally known as “canga couraçada”), and the vegetation is mostly composed by an open herbaceous-shrub community (Rizzini 1979, Viana and Lombardi 2007, Vincent and Meguro 2008, Jacobi and Carmo 2011).
We chose 15 species from a floristic survey list of the study area (Mourão and Stehmann 2007) based on their occurrence in the field, which reflected their abundance in the community, and based on woody growth form diversity (trees, height >2m; shrubs, height 1-2m; sub-shrubs, height <1m, categories adapted from Eiten (1992);
Figure 1 - summary of Banded iron formations (BIF) plant trade-off during dry season resulting in leaf loss (deciduous species) or leaf maintenance (evergreen species), which will result in water economy, and carbon and nutrient loss or in water loss, and carbon and nutrient maintenance. Both phenological behaviors have advantages and disadvantages, which evolved under selective pressure forces. The figure also highlights some physiological responses to compensate changes in canopy cover during the dry season, which have implications to plant carbon and water balance. The + symbols (positive values) represent the gains or non-loss and the – symbols (negative values) represent the loss, which could be related to water, carbon, or nutrient.
An Acad Bras Cienc (2017) 89 (1)
134 LeTícIA c. GArcIA, FernAndA V. BArros and JOSé P. LEMOS-FILHO
Table I). The small number of tree species sample was due to the low tree richness of the studied vegetation type (Mourão and Stehmann 2007), which can be considered as open herbaceous-shrub vegetation, a rupicolous community different from low forest-shrub vegetation (Viana and Lombardi 2007, Messias et al. 2011). At two sites (3 km from each other), we randomly selected from 9 to 12 individuals of each species in total, and we recorded, monthly, the leaf phenology over a fifteen-month period (from september to November of the following year), including two transition periods between the dry and wet season. Plant vouchers were deposited in the herbarium of the Department of Botany, Federal University of Minas Gerais (BHCB/UFMG).
For leaf fall evaluations we used a quantitative method, we categorized each individual by its percentage of leaf fall over the entire crown area. We considered 5 categories: 0 = 0%; 1 = 1-25%; 2 = 26-50%; 3 = 51-75%, and 4 = 76-100%. These values allowed us to calculate the intensity index (Fournier 1974) of leaf fall as the average proportion of leaf fall over all individuals of a species. We grouped the species by leaf fall phenology into three categories, adapted from duff
et al. (1997), which consider leaf losses mainly during dry season as follows: (1) evergreen, species that maintain 75-100% of their crown year-round; (2) semi-deciduous, species in which the canopy fell 50-74% of full canopy and could fell below 50% in the dry season (among 2-3 months), and (3) deciduous, species that lose all their leaves seasonally, remaining leafless during 1-2 months. We measured leaf flushing as the period between the beginning of first leaves` emergence until their expansion, when most leaves have reached about ¾ of mature leaf `s size (Pedroni et al. 2002). The frequency of leaf flushing was considered the proportion of all individuals of a species that exhibited this phenophase.
We used a circular analysis to test the seasonality of leaf fall beginning (i.e., period when plants start to lose their leaves) and peak (i.e., period with the greatest intensity of leaf fall), and the synchronicity among species. We did not do these tests for leaf flushing, because it was continuous in almost all species. The beginning and the peak of leaf fall were determined for each individual, according to categories of this phenophase registered every month. The dates were transformed into angles, with one day equal to 0.9863 degrees, beginning on
Figure 2 - Rainfall (mm) and photoperiod (average number of light hours per day) during the study period [data provided by Hydroelectric Power Plant of Peti / “Companhia Energética de Minas Gerais” (CEMIG) and National Observatory of Brazil (NOB)].

An Acad Bras Cienc (2017) 89 (1)
LEAF PHENOLOGY OF CANGA WOOD SPECIES 135
taBL
E i
Spec
ies c
lass
ifica
tion
acco
rdin
g to
thei
r gr
owth
form
(sub
-shr
ub, s
hrub
, and
tree
), le
af fa
ll st
rate
gy (d
ecid
uous
, sub
-dec
iduo
us, a
nd e
verg
reen
) and
max
imum
hei
ght
(m).
This
tabl
e al
so e
xhib
its th
e re
sult
of c
ircu
lar
stat
istic
s on
the
phen
olog
ical
var
iabl
es a
naly
zed
for
all 1
5 sp
ecie
s. M
ean
Vect
or v
alue
(µ) i
s the
ave
rage
ang
le; t
he
Leng
th o
f Mea
n Ve
ctor
(r) r
epre
sent
s the
sync
hron
y of
leaf
fall
phen
opha
se; a
nd th
e R
ayle
igh
Test
(Z) i
s the
stat
istic
of c
ircu
lar
anal
ysis
(*P
< 0.
01, *
* P
< 0.
05, a
nd
n.s.,
non
sign
ifica
nt).
The
num
ber
of in
divi
dual
s sam
pled
by
each
spec
ies (
n) v
arie
d be
twee
n 9
and
12.
Fam
ily /
spec
ies
Gro
wth
fo
rmL
eaf f
all
beha
vior
Max
imum
he
ight
(m)
Beg
inni
ng o
f lea
f fal
lPe
ak o
f lea
f fal
l
mea
n Ve
ctor
(µ)
Len
gth
of m
ean
Vect
or (r
)
ray
leig
h Te
st (Z
)m
ain
Vect
or (µ
)
Len
gth
of m
ean
Vect
or (r
)
ray
leig
h Te
st (Z
)
ast
erac
eae
Bacc
hari
s ret
usa
DC
.sh
rub
sub-
dec
210
3°0.
866
5.24
6*24
1°0.
741
3.84
**Er
eman
thus
inca
nus (
Less
.) Le
ss.
tree
ever
gree
n2.
296
º1
10*
152º
0.
981
9.62
9*Ly
chno
phor
a pi
nast
er M
art.
shru
bsu
b-de
c2
86º
0.94
88.
089*
208º
0.
704
4.45
9*c
lusi
acea
eK
ielm
eyer
a re
galis
Sad
di.
shru
bde
cidu
ous
1.5
63º
0.95
29.
974*
208º
0.96
610
.255
*E
upho
rbia
ceae
Cro
ton
sple
ndid
us M
art.
sub-
shru
bsu
b-de
c1
49 º
0.94
27.
983*
226º
0.25
10.
597
n.s.
Mic
rost
achy
s cor
nicu
lata
(Vah
l) G
riseb
. su
b-sh
rub
deci
duou
s1
55º
0.77
95.
463*
204º
0.95
48.
197*
Faba
ceae
Bauh
inia
pen
tand
ra (B
ong.
) D.D
iert.
shru
bsu
b-de
c2
84°
0.97
9.42
4*24
0°0.
766
5.86
6*
Cen
trose
ma
cori
aceu
m B
enth
.su
b-sh
rub
sem
i-dec
0.5
96°
110
*18
6°0.
822
6.75
8*Pe
rian
dra
med
iterr
anea
(Vel
l.) T
aub.
sub-
shru
bse
mi-d
ec0.
787
º0.
922
9.34
2*18
7º0.
847.
764*
mal
vace
aePa
voni
a vi
scos
a A
.St.H
il.sh
rub
sem
i-dec
281
º0.
939
8.82
1*21
1º0.
712
5.06
5*m
elas
tom
atac
eae
Mic
onia
sello
wia
na N
audi
ntre
ese
mi-d
ec3
132º
0.73
85.
997*
279º
0.84
57.
851*
Pler
oma
hete
rom
alla
D. D
on (D
.Don
)sh
rub
sem
i-dec
1.5
106º
0.92
48.
543*
246º
0.59
63.
548*
*m
yrta
ceae
Cal
yptr
anth
e co
rdat
a O
. Ber
gsh
rub
sem
i-dec
1.7
78°
110
*19
7°0.
945
8.93
*Po
lygo
nace
aeC
occo
loba
acr
ostic
hoid
es C
ham
.sh
rub
sem
i-dec
1.5
124º
0.87
97.
723*
222º
0.74
95.
603*
Rub
iace
aeC
ordi
era
conc
olor
(Cha
m.)
Kun
tze
shru
bev
ergr
een
1.4
182°
110
*23
3°0.
952
9.06
8*

An Acad Bras Cienc (2017) 89 (1)
136 LeTícIA c. GArcIA, FernAndA V. BArros and JOSé P. LEMOS-FILHO
January 1st. We used the ORIANA software (Kovach 2002) to verify the level of leaf fall synchronicity within and among species around an average angle (µ), which represents the average date on which the phenophase occurs with highest frequency. The rayleigh test (p), based on dates of field visits, points out the probability of the data being randomly distributed around the circle of 360°. Therefore, if the p is significant, the phenophase is concentrated among a date instead of being uniformly or randomly distributed around the 360°. Circular analysis also generates an average vector length (r) that represents a concentration measure of frequencies around the estimated mean angle, ranging from 0, a complete asynchrony of the event, to 1, which represents the highest possible synchrony (Zar 1996). This same analysis was performed to species groups of leaf phenological behavior and growth form. The Watson-Willians test was used to identify differences in leaf fall timing among these groups when mean angle was significant (Zar 1996, Genini et al. 2009).
To evaluate the influence of precipitation and photoperiod on leaf phenology we performed multiple stepwise regression analyses in Statistica 8.0 software, according to Marques et al. (2004). We performed two multiple stepwise regression, as dependent variable: the first analyses considered the monthly leaf fall intensity and the second analyses considered the monthly frequency of leaf flushing, both versus six independent variables of lag time as follows: (1) the photoperiod of the current observation month, (2) the photoperiod of the previous month, (3) the photoperiod of two months before the first, (4) the precipitation of the current observation month, (5) the precipitation of the previous month, (6) the precipitation of two months before the first.
rEsuLts
eleven of the 15 studied species (74%) exhibited semi-deciduous behavior (Table I); only two species
were evergreen [Eremanthus incanus (Less.) Less. and Cordiera concolor (Cham.) Kuntze] and the other two were deciduous [Kielmeyera regalis Saddi. and Microstachys corniculata (Vahl) Griseb.]. The rainfall and photoperiod for the studied period are represented in Figure 2.
The average angle (µ) and the length of the mean vector (r) of leaf fall beginning and peak for each studied species are represented in Table I. In general, leaf fall’s beginning appeared to be more synchronized than leaf fall’s peak. E. incanus, K. regalis, Calyptranthes cordata O. Berg, and C. concolor had synchrony above 0.9, for both leaf fall beginning and peak (see r values in Table I). The overall data used in circular analysis showed a significant central tendency of the leaf fall beginning in early April (i.e., end of wet season) (Z = 92.57; P< 0.001) and the leaf fall peak in early August (i.e., end of dry season) (Z = 69.02; P< 0.001) (Table II). Leaf fall was synchronized among the studied species: the length of the mean vector (r) was 0.794 and 0.685, for the beginning and peak of leaf fall, respectively (Table II). When all species were analyzed together, data was strongly influenced by groups with different phenological strategies and growth forms that have more species and consequently, more individuals (e.g., semi-deciduous and shrubs).
There was a significant difference in leaf fall timing among phenological groups (Watson-Willians, P< 0.01 for all pairs). Deciduous species started the leaf fall earlier than the other species (in March, end of wet season, Fig. 3a) (Z = 13.106; P< 0.001). Semi-deciduous species started it in April (beginning of dry season, Fig. 3a) (Z = 76.962; P< 0.001), and evergreen species in May (Z = 13.584; P< 0.001). The leaf fall peak was different only between evergreen and semi-deciduous (F = 5.013; P< 0.05). The time between the beginning and peak of leaf fall also differed among phenological different groups (Watson-Willians, P< 0.05 for all pairs). Evergreen species reached their leaf fall

An Acad Bras Cienc (2017) 89 (1)
LEAF PHENOLOGY OF CANGA WOOD SPECIES 137
peak in a shorter time than semi-deciduous and deciduous species (Table III).
Evergreen species showed continuous leaf flushing through the study period; semi-deciduous species showed slight pauses, while deciduous species had the longest leafless period (Fig. 3b). Leaf flushing frequency was high during the rainy season, decreasing in March (i.e., end of the rainy season) in deciduous species, and two months later in semi-deciduous species. The lowest frequency of leaf flushing was reached in July, and it increased at the end of the dry season (Fig. 3b). Some species showed no leaf flushing during the dry season, followed by highly synchronized flushing at the
beginning of the wet season, as occurred with the deciduous K. regalis.
Despite this apparent relationship between leaf phenology and precipitation, the multiple stepwise regression analyses showed no significance. However, leaf fall intensity showed a significant negative relationship to photoperiod of the previous month (r2= 0.2522, F= 75.248, P < 0.0001, Fig. 4).
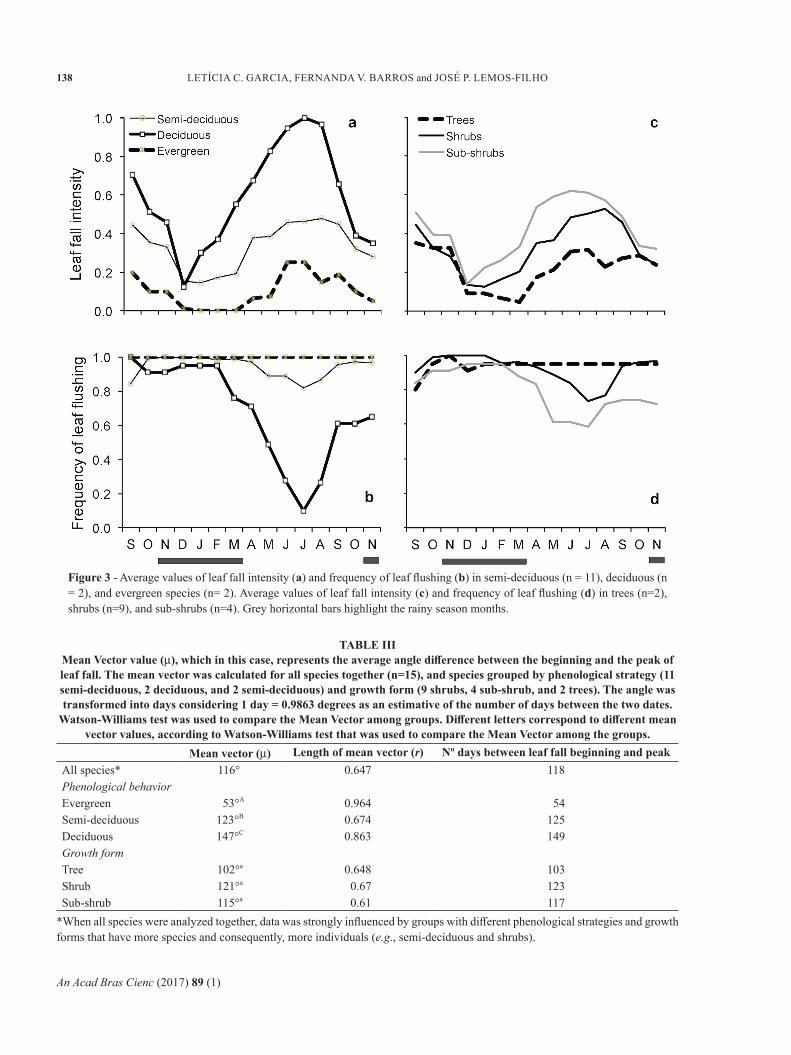
Regarding the growth form of the studied species, two of them were considered trees, nine shrubs, and four sub-shrubs (Table I). The phenological behavior of these different growth forms is exhibited in Figure 3 (c-d), showing in general that sub-shrubs species had a tendency of
taBLE ii Result of circular statistics on the phenological variables analyzed for all species together (n=15) and species grouped by phenological strategy (11 semi-deciduous, 2 deciduous, and 2 semi-deciduous) and growth form (9 shrubs, 4 sub-
shrub, and 2 trees). Mean Vector value (µ) is the average angle of each group; the Length of Mean Vector (r) represents the synchrony of the phenophase; the date is the correspondent month to mean vector angle; and the Rayleigh Test
(Z) is the statistic of circular analysis (i.e., it points out the probability of data being randomly distributed around the circle of 360°). Different superscript letters correspond to different mean vector values, according to Watson-Williams
test, which was used to compare the mean Vector among the groups. Mean vector (µ) Length of mean vector (r) date RayleighTest (Z) P value
Leaf fall beginningAll species* 93° 0.794 Early April 92.572 < 0.001Phenological behaviorEvergreen 139°C 0.731 May 13.584 < 0.001Semi-deciduous 93°B 0.859 Early April 76.962 < 0.001Deciduous 60°A 0.872 Early March 13.106 < 0.001Growth formTree 112°b 0.821 April 14.141 < 0.001Shrub 98°b 0.792 Early April 54.559 < 0.001Sub-shrub 74°a 0.859 March 28.77 < 0.001Leaf fall peakAll species* 213° 0.685 Early August 69.02 < 0.001Phenological behaviorEvergreen 191°A 0.736 July 10.841 < 0.001Semi-deciduous 220°B 0.64 August 44.838 < 0.001Deciduous 206°AB 0.96 Late July 16.455 < 0.001Growth formTree 212°ab 0.408 Early August 3.49 < 0.05Shrub 221°b 0.765 August 50.862 < 0.001Sub-shrub 195°a 0.71 July 19.672 < 0.001*When all species were analyzed together, data was strongly influenced by groups with different phenological strategies and growth forms that have more species and consequently, more individuals (e.g., semi-deciduous and shrubs).
An Acad Bras Cienc (2017) 89 (1)
138 LeTícIA c. GArcIA, FernAndA V. BArros and JOSé P. LEMOS-FILHO
Figure 3 - Average values of leaf fall intensity (a) and frequency of leaf flushing (b) in semi-deciduous (n = 11), deciduous (n = 2), and evergreen species (n= 2). Average values of leaf fall intensity (c) and frequency of leaf flushing (d) in trees (n=2), shrubs (n=9), and sub-shrubs (n=4). Grey horizontal bars highlight the rainy season months.
taBLE iii Mean Vector value (µ), which in this case, represents the average angle difference between the beginning and the peak of leaf fall. The mean vector was calculated for all species together (n=15), and species grouped by phenological strategy (11 semi-deciduous, 2 deciduous, and 2 semi-deciduous) and growth form (9 shrubs, 4 sub-shrub, and 2 trees). The angle was transformed into days considering 1 day = 0.9863 degrees as an estimative of the number of days between the two dates.
Watson-Williams test was used to compare the Mean Vector among groups. Different letters correspond to different mean vector values, according to Watson-Williams test that was used to compare the Mean Vector among the groups.
Mean vector (µ) Length of mean vector (r) Nº days between leaf fall beginning and peakAll species* 116° 0.647 118 Phenological behaviorEvergreen 53°A 0.964 54Semi-deciduous 123°B 0.674 125Deciduous 147°C 0.863 149Growth formTree 102°a 0.648 103Shrub 121°a 0.67 123Sub-shrub 115°a 0.61 117
*When all species were analyzed together, data was strongly influenced by groups with different phenological strategies and growth forms that have more species and consequently, more individuals (e.g., semi-deciduous and shrubs).

An Acad Bras Cienc (2017) 89 (1)
LEAF PHENOLOGY OF CANGA WOOD SPECIES 139
higher leaf fall intensity and lower leaf flushing frequency than trees and shrubs. The leaf flushing frequency was almost constant for trees. Sub-shrubs, shrubs, and trees differed from each other in their leaf fall beginning (Watson-Willians, P< 0.01 for both pairs, Table II). The circular analysis pointed out a central tendency of sub-shrubs leaf fall to begin in March (Z = 28.77; P< 0.001), and shrubs (Z = 54.559; P < 0.001) and trees, in April (Z = 14.141; P < 0.001). The leaf fall peak only differed between shrubs and sub-shrubs (Watson-Willians, P< 0.01) (Table II). The peak of leaf fall for sub-shrubs was in July (Z = 19.672; P < 0.001) and for shrubs it was in August (Z = 50.862; P < 0.001). The timing between the beginning and the peak of leaf fall did not differ among growth form groups (Watson-Willians, P> 0.05 for all pairs) (Table III).
discussion
BIF species exhibited different leaf exchange patterns in response to the stressful conditions imposed by this environment. The majority of species had a semi-deciduous behavior and shed their leaves mainly during the dry season, with the leaf flushing at the end of this season. despite the remarkable dry season, our results lead us to suggest that photoperiod, more than precipitation, drives
the leaf phenology of BIF species, independent of growth forms (trees, shrub, and sub-shrub).
In dry environments, evergreen and deciduous species coexist in different proportions, depending upon humidity and soil conditions (Murphy 1986). BIF species were initially posited to exist under a trade-off between two conflicting priorities: replacement of leaves in the face of temporal availability of resources (deciduous species) or maintenance of leaves (evergreen species) in face of general resource poverty. According to Grime (2002), species in the least fertile environments retain their crowns to save resources, thus behaving mainly as evergreens. In this study, only two species were evergreens and we found mostly semi-deciduous species. Grime’s hypothesis was that few species would lose all their leaves in stressful environments and our present study supports this, as only 13% of species were deciduous. The timing between leaf fall beginning and peak observed in this work could be an indicative of different leaf life-span among evergreen, semi-deciduous, and deciduous species, with a longer leaf life-span in the first two groups of species when compared to the last one. Species with long leaf lifespan would have a strategy to reduce the nutrient cycling rates between plants and soil, minimizing leaching loss (Monk 1996). This includes the highly efficient nitrogen translocation from old leaves to the new organs sinks (Hikosaka 2005).
The slow growth of species under stressing periods can also be interpreted as an important defense mechanism, like an escape strategy against some herbivores. Considering the preference of herbivores for young leaves, instead of expanded ones (Lieberman and Lieberman 1984), plants should avoid their production of buds during the peak period of folivory activity. The leaf expansion during low rainfall could reduce leaf consumption by herbivore insects (Murali and Sukumar 1993), as they emerge from their diapauses after the first rains (Wright 1996). According to our data, leaf
Figure 4 - Negative relationship between leaf fall intensity and photoperiod (minutes) of the previous month (r2= 0.2522, F= 75.248, P<0.0001) highlighting semi-deciduous, deciduous, and evergreen species.

An Acad Bras Cienc (2017) 89 (1)
140 LeTícIA c. GArcIA, FernAndA V. BArros and JOSé P. LEMOS-FILHO
shooting restarted at the end of the dry season for deciduous and semi-deciduous species. The start of shoot growth a few months before the rainy season could prevent herbivore damage. This may be an adaptive behavior in tropical ecosystems, to the increase of day length after the spring equinox, which is an indicator of the upcoming rainy season (Riveira et al. 2002). Early shooting, before the wet season, allows plants to maximize their growth when this favorable growing period arrives (Bollen and donati 2005). Therefore, plants from different but unproductive and dry environments could respond with similar strategies to save energy, regardless of geographical area.
Another important factor is the anti-herbivore defense. Species with persistent leaves have better defense mechanisms than species with ephemeral leaves (coley and Barone 1996). Then, to escape from injury and offset the low investment in defense mechanisms, leaves of deciduous and semi-deciduous species may expand quickly, flush synchronously, or be produced during the dry season when herbivores are rare (Coley and Barone 1996), like observed in our study.
Leaf phenological behavior seems differed among study species’ growth form; however, we are aware of the limitations of low number of tree species, which is a consequence of low diversity of tree species in the studied open herbaceous-shrub vegetation. Sub-shrubs species had earlier leaf fall and leaf flushing diapauses than trees and shrubs. The majority of the studied species were considered shrubs, a predominant growth form for plant species that occur in BIF environments. In general, they exhibited leaf fall increasing during the dry season and leaf flushing increasing at the end of the dry season, with the highest frequency during the rainy season. It had been mentioned that shrub species from stressful environments can extract water from dry soils at low water potential or present root foraging strategy that enhance water uptake (Butcher et al. 2009, Messias et al.
2011). Further investigations involving growth form and root systems in ferruginous fields are required (Schenk and Jackson 2002) to clarify their consequences on leaf phenology.
The timing of leaf fall and leaf flushing are usually linked with changes in environmental conditions (Fenner 1998). This study shows an important relationship between photoperiod and the synchrony of phenological events. Leaf fall intensity showed a significant negative relationship to photoperiod of the previous month. Dominant effect of photoperiod as a predictable trigger of phenology when compared to rainfall was also found by Marques et al. (2004) for different life form species of Araucaria Forest in Southern Brazil. Considering that in the tropics, the inter-annual variability in rainfall is large (Borchert 1998) and the photoperiod does not change from year to year or with climate (Bauerle et al. 2012), the decline of photoperiod appears to be an inductor of high synchronism in the timing of leaf abscission. The beginning of leaf shedding and decreasing of new leaf production would be then heralded by the coming dry season. The decrease in day length indicates an upcoming less productive season and its increase, after the spring equinox, indicates an upcoming rainy season (Riveira et al. 2002), which can be a favourable period for plant growth. In BIF, trees show continuous leaf flushing, but shrubs and sub-shrubs, which are the most common growth form in this environment, increase new leaf production at the end of dry season. The photoperiodic modulation on leaf phenology of BIF species certainly promotes their fitness in this stressful environment by optimizing their photosynthetic gain during the wet season.
ACKNOWLEDGMENTS
We are grateful for A. Townsend Peterson, erik Veneklaas, Mike Perring, Danilo Bandini Ribeiro, Mariana Cruz Campos, and two anonymous reviewers for thoughtful comments and suggestions

An Acad Bras Cienc (2017) 89 (1)
LEAF PHENOLOGY OF CANGA WOOD SPECIES 141
on earlier version and to Hannah Doerrier for English revision. We also thank the Vale S.A. for access to the study area and funding source; conselho nacional de desenvolvimento científico e Tecnológico (cnPq) and Fundação de Amparo à Pesquisa de Minas Gerais (FAPEMIG) for providing essential financial support for this work. We thank João R. Stehmann, Ana M. Oliveira, and Marcos E.G. Sobral for species identification; Brenda Vartuli for field assistance; and Maria r.s. Muzzi and nadja M.H.s. carneiro for logistic assistance. We are thankful for Companhia Energética de Minas Gerais (CEMIG) for the meteorological information about the Hydroelectric Power Plant of Peti.
rEFErEncEs
AnTunes FZ. 1986. Caracterização climática do Estado de Minas Gerais: climatologia agrícola. Informe Agropecuário 12: 9-3.
BALLesTrInI c, TeZArA W And HerrerA A. 2011. Environmental drivers of leaf phenology in trees of the tropical species Ficus obtusifolia. Braz J Plant Physiol 23: 113-122.
BAuerLe WL, oren r, WAy dA, QIAn ss, sToy Pc, THornTon Pe, BoWden Jd, HoFFMAn FM AND REYNOLDS RF. 2012. Photoperiodic regulation of the seasonal pattern of photosynthetic capacity and the implications for carbon cycling. PNAS 109: 1-6.
BoLLen A And donATI G. 2005. Phenology of the littoral forest of Sainte Luce, southeastern Madagascar. Biotropica 37: 32-43.
BorcHerT r, cALLe Z, sTrAHLer AH, BAerTscHI A, MAGILL RE, BROADHEAD JS, KAMAU J, nJoroGe J And MuTHurI c. 2015. Insolation and photoperiodic control of tree development near the equator. New Phytol 205: 7-13.
BorcHerT r, rIVerA G And HAGnAuer W. 2002. Modification of vegetative phenology in a tropical semi-deciduous forest by abnormal drought and rain. Biotropica 34: 27-39.
BorcHerT r. 1998. Responses of tropical trees to rainfall seasonality and its long-term changes. Clim Change 39: 381-393.
BuTcHer PA, Mcnee sA And KrAuss sL. 2009. Genetic impacts of habitat loss on the rare ironstone endemic Tetratheca paynterae subsp. paynterae. Conserv Genet 10: 1735-1746.
COLEY PD AND BARONE JA. 1996. Herbivory and plant defenses in tropical forests. Annu Rev Ecol Syst 27: 305-335.
druMMond GM, MArTIns cs, MAcHAdo ABM, seBAIo FA And AnTonInI y. 2005. Biodiversidade de Minas Gerais: um atlas para sua conservação. Fundação Biodiversitas, Belo Horizonte, MG, Brazil.
DUFF GA, MYERS BA, WILLIAMS RJ, EAMUS D, O’GRADY A AND FORDYCE IR. 1997. Seasonal patterns in soil moisture, vapor pressure deficit, tree canopy cover, and pre-dawn water potential in northern Australian savanna. Aust J Bot 45: 211-224.
EAMUS D. 1999. Ecophysiological traits of deciduous and evergreen woody species in the seasonally dry tropics. Trends ecol evol 14: 11-16.
eITen G. 1992. Formas de crescimento das plantas vascula-res. In: Barros MAG (Ed), Boletim Informativo do Herbá-rio da Universidade de Brasília. Universidade de Brasília, Brasília, p. 6-13.
ESCUDERO A AND MEDIAVILLA S. 2003. Decline in photosynthetic nitrogen use efficiency with leaf age and nitrogen resorption as determinants of leaf life span. J Ecol 91: 880-889.
FENNER M. 1998. The phenology of growth and reproduction in plants. Perspect Plant Ecol 1: 78-91.
FOURNIER LA. 1974. Un método cuantitativo para la me-dición de características fenológicas en árboles. Turrialba 24: 422-423.
GARCIA LC, BARROS FV AND LEMOS-FILHO JP. 2009. Fructification phenology as an important tool in the recovery of iron mining areas in Minas Gerais, Brazil. Braz J Biol 69: 887-893.
GenInI J, GALeTTI M And MoreLLATo LP. 2009. Fruiting phenology of palms and trees in an Atlantic rainforestland-bridge island. Flora 204: 131-145.
GIBson n, yATes cJ And dILLon r. 2010. Plant communities of the ironstone ranges of South Western Australia: hotspots for plant diversity and mineral deposits. Biodivers Conserv 19: 3951-3962.
GILL ds, AMTHor Js And BorMAnn FH. 1998. Leaf phenology, photosynthesis, and the persistence of saplings and shrubs in a mature northern hardwood forest. Tree Physiol 18: 281-289.
GIuLIeTTI AM, PIrAnI Jr And HArLey rM. 1997. Espinhaço range region – eastern Brazil. In: DAVIS SD, HEYWOOD VH, HERRERA-MACBRYDE o, VILLA-LoBos J And HAMILTon Ac (Eds), Centers of plant diversity: a guide and strategy for their conservation. Volume 3. The Americas. WWF Publications Unit, Cambridge, p. 397-404.
GIVnIsH TJ. 2002. Adaptive significance of evergreen vs. deciduous leaves: solving the triple paradox. Silva Fenn 36: 703-743.

An Acad Bras Cienc (2017) 89 (1)
142 LeTícIA c. GArcIA, FernAndA V. BArros and JOSé P. LEMOS-FILHO
GRIME JP. 2002. Plant strategies, vegetation processes, and ecosystem properties. J Wiley & Sons Ltd, Chichester, England.
HERZS N. 1978. Metamorphic rocks of the Quadrilátero Fer-rífero, Minas Gerais, Brazil. US Geology Survey 641-C: 1-81.
HIKOSAKA K. 2005. Leaf canopy as a dynamic system: ecophysiology and optimaly in leaf turnover. Ann Bot 95: 521-533.
JACOBI CM AND CARMO FF. 2011. Life-forms, pollina-tion, and seed dispersal syndromes in plant communities on ironstone outcrops, SE Brazil. Acta Bot Bras 25: 395-412.
JAcoBI cM, cArMo FF, VIncenT rc And sTeHMAnn Jr. 2007. Plant communities on ironstone outcrops - a diverse and endangered Brazilian ecosystem. Biodivers Conserv 16: 2185-2200.
JOLLY WM AND RUNNING SW. 2004. Effects of precipitation and soil water potential on drought deciduous phenology in the Kalahari. Glob Change Biol 10: 303-308.
KIKUZAWA K. 1995. Leaf phenology as an optimal strategy for carbon gain in plants. Can J Bot 73: 158-163.
KOVACH WL. 2002. Oriana for Windows, Version 2.02. Kovach Computing Services, Pentraeth, Wales, UK.
KRöBER W AND BRUELHEIDE H. 2014. Transpiration and stomatal control: a cross-species study of leaf
traits in 39 evergreen and deciduous broadleaved subtropical tree species. Trees 28: 901-914.
LEMOS-FILHO JP AND MENDONçA FILHO CV. 2000. Seasonal change in the water status of three wood legumes from the Atlantic Forest, caatinga, Brazil. J Trop ecol 16: 21-32.
LIEBERMAN D AND LIEBERMAN M. 1984. The causes and consequences of synchronous flushing in a dry tropical forest. Biotropica 16: 193-201.
LuTTGe u And HerTeL B. 2009. Diurnal and annual rhythms in trees. Trees 23: 683-700.
MARQUES MCM, ROPER JJ AND SALVALAGGIO APB. 2004. Phenological patterns among plant life-forms in a subtropical forest in southern Brazil. Plant Ecol 173: 203-213.
MessIAs McTB, LeITe MGP, MeIrA-neTo JAA And KoZoVITs Ar. 2011. Life-form spectra of quartzite and itabirite rocky outcrop sites, Minas Gerais, Brazil. Biota Neotrop 11: 255-268.
MONK CD. 1996. An ecological significance of evergreeness. Ecology 47: 504-505.
MoreLLATo LPc, rodrIGues rr, LeITão FILHo HF AND JOLY CA. 1989. Estudo comparativo da fenologia de espécies arbóreas de floresta de altitude e floresta semidecídua na Serra do Japí, Jundiaí, São Paulo. Rev Bras Bot 12: 85-98.
Mourão A And sTeHMAnn Jr. 2007. Levantamento da flora do campo rupestre sobre canga hematítica couraçada remanescente na Mina do Brucutu, Barão de Cocais, Minas Gerais, Brasil. Rodriguésia 58: 775-785.
MURALI KS AND SUKUMAR R. 1993. Leaf flushing phenology and herbivory in a tropical dry forest, southern India. Oecologia 94: 114-119.
MURPHY PG. 1986. Ecology of tropical dry forest. Annu Rev Ecol Evol Syst 17: 67-88.
PedronI F, sáncHeZ M And sAnTos FAM. 2002. Fenologia da copaíba (Copaifera langsdorffii Desf.- Legu-minosae, Caesalpinoideae) em uma floresta semidecídua no sudeste do Brasil. Rev Bras Bot 25: 183-194.
PorTo ML And sILVA MFF. 1989. Tipos de vegetação metalófila em áreas de carajás e de Minas Gerais. Acta Bot Bras 3: 13-21.
REICH P. 1995. Phenology of tropical forests: patterns, causes, and consequences. Can J Bot 73: 164-174.
REICH PB. 2014. The world-wide ‘fast-slow’ plant economics spectrum: a traits manifesto. J Ecol 102: 275-301.
rIVeIrA G, eLLIoTT s, cALdAs Ls, nIcoLossI G, corAdIn VTr And BorcHerT r. 2002. Increasing day-length induces spring flushing of tropical dry forest trees in absence of rain. Trees 16: 445-456.
rIZZInI cT. 1979. Tratado de fitogeografia do Brasil. Aspectos sociológicos e florísticos. HucITec/edusP, São Paulo, p. 374.
SCHENK HJ AND JACKSON RB. 2002. Rooting depths, lateral root spreads, and below-ground/above-ground allometries of plants in water-limited ecosystems. J Ecol 90: 480-494.
SILVA MFF, SECCO RS AND LOBO MGA. 1996. Aspectos ecológicos da vegetação rupestre da serra dos carajás, estado do Pará, Brasil. Acta Amaz 26: 17-44.
sILVeIrA FAo eT AL. 2015. Ecology and evolution of plant diversity in the endangered campo rupestre: a neglected conservation priority. Plant Soil, p. 1-24.
TeIxeIrA WA And LeMos-FILHo JP. 1998. Metais pesados em folhas de espécies lenhosas colonizadoras de uma área de mineração de ferro em Itabirito, Minas Gerais. Rev Árvore 22: 381-387.
VAn scHAIK cP, TerBorGH JW And WrIGHT SJ. 1993. The phenology of tropical forests – adaptive significance and consequences for primary consumers. Annu Rev Ecol Syst 24: 353-377.
VIANA PL AND LOMBARDI JA. 2007. Florística e carac-terização dos campos rupestres sobre canga na Serra da Calçada, Minas Gerais, Brasil. Rodriguésia 58: 159-177.
VIncenT rc, JAcoBI c And AnTonInI y. 2002. diversidade na adversidade. ciênc Hoje 31: 64-67
VIncenT rc And MeGuro M. 2008. Influence of soil proprieties on the abundance of plant species in ferruginous

An Acad Bras Cienc (2017) 89 (1)
LEAF PHENOLOGY OF CANGA WOOD SPECIES 143
rocky soils vegetation, southeastern Brazil. Rev Bras Bot 31: 377-388.
WAy dA And MonTGoMery RA. 2015. Photoperiod constraints on tree phenology, performance and migration in a warming world. Plant Cell Environ 38: 1725-1736.
WrIGHT sJ. 1996. Phenological responses to seasonality in tropical forest plants. In: MULKEY SS, CHAZDON RL
And sMITH AP (eds), Tropical forest ecophysiology. Chapman and Hall, New York, p. 440-460.
ZAR JH. 1996. Biostatistical analysis. Prentice Hall, Upper Saddle River, New Jersey
ZHAnG yJ, yAnG Q, Lee dW, GoLdsTeIn G And CAO K. 2013. Carbon balance of an Asian subtropical cloud forest. Oecologia 173: 721-730.