Environmental assessment of ultra-high pressure homogenization for milk...
76
Environmental assessment of ultra-high pressure homogenization for milk and fresh cheese production Lucia Valsasina Master thesis Department of Development and Planning Aalborg University, Denmark June 2015
Transcript of Environmental assessment of ultra-high pressure homogenization for milk...
!
Environmental assessment of
ultra-high pressure homogenization for milk and
fresh cheese production !
Lucia Valsasina Master thesis
Department of Development and Planning
Aalborg University, Denmark
June 2015

!
i
Title Environmental assessment of ultra-high pressure homogenisation for milk and fresh cheese production Topic of the semester 4th Semester – Master thesis Project period January 2015 – June 2015 Signature Lucia Valsasina Aalborg University Environmental Management and Sustainability Science School of Architecture, Design and Planning Department of Development and Planning Vestre Havnepromenade 5,1. 9000 Aalborg Supervisor Assoc. Prof. Massimo Pizzol Copies: 2 Pages: 71 Appendixes: 2 Frontpage picture source From Tetrapak’s UHT technology for milk and dairy product, retrieved from: http://www.tetrapak.com/products-and-services/processing-equipment/dairy-equipment/uht-treatment
Abstract. Dairy products are responsible for 8 to 10% of environmental impacts of European consumption (Weidema et al. 2009). Businesses have to respond to an increasing pressure for higher quality products, while still maintaining competitive prices. This study analyses the application of Ultra-high pressure Homogenisation (UHPH), an innovative technology for food sterilisation that relies on pressure up to 400MPa, for the treatment of cow milk. The technology is forseen to provide equal or higher quality products compared to the combination of Ultra High Temperature (UHT) and Homogenisation treatment and, at the same time, to lower energy consumptions through the combination of sterilisation and homogenisation in a single process. Furthermore, the use of UHPH treated milk for the production of fresh cheese has been proven to increase shelf life from ~13 to ~19 days and yield from 11 to 14% (Escobar 2011; Zamora and Guamis 2014). This study provides an LCA of UHPH and UHT processing of milk and fresh cheese production from processing to end-of-life. Pilot scale data was collected for the following cases: UHPH equipment with capacity of 90l/h was tested with water, buffer, skimmed milk (1.5%) and whole milk (3.5%); UHPH with capacity of 360l/h with water; and an 85l/h indirect UHT system, including upstream homogenisation, tested with water. As the first case showed no difference in energy consumption for the four compounds, only water was used for the following tests. UHPH is a technology not yet used industrially, power-law relationships were used to model the relationship between the equipment’s main variables, such as capacity and energy use, as scale increases. The results of this study show that UHPH is more environmentally beneficial at pilot scale due to lower water and energy consumptions. Savings of approximately 14% are predicted for electricity alone. However, at industrial scale UHT systems ensure an energy recovery of approximately 90%, which is hardly achieveble with UHPH at current technology development level. On the other hand UHPH has a potential of reaching at least 43% of energy savings and carbon dioxide emission reduction; and further resuctions are possible with a long term perspective. Moreover higer quality milk could result from UHPH treatment. Up scaling of UHPH showed the increase in efficiency for different pilot scale and confirmed the linear relatiosnhip between energy use, capacity and speed for UHPH homogenisers. The increase in shelf life of fresh cheese produced from UHPH milk will bring benefits at larger scale due to reduction in food waste and resource use.

ii

iii
Acknowledgements I whish to express my sincere thanks to my supervisor Associate Professor Massimo Pizzol, for his guidance in the writing of this thesis and his continuous support in the past two years. I would like to thank Sergiy Smetana, for his help, comments, encouragement and patience during the all process. My gratitude goes to Dr. Alexander Mathys for giving me the chance and resources to conduct this research. I whish to thank Dr. Erika Georget, Kemal Aganovic and Peng Dong for their help in getting closer to a topic new to me and for making my internship experience one to remember. Lastly, I am lucky to have a family that allowed me to have many wonderful experiences travelling around the word and friends supporting me from near and far. I would like to thank them and all the people that have been close to me.

iv
Table of contents
ACKNOWLEDGEMENTS...........................................................................................................................................III!TABLE.OF.CONTENTS...............................................................................................................................................IV!
LIST.OF.ABBREVIATIONS........................................................................................................................................VI!
1..INTRODUCTION.......................................................................................................................................................1!1.1!ASSESSING!THE!ENVIRONMENTAL!IMPACT!OF!INNOVATIVE!TECHNOLOGIES!................................................................!3!1.1.1#Eco'design#and#life#cycle#assessment#.......................................................................................................................#3!1.1.2#Scaling#up#environmental#impacts#...........................................................................................................................#4!1.1.3#LCA#in#the#milk#industry#................................................................................................................................................#5!
1.2!MILK!AS!A!PRODUCT!................................................................................................................................................................!8!1.2.1#Milk#processing#..................................................................................................................................................................#8!1.2.2#Homogenisation#................................................................................................................................................................#9!1.2.3#Milk#properties#...............................................................................................................................................................#10!
2.PROBLEM.FORMULATION.&.RESARCH.QUESTIONS..................................................................................12!
3.METHODOLOGY.....................................................................................................................................................13!3.1!LIFE!CYCLE!ASSESSMENT!.....................................................................................................................................................!13!3.1.1#Goal#and#scope#................................................................................................................................................................#13!3.1.2#Functional#unit#...............................................................................................................................................................#13!3.1.3#System#boundaries#........................................................................................................................................................#14!3.1.4#Data#collection#................................................................................................................................................................#15!3.1.5#Modelling#approach#and#LCA#tool#..........................................................................................................................#15!3.1.6#Life#cycle#impact#assessment#method#...................................................................................................................#16!3.1.7#Capital#good#.....................................................................................................................................................................#17!3.1.8#Change#in#waste#production#due#to#increase#in#shelf#life#.............................................................................#17!3.1.9#Ultra'high#pressure#homogenisation#....................................................................................................................#18!3.1.10#Ultra#high#temperature#............................................................................................................................................#19!
3.2!LIFE!CYCLE!INVENTORY!........................................................................................................................................................!21!3.2.1#UHPH#90l/h#and#UHT#85l/h#.....................................................................................................................................#21!3.2.2#UHPH#360l/h#...................................................................................................................................................................#33!3.2.3#Fresh#cheese#.....................................................................................................................................................................#36!3.2.4#The#issue#of#energy#recovery#....................................................................................................................................#43!
3.3!SCALING!UP!METHODOLOGY!................................................................................................................................................!43!4.RESULTS...................................................................................................................................................................47!4.1!LIFE!CYCLE!IMPACT!ASSESSMENT!.......................................................................................................................................!47!
v
4.1.1#Process#contribution#....................................................................................................................................................#49!4.1.2#Fresh#cheese#production#.............................................................................................................................................#51!4.1.3#Electricity#sensitivity#....................................................................................................................................................#54!4.1.4#The#issue#of#energy#recovery:#results#....................................................................................................................#55!
4.2!SCALING!LAWS!APPLIED!TO!ENVIRONMENTAL!IMPACT!ASSESSMENT!.........................................................................!56!5.DISCUSSION............................................................................................................................................................57!
Further#research:#drugs#and#cosmetics#..........................................................................................................................#60!Limitations#..................................................................................................................................................................................#60!
6.CONCLUSION...........................................................................................................................................................61!
REFRENCE.LIST.........................................................................................................................................................62!APPENDIX.A.–.LIFE.CYCLE.INVENTORY.EXCEL.WORKSHEET....................................................................70!
APPENXIX.B.–.COMPRESSED.AIR.........................................................................................................................71!

vi
List of abbreviations
CIP Cleaning in place
ER Energy recovery
FU Functional unit
GHG Greenhouse gasses
LCA Life cycle assessment
MSW Municipal solid waste
UHPH Ultra-high pressure homogenisation
UHT Ultra high temperatures

!
1
1. INTRODUCTION The elephant in the room might actually be a cow (Bardnard 2014; Pearson 2014). Popular science adopted this saying to bring attention to the impact of food production, which is responsible for a third of anthropogenic emissions (Gilbert 2012). This issue is central in mitigation as, not only it is one of the main contributors, but it is itself affected by climatic changes, such as variations in rainfall seasonality, temperatures etc. It is therefore vital to invest in increased efficiency and decreased resource use to limit the sector’s impact, while at the same time fighting malnutrition and ensuring food safety. The agricultural industry is vital for many economies, not only for countries that have historically based their trading on primary production but also for the majority of lower income countries. The food market is in constant transformation as population, diets and consumer awareness evolve following globalisation and technological development (Pagan et al. 2005). Milk has gradually become a key commodity on international markets. In the last 50 years worldwide production has increased by 100% as livestock doubled and yield grew by 30%. North America and Europe have seen a reduction in the number of livestock, while increase in production has been ensured by technological advancement and specialization, which result in high yield. Asia has experienced a drastic intensification of rearing in combination with greater yield and the same trend characterised South America and Oceania in a smaller scale. Africa had the highest increase in livestock (293%) maintaining a similar milk production per head (Table 1). Table 1. Number of milk bovines, yield per bovine and production per geographical area (FAOstats 2015)
Milk Animals Yield Production
(million head) (tonnes/head) (million tonnes)
Regions Year Difference
in %
Year Difference
in %
Year Difference
in % 1961 2012 1961 2012 1961 2012
World 177 270 52% 1.77 2.32 31% 25 31 100%
Africa 17 67 293% 0.46 0.51 11% 314 626 338%
Asia 34 105 205% 0.62 1.62 163% 84 182 703%
Europe 83 38 -55% 2.27 5.58 146% 21 170 11%
Germany 8 4 -47% 3.11 7.28 134% 190 210 23%
North America 20 10 -50% 3 10 202% 65 99 52%
South America 14 36 160% 1 2 80% 14 66 367%
Oceania 5 7 32% 2.25 4.38 94% 12 30 157%

2
Chinese consumers are one of the biggest drivers of increased production of milk. The country’s adoption of a more westernized lifestyle is expected to increase imports from 14.3% to 34.5% of total demand (Yaron 2014; Meyer 2014). The consumption per capita is forecasted to double and, as consumers are willing to pay for better quality, prices will be pushed well above worldwide average (Meyer 2014). With the scandals of diseases, local milk is not trusted by consumers leaving the market open for larger companies, which also receive state financial support (Yaron 2014; Meyer 2014). International producers are investing significant amount of capital to win the largest slice of this market. European producers, freed since March 2015 from quotas, are ready to respond to increased demand. Countries that are historically leaders in this market, such as Germany and Denmark, have invested in production and most of it will be redirected to China. The next decades will be decisive as China could overturn the tables in a matter or years becoming the leading producer of milk in the world, if they maintain the same rate of import of Australian livestock (Meyer, 2014). The market for milk is key as it is interlinked to meat production. The latter market has been characterised by increasing demand as well. Because of higher income rates and the spreading of western culture in developing countries, meat is also taking a larger share in diets. This trend is predicted to continue as developing countries become richer. Growing consumption of these products is contributing to the decrease in malnutrition but they represent a risk for humans, livestock, small farmers and the environment (Muehlhoff et al. 2013). Environmental issues are increasingly gaining importance in global discourse as non-renewable resources availability is at risk. Yasui (2007) indicates the cause of climate change not to be human activities but the “convenient characteristics of fossil fuels”. The food industry represents one of the most demanding sectors, with impact between 20 and 30 % of household consumption, for which meat and dairy are mainly responsible (Flysjö 2012). Dairy accounts for 2.7% of global emissions and of 4% if meat by-products are included (Milani et al. 2011; Flysjö 2012). The main impacts from agricultural products come from farming activities, which is why carbon dioxide is not the only important gas to consider. Methane, nitrous oxide and biogenic carbon oxide from land use, for example, play a key role in the overall impact. Land use is a crucial issue as biofuels represent a valid alternative to fossil fuels but at the same time represent competition to food. The burden of farming is particularly higher in developing countries where, yield per bovine is lower compared to western livestock. CO2 becomes the most relevant emission in the stages after farm-gate (Flysjö 2012). The dairy industry has therefore a great impact globally and given the rising demand and production of developing countries it is necessary to investigate ways to lower the environmental load of the sector. Population growth in developing countries put additional pressure on the development of smart resource management ways (Sakai 2007). This calls for both public and business involvement (Sakai 2007). Life cycle engineering aim is

3
to identify ways to produce effectively keeping in mind the planet’s capacity (Yasui 2007) and, for business, also economical feasibility (Sakai 2007). Most research on food items concentrate only on the farm stage, but process improvements represent an important resource to decrease GHG. This study looks into the assessment of a new food processing technology, which is predicted to decrease energy consumption and provide a better quality product. Ultra-high pressure homogenisation (UHPH) is relatively new equipment that combines homogenisation and sterilisation. The European Union has directed founds to investigate the application in vegetable and animal milk production. The use of UHPH milk is also been analysed for the production of fresh cheese, finding increased shelf life and yield. Given the expected advantages of the technology an LCA is conducted. Moreover the system is compared to an established processing milk treatment, ultra high temperatures (UHT) and to provide an overview of the possibilities of implementation in the industry, power laws are used to predict the scaling behaviour of the equipment.
1.1 Assessing the environmental impact of innovative technologies
1.1.1 Eco-design and life cycle assessment
In order to supply the demand of informed consumers, the research in the food industry strives for innovative solutions for producing safe and high quality food that is also environmentally sound. To achieve these goals investments are directed to the research of processing technologies that deliver higher quality products, increase shelf life, lower resource consumption and decrease costs keeping the prices competitive. This must be integrated with optimised chain management, new business strategies, education and knowledge sharing (Munksgaard 2014). Eco-efficiency is a way to promote these objectives and a better and more competitive production. Technological innovation represents the long-term perspective for successful eco-efficiency, which translates into sustainable development; but moving from an established way of production to a novelty, comes with economic and technological risks (Baroulaki and Veshagh 2007). Life cycle thinking is key approach for eco-design, encouraging the evaluation of the whole product chain from raw materials to end-of-life. Life cycle assessment can support stakeholders, governments and consumers in their decision-making. Producers not only have the chance of understanding the impact of their activities on the environment, which is becoming a key aspect as “greener” products are demanded, but they are provided with insights on where it is possible to reduce energy consumption, resources use and increase efficiency. So, companies can consider what Beroulaki and Veshagh (2007) define as “hidden costs”, which are the ones related to energy and materials that are wasted at production and post-production level. These not only result in economic costs but also in environmental costs. Business should therefore strive for eco-efficiency.

4
1.1.2 Scaling up environmental impacts
Using life cycle assessment as a tool for eco-design brings one of its current limitation to the surface. Innovative technologies are studied at pilot and laboratory scale to assess their performance, but often when considering the application to industrial scale, the consequences of scaling up are not included or cannot be easily estimated. The impact that a technology has at experimental scale does not necessarily have a linear relationship with size and capacity. Caduff et al. (2011, 2012 and 2014) studied the behaviour of different engines as output increases and found that most equipment showed some economies of scale. Even though pilot simulations provide specific and direct data, Shibasaki et al. (2006) identified three main aspects that should be included in LCA studies: first scaling needs to become a key element of analysis on early stage technologies. Many technical aspects, such as yield and efficiency, and practical aspects, such as legislations and costs, vary with scale. Second, processes should not be looked at singularly but they should be seen as a whole with the system in order to use any possible “synergy”. With the term “synergy” the authors refer to the investigation of reusing materials or resources that represent waste in one process but can be a resource for another. Lastly, effective capacity should be a concern, and so the maximum output that could be derived accounting for limits such as quality and time. The efficient output should also be calculated taking into considerations all the processes that contribute to a full-scale production line versus a pilot scale, which is usually more limited (Shibasaki et al. 2006). In the past two years two studies were published that covered the main literature review for this topic. Arvidsson et al (2013) investigated sixteen LCA studies on nanomaterials, which are mainly immature technologies, finding five predominant approaches. The following year Hummen and Kästner (2014) identified four methodologies, which were classified based on two categories of criteria: data and systematic. Arvidsson et al (2013) defined the following five approaches: the first approach, likely scenario, is based on technical considerations and forecasted development; extreme scenarios models the best and the worst case scenario; sensitivity analysis, is typically included in LCA studies to account for variations of certain parameters given different scenarios; exclusion, the novelty is not included in the calculations; mature system, the impact of the new technology is set to be equal to the existing one. The approaches are listed from the most to the least used, even if commonly two or more approaches are combined, but few studies motivate their methodological choice. The authors concluded that likely scenario and sensitivity analysis are more relevant for more mature technologies as they assume a relative knowledge about the system, while the extremes scenario and mature systems approaches are a good basis for a very long-term view for innovative technologies.

5
Hummen and Kästner (2014) identified the following four methods. Simple reduction factors, this approach follows step by step the development of the technology gradually increasing the level of detail. The close examination of technological progress is the main positive aspect, giving a complete overview of the system. On the negative side, at the beginning qualitative data is used and only simple reduction factors are applied for each process individually. The second method is the systematical reduction functions using modular influence estimations; based on already existing studies reduction functions are derived and integrated with experts’ opinions. The combination of extent quantitative data and scenario analysis is a complex task but it does provide a detailed knowledge of the system. The third approach is systematical reduction functions using economies of scale; this category includes Caduff’s (2012) approach of looking at economies of scale and technological scaling. This method gives a good overview of the system as a whole and its potentials, but at the same time lacks specificity as often data is secondary and needs to be standardised. The last methodology is systematical with a neuronal network approach and process modelling, which is based on automatic pattern identification given by a large number of data. The mature system mentioned in Advidsson et al. (2013) study is a part of this category. The quality of the results is high as it is based on direct quantitative data but the predictions are made based on similarities to existing technologies. The paper’s conclusions identify the second method as a good and easy approach, but the economies of scale methodology is the best performing in terms of scaling-up, even though it makes the use of scenarios more difficult. If scenarios are key to the analysis the fourth approach is the best available. The common problematic pointed out in literature is data collection and level of detail. Moreover data that is derived from consultation with expert makes the studies’ validity questionable (Hummen and Kästner 2014). The main conclusion is the need to develop better methodologies to allow the inclusion of environmental evaluations in the early-stages of technologies for a better forecasting.
1.1.3 LCA in the milk industry
Dairy products are a hot spot for climate change mitigation. A life cycle approach is relevant in supporting the analysis of emission reduction actions. The majority of research on this sector concentrated on farming, because it is considered the dominant impact for the majority of food products. On the other hand, studies that focused on processing and other stages of the supply chain, found that farming didn’t have the highest contribution for all impact categories (Eide 2002; Milani et al. 2011). Because of this it is important not to focalise on a single life cycle stage, but to explore the possibility of more efficient processing technologies and of decreasing losses in production, retail and consumer stages (Milani et al. 2011). Emissions before farm gate are mainly due to the techniques used in the production of feed, of dairy and manure management. According to Eide’s (2002) study of two dairy farms in Norway, 90% of total impact of industrial milk production is due to farming. At the

6
same time packaging, transport to retailers and consumers, and energy use in household are relevant life cycle stages to the overall product’s impact. For the climate change impact category, carbon dioxide is the most important gas after farm gate, while methane is dominant in agriculture and waste management. Excluding farming, water consumption mainly derives from cleaning of processing equipment. The author underlines the uncertainties deriving from regional specificities, for example transport distances are on average long in Norway increasing the impact on the photo-oxidant formation category. On the other hand, Norway’s electricity mix is constituted by 90% of hydropower lowering the impact share of electricity production. Further sources of uncertainties are the type of wastewater and consumer’s behaviour in term of transport and waste production, which is hard to predict and model. The processing stage was one of the major hot spot for the smaller scale farm; Eide, in fact, found the larger scale production to be more environmentally sound (Eide 2002). Nutter et al. (2013) concentrated on post-farm stages and González-García (2013) investigated UHT milk production in Portugal, both found that transport, processing and packaging were the main contributors. In Weidema and Wesæs (2008) food industry represents the sector that has the highest contribution to electricity consumption for dairy products (Table 2) and Cashman (2009) estimated electricity consumption at dairy plant to be 12% of overall requirements (Graph 1). Table 2. Main electricity consuming processes for meat and dairy products in % of total consumption (Weidema and Wesæs 2008)
Process Direct Farming Food industry Retail Other Sum Storage of food in household 23.4 0.1 0.6 24 Dairy products 4.1 7.5 1.7 6.2 19 Pork and pork products 1.8 7.9 2.2 7.0 19 Dishwashing in household 7.9 0.04 0.5 8.4 Restaurants and other catering (not incl. food) 6.4 0.1 1.3 7.8
Beef and beef products 0.8 1.9 1.0 3.6 7.2 Cooking in households 7.1 0.1 0.7 7.8 Poultry and poultry products 0.7 0.7 0.4 1.3 3.1 Other 3.3 3.3 Sum 45 7.3 18 5.5 24 100

7
Graph 1. Energy consumption per gallon of packaged milk for different stages of the life cycle (Cashman 2009) Kim et al. (2013) investigated the impact of the production of whey and cheese, mozzarella and cheddar. The results are similar to milk production and farming still remains the dominant stage. For this reason the authors, as suggested by Milani et al. (2011), underline the importance of reducing waste at all stages to avoid higher production. In milk LCA studies the modelling choice between attributional and consequential approach can be important (Milani et al. 2011). Thoma et al. (2013) opted for an attributional approach rather than consequential, because they found that there was not enough data to model substitutes. On the contrary Thomassen et al. (2008) argued that due to the considerable amount of products and activities that are responsible for the impact of dairy production, system expansion provided by the consequential approach is a better approach as it gives a more complete overview, even if it makes for a more complex study. Schmidt and Daalgard (2012) estimated the carbon footprint of dairy farm operations for Denmark and Sweden using different modelling approach. The authors calculated total emissions using consequential and attributional modelling, founding 1.06 and 1.05 kg of CO2 eq. per kg of energy corrected milk (ECM), respectively. Schmidt and Dalgaard, also calculated the carbon footprint following the PAS2050, guidelines of the British Standard institute (BSI), and the methodology of the International Dairy federation (IDF), finding higher results deriving from land use change. The methodological choice results in high emissions as it considers feed production from land that has been redirected in the past 20 years from forest to cultivation.
14%
10% 10%
2%
12% 14% 15%
1% 3%
0.4% 0.4% 3% 3% 4%
8%
0.1% 0% 2% 4% 6% 8%
10% 12% 14% 16%
Ener
gy c
onsu
mpt
ion
(MJ/
gallo
n of
milk
)
Process

8
1.2 Milk as a product
1.2.1 Milk processing
The majority of milk sold today underwent a preservation process (pasteurisation or sterilisation) to ensure its safety and extend its lifetime. Most commonly milk sterilisation is obtained through heat treatments, which consist in subjecting the product to high temperatures for a determinate amount of time. There are different combinations of temperature and time that can result in the production of a commercially sterile product. Higher temperatures and shorter time are preferable to maintain important characteristics of milk, such as pH, colour and taste (APV 2008; Lewis and Deeth 2009). The chemical characteristics of milk and the effect of heat treatments are explained in the following section. There are three main continuous thermal sterilisation processes used at industrial level: UHT and Indirect hydrostatic sterilisation (Georget et al. 2013). The former subjects the product to temperatures that range between 135 and 150 °C for a time of 20 seconds or less (Lewis and Deeth 2009; Bylund 1995); while the latter to temperatures between 115 and 125°C (Georget et al. 2013). The demand for differently treated milk varies for different countries. For example in Germany, consumers’ preference tends towards UHT (Lewis and Deeth 2009). UHT treatment can be achieved through two procedures: indirect or direct heating. In the case of indirect system the heating and processed media never come into contact, hot water or steam passes through a heat exchanger with opposite flow of milk. Direct heating can either be the result of the injection of steam into milk (direct steam injection DSI) or the flow of milk into a steam full chamber (infusion). The main difference between indirect and direct is the relation between temperature and time, the former exposes milk to high temperatures for a longer time, while direct processing reaches the required temperature almost instantaneously (Lewis and Deeth 2009). These differences determine the impact of the two main downsides of thermal processing: the impact on milk characteristics and the demand for energy. Indirect UHT exposes the product to high temperatures for a longer time resulting in, for example, a strong cooked taste in milk and a lower retention of vitamin C. On the other hand indirect processing ensures a 90% energy recovery versus 50% for direct treatment (Lewis and Deeth 2009).
Combined high pressure and moderate to high temperature processes have been identified as having the potential to outperform conventional thermal processing to pasteurise or sterilise food -ie achieving a reduction of the microbial (sporulated) flora - while helping to keep the natural product’s qualities. These treatments are already in place for pasteurisation of products ranging from cooked ham to juices. Commonly, isostatic high pressure treatments subject packaged food to pressures between 100 and 1000 MPa. The the process of high pressure high temperature sterilisation has been approved by the FDA for mash potato, no industrial application exist yet due to the unavailability of industrial scale equipment allowing for homogenous temperature conditions during high isostatic pressure processing. Furthermore, the batch nature of this process has high processing costs. On the other hand, the use of continuous, dynamic high pressure processing via

9
ultra-high pressure homogenisation could allow for similar levels of inactivation in pumpable matrices by combining high pressure up to 400 MPa and high temperatures in a continuous process. This technology has been available since the years 2000 and is already to date available at the pilot scale level with the first industrial prototypes coming on the market (Floury et al. 2002; Georget et al. 2014a), but neither isostatic nor dynamic pressure assisted thermally sterilised milk has been commercialised.
1.2.2 Homogenisation
Milk is natural oil (13%) in water (87%) emulsion (Bylund 1995). Proteins create a membrane that surrounds the fat globules giving it stability (Bylund 1995). As fat globules are light they have the tendency to collect at the top when milk is left untouched in a container. For this reason homogenisation is necessary (Bylund 1995). The homogenisation process causes the rupture of fat globules into smaller droplets so to maintain their dispersity and avoid the creation of cream plugs. In the case of milk, droplets’ diameter is not superior to 2µm after homogenisation (Brennan and Grandison 2012). In the process of homogenisation pressure is applied to the product from pistons or plungers, which are moved by a crankshaft. The amount of pressure is determined by what is defined as back –pressure, which depends on the gap between the valve seat and the forcer (Bylund 1995). Varying on the product, homogenisation is commonly conducted at temperatures between 60 and 70°C, where the higher the temperatures the higher the dispersion of fat globules, and pressures between 10 and 25 MPa. In the late 1990s high-pressure treatment at 100MPa become common and few year later STANSTED produced a homogeniser that could reach 350Mpa (Floury et al 2000), which was a great step for high pressure and entailed a change in valve and chamber design (Floury et al 2004). Valve design is key to the development of homogenisers that could withstand higher pressures, but measurements become harder to obtain as valves become smaller and pressures higher. Floury et al (2004) creates a model to estimate valve and chamber design for future research. In this study we considered equipment that can reach 380MPa. There are two main principles working in high pressure homogenisation: turbulence and cavitation. Turbulence is the effect of pressure in homogenisation. The higher the pressure, the higher the velocity and so the smaller the eddies. Eddies are a type or turbulence, so a twisting of the fluid, which cause the separation of fat globules that have the same dimension. The second principle at work is cavitation. Cavitation is the process where steam bubbles form, when these bubbles pass the valve gap they implode separating oil droplets. Homogenisation can happen in a single or two-stages. The former is used for more viscous product, while the latter for fatter products that need a better homogenisation; in fact the second stage serves as a supplier of continuous back-pressure and as a mean to separate agglomerates that form after the first stage. The positive effects of homogenisation are the avoidance of cream formation, stabilisation of the emulsion and better sensory characteristics. On the other hand homogenisation results in higher chances of variations in flavour given by exposure to light, higher sensitivity to heat variations and this type of milk cannot be used for the production of hard cheese

10
(Bylund 1995). Additionally, high pressure, turbulence and temperature make proteins stabilisation harder (Floury et al. 2004).
1.2.3 Milk properties
Table 3 gives an overview of milk as a product. An important characteristic of milk is its pH values. Milk’s pH is in the range of 6.5 – 6.7 when fresh and at a temperature of approximately 25°C. Milk behaves as a buffer, a buffer is a solution for which pH does not drastically change given an addition of alkaline or acidic base (Bylund 1995). As temperatures increase pH decreases. For an increase in temperature form 20 to 120°C, pH will change from a value of 6.5 to 5.9 (Fox and McSweeney 1998). If pH drops below 6.5, becoming more acid, it is the result of bacterial action (Bylund 1995). Table 3. Quantitative composition and main characteristics of milk (Bylund 1995)
Main constituents Range Average (%) Water 85.5 – 89.5 87.5 Total solids 10.5 – 14.5 13.0 Fat 2.5 – 6.0 3.9 Proteins 2.9 – 5.0 3.4 Lactose 3.6 – 5.5 4.8 Minerals 0.6 – 0.9 0.8 Characteristics Variation Average pH 6.5 – 6.7 6.6 Fat globules diameter 0.1 – 20 µm 3 - 4 µm Fat globules quantity 15 billion per ml
Smaller and disperse globules increase the viscosity of the product (Bakshi and Smith 1984). This increase contributes to the creation of a more stable emulsion (O’Mahony and Fox 2013). Viscosity is defined as a fluid’s resistance to motion and shear stress (ELert 2015) Viscosity is one of the parameters that influences consumers’ perception (Bakshi and Smith 1984), together with colour, odour etc. Change of viscosity during storage is considered as one of the main UHT treatment problems, in particular when looking at direct steam injection and infusion. This process is due to the proteolysis, the fragmentation of casein, and it is influenced by: the conservation temperature, the quality of raw milk, the amount of solids present in the product and the type of processing (Chavan et al. 2011). The best conditions to prevent the excessive increase in viscosity is storage either at 4°C or between 35 and 40°C, while a temperature between 25 and 28°C is the most favourable environment for an increase in the gelation rate (Robertson 2013).
An additional parameter considered is the creaming rate. Creaming is the process where fats rise and, for milk, it results in the creation of two emulsions, cream and skimmed milk.

11
The creaming rate (υ) follows Stokes’ equation:
υ = 2r2 (ρ - ρo) g / 9η
where, (r) indicates the globules radius, (ρ - ρo) is the difference between the globules’ and the medium’s density, (g) is the gravitational acceleration and (η) is medium’s viscosity. From this formula it can be seen how the smaller the droplets are the slower the creaming is, this is therefore important when looking at long-life milk (Floury et al. 2004). Food processing can have an effect on all above listed characteristics. It is therefore important to assess the extent and the relevance of mentioned effects. In case of indirect UHT treatment in combination with homogenisation and of ultra-high pressure homogenisation, the goal is the formation and stabilisation of a fine emulsion. This emulsion needs to be commercially sterile, have a long-life shelf time and needs to meet the requirements of the consumer. The effects of UHPH and UHT on pH and globules size are summarised in Table 4. Table 4. UHPH and UHT effect on milk’s pH and fat globules diameter (Kietczewska et al 2006; Hassan et al 2009)
Characteristics UHPH UHT pH For milk with 2% fat content 6.72 - pH For milk with 4% fat content 6.71 6.17 – 6.85
Fat globules diameter 0.1 – 0.3 µm 0.2 – 2 µm

12
2 PROBLEM FORMULATION & RESARCH QUESTIONS Pre-treatments of milk for consumption need to inactivate microorganisms including bacterial spores (if ambient storage), in order to prevent safety issues or spoiling; moreover they need to ensure homogenisation of the product to avoid the formation of cream. High temperatures have been used for centuries to make milk safe for consumption for longer periods of time. With ultra high temperatures treatments (UHT), milk does not require refrigeration for storage, but textural characteristics change significantly. Ultra-high pressure homogenisation (UHPH) could represent a valid alternative to these industrially established treatments. Thanks to high pressures, microbes are eliminated while at the same time a stable emulsion is created. Sensorial characteristics have been investigated conducting tests on experts and non-experts. The product was perceived to have the same or higher qualities then other milk (Guamis 2007 and 2011). Additionally this technology is expected to have lower energy consumption as it sterilises and homogenise in a single step (Zamora and Guamis 2014; Dumay et al. 2013). UHPH milk has also been studied for the production of fresh cheese, for which higher yield and shelf life was found (Escobar 2011; Zamora and Guamis 2014). Complying with the eco-design and eco-efficiency idea, new technologies need to be assessed under different points of view to optimise efficiency and evaluate benefits and consequences of industrial application. This study wants to provide an environmental assessment of UHPH and give a first input on the scaling behaviour of the equipment. The following research questions were formulated to guide the research:
1) What are the environmental impacts of ultra-high pressure (UHPH) processing for liquid foods? The case of milk production. 1.1) How does UHPH compare to ultra high temperature (UHT) treatment under the environmental perspective?
2) What are the consequences on the environment of extended shelf life and increased yield in fresh cheese produced with UHPH treated milk?
3) What are the foreseeable environmental impacts of UHPH application at industrial scale?

13
3 METHODOLOGY
3.1 Life cycle assessment
3.1.1 Goal and scope
Ultra-high pressure Homogenisation (UHPH) is an innovative technology for liquid food sterilisation (e.g. bovine milk) that relies on pressure up to 400MPa. The technology is foreseen to provide equal or higher quality products compared to Ultra High Temperature (UHT) treatment and, at the same time, to lower energy consumptions through the combination of sterilisation and homogenisation in a single process. Furthermore, the use of UHPH treated milk for the production of fresh cheese has been proven to increase shelf life from ~13 to ~19 days and yield from 11 to 14% (Escobar 2011; Zamora and Guamis 2014). This study provides an LCA of UHPH and UHT processing of milk and fresh cheese production from processing to end-of-life. The study is conducted at the German Institute of Food Technologies (DIL e.V.), a research institution working with innovative food processing technologies. In the context of this study the institute’s aim is to compile a full profile of new technologies under the biochemical and environmental prospective to identify potential sustainable benefits of technologies application.
3.1.2 Functional unit
Commonly, the functional unit for milk refers to mass or volume and most studies refer to Energy corrected milk (ECM), where proteins and fat content are specified (Fantin et al 2008). This latter characteristic can be disregarded for this particular case, as the tests showed no difference in energy requirements between whole and skimmed milk (and control with water use). To conform to previous studies (Hospido et al 2003; Heide 2002) and to include the technological function of delivering a commercially sterile product, the following functional unit is set: 1000 litres of commercially sterile milk. Commercial sterility is defined by WHO/FAO (WHO/FAO 1993) as: “Commercial sterility means the absence of microorganisms capable of growing in the food at normal non-refrigerated conditions at which the food is likely to be held during manufacture, distribution and storage.” In this study commercial sterility is quantified based on logarithmic inactivation of spores. For the EU Council directive 92/46/EEC raw milk produced with heat treatments should meet the following standard: plate count at 30°C ≤ 100 000 cfu/ml. There are two key studies for identification of commercial sterility parameters of UHPH: Amador-Espejo et al (2014) and Georget et al (2014b). The former study investigates the required pressures and temperatures for the inactivation of Bacillus cereus, Bacillus licheniformis, Bacillus sporothermodurans, Bacillus coagulans, Geobacillus stear- othermophilus and Bacillus subtilis finding a pressure of 300 MPa and an inlet temperature

14
of 75°C (Ti) to be sufficient to ensure a reduction (of ~5 log CFU/mL), and consequently commercial sterility. This result is valid for all organisms with the exception of G. stearothermophilus and B. subtilis. For these two spores the same pressure and temperature (Ti = 85°C) was necessary to reach inactivation (~1x10⁶ CFU/mL). Georget et al (2014) investigated the effect of different parameters on these spores. The findings of the study point at the relevance of valve temperature for inactivation; the authors identify a pressure of >300Mpa, inlet temperature ~80°C and a valve temperature of >145°C for ~0.24 s to be a successful treatment. Based on these results Georget et al.’s parameters are chosen for UHPH commercial sterility, as they ensure the needed log inactivation for all the mentioned microorganisms. UHT is a widely used milk treatment, the EU defines the parameters to reach commercial sterility to be: “UHT treatment is achieved by a treatment: (i) involving a continuous flow of heat at a high temperature for a short time (not less than 135°C in combination with a suitable holding time) such that there are no viable microorganisms or spores capable of growing in the treated product when kept in an aseptic container at ambient temperature, and (ii) sufficient to ensure that the products remain microbiologically stable after incubating for 5 days at 30°C in closed containers or for seven days at 55°C in closed containers or after any method demonstrating that the appropriate heat treatment has been applied.” (Ref: Commission Regulation (EC) No 1662/2006 (amending Regulation (EC) No 853/2004)). Following the EU indications and relying on literature (Triowin n.d.; Bylund 1995), the parameters for UHT treatment are set to be: pre-heating at 80°C, UHT temperature at 145°C for 4 seconds. To assess the performance of UHPH treated milk for the production of fresh cheese, the chosen reference flow is the yield of 1000 l of milk for fresh cheese production, so that it is in line with the processing inventory.
Yield is here defined as: Yield = 100 x cheese (g) / milk (g) (Escobar 2011) Knowing that 1000 l of milk = 1033000 g of milk and UHPH yield = 14%
Fresh cheese production per f.u. = 144620 g which results in 578.48 pieces of packaged
cheese, given packaging of 250 g (Zamora and Guamis 2014)
3.1.3 System boundaries
Fig. 1 represents the system for the dairy industry. For the LCA study of UHPH and UHT the system boundaries are set at the processing stage plus cleaning. This was chosen, as no foreseeable differences are expected upstream or downstream for drinkable milk. For the production of fresh cheese, on the other hand, the distribution, use and end-of-life stages are included. The increase in yield and shelf life entail changes in the downstream activities.

15
UHPH and UHT application system boundaries Study system boundaries for fresh cheese Fig. 3 Dairy industry system
3.1.4 Data collection
In order to assess the impact of technologies’ scaling up, data was gathered from multiple sources. The first test was run on a pilot-scale UHPH equipment with capacity of 90 l/h with four different substances: water, phosphate buffered saline (PBS), skimmed milk (1.5%) and whole milk (3.5%). The test was conducted in conjunction with microbiology researchers, investigating the inactivation of B. amyloliquefaciens spores in a buffer (solution that withstands changes in pH) and milk (Dong, Georget et al. 2015). Data was collected for water with the purpose of estimating the variation, if any, in energy requirements between different products. No difference in consumption was found for the three different compounds, presumably because of little difference in viscosity. Tests were then conducted using only water, as results did not depend on the substance. Water was used not to waste milk on a larger pilot-scale UHPH, with capacity of 360 l/h, and on an 85l/h Indirect UHT (homogenisation and sterilisation) system, for the identification of up scaling trends and comparison purposes. Data quality for milk production is affected mainly by: pilot scale equipment can behave quite differently than full scale production lines and the means of measurement’s accuracy for energy consumption. Data quality for cheese production is characterised by high uncertainty as it is taken from literature.
3.1.5 Modelling approach and LCA tool
Attributional and consequential are the two modelling approaches used in LCA to draw a system’s boundaries. Attributional considers the current supplier’s share of the market, modelling physical flows. Co-products’ impacts are allocated based on, for example, mass or price. Consequential considers the effects on supply of a change in demand, looking at the marginal unconstrained suppliers and it avoids allocation expanding the system boundaries.
Feed production Dairy farm
Processing and
cleaning Packaging Retail Consumer End-of-life
16
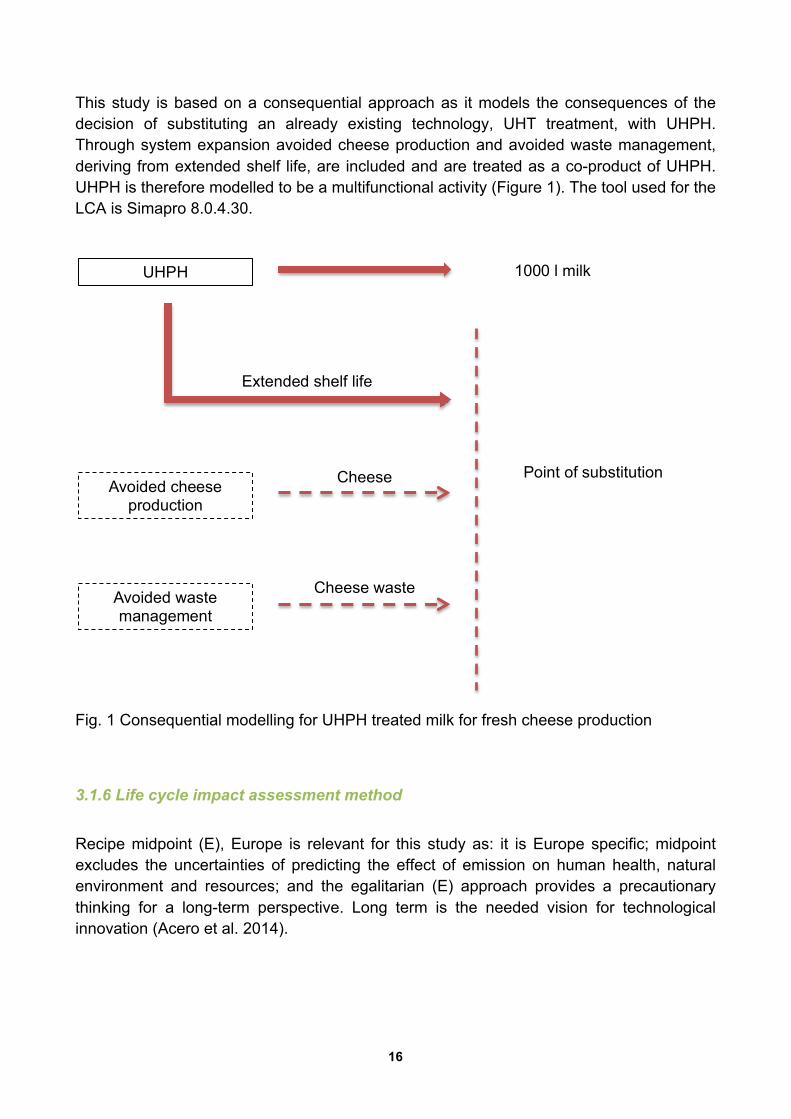
This study is based on a consequential approach as it models the consequences of the decision of substituting an already existing technology, UHT treatment, with UHPH. Through system expansion avoided cheese production and avoided waste management, deriving from extended shelf life, are included and are treated as a co-product of UHPH. UHPH is therefore modelled to be a multifunctional activity (Figure 1). The tool used for the LCA is Simapro 8.0.4.30.
Fig. 1 Consequential modelling for UHPH treated milk for fresh cheese production
3.1.6 Life cycle impact assessment method
Recipe midpoint (E), Europe is relevant for this study as: it is Europe specific; midpoint excludes the uncertainties of predicting the effect of emission on human health, natural environment and resources; and the egalitarian (E) approach provides a precautionary thinking for a long-term perspective. Long term is the needed vision for technological innovation (Acero et al. 2014).
UHPH! 1000 l milk!
Avoided cheese production!
Avoided waste management!
Cheese!
Cheese waste!
Point of substitution!
Extended shelf life!

17
3.1.7 Capital good
Capital goods are excluded from the study for few main reasons: the majority of the equipment is built with stainless steel for both technologies; pilot-scale can be very different from real application, for example, some equipment’s was to be adjusted to work at the required flow; and for pilot scale testing some equipment, such as heater and feeding pump, were the same for the two systems. It is acknowledged that the exclusion of capital good can introduce uncertainties.
3.1.8 Change in waste production due to increase in shelf life
According to WRAP (2013) no empirical studies exist on the relation between extended shelf life and wastage. Part of the reason relates to the amount of variables that have an influence and the difficulty in collecting empirical evidence on such changes in consumer’s behaviour. It is therefore acknowledged that the proposed model is subject to numerous assumptions and it is a simplified representation of reality. The major assumption made in this study is that the relation between product life and waste percentage for milk can be applied to the study of fresh cheese. According to WRAP (2013) the proposed model can be used as an indication for other products, but it could result in inconsistencies if the considered product has a different shelf life then milk and if the frequency of consumption is different. Fresh cheese durability is close to milk durability, while frequency of consumption is hard to establish as diets vary from country to country. These uncertainties need to be kept in mind when analysing the results. WRAP (2013) calculations are shown in Table 5 and Graph 2. Table 5. Waste percentage of milk for shelf life in days Shelf&life 7 8 9 10 11 12 13
Waste&(%) 8.1 4.9 3 1.6 1.1 0.8 0.7
Graph 2. Percentage of milk waste versus remaining shelf life
8.1
4.9
3
1.6 1.1 0.8 0.7
y = 142.17e-0.428x R² = 0.9713
0 1 2 3 4 5 6 7 8 9
6 7 8 9 10 11 12 13 14
Was
te (%
)
Shelf life

18
From the data provided the following equation was derived: y = 142.17 e-0.428x with R2 = 0.9713, where y = % waste and x = shelf life. Applying this to the case study the avoided waste is calculated. Waste for shelf life of 13 days: y = 142.17 e-0.428 * (13) = 0.545% Waste for shelf life of 19 days: y = 142.17 e-0.428 * (19) = 0.042% The increased shelf life from 13 to 19 days reduces waste in 0.503%. Thus the potential saving is 727.439 g of cheese per 1000 l of processed milk (0.503% x 144620 g), which are approximately 2.91 packages of cheese. This amount corresponds to 5.030 litres of milk (727.439 / 14% = 5195.993 g). These calculations are used to estimate the environmental benefits deriving from increased shelf life. WRAP’s (2013) study recognises the difficulty in determining consumer’s behaviour and how this might be influences by changes such as shelf life. It is acknowledged that the derivation of waste equation is a big uncertainty but this is the only model available as today (to the author’s knowledge) and it is therefore the best way to estimate the changes of waste at consumer level.
3.1.9 Ultra-high pressure homogenisation
Data is collected for two UHPH scales: a 90l/h two-piston pump and a 360l/h three-plunger pump. Both machineries represent a pilot scale for this technology and for both the pressure equipment is a positive displacement pump of the reciprocating group. The smaller scale runs with two-piston and a needle valve (Figure 2), while the larger scale is a three-plunger pump with a solenoid valve. It is acknowledged that pilot scale equipment can be very different from each other and that there are a number of parameters that considerably change with scale. The biggest commercially available UHPH have capacities of 1000l/h and 1500l/h, but neither of these has yet been applied at industrial scale (Georget et al. 2014a). Ultra-high pressure homogenisation equipment is very similar to a conventional homogeniser; the main adjustment that needs to be accounted for is the used materials for the valve to withstand pressures up to 400 MPa. The two materials currently used are ceramic and artificial diamond coating (Dumay et al 2013). The process consists of the product storage in a container tank and the preheating of the product, in the case of this work to 80°C. The product then enters the homogeniser where it is pumped from the piston through the narrow valve gap. The product is then cooled by a heat exchanger, with a cooling liquid at a temperature of -10°C able to rapidly drop milk’s temperature below 50°C (Figure 2 and 3). Temperature at inlet and temperature at valve are important parameters to assess the inactivation of bacterial organisms and in particular bacterial spores to ensure commercial sterility (Dumay et al 2013; Georget et al. 2014b). The same process applies for the 360l/h UHPH.

19
(a) (b)
Figure 2. (a) High pressure homogeniser worked by two intesifiers. Tin is temperature in feeding tank. P1 is pressure at valve inlet. T2 and P2 are temperature and pressure at outlet. T3 and T4 are the temperatures after cooling. The red line is traced to indicate the end of the system used for the test. (b) and Y-shaped valve (Dumay et al. 2013).
Figure 3. UHPH system
3.1.10 Ultra high temperature
The data collected refers to an indirect UHT system with flow rate of 85l/h. The line of production can be built in two different ways; homogenisation can precede or follow sterilisation. In the latter case the homogenisation will have to be conducted aseptically, which is a more expensive procedure but it produces a more stable emulsion. This study considers the case of homogenisation prior to the UHT treatment. Initially the product is pumped from the storing tank and heated to approximately 80°C to be then homogenised (temperature required ranges between 70 and 80°C). The product is then sent for UHT treatment at 145°C for 4 seconds, achieving sterilisation, and cooled. At industrial scale, there is potential for significant heat regeneration. The product is brought to the first pre-heating temperature (80°C) in a heat exchanger, where the heating
be used or not during HP-homogenisation, depending onthe performances of the HP-valve to disrupt particles with-out or limited particle re-aggregation phenomena as usuallyobserved after passing the first-stage in standardhomogenisation.
Comparing isostatic and dynamic HP-processing, it canbe said that in both cases the sample is subjected to high-pressure. In the case of isostatic HP-processing, pressureis uniformly applied and instantly transmitted throughoutthe sample by the pressure-transmitting medium, usuallywater in the food area. Pressure induces some compressionof aqueous samples (for example, a 12% decrease in watervolume at 400 MPa) but there is no shearing effect, or bio-molecule covalent bond compression at the pressure levelsapplied in the food area. Industrial equipment of350e400 L capacity operates up to 600e700 MPa ina batch or semi-batch mode in the case of twin isostaticHP-chambers. The process holding time is usually5e30 min at ambient, low or mild temperature. Liquid orsolid food products are processed in their packaging whichavoid microbial recontamination (Dumay, Chevalier-Lucia,& L!opez-Pedemonte, 2010).
In the case of HP-homogenisation using piston-gap typehomogenisers such as equipment developed by manufac-turers AvestinTM, APVTM, NiroTM, Stansted FluidPowerTM, the processed liquid is brought to high pressurein few seconds in the pressure intensifier then forcedthrough a very small orifice, the valve gap of few micro-metres in width (Fig. 1). The resulting pressure drop (DP)generates (i) intense mechanical forces and elongationalstress in laminar flow at the valve entrance and in the valvegap, and (ii) turbulence, cavitation and impacts with solidsurfaces at the gap outlet. The liquid travelling throughthe HP-valve gap is accompanied by short-life heating phe-nomena and a liquid temperature jump that must be mea-sured and controlled by efficient cooling devices to avoidover-processing of heat-sensitive biomolecules. Indeed,the fluid temperature firstly increases with the homogenisa-tion pressure (P1) by 2e3 !C per 100 MPa due to the heatof compression generated during the pressure build-up inthe pressure intensifier (T1; Fig. 1(a)). When the processedfluid is forced through the HP-valve, its velocity is in-creased due to the pipe-size reduction accompanied bythe pressure drop (DP). The fluid temperature measured im-mediately at the HP-valve outlet (T2; Fig. 1(a)) increaseslinearly with the homogenisation pressure by 14e18 !Cper 100 MPa, due to shear effects and partial conversionof mechanical energy into heat. A total jump in temperatureby 17e21 !C per 100 MPa was therefore measured whenprocessing whole milk or O/W emulsions processed at aninitial temperature of 4e24 !C (Cort!es-Mu~noz, Chevalier-Lucia, & Dumay, 2009; Picart et al., 2006; Thiebaud,Dumay, Picart, Guiraud, & Cheftel, 2003).
Recording the temperature and pressure values duringUHPH-processing, allowed the percentage of energy input(DP) used in the process as mechanical energy for particle
disruption, or dissipated as thermal energy (temperaturejump) to be evaluated. It is thus possible to calculate that, de-pending on dispersion and emulsion formulation, 37"59%oftotal energy corresponded to mechanical energy (the remain-ing 63"41% being lost as dissipated heat) (Cort!es-Mu~nozet al., 2009).
Rapid increase in fluid velocity up to 200e250 m/s andintense velocity gradients up to 107e109 s"1 take place inthe valve-gap as calculated by Floury, Bellettre, Legrand,& Desrumaux (2004) according to Poiseuille’s law (laminarflow), in the case of a convergent HP-valve with sharp an-gles (Stansted!) (Fig. 1(b)). Higher fluid velocity valuesclose to, or exceeding the speed of the sound can be calcu-lated according to Bernouilli’s principle (Kessler, 1981).The latter principle yet does not consider frictional effectsor liquid compression/expansion phenomena. Modellingstudies to propose flow field hypotheses in HP-valve de-pending on the valve design are actually needed. At the out-let of the HP-valve gap, the intensity of turbulenceincreased with the homogenisation pressure as modelledby Floury, Bellettre et al. (2004).
Comparing to microfluidization, we can notice that mi-crofluidizer devices (Microfluidics!) designed with
Fig. 1. (a) Schematic representation of high-pressure homogeniser withtwin-intensifiers. Tin, initial fluid temperature in the feeding tank; T1/P1, temperature and pressure probes located at the HP-valve inlet;T2/P2, temperature and pressure probes located at the HP-valve outlet;T3 and T4, temperature probes after the first and the second coolingdevices. (b) Schematic representation of a sharp-angle HP-valvefrom Stansted!. (c) Schematic representation of a Y-shape HP-valve.
14 E. Dumay et al. / Trends in Food Science & Technology 31 (2013) 13e26
Pumping of product Pre-heating
UHPH (homogenisation and sterilisation)
Cooling
20
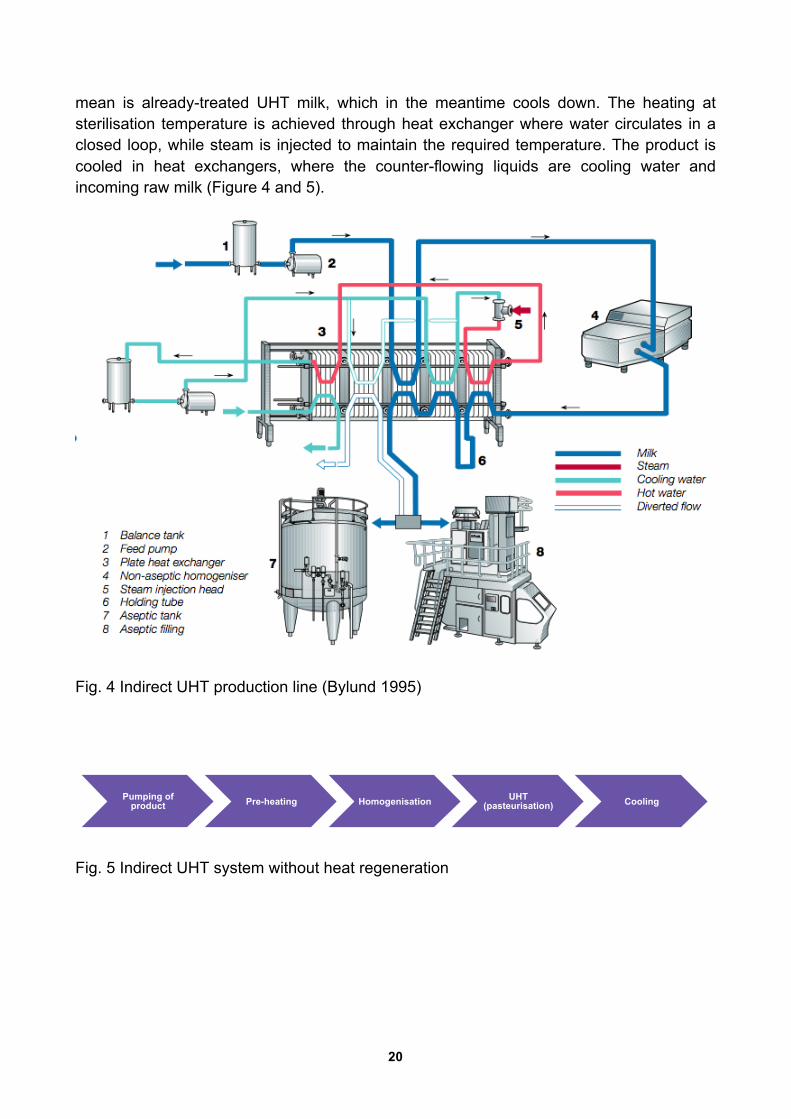
mean is already-treated UHT milk, which in the meantime cools down. The heating at sterilisation temperature is achieved through heat exchanger where water circulates in a closed loop, while steam is injected to maintain the required temperature. The product is cooled in heat exchangers, where the counter-flowing liquids are cooling water and incoming raw milk (Figure 4 and 5).
Fig. 4 Indirect UHT production line (Bylund 1995)
Fig. 5 Indirect UHT system without heat regeneration
Pumping of product Pre-heating Homogenisation UHT
(pasteurisation) Cooling

21
3.2 Life cycle inventory
First the inventory for UHPH 90l/h and UHT 85l/h is presented; following the requirements for UHPH 360l/h and fresh cheese production are explained.
3.2.1 UHPH 90l/h and UHT 85l/h
Pumping product from tank The feeding pump runs with a 3-phase engine with power factor (PF) of 0.72. Power factor is defined as: “In AC circuits, the power factor is the ratio of the real power that is used to do work and the apparent power that is supplied to the circuit” (RapidTables n.d.). This calculation is valid both for UHT and UHPH. Based on the direct measurement in ampere energy consumption is converted to kW. Conversion of ampere to kW (RapidTables n.d.):
P(kW) = √3 * PF * I(A) * VL-L (V) / 1000
Where: PF = power factor I(A) = current in Ampere
VL-L (V) = line to line RMS (root mean square) in volts
kW= √3*0.72*0.3A*400V/1000= ∼0.150kW The hourly consumption to process 85l is of 0.150kWh. The energy required for the functional unit of 1000l is therefore equal to 0.150kWh / 85l * 1000l = 1.765kWh. Table 6. Pumping product from tank (UHPH90l/h & UHT)
Unit Amount
Milk l 1000 Reference flow
Inputs Unit Amount Database entry
Electricity kWh 1.765 Electricity, medium voltage {RoW}| market for |
Conseq, U+

22
Pre-heating As for the feeding pump, the same equipment is assumed for UHPH and UHT to pre-heat the product, i.e. the LCI data for this process are identical in the UHPH and UHT alternatives. For both processes it is necessary to reach a temperature of 80°C. Based on the equation to determine heat load (SpiraxSarco n.d.), the energy requirement is calculated.
Q̇ = ṁcp∆T
Where: Q̇ = quantity of heat energy (kW) ṁ = secondary flow rate kg/s cp = specific heat capacity of water = 4.19 kJ/kg°C ∆T = difference in temperature
Given the characteristics of the equipment, assuming an initial temperature (room temperature) of 20°C and heating of the product to 80°C, which requires reaching a 90°C temperature on the heat-exchanger:
Q= 90kg/h * 4.19 kJ/kg°C * 70 °C = 26397 kJ/h ≈ 7.333kW
The energy requirement is of 7.333 kWh to process 90l. The consumption for the functional unit is of 7.333kWh / 90l * 1000l = 81.478kWh. Table 7. Pre-heating (UHPH90l/h & UHT)
Unit Amount
Milk l 1000 Reference flow
Inputs Unit Amount Database entry
Electricity kWh 81.478 Electricity, medium voltage {RoW}| market for |
Conseq, U+
Homogenisation and sterilisation UHPH Electricity The UHPH relies on a 3-phase engine with PF of 0.86. At pressure 300MPa the consumption was calculated to be ∼14.598 kWh, derived from a mean measurement of 24.5A (kW= √3*0.86*24.5A*400V/1000 ≈ 14.598kWh). For 1000 l the required energy is 14.598 kWh/ 90l * 1000l = 162.197 kWh.

23
Compressed air Air supply is connected through a ¼” BSPF (British standard pipe fitting) pneumatic air connection that requires constant pressure supply not below 6 bar. Considering the parameters for 80psig (6.530bar), the air flow is of 10.5 SCFM (standard cubic feet per minute), which correspond to:
CFM = SCFM / [(Work pressure(psig) + 14.7) / 14.7]
Where: CFM = cubic feet per minute SCFM = standard cubic feet per minute psig = pounds per square inch
CFM = 10.5 / [(80psig + 14.7) / 14.7)] ≈ 1.630
1.630 CFM ≈ 2.769 m3/h
If per hour consumption is 2.769 m3/h, the total compressed air supply for 1000l is of 2.769 m3h / 90l/h * 1000l = 30.767 m3. The existing processes for air do not model for supply below 6 bar. To estimate the consumption for lower pressure the processes for 6, 7 and 8 bar are taken into consideration (“Compressed air, 600 kPa gauge {RER}| compressed air production, 600 kPa gauge, >30kW, optimized generation | Conseq, U”, “Compressed air, 700 kPa gauge {RER}| compressed air production, 700 kPa gauge, >30kW, optimized generation | Conseq, U” and “Compressed air, 800 kPa gauge {RER}| compressed air production, 800 kPa gauge, >30kW, optimized generation | Conseq, U”). The only input changing with pressure is the amount of electricity. The data was extrapolated and the relationship between electricity and pressure was found to be linear. Consequently the process “Compressed air, 600 kPa gauge {RER}| compressed air production, 600 kPa gauge, >30kW, optimized generation | Conseq, U” is modified accounting for a lower energy demand. As 6.53 bar is 108.833% of 6 bar, 108.83% of electricity is taken (Appenxid B).
Table 8. Homogenisation and sterilisation UHPH90l/h Unit Amount
Milk l 1000 Reference flow
Inputs Unit Amount Database entry
Electricity kWh 162.197 Electricity, medium voltage {RoW}| market for |
Conseq, U+
Modified_Compressed air m3 30.767
Compressed air, 108.833% 600 kPa gauge
{RER}| compressed air production, 600 kPa
gauge, >30kW, optimized generation | Conseq,
U

24
Homogenisation UHT Electricity For UHT, a two-stage homogeniser was mounted on the production line. Based on the product specifics and on Bylund (1995) equation for electrical effect, the following value is derived:
E (kW) = Qin x (P1 - Pin) / 3600 x ηpump x ηel. motor
Where: E = electrical effect (kW) Qin = feed capacity (l/h) P1 = homogenisation pressure (bar) Pin = pressure to the pump (bar) ηpump = pump efficiency coefficient ηel. motor = motor efficiency coefficient
E = 85 l/h x (200 bar – 2 bar) / (36000 x 0.85 x 0.95) = 0.579 kW
Given 0.579 kWh as the energy consumption unit, the following calculation provides electricity consumption per FU: 0.579 kWh / 85l * 1000l = 6.812 kWh. Compressed air Airflow depends on the pipe size and on pressure. The homogeniser is connected with a ¼” BSPF pipe and pressure supply is of 2 bar. To calculate the airflow for 29.008 psig (2 bar), an equation was derived from 10 parameters relating SCFM and pressure (EngineersEdge n.d.).
y = 0.1296 x + 0.3284 with R² = 0.99964
Where: y = SCFM x = pressure (psig)
For a pressure of 29.008 psig: y = 0.1296 (29.008) + 0.3284 = 4.088 SCFM. SCFM are then transformed to CFM.
CFM = SCFM / [(Work pressure(psig) + 14.7) / 14.7] CFM = 4.088 / [(29.008psig + 14.7) / 14.7)] ≈ 1.375
1.375 CFM ≈ 2.336 m3/h
Thus 2.336 m3/h / 90l/h * 1000l = 25.956 m3 of air pumped for 1000l. The same concept applies here as for UHPH compressed air calculation. The process is modelled as 2 bar *

25
100 / 6 = 33.333% of “Compressed air, 33.33% 600 kPa gauge {RER}| compressed air production, 600 kPa gauge, >30kW, optimized generation | Conseq, U” Table 9. Homogenisation UHT
Unit Amount
Milk l 1000 Reference flow
Inputs Unit Amount Database entry
Electricity kWh 6.812 Electricity, medium voltage {RoW}| market for |
Conseq, U+
Modified_Compressed air m3 25.956 Modified_Compressed+air,+33.33%+600+kPa+gauge+
{RER}|+compressed+air+production,+600+kPa+gauge,+
>30kW,+optimized+generation+|+Conseq,+U+
Sterilisation UHT For UHT, the consumption of energy derives from the pump that drives the product and from the steam injector that supplies vapour at temperature of 175°C. Steam is necessary in order to maintain water temperature elevated to the point of heating milk to sterilisation. Pump consumption The UHT relies on a 3-phase engine with PF of 0.76. With a mean measurement of 0.16A, consumption is:
kW= √3*0.76*0.16A*400V /1000= ∼0.084 kW
Processing 85 l of milk consumes 0.0884 kWh of energy. Referring back to the functional unit of 1000l the requirement is of 0.084 kWh / 85l * 1000l = 0.988 kWh. Steam injector energy consumption Based on steam consumption equation (SpiraxSarco n.d.)
Q̇ = mcp∆T / t
Where: Q̇ = quantity of heat energy (kW) m = mass to be heated (kg) cp = specific heat capacity of water = 4.19 kJ/kg°C ∆T = difference in temperature t = time in seconds

26
The amount of water to be heated is known as the flow was calculated during the tests. At pilot scale there is no energy recovery, while in full-scale UHT plants water runs in a closed loop and is used to heat and cool incoming and outgoing product.
Q = [87.805 kg x 4.19 kJ/kg°C x (175 – 20)] / (3600) = 15.840 kW
Per hour the consumption is of 15.840kW processing 87.805 kg (85l). The steam injector’s nameplate indicates a consumption of 15 kW; the calculations are therefore close to the standard range. For a 1000l energy needed is: 15.840 kWh / 85l * 1000l = 186.353 kWh. Steam injector water and air consumption 12kg/h of steam are supplied at pressure of 5.5 bar. The requirement for tap water are of 12 kg/h / 85l * 1000l = 141.176 kg. The amount of compressed air required is of 3.6 bar (52.214 psig). Applying the previously explained equations:
y = 0.1296x + 0.3284 with R² = 0.99964 y = 0.1296 (52.214) + 0.3284 = 7.095 SCFM
CFM = SCFM / [(Work pressure(psig) + 14.7) / 14.7] CFM = 7.095 / [(52.214 psig + 14.7) / 14.7)] ≈ 1.559
1.559 CFM ≈ 2.649 m3/h
Referring back to the functional unit it is calculated that 2.649 m3/h / 85l/h * 1000l = 31.165 m3. Once again the process for compressed air is modelled as 60% of “Compressed air, 33.33% 600 kPa gauge {RER}| compressed air production, 600 kPa gauge, >30kW, optimized generation | Conseq, U”. Table 10. Sterilisation UHT
Unit Amount
Milk l 1000 Reference flow
Inputs Unit Amount Database entry
Electricity kWh (186.353 + 0.988) =
187.341 Electricity, medium voltage {RoW}| market for |
Conseq, U+
Tap water kg 141.176 Tap water, at user {Europe without Switzerland}|
market for | Conseq, U
Modified_Compressed air m3 31.165
Modified_Compressed air, 60% 600 kPa gauge
{RER}| compressed air production, 600 kPa
gauge, >30kW, optimized generation | Conseq,
U+

27
Cooling
The cooling agent used for UHPH90l/h is R134a refrigerant, which has a specific heat capacity of 0.239 kJ/kg°C (DuPont 2004). Assuming, the need to cool the product from room temperature to reach the required -10°C, the change in temperature is 30°C. From the given parameters the following is derived: Q = 90kg/h * 0.239 kJ/kg°C * 30°C = 645.3 kJ/h ≈ 0.179 kW. For a 1000l the consumption is 0.179 kWh / 90l * 1000l = 2 kWh. Table 11. Cooling UHPH90l/h
Unit Amount
Milk l 1000 Reference flow
Inputs Unit Amount Database entry
Electricity kWh 2.000 Electricity, medium voltage {RoW}| market for |
Conseq, U+
The cooling agent for UHT is water. Assuming to start from room temperature to reach the required 5°C, the required temperature is derived:
Q = 85kg/h * 4.19 kJ/kg°C * 15°C = 5342.25 kJ/h ≈ 1.484 kW
Per hour the consumption is of 1.484 kWh processing 90l. Thus 1.484 kWh / 85l * 1000l =
17.459 kWh for 1000l production.
Table 12. Cooling UHT Unit Amount
Milk l 1000 Reference flow
Inputs Unit Amount Database entry
Electricity kWh 17.459 Electricity, medium voltage {RoW}| market for |
Conseq, U
Tap water kg 85 Tap water, at user {Europe without Switzerland}|
market for | Conseq, U
Cleaning90l/h The inventory shows data for a cycle of cleaning in place (CIP). The capacity of the UHPH and UHT systems are of 90l/h and 85l/h respectively, so to processing of 1000l of milk requires between 11 to 12 hours. CIP is usually performed every 12 to 14 hours (GEA Process Engineering A/S n.d.). One cleaning cycle is therefore assumed per functional unit. The cleaning process depends on the product processed rather than on the machinery; in fact the same procedure is found to be suitable for both technologies. There

28
are different substances and procedures that can be used for this process (Eide et al. 2003). In the cleaning of equipment for milk production caustic, acidic and disinfecting agents are generally used. In this study the following agents are modelled: “BTS 3000” a caustic agent against fat, “Bio Tec Biomelk sauer” acid agent, and “BTS 4000” for disinfection purposes. The table below represents the calculations for the cleaning procedure. The details regarding calculations and the specifics for the cleaning agents are explained in the following sections. The reference flow is defined as 1 piece (p), which represents one cycle of cleaning per 1000 l of processed product. Table 13. Cleaning UHPH90
Unit Amount
Cleaning p 1 Reference flow
Inputs Unit Amount Database entry
Electricity kWh (5.29 + 0.3) =
5.59 Electricity, medium voltage {RoW}| market for |
Conseq, U
Modified_Compressed air m3 5.538
Compressed air, 108.833% 600 kPa gauge
{RER}| compressed air production, 600 kPa
gauge, >30kW, optimized generation | Conseq,
U
Heating Biomelk solution+ p 1 Table 23
Water kg 127.5 Tap+water,+at+user+{Europe+without+Switzerland}|+
market+for+|+Conseq,+U+
BTS 3000 kg 1.05 Table 18
Bio Tec Biomelk sauer kg 0.169 Table 22
BTS 4000 kg 0.05 Table 26
Table 14. Cleaning UHT
Unit Amount
Cleaning p 1 Reference flow
Inputs Unit Amount Database entry
Electricity kWh 1.336 Electricity, medium voltage {RoW}| market for |
Conseq, U
Modified_Compressed air m3 4.672 Compressed air, 33.33% 600 kPa gauge {RER}|
compressed air production, 600 kPa gauge,
>30kW, optimized generation | Conseq, U
Heating Biomelk solution pc 1 Table
Water kg 191.25 Tap+water,+at+user+{Europe+without+Switzerland}|+
market+for+|+Conseq,+U+
BTS 3000 kg 1.05 Table
Bio Tec Biomelk sauer kg 0.169 Table
BTS 4000 kg 0.05 Table

29
UHPH cleaning procedure The specific instructions for UHPH are reported. First the pressure is released and the machine left running with a pressure not superior to 5MPa. As a first step the machine is pre-rinsed to eliminate any product residuals. Following the cleaning agents are circulated. After each agent the machine is rinsed with clear water 5-10 minutes to drain. The water has then to be expelled from the system and the machine has to be checked. Energy requirements for cleaning UHPH 90 Electricity is calculated given UHPH electricity consumption derived from the equation y = y = 2.4498ln(x) - 0.0463 R² = 2.645 kWh (5.29 kWh for cleaning cycle) where the equation is the result of the analysis of the collected data. The energy consumption of the feeding pump (∼0.15kWh) is then summed. The machinery is run at pressure 3Mpa. This choice is based on a combination of UHPH instructions, which indicate a maximum pressure of 5Mpa for this operation, and TetraPak (2010) instructions for UHT CIP, which advice for a pressure of 3MPa. TetraPak’s instructions were found only for direct UHT and tubular indirect UHT. Since for both technologies a pressure of 3Mpa is suggested, the parameter is assumed to be valid for plate heat exchanger UHT. UHPH compressed air consumption is of 2.769 m3 per hour, as the cleaning is assumed to last for two hours, 2.769 m3 *2 h = 5.538 m3 are needed. The value of two hours was chosen as a combination of literature, first-hand experience and time requirements for all cleaning products. Energy requirements for cleaning UHT 90 For a UHT system cleaning requires flow rate to be 1.5 times the production’s flow rate and the homogenizer needs a pre-charge pressure no less than one-third of the processing pressure (SPX, n.d.). The overall energy is calculated summing the consumption of the feeding pump, homogenizer and pasteurization pump. Compressed air requirement is of 2.336 m3*2h = 4.672 m3 Feeding Pump: 0.150 kWh / 85l * 90 * 1.5 = 0.238 kWh
Homogeniser: E (kW) = Qin * (P1 - Pin) / 3600 * ηpump * ηel. motor
E = 90 l *1.5 * (67 bar - 3 bar)/(36000 * 0.85 * 0.95) = 0.297 kW
Sterilisation pump: 0.084 kWh / 85l * 90 * 1.5 = 0.133 kWh
Total consumption: (0.238 + 0.297 + 0.133) x 2 h = 1.336 kWh Water UHPH & UHT According to Tetrapak (2010) a tubular exchange UHT with capacity of 1400l/h would require between 1000 and 2000 l/h for CIP procedure, which in proportion reflects the requirement assumed in this study. The amount of water is calculated based on the time

30
required for the cleaning procedure related to capacity. Pre-rinsing and a rinsing cycle after each agent are also included. A 10 minutes rinsing per cycle is assumed based on average time from literature (Alvarez et al 2010). Including drying time CIP is predicted to last for approximately 2 hours. For water use the chosen process is “Tap water, at user {Europe without Switzerland}| market for | Conseq, U”. The Ecoinvent process is modelled based on estimates for Switzerland and energy use for Germany. According to the instruction manual for the pressure pump, the used water does not have to be completely demineralized or desalted. Tap water is chosen for inventory, as local water is moderately soft. Cleaning agents
BTS 3000
The ingredients that constitute this substance are: Sodium hydroxide (5-15%), potassium hydroxide (1-5%) non-ionic surfactants (1-5%), water hardness stabilizers, active chlorine (ca.3,2%), auxiliaries and builders. BTS 3000 has to be used cold, with concentration between 2 and 5% and used with the foaming method for 20 minutes. Table 15. BTS 3000
Unit Amount
BTS 3000 kg 1 Reference flow
Inputs Unit Amount Database entry
Sodium hydroxide (10%) kg 0.1 Table+19+
Potassium hydroxide kg 0.03 Potassium+hydroxide+{GLO}|+market+for+|+Conseq,+U+
Chlorine kg 0.032 Chlorine,+liquid+{GLO}|+market+for+|+Conseq,+U+
Non-ionic surfactants kg 0.03 Ethoxylated+alcohol+(AE7)+{GLO}|+market+for+|+Conseq,+U+
Sodium hydroxide, without water, in 50% solution state {GLO}| market for | Conseq, U is modified to account for a concentration of 10% (Table below). According to Ecoinvent3 guidelines (Weidema et al. 2013), to modify the process the percentage of product is considered as a variable and the remaining inputs (transport and water) need to be multiplied proportionally.
According to Tiger Chemical Company (n.d.) Eythoxylated alcohol is one of the most common non-ionic surfactants. Eythoxylated alcohol exists in different concentrations; in fact processes exist for ethylene oxide (EO) concentration 3, 7 and 11. Air Products, chemical manufacturing company, suggests three EO concentrations (2.5, 5 or 7.3) for surfactants for dairy cleaning. According to P&G AE-7, Alcohol Ethoxylate and AE-3, Alcohol Ethoxylate can both be used for the same function. An EO concentration of 7 is chosen as it compatible with the carbon content of P&G AE-7, Alcohol Ethoxylate (P&G n.d. a and b).

31
Table 16. Modified_Sodium hydroxide, without water, in 10% solution state {GLO}| market for | Conseq, U
Unit Amount
Modified_Sodium hydroxide,
without water, in 10%
solution state {GLO}| market
for | Conseq, U
kg 1 Reference flow
Inputs Unit Amount Database entry
Transport, freight, sea, tkm 3 Transport,+freight,+sea,+transoceanic+ship+{GLO}|+market+
for+|+Conseq,+U+
Transport, freight, inland
waterways tkm 0.123
Transport,+freight,+inland+waterways,+barge+{GLO}|+
market+for+|+Conseq,+U+
Sodium hydroxide, without
water, in 50% solution state kg 1
Sodium+hydroxide,+without+water,+in+50%+solution+state+
{GLO}|+sodium+hydroxide+to+generic+market+for+
neutralising+agent+|+Conseq,+U+
Transport, freight, lorry,
unspecified tkm 1.040
Transport,+freight,+lorry,+unspecified+{GLO}|+market+for+|+
Conseq,+U+
Transport, freight train tkm 0.101 Transport,+freight+train+{Europe+without+Switzerland}|+
market+for+|+Conseq,+U+
Transport, freight train {CN} tkm 0.341 Transport,+freight+train+{CN}|+market+for+|+Conseq,+U+
Transport, freight train {CH}| tkm 0.002 Transport,+freight+train+{CH}|+market+for+|+Conseq,+U+
Transport, freight train {US} tkm 0.479 Transport,+freight+train+{US}|+market+for+|+Conseq,+U+
Transport, freight train {RoW} tkm 0.623 Transport,+freight+train+{RoW}|+market+for+|+Conseq,+U+
Bio Tec Biomelk sauer
Bio Tec Biomelk sauer is a combination of mineral acids (nitric acid) materials and builders. For the cleaning procedure a concentration of 0.5 - 1% is necessary, which has to be circulated at 40-60°C for 10 to 20 minutes.
Table 17. Bio Tec Biomelk sauer Unit Amount
Bio Tec Biomelk sauer kg 1 Reference flow
Inputs Unit Amount Database entry
Nitric acid kg 0.5 Nitric+acid,+without+water,+in+50%+solution+state+{GLO}|+
market+for+|+Conseq,+U+
The percentage of nitric acid is not specified. A 50% solution is chosen because is the most common concentration found on the market and from literature on cleaning in place (CIP) for Norwegian dairy plants (Eide et al. 2002). Therefore the already existing process “Nitric acid, without water, in 50% solution state {GLO}| market for | Conseq, U” was used.

32
This cleaning step requires heating of cleaning agent to 50°C (chosen as an average of indicated temperature 40-60°C). The heat load is therefore determined to be:
Q= 90kg/h * 4.19 kJ/kg°C * 30 °C = 11313 kJ/h ≈ 3.143 kW
Per hour the consumption is of 3.143 kW. Biomelk is circulated for 15 minutes, therefore the consumption is of 3.143 kWh / 4 = 0.790 kWh. Table 18. Heating Biomelk sauer solution
Unit Amount Source
Heating Biomelk solution pc 1 Reference flow
Inputs Unit Amount Source
Electricity kWh 0.790 Electricity, medium voltage {RoW}| market for |
Conseq, U+
BTS 4000
BTS 4000 is Active chlorine (the 1% solution contains about 750 mg of chlorine / l), stabilizers and scaffold materials. It has to be used with a concentration of 0.5%, at cold temperatures for 10 minutes. Table 19. BTS 4000
Unit Amount
BTS 4000 kg 1 Reference flow
Inputs Unit Amount Database entry
Chlorine kg 0.008 Chlorine,+liquid+{GLO}|+market+for+|+Conseq,+U+
+ Wastewater Treatment It is assumed that wastewater after cleaning is sent directly for municipal treatment. The amount of water refers to the water used for the cleaning stage. The water used as cooling means in the UHT system is not included as, since it does not come into contact with the product, cleaning is not required. Table 20. Wastewater treatment UHPH90
Unit Amount
Cleaning p 1 Reference flow
Inputs Unit Amount Database entry
Wastewater treatment m3 0.128 Wastewater,+from+residence+{RoW}|+treatment+of,+
capacity+1.1E10l/year+|+Conseq,+U+

33
Table 21. Wastewater treatment UHT
Unit Amount
Cleaning p 1 Reference flow
Unit Amount Database entry
Wastewater treatment m3 0.191 Wastewater,+from+residence+{RoW}|+treatment+of,+
capacity+1.1E10l/year+|+Conseq,+U
3.2.2 UHPH 360l/h
Pumping product from tank For 90l/h consumption is of ∼0.150kWh. For 360l/h assume: 0.150kWh / 90l * 360l = 0.6 kW. For the functional unit 0.6 kWh /360l * 1000l = 1.667kWh. Table 22. Pumping product from tank UHPH360l/h
Unit Amount
Milk l 1000 Reference flow
Inputs Unit Amount Database entry
Electricity kWh 1.667 Electricity, medium voltage {DE}| market for |
Conseq, U+
Pre-heating Heat load is determined to be Q= 360kg/h * 4.19 kJ/kg°C * 70 °C = 105588 kJ/h ≈ 29.33kW. Thus 29.33kWh/360l*1000l = 81.472kWh. Table 23. Pre-heating UHPH360l/h
Unit Amount
Milk l 1000 Reference flow
Inputs Unit Amount Database entry
Electricity kWh 81.472 Electricity, medium voltage {DE}| market for |
Conseq, U+
Homogenisation and sterilisation Electricity The UHPH relies on a 3-phase engine with PF of 0.87. Electricity consumption is of 37.6 kWh/ 360l * 1000l = 104.444kWh for 1000l.

34
Compressed air Air supply is connected through a ¼” BSPF (British standard pipe fitting) pneumatic air connection that requires constant pressure supply not below 5.5 bar. Because the parameters are similar to the smaller scale UHPH, the same calculations are valid, so the consumption is of 2.769 m3/h for 360l. For the functional unit of 1000l, the total requirement is of 2.769 m3h/ 360l/h * 1000l = 7.692 m3. Table 24. Homogenisation and sterilisation UHPH360l/h
Unit Amount
Milk l 1000 Reference flow
Inputs Unit Amount Database entry
Electricity kWh 104.444 Electricity, medium voltage {DE}| market for |
Conseq, U+
Modified_Compressed air m3 7.692
Compressed air, 108.833% 600 kPa gauge
{RER}| compressed air production, 600 kPa
gauge, >30kW, optimized generation | Conseq,
U
Cooling
Assuming the same parameters than for UHPH90l/h, the following is derived: Q = 360kg/h * 0.239 kJ/kg°C * 30°C = 2581.2 kJ/h ≈ 0.179 kW. For a 1000l the consumption is of 0.717 kWh / 360l * 1000l = 1.992 kWh.
Table 25. Cooling UHPH360l/h Unit Amount
Milk l 1000 Reference flow
Inputs Unit Amount Database entry
Electricity kWh 1.992 Electricity, medium voltage {DE}| market for |
Conseq, U+
Cleaning
Energy requirement At pressure 3MPa the consumption is of 0.376 kWh. For a two hours cycle: 0.376 kW * 2h = 0.752 kWh. Two hours of compressed air supply correspond 5.538 m3.

35
Table 26. Cleaning UHPH360 Unit Amount
Cleaning p 1 Reference flow
Inputs Unit Amount Database entry
Electricity kWh (0.376 + 1.2) =
1.576 Electricity, medium voltage {DE}| market for |
Conseq, U
Modified_Compressed air m3 5.538
Compressed air, 108.833% 600 kPa gauge
{RER}| compressed air production, 600 kPa
gauge, >30kW, optimized generation | Conseq,
U
Heating Biomelk solution+ pc (1/90*360) =
4 Table 23
Water kg (127.5/90*360) =
510 Tap+water,+at+user+{Europe+without+Switzerland}|+
market+for+|+Conseq,+U+
BTS 3000 kg (1.05/90*360) =
4.2 Table 18
Bio Tec Biomelk sauer kg (0.169/90*360) =
0.676 Table 22
BTS 4000 kg (0.05/90*360) =
0.2 Table 26
Wastewater Treatment It is assumed that wastewater after cleaning is sent directly for municipal treatment. Table 27. Wastewater treatment UHPH90
Unit Amount
Cleaning p 1 Reference flow
Inputs Unit Amount Database entry
Wastewater treatment m3 0.51 Wastewater,+from+residence+{RoW}|+treatment+of,+
capacity+1.1E10l/year+|+Conseq,+U+

36
3.2.3 Fresh cheese
Short product durability is the one of the main reasons for food waste generation. According to an English Waste and Resources Action Programme (WRAP 2014) study, between 1.3 and 2.6 million tonnes of food is thrown away from industries and households. Extending the shelf life of a product, in particular of quickly perishable goods, of a single day, have the potential of saving 0.2 tonnes of food. This estimate corresponds to 5% of what is identified as preventable waste in the UK. The resulting benefits are not only food savings but also increase revenue for retails and increase purchasing possibilities for consumers. To estimate the benefit of increasing shelf life, this study mainly relies on data derived by the UK WRAP’s studies. Avoiding waste is beneficial for manufacturer, retailer as well as consumer. Manufacturers will produce fewer quantities, suppliers will purchase less as more of their stock is sold and consumers will redirect the saved money to the purchase of other products. Generally consumers will switch to the consumption of higher quality and value products, generating profit for retailers (WRAP 2013). There are different ways in which these benefits could be accounted for but problems arise because of lack of data and allocation of the benefit. Two WRAP studies present ways to account for extended shelf-life: “Reducing food waste by extending food life” (2015), in which all benefits are allocate to retailer (including also the manufacturer savings) as it is considered that this positive effect will be transferred to consumers. The second study is “The Milk Model: Simulating Food Waste in the Home” (2013). The report estimates consumers’ waste. Because of data availability and modelling problematic, in this study no waste is assumed for manufacturers and retailers and the benefits are estimated solely at consumer level. Fresh cheese production Raw milk is processed with UHPH treatment at 300Mpa at 30°C. It is then sent for coagulation, which consists in the collection of milk in a vat where it is warmed and stirred. Salt, calcium chloride and rennet are added. The produced curd is then cut and the grains are packaged. The product is then stored at 4°C (Zamora 2009). Refrigerated transportation is used to deliver the product to retails. Refrigeration at retail, transport to household, refrigeration in household and disposal of product close the system for cheese production.
Figure 6. Fresh cheese production system
Milk processing
Coagulation and curd cutting
Packaging Retail Consumer End-of-life

37
Processing For UHPH90&360l/h refer to LCI above for 300MPa. The consumption for feeding pump and UHPH processing are the same as the flow and the pressure are the same. Pre-heating For UHPH90l/h, given the characteristics of the equipment, assuming an initial temperature (room temperature) of 20°C and heating the product to 30°C, which requires reaching a 40°C temperature on the heat-exchanger:
Q= 90kg/h * 4.19 kJ/kg°C * 20 °C = 7542 kJ/h ≈ 2.095kW
The hourly consumption is of 2.095 kWh processing 90l. Referring back to the functional unit of 1000l 2.095kWh / 90l * 1000l = 23.279kWh. Table 28. Pre-heating fresh cheese UHPH90l/h
Unit Amount
Milk l 1000 Reference flow
Inputs Unit Amount Database entry
Electricity kWh 23.279 Electricity, medium voltage {RoW}| market for |
Conseq, U+
For UHPH360l/h
Q= 360kg/h * 4.19 kJ/kg°C * 20 °C = 30168 kJ/h ≈ 8.38kW
The hourly consumption is of 2.095 kWh processing 90l. Referring back to the functional unit of 1000l 8.38 kWh / 360 l * 1000l = 23.278kWh. Table 29. Pre-heating fresh cheese UHPH360l/h
Unit Amount
Milk l 1000 Reference flow
Inputs Unit Amount Database entry
Electricity kWh 23.278 Electricity, medium voltage {RoW}| market for |
Conseq, U+

38
Cooling
For fresh cheese production temperature at inlet is of 30°C, at valve approximately 104°C are reached and ≤ 20°C at outlet. The same assumptions made for cooling for milk production apply to cheese making, as the difference between valve and outlet temperature is approximately the same. Table 30. Cooling fresh cheese UHPH90l/h
Unit Amount
Milk l 1000 Reference flow
Inputs Unit Amount Database entry
Electricity kWh 2.000 Electricity, medium voltage {RoW}| market for |
Conseq, U+
Table 31. Cooling fresh cheese UHPH360l/h
Unit Amount
Milk l 1000 Reference flow
Inputs Unit Amount Database entry
Electricity kWh 1.992 Electricity, medium voltage {DE}| market for |
Conseq, U+
Fresh cheese production Coagulation and curd cutting The data is taken from the technical sheet for a TetraPak’s vat Tetra Damrow ™ Double-O Vat 8 Type DB. Considering the parameters for the smallest capacity (2000 l/h), the following data is available:
Technical sheet: Tetra Damrow ™ Double-O Vat 8 Type DB
Unit Amount
Coagulation and curd cutting of fresh cheese l/h 2000
Inputs Unit Amount
Electricity kWh 2.2
Steam kg/h 190
For the functional unit of 1000l the data of the table above is halved. Moreover the process requires the addition of 1% (v/v) of salt, 35% (w/v) of calcium chloride and 0.03% (v/v) of recombinant rennet chymosin. Rennet was not included due to lack of information (Nigri et al. 2014).

39
Table 32. Coagulation and curd cutting of fresh cheese Unit Amount
Coagulation and curd cutting
of fresh cheese kg 144.620 Reference flow
Inputs Unit Amount Database entry
Electricity kWh 1.1 Electricity, medium voltage {RoW}| market for |
Conseq, U+
Steam kg 80 Steam, in chemical industry {GLO}| market for |
Conseq, U
Salt kg 1.446 Sodium chloride, at plant/RNA
Calcium chloride kg 50.617 Calcium chloride {GLO}| market for | Conseq, U
Packaging Packaging material For fresh cheese, packaging consists in polypropylene (10g) moulds (Anelli n.d.). The moulds are then inserted in a container of the same material, where the container and the cap have a total weight of 24g (16 and 8 g respectively) (Anelli n.d.). Packaging energy The data is based on the technical sheet of XBG50 Shanghai Xiangyi Machinery Co., LTD filling machine with following characteristics:
Capacity 700-1000cups/h Power 2kw Filling volume 300ml Voltage AC220V/50HZ Temperature 0-400centigrade Machine size 1200*1200*1850 Weight 350-450kg Air comsumption 0.7M3/MIN
The machine fills 850 cups/h on average. The energy per cup is of 2kW / 850 = 2.353 W. The packaging considered is of 250 g, which are equal to 238.095 ml (given a density of 1.05 g/ml). Assuming a linear relationship between energy requirement and capacity, the consumption per cup is of 238.095 ml * 300 / 0.002. Compressed air requirements are given per minute, knowing that 850 / 60 = 14.167 cups are filled per minute, the consumption is of 0.3 m3/min / 14.167 = 0.021 m3 per cup.

40
Table 33. Packaging of fresh cheese Unit Amount
Packaging Soft cheese p 1 Reference flow
Inputs Unit Amount Database entry
Polypropylene g 34 Polypropylene, granulate {GLO}| market for |
Conseq, U
Electricity W 1.961 Electricity, medium voltage {RoW}| market for |
Conseq, U+
Compressed air m3 0.021 Compressed air, 600 kPa gauge {RER}|
compressed air production, 600 kPa gauge, >30kW,
optimized generation | Conseq, U
Storage Storage at manufacturer and at retailer are assumed to require the same energy. See Energy in retail below. Transport to retail Transport distance in assumed to be 80 km, which is an average distance for transport to retail for Europe (Cashman 2009). Total weight of the product is 284 g (250g of cheese plus 34 g of packaging). To account for refrigeration an increase in fuel of 0.025 l/km is included (Roibás et al. 2014). The process “Diesel, low-sulfur {RoW}| market for | Conseq, U” is the process for diesel that is included in Transport, freight, lorry 16-32 metric ton, EURO5 {GLO}| market for | Conseq, U. The required increase for the distance travel is of 0.025 * 80 = 2 l = 1.664 kg (density of diesel = 0.832 kg/L). Table 34. Transport to retail
Unit Amount
Packaged cheese p 1 Reference flow
Inputs Unit Amount Database entry
Transport to retailer tkm 0.023 Transport, freight, lorry 16-32 metric ton, EURO5
{GLO}| market for | Conseq, U
Diesel for refrigeration kg 1.664 Diesel, low-sulfur {RoW}| market for | Conseq, U
Energy in retail Foster et. al (2006) suggested energy requirements at retail to be of 8.333 kW for 1000l = of milk for a storage time of 18 hours. The consumption equals 11.111 kWh / day for 1000l. 1000l of milk equal to 1 033 000 g so the energy consumption for 250 g is 0.003 kWh / day.

41
Table 35. Storage energy in retail Unit Amount
Packaged cheese p 1 Reference flow
Inputs Unit Amount Database entry
Electricity kWh 0.003 Electricity, medium voltage {RoW}| market for |
Conseq, U+
Transport to household Travel for shopping is assumed to be 10.9 km trip-1 with 175 trips per year (Thoma et al. 2013). According to Thoma et al. (2013) 0.307% of consumption for groceries’ transport is attributable to dairy products. From Bouamra-Mechemache et al (2008) data on dairy consumption, fresh cheese share is estimated to be of 3.926%. Table 36. Transport to household
Unit Amount
Trip p 1 Reference flow
Reference flow Unit Amount Database entry
Transport to household km 0.001 Transport, passenger car, EURO 5 {RER}|
market for | Conseq, U
Energy in household Relying on Thoma et al. (2012) the estimate for refrigeration energy for households is of 1345 kW h y-1. Per capita consumption of fresh cheese is 5.134 kg y-1 or 0.014 kg d-1 per capita (Bouamra-Mechemache et al 2008). Considering 4 people household the total amounts to 5.134 kg y-1 x 4 = 20.536 kg y-1. Knowing that for 229.2 kg y-1 the energy required of total refrigeration is 1.62%, for 20.536 kg y-1 it is estimated a consumption of 0.145%, which equals to 1.950 kWhy-1. Energy allocated to fresh cheese per day is therefore calculated to be 1.950 kWhy-1 / 365 = 0.005 kWhd-1. 0.005 kWhd-1 is required for 0.056 kg, thus for a 250g piece the consumption is 0.022 kW h d-1. Table 37. Storage energy in household
Unit Amount
Packaged cheese p 1 Reference flow
Inputs Unit Amount Database entry
Electricity kWh 0.022 Electricity, medium voltage {RoW}| market for |
Conseq, U+

42
Packaging disposal The process includes transport and disposal. Table 38. Packaging disposal
Reference flow Unit Amount Source
Packaging disposal p 1 Reference flow
Inputs Unit Amount Source
Polypropylene disposal g 34 Waste polyethylene/polypropylene product
{GLO}| market for | Conseq, U
Cheese waste disposal The process includes transport and disposal of cheese waste. Table 39. Cheese waste disposal
Inputs Unit Amount Source
Cheese waste disposal g 60.74 Biowaste+{RoW}|+market+for+|+Conseq,+U+
Fresh cheese extended shelf life For UHPH90l/h and UHPH360l/h extended shelf life and yield are estimated to avoid the production of 5.03 l of milk. To evaluate the environmental benefit the process for fresh cheese production is analysed for the production deriving from (1000 l – 5.03 l) 994.97 l of milk.

43
3.2.4 The issue of energy recovery
At industrial scale, the energy recovery of an indirect UHT amounts to 88-90% exploiting heat transfer as explained in the relevant section. So the energy required by UHT treatment would be 28.776 kWh per functional unit assuming 90% recovery. As UHPH has not been applied at industrial scale yet, the pilot-scale is a non-insulated system that does not consider possible heat regeneration techniques. According to the possible ways to build the UHPH line, there is the possibility for regeneration; for example the outgoing product could be passed close to incoming milk to produce the same energy exchange as in the UHT line. Hereafter the calculation of possible heat recovery for UHPH is presented. The energy requirement is of Q= 90kg/h * 3.93 kJ/kg°C * 40°C = 14148 kJ/h ≈ 3.93kW. Where 3.93 kJ/kg°C is the specific heat capacity of milk and 40°C is the difference between of temperature of the outgoing product, which is maximum at 50°C, and 90°C, which is the temperature that needs to be reached at the heat exchanger to ensure a 80°C pre-heating. The consumption for the functional unit is of 3.93kWh / 90l * 1000l = 43.667kWh versus 81.478 kWh without recovery. UHPH could therefore recover minimum 15% of energy. Energy recovery for UHPH could be much higher if temperature at valve (145°C) were to be used so that pre-heating and cooling would require minimal to no energy. In this case energy recovery could get up to 32% for UHPH 90 and 43% for UHPH 360.
3.3 Scaling up methodology So far the environmental impacts of pilot scale UHPH have been discussed, but if the technology has to be used in industry the consequences of larger scale equipment and production have to be considered. Life cycle assessment is used in Eco-design and on various stages of product development to assess business as usual and consequences of future changes. In order to predict industrial application impacts scaling relationships are used. Scaling relationships are applied in different fields such as economics. An example is the six-tenth rule, which is commonly used for cost estimations (Caduff et al. 2010). Power laws have not been applied to LCA studies extensively. Caduff et al. (2014) derived equations relating power to mass, cost and energy requirement for commonly used engines and found that equipment generally does not linearly scale up and that the six-tenth rule does not always apply. The authors derived the equations through the ordinary least square regression of log10 transformed empirical data for key characteristics of different size equipment. Scaling laws are expressed as i = a*Pbi, where i is a key property, such as energy requirements, a is a normalisation constant and b is the scaling factor. For application in life cycle assessment, the inventory of the chosen equipment is parameterised so that each element is related to the relevant key property. For example capital good are related to mass, while electricity is related to energy consumption. This way each process is identified as size dependent or indipendent and is expressed in relation to the relevant key property. The same scaling relationship is then applied to
44
environmental impacts (EI) so that EIi = a*Pbi transformed in log10 log(EIi) = log(a) + bi log(P) for simplification (Caduff et al. 2014). This methodology is applied in this study. The two size UHPH data is integrated with empirical evidence and, following power laws for pressure pump, the relationship between key variables is set and then applied to estimate environmental scaling. In total data for 10 machineries are included in the analysis, it is acknowledges that this is a small sample for modelling purposes but it is considered as a valid initial assessment as no data is available in this regards. UHPH relies on a positive displacement high-pressure pump of the reciprocating group. Fluid is drawn into pump and forced through a discharge valve. Reciprocating pumps work on the principle that a “solid will displace a volume of liquid equal to its own volume” (Evans n.d.). The 90l/h UHPH is a piston pump, while the 360l/h is a plunger pump. The former are commonly used to work at pressures up to 14 MPa, while the latter support pressures up to 207 MPa. Affinity laws are used to theoretically model the behaviour for the main properties of this equipment. Affinity laws mainly refer to centrifugal and rotary pumps, this because the relationship between the key variable for reciprocating positive displacement pumps are fairly straightforward. The key variables for positive displacement pumps are speed, capacity, pressure, power and the net positive suction displacement head required (NPSHr). NPSHr is the pressure required at the inlet for the pump to function avoiding cavitation. Cavitation is the creation of vapour bubbles when the inlet pressure is lower than the vapour pressure of the liquid. The consequences are pitting, noise and decrease in capacity. Pitting damages are responsible for a shorter lifetime of the equipment. For this reason it is important to check the NPSHr indicated by the manufacturer. For displacement pumps NPSH is often referred to as net inlet pressure, which is expressed in psi or bar (Evans n.d.). Positive displacement pumps are volumetric pumps, which means that regardless the pressure applied, the flow depends directly on speed (hp = (Q*P)/(1714*ME), where hp is break horse power and ME is mechanical efficiency). Flow and power vary directly with a change in speed, while the NPSHr changes as the square of variation in speed (Evans 2014). The equations to determine the scaling up of the technologies are: Flow: Q2 = (N2/N1)*Q1
Power: kW2 = (N2/N1)*kW1 Head: NPSHr2 = (N2/N1)2*NPSHr1
Where: Subscript 1 indicates the values for the known pump, while 2 are the values for the second pump for which a value is unknown Q: capacity (litres per hour) N: speed (revolution per minute) kW: (power) NPSHr: (net positive suction displacement head required)
Having set the equations they can be applied to the case study.

45
Table 40. UHPH 90 and 360 l/h parameters UHPH90 UHPH360
Capacity (l/h) 90 360 Power (kW) 14.598 37.6 NPSHr (bar) 1 2 Speed (rpm) 234 620
UHPH commercially available have maximum capacities of 1000 and 1500 l/h. UHT capacity at industrial scale varies between 4 000 and 32 000 l/h for indirect and 2 000 and 30 000 l/h for direct steam injection. The revolutions per minute (rpm) to reach these capacities are shown in Table 49. Table 41. UHPH 90 and 360 l/h rpm versus capacity
Capacity (l/h) rpm (UHPH90) rpm (UHPH360) 1 000 2600 1736 1 500 3900 2604 2 000 5200 3472 4 000 10400 6944
30 000 78000 52083 32 000 83200 55556
All the variables are related to speed; in Graph 3 values are shown for the capacity corresponding to the calculated rpm versus energy requirement. To validate the use of affinity laws to model up scaling, the technical sheet of a series of 6 three-plungers and 2 five-plunger pressure pumps were analysed (Hammelmann n.d.). Graph 5 shows the results. The green line represents empirical data, till a capacity of 6360 l/h (triangular shaped indicators), and the projected consumption for capacities of 30 000 and 32 000 l/h (circular indicators). The graph confirms the linear relationship of capacity and power with speed.
Graph 3. Energy consumption for UHPH equipment with different capacities
y = 0.1622x - 4E-13
y = 0.1044x - 2E-13
y = 0.099x + 1.3558
0
1000
2000
3000
4000
5000
6000
0 5000 10000 15000 20000 25000 30000 35000
Pow
er (k
W)
Capacity (l/h)
UHPH90 UHPH360 Empirical

46
In the case of positive displacement reciprocating pump the scaling factor b is equal to 1 for most of the key properties. So when applied to life cycle assessment the environmental impacts will scale with constant return and with the same constant variable.

47
4 RESULTS
4.1 Life cycle impact assessment For the production of milk only the processing stage is considered in order to compare UHPH and UHT treatments. The results for the impact assessment of the production of milk with two UHPH, with different capacities, and UHT, including and excluding the energy recovery (ER) that this technology ensures at a larger scale, are presented in the following section. Graph 4 shows the normalised results.
Graph 4. Impact assessment of UHPH, 90l/h and 360l/h, and UHT, with and without energy recovery (ER) As expected UHPH performs better at bigger scale and outperforms UHT when energy recovery is not included. Including a 90% energy recovery the impact of UHT decreases significantly and outperforms the other systems. The characterised results are shown below (Table 42) for selected impact categories. The categories are chosen based on literature (Kim et al. 2013) and based on the most significant normalised values for this study. Table 42. Characterised results for UHPH treatment of milk for selected impact categories
Impact category Unit UHPH 90l/h UHPH 360l/h UHT (no ER) UHT (ER) Climate change kg CO2 eq 152.464 112.107 176.842 23.033
Freshwater eutrophication kg P eq 0.105 0.076 0.121 0.017 Human toxicity kg 1,4-DB eq 3111.198 2254.968 3565.864 484.49
Freshwater ecotoxicity kg 1,4-DB eq 1.68 1.218 1.926 0.263 Marine ecotoxicity kg 1,4-DB eq 2527.886 1832.544 2897.94 393.593
0
0.2
0.4
0.6
0.8
1
1.2
1.4
Pt
Impact categoires
UHPH360l/h
UHPH90l/h
UHT (no ER)
UHT (ER)
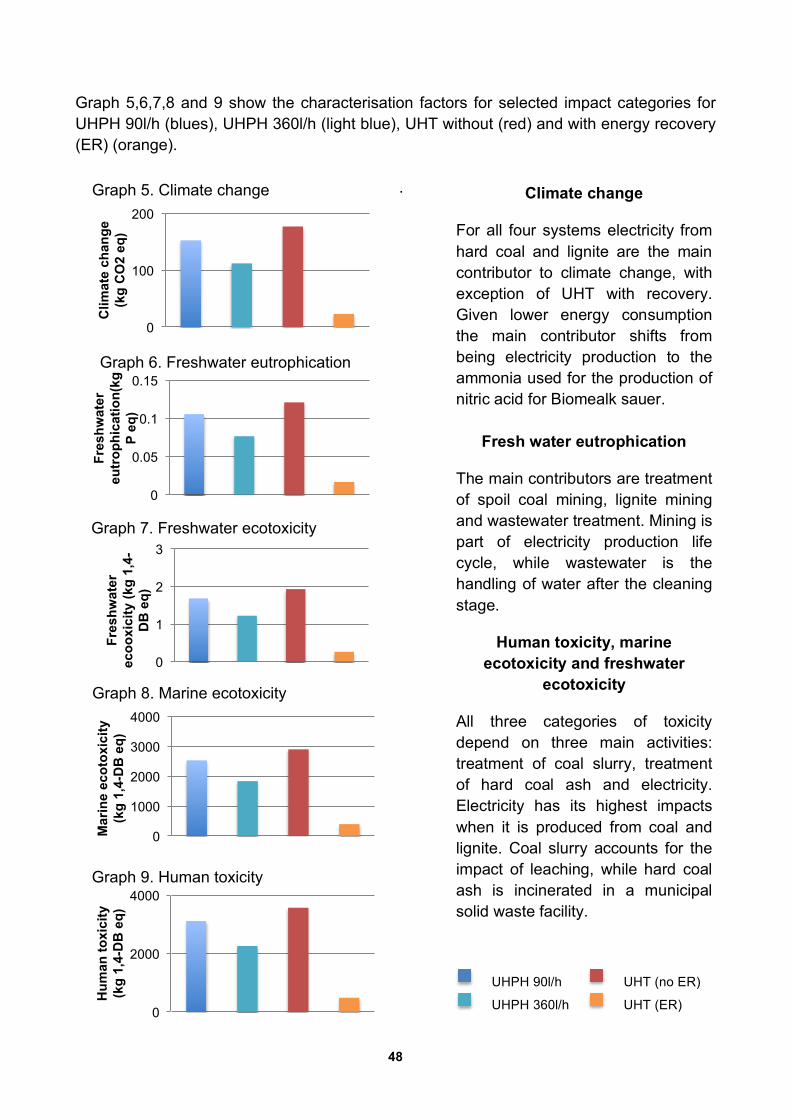
48
Graph 5,6,7,8 and 9 show the characterisation factors for selected impact categories for UHPH 90l/h (blues), UHPH 360l/h (light blue), UHT without (red) and with energy recovery (ER) (orange).
.
0
1
2
3
Fres
hwat
er
ecoo
xici
ty (k
g 1,
4-D
B e
q)
Graph 7. Freshwater ecotoxicity
0
1000
2000
3000
4000
Mar
ine
ecot
oxic
ity
(kg
1,4-
DB
eq)
Graph 8. Marine ecotoxicity
0
100
200
Clim
ate
chan
ge
(kg
CO
2 eq
)
Graph 5. Climate change
0
0.05
0.1
0.15
Fres
hwat
er
eutr
ophi
catio
n(kg
P
eq)
Graph 6. Freshwater eutrophication !
0
2000
4000
Hum
an to
xici
ty
(kg
1,4-
DB
eq)
Graph 9. Human toxicity
Climate change
For all four systems electricity from hard coal and lignite are the main contributor to climate change, with exception of UHT with recovery. Given lower energy consumption the main contributor shifts from being electricity production to the ammonia used for the production of nitric acid for Biomealk sauer.
Fresh water eutrophication
The main contributors are treatment of spoil coal mining, lignite mining and wastewater treatment. Mining is part of electricity production life cycle, while wastewater is the handling of water after the cleaning stage.
Human toxicity, marine ecotoxicity and freshwater
ecotoxicity
All three categories of toxicity depend on three main activities: treatment of coal slurry, treatment of hard coal ash and electricity. Electricity has its highest impacts when it is produced from coal and lignite. Coal slurry accounts for the impact of leaching, while hard coal ash is incinerated in a municipal solid waste facility.
UHPH 90l/h
UHPH 360l/h
UHT (no ER)
UHT (ER)

49
4.1.1 Process contribution
The processes that mainly contribute to UHPH processing are homogenisation and pre-heating. The difference between the two sizes depends on the higher energy efficiency of the larger scale pressure pump, so pre-heating becomes more important. For UHT treatment sterilisation and pre-heating are the most important processes. With the inclusion of energy recovery sterilisation remains one of the main contributors, but the importance of pre-heating decreases. Cleaning becomes relatively more important and consequently so does wastewater. The negative impact of homogenisation derives from the production of electricity from hydro sources and saving of tap water as hydroelectricity plants help conserving water tables (USGS n.d.). The same applies for sterilisation. The changes due to increased importance of cleaning can also be seen in increased marine eutrophication and the impact on agricultural land transformation derived from the use of wood chips in the production of sodium hydroxide. The differences of cleaning can also be seen between the two UHPH systems but the changes are of a smaller magnitude given a lower consumption of water.

50
Graph 10,11,12 and13 show the process contribution for UHPH 90l/h, UHPH 360l/h, UHT without and with energy recovery (ER).
-20%
30%
80% C
hara
cter
isat
ion
Graph 10. UHPH 90l/h
!
-20%
30%
80%
Cha
ract
eris
atio
n
Graph 11. UHPH 360l/h
-20%
30%
80%
Cha
ract
eris
atio
n
Graph 12. UHT
(no ER)
-100% -80% -60% -40% -20%
0% 20% 40% 60% 80%
100%
Cha
ract
eris
atio
n
Graph 13. UHT (ER)
Wastewater
Sterilisation
Cleaning
Homogenisation
Cooling
Pre-heating

51
4.1.2 Fresh cheese production
The life cycle inventory for cheese production is compiled based on a number of assumptions and no direct data from manufacturing gate to grave. It is therefore necessary to account for the high uncertainty. According to WRAP (2013) the majority of sold fresh cheese has an 8 days shelf life left out of 13 days in total. Based on this information given 19 days of total shelf life for fresh cheese from UHPH treated milk, the model accounts for 11 days in retail and 8 days of household refrigeration. Kim et al (2013) found the most important life cycle impact categories for the production of mozzarella cheese, which falls in the category of fresh cheese, were: climate change, marine eutrophication, photochemical oxidant formation, freshwater eutrophication, human toxicity and ecotoxicity. Given the correspondence between literature and the normalisation results of this study (Graph 14), the characterisation results for the mentioned categories plus fossil depletion are shown in Table 43 and the relevant process contribution in Graph 15. The normalised results and process contribution are shown for UHPH 90l/h. It was chosen to show the outcomes for only one machine as the relative importance of impact categories and of process are similar between the two.
Graph 14. Fresh cheese production UHPH 90l/h normalisation factors For climate change, the main activities contributing are transport and processing. The determinant in both cases is the production of diesel, for transportation purposes and as fuel for building machines used in hard coal electricity production. Mining spoils from the cleaning of the desired minable surface, are responsible for the impact of electricity production on eutrophication, human toxicity, marine and freshwater ecotoxicity. The other two determining source of environmental impact for ecotoxicity, fossil depletion and photochemical oxidant formation are petroleum extraction and natural gas production.
-0.5 0
0.5 1
1.5 2
2.5 3
3.5
Pt
Impact categories
Biowaste
Packaging disposal
Storage energy in household Transport to household Storage energy
Transport to retail
Packaging
Coagulation and curd cutting Cooling for fresh cheese Pre-heating
UHPH90l/h

52
These are part of both electricity production and transportation processes. For UHPH 360l/h similar results are obtained, the main difference is a decrease in contribution of the processing stage, given the lower energy consumption, and the relative increase of importance of transport.
Graph 15. Fresh cheese production process contribution for UHPH 90l/h The impact of avoided production and waste treatment is low as the amount of saved cheese is small. The impact of extended shelf life mainly depends on refrigeration in household. Even though food waste is prevented, the amount of waste after 13 days is low. Consumer’s behaviour is affected by multiple variables, in the case of milk WRAP assumed a normal distribution relating amount of milk purchased based on available shelf life. What the authors suggest is that a longer shelf life will decrease waste and a better stock rotation, keeping milk with a life between 5 and 11 days on the shelf, will lead to less waste. In this case the environmental saving is of approximately 0.05% for all impact categories. The German market, for example, demands 1 387 000 t of fresh cheese (Statistisches Jahrbuch 2012), which would require 9 590 651 l of milk. For climate change, 3 kg of CO2
would be saved for every 1000 l of processed milk for both UHPH 90 and 360 l/h (Table 50); so the application of UHPH treatment for the production of fresh cheese would have avoided the emissions of 28 772 kg of CO2 eq.
-5%
15%
35%
55%
75%
95%
Cha
ract
eris
atio
n
Impact categories
Biowaste
Packaging disposal
Storage energy in household Transport to household Storage energy
Transport to retail
Packaging
Coagulation and curd cutting Cooling
Pre-heating
UHPH90l/h

53
Table 43. Characterised results for UHPH 90 and 360 l/h fresh cheese production for selected impact categories
Impact category Unit
UHPH 90l/h (without avoided
emissions)
UHPH 90l/h (with
avoided emissions)
UHPH 360l/h (without avoided
emissions)
UHPH 360l/h (with avoided
emissions)
Climate change kg CO2 eq 521 518 601 598 Freshwater
eutrophication kg P eq 0.125 0.124 0.181 0.180
Marine eutrophication kg N eq 0.177 0.176 0.197 0.196 Human toxicity kg 1,4-DB eq 7876 7837 9526 9478
Photochemical oxidant formation
kg NMVOC 4.174 4.153 4.424 4.401
Freshwater ecotoxicity kg 1,4-DB eq 5.270 5.244 6.161 6.130 Marine ecotoxicity kg 1,4-DB eq 6133 6102 7474 7436
Fossil deplition kg oil eq 1312 1305 1330 1323 Dairy plant to grave represents 40% of overall impacts. Schmidt and Dalgaard (2012) studied carbon footprint of Danish and Swedish milk on national and farm level. The authors found using IPCC 2007 (100a) as impact assessment method, emissions of 1.06 kg of CO2eq, using consequential approach, and 1.05 kg of CO2eq using attributional approach, per kg of energy corrected milk (ECM). 1.06 kg of CO2eq are the result of a total impact of 2.26 kg of CO2eq (including iLUC, services and capital goods) and an avoided beef system of -1.88 kg of CO2eq. So if the farm stage were included in the assessment of the impact of increased shelf life, the environmental benefits would be considerably higher. For the functional unit of 1000 l, 0.943 kg of CO2eq / 1.033 *5.03 l = 4.6 kg of CO2eq, where 1.033 is the kg to litre conversion, would be avoided at cradle to farm gate. Table 44 shows the impact for the overall life cycle of fresh cheese production. This study results have been included and recalculated using the IPCC 2007 (100a) for consistency. Table 44. Total emissions in kg of CO2eq for UHPH90 fresh cheese processing including cradle to farm gate activities for functional unit of 1000 l
Cradle to farm gate
Farm gate to grave Cradle to grave
Emissions including iLUC Total emissions excluding iLUC,
excluding services & capital goods 908.4 647 1555.4
Avoided emissions 4.6 3 7.9
Total 913 644 1557 Emissions excluding iLUC
Total emissions including iLUC, services & capital goods
974.174 686 840.1
Avoided emissions 0.1 3 3.1
Total 193 644 837
On the German market this would translate in 9 590 651 l * 7.9 kg of CO2 eq / 1000 l = 75 766 kg of CO2 eq for the overall life cycle the.

54
4.1.3 Electricity sensitivity
The results for water depletion in the process contribution for milk production are not of big magnitude but it was considered important to further investigate the reason for the negative results for electricity production. To do so the electricity was changed from RoW to the same process but specific for Germany (Electricity, medium voltage {DE}| market for | Conseq, U). The difference found was in the contribution of the different activities but the positive affect on water depletion was still great in characterisation terms. The main responsible for this are the processes of electricity production from hydropower, which helps conserving water tables as explained above. Moreover to exclude methodology as a determining factor, the same process has been analysed using a water scarcity method Berger et al. (2014). A positive impact is found for all approaches (Table 45). Table 45. Water depletion values for different LCIA methodologies in m3
Recipe RoW Recipe DE Berger et al.
Total 0.013449122 -0.218913443 -3.32E-05
Pumping of product 0.001171978 -2.87E-05 -0.001530351
Pre-heating 0.054102207 -0.001324676 -0.000128684
Homogenisation -0.133308157 -0.137942143 -0.003520557
Sterilisation -0.038870131 -0.166312229 -0.000328092
Cooling 0.094588721 0.082711921 -0.001032295
Cleaning 0.208409963 0.176627838 -1.45E-06
Wastewater -0.172645458 -0.172645458 -3.32E-05

55
4.1.4 The issue of energy recovery: results
A minimum energy saving of approximately 54% of pre-heating energy consumption has been estimated. Following the savings, for 54% of pre-heating (ER 54%) and savings of pre-heating and cooling (ER 100%), are presented for climate change and water depletion impact categories (Graph 16 and 17). Climate change was chosen as the activity depends on the production of electricity. All impact categories, apart from water depletion, behave as climate change. Assuming a saving of 54%, the impact decreases by between 12 and 14%, for UHPH90, and 16 and 20%, for UHPH 360, of the overall impact. The results for water depletion are shown because of their greater magnitude and different trend. Water depletion decreased impact is of 39% for UHPH 90 and 24% for UHPH360. Assuming a total saving on heating and cooling, the impact decrease by 32 and 43% for UHPH 90 and 360 respectively. Water depletion changes by 86% for UHPH 90 and 36% for UHPH 360. Water depletion impact is lower for UHPH90 because of a greater negative effect of hydropower electricity.
Graph 16. Climate change characterisation results for UHPH 90 and 360 l/h with and without ER.
Graph 17. Water depletion characterisation results for UHPH 90 and 360 l/h with and without ER.
Table 46. Characterisation results for UHPH 90 and 360 with and without energy recovery for the selected impact categories
Impact category UHPH90 (no ER)
UHPH90 (ER 54%)
UHPH90 (ER 100%)
UHPH360 (no ER)
UHPH360 (ER 54%)
UHPH360 (ER 100%)
Climate change (kg of CO2 eq) 152 131 104 112 90 64
Water depletion (m3)
0.646 0.395 0.092 1.055 0.804 0.5
0 20 40 60 80
100 120 140 160 180
Clim
ate
chan
ge (k
g of
Co2
eq)
Climate change
0.0 0.2 0.4 0.6 0.8 1.0 1.2
Wat
er d
eplit
ion
(m3)
Water depletion

56
4.2 Scaling laws applied to environmental impact assessment Capacity and energy consumption scale linearly with speed, the equations are shown in the methodology section. The same relationship is applied in the environmental considerations, i.e. the same normalisation constant and power factor are applied (Graph 18). The main impact on the product’s life cycle is due to electricity consumption, it was therefore chosen to look at the relationship between the climate change impact category and capacity.
Graph 18. Climate change versus capacity for UHPH 90 and 360 l/h, empirical data and SimaPro Recipe results The larger pilot scale is similar to empirical data. On the other hand the smaller scale UHPH has a significantly lower efficiency. The difference between UHPH 90 and empirical data is of 40%, while UHPH 360 differs of only 12%. The variance between the two UHPH studied shows how pilot-scale measurements need adjustments and often not reflect performance at larger scale. Compared to the scaling that is obtained in SimaPro the results are similar and there is no variation greater of 9% for UHPH 90 and 6% for UHPH 360. Given the linear nature of the relationship of the key elements the results of the comparison with SimaPro were expected.
y = 0.1622x - 4E-13
y = 0.1044x
y = 0.0972x
y = 0.1477x - 0.1794
y = 0.111x - 0.1307
0
1000
2000
3000
4000
5000
6000
0 5000 10000 15000 20000 25000 30000 35000
Clim
ate
chan
ge (k
g C
O2
eq)
Capacity (l/h)
UHPH90
UHPH360
Empirical
SimaProRecipe90 SimaProRecipe360

57
5 DISCUSSION The study was set out to explore the environmental implications of ultra-high pressure homogenization, this processing technique has the aim of creating an emulsion and destroying microbes. The European Union has directed funding to assess this technology performance in the treatment of vegetable and animal milks. Bovine milk was used in this study because of its importance on international markets and its predisposition, as a substance, to behave like a buffer and so representing a good benchmark. To place the technology in today’s production context it was compared to one of the most common milk treatments, ultra high temperatures. When evaluating possible improvements at a single stage of production, upstream and downstream consequences need to be explored. No significant change on the supply chain could be forecasted for the use of UHPH processing for the production of drinkable milk but when used for the production of fresh cheese Escobar (2011) and Zamora (2014) found increased shelf life and yield. This study sought to give a comprehensive view of this technology. The importance of including a scaling methodology for environmental impacts is becoming a strong topic in literature (Shibasaki et al. 2006; Arvidsson et al 2013; Caduff et al. 2014; Hummen and Kästner 2014) and so a glimpse into the industrial application was included. Under the environmental aspect UHPH was predicted to lower energy consumption combining homogenization and sterilisation but at the same time have high heat loss (Zamora and Guamis 2014; Dumay et al. 2013). This study confirms what was expected; UHPH has a lower energy consumption compared to UHT and heat waste is one of the main concerns. High temperatures are reached and, as today, no heat recovery is included in pilot process systems. This last issue is what developers need to address. Technological readiness level cannot be disregarded when comparing novelties and established practices; ultra high temperature treatments have been used in the milk industry for decades having reached a top performance. On the other hand UHPH is a relatively new technology that still needs time to develop. This concept applies to all elements of a technology, for example materials that can withstand high pressures have only recently being discovered and applied. Additionally this study showed that some heat recovery is theoretically possible simply adding heat exchangers to the process line following the UHT example. This is an example of how eco-design can play a role in supporting the development of new technologies and the importance of assessing equipment performance as a single unit and as part of the entire process line. Lower energy requirements not only bring environmental benefits but it is also an economic advantage. According to Milani et al. (2011) processing is an economic issue rather then technological, as studies have shown possibility of emission reduction through the improvement of the efficiency of established technologies. For this particular study the energetic efficiency of UHT is already very important but UHPH not only could lower the consumption of electricity but also could provide a better product. Milk quality investigation was not in the boundaries of this study, but it is an important element in the evaluation of UHPH. European researches have shown the potential of pressure treatments of

58
producing a safe food item maintaining the nutritional characteristics, which are deteriorated by the exposure to high temperatures. Consumers are increasingly more careful in the choice of their diet composition and require to be more informed about the characteristics of the food items on the shelves. UHT milk cooked taste and nutrient poverty (Clare et al. 2005) have been reason for campaigns against shelf stable milk (Forristal 2004). Consumer acceptance of this product is different depending on countries cultural preferences. European demand for this product is generally strong, while American consumers prefer their milk to be refrigerated. UHPH milk can represent a valid alternative to UHT on European markets, providing higher quality without loosing on shelf life, and could be more easily accepted on the American market if sensory and nutritional values are of better quality. Under a process contribution perspective the impact categories identified as significant under a normalisation results point of view are similar to what is found in literature (Kim et al 2013). As expected electricity production is the most relevant impact for the climate change category. When energy recovery is included in the results cleaning becomes important; in fact, the production of Biomealk sauer agent is the main impact for UHT with ER. Cleaning requires high energy (Eide et al. 2002) and it is the most water demanding stage, after irrigation, for the overall life cycle of dairy products. Eide et al. (2002) found cleaning to be responsible for 80% of eutrophication and 30% of energy requirements. In this study cleaning (represented by the sum of cleaning and wastewater activities) accounts for 20% of freshwater eutrophication and 50% of marine eutrophication for UHT with energy recovery. The difference in findings might derive partly from the exclusion of product residuals treatment, the inclusion of cleaning in place exclusively and from the pilot scale nature of the system. Product waste gives rise to high chemical oxygen demand (COD), biochemical oxygen demand (BOD), nitrogen (N) and phosphorus (P) (Eide et al. 2002). The influence of waste product on eutrophication can be as high as five times more than cleaning agents’ impact, if no treatment is included. Nevertheless efficient cleaning and wastewaters treatments can decrease waste concentration in wastewater and decrease the amount of substances that reach the environment (Eide et al. 2002). The study of fresh cheese production showed the relevance of the processing stage. UHPH made for a fourth of farm-gate to grave climate change related emissions and for a tenth of the overall carbon footprint of cheese production. Similar results are found in literature (Cashman 2009). Research and technical development can therefore contribute significantly to mitigation. Life cycle stages after farm gate still represent almost half of the overall impact and should not be disregarded. Transport and refrigeration are the other aspects on which research should focus on. This is particularly evident from the evaluation of the effect of extended shelf life. Additionally extended shelf life could also lead to longer transportation distances. The controversy between a more efficient, economically and environmentally, larger production (Eide 2002) versus a more desirable local distribution is not unknown. Further investigation of this issue is needed to support effective decision-making. The results of the modelled fresh cheese production are highly uncertain as built on a combination of literature data and as many values vary between countries, such as transport distances. Moreover the relations between food waste and shelf life can be

59
subjected to high criticisms because modelling consumers’ behaviour is a hard task and subject to cultural differences. Initiative such as the recent French legislation (Chrisafis 2015) that bans food waste forcing supermarket to donate unsold food might be an easier and more efficient way to address waste at retail and consumer level. This in combination with good managements practices, such as efficient stock rotation, could give an important contribution to decreasing waste. Nevertheless the positive effect of extended shelf life shall not be disregarded as, food waste, malnutrition and battle for land are three of the greatest issues faced nowadays. Farming activities are mainly responsible for the impact of food items, as shown in the results for cheese production, the relevance of emissions at farm stage more than doubles the saving of carbon dioxide emissions. Therefore any novelty that can decrease impacts at that stage should be thoroughly investigated. Agricultural emissions not only derive from human activities but an important share is biogenic. The past years the impact of livestock has been extensively addressed as human impact on climate change derives from agriculture and the impact of agriculture is mainly due to livestock’s enteric digestion and manure management. Diets need to change and rearing needs better practice. Given these premises stages after farm-gate cannot be ignored. Moving onto scaling considerations, the chosen method seems the most appropriate at this stage. Caduff’s approach gives a projection of what the technology can achieve at the moment, giving insights for further development. For a long-term prospective the exclusion or mature approaches, i.e. not including the novelty in the calculations or assigning it the same impact as the established practice, would be more appropriate (Arvidsson et al 2013). If one of the mentioned approaches were applied to compare UHPH and UHT, the former technology would represent a better solution as it provides higher quality. Scaling showed linear relationships between the main variables and the environmental impact for UHPH because of the technical characteristics of positive displacement pumps, but revealed the learning through increased efficiency from different pilot scales and empirical evidence. This study showed that even if data is not available for larger scale, a combination of engineering principles and similar equipment forecasting is possible. Moreover the learning effect between the two pilot scale UHPH could be integrated into the scaling equation, as done by Caduff et al. (2012) for wind turbines, to predict the potential future increase in efficiency. There is therefore ground for the development of this technology. Additionally referring back to what Shibasaki et al. (2006) identified as key points to include in this kind of life cycle assessment studies, further considerations should be included. In this study technological aspects have been looked at, but further in depth research needs to be included. For instance research on valve design and materials is key in UHPH scaling. Issues such as legislation and costs can vary with scale, in particular costs can be key as processing is mainly an economic issue (Milani et al. 2011). The lifetime of the equipment will be an important point in feasibility assessments and the saving in terms of energy consumption will be key in determining the advantages of the technology under a cost perspective. The third point raise by Shibasaki et al. (2006) refers to synergies. Heat regeneration has already been mentioned but the equipment has been

60
mainly considered on its own, for a proper exploration of industrial performance the all system should be included in the analysis. UHPH effects on milk processing needs further research, for example the impact on milk shelf life should be verified as well as consumers’ perception of UHPH milk to assess market acceptance of the product. Further research is needed in general on food items processing, as their contribution to mitigation can be significant. Moreover the impact of extending shelf life, integrating retail practices and consumer behaviour, should be investigated in order to take advantage of possible reduction in waste. The application of scaling methodologies to LCA should become a more common practice and therefore there is a need of the validation of existing methods and of new approaches.
Further research: drugs and cosmetics
UHPH application is not restricted to the food sector. Emulsion formation is a key process for industries, such as the pharmaceutical and cosmetic. The technology might be more competitive in the processing of non-edible products. Further studies should therefore look into upstream and downstream consequences in other sectors and line of productions. Based on viscosity and other parameters, the energy consumption and the considerations made in this study can be applicable to other products as well.
Limitations
- There are some general limitation of LCA studies, such as the exclusion of capital goods, data reliability and the selection of life impact categories. Additionally the study system boundaries for milk production are set to include only the production line available in the laboratory; the inclusion of other stages of production would contribute to a better overview of the overall production phase. - Pilot scale production lines are built with equipment of different size. Some equipment had to be readjusted to work at the needed capacity; this can vary the consumption, as the machine is not used at its best efficiency. - Data reliability for pilot scale tests values is subject to uncertainty given the means of measurement uncertainty. - Only cleaning in place (CIP) is included in the study and the starting and shutting down phase of the equipment is not included. - Cheese production is based on theoretical assumptions and many activities such as, transportation, are country specific. The uncertainties are therefore high. However, the insight on cheese production demonstrates the possible applicability of the research results. A further limitation is that waste in only considered at consumer level. - The scaling up of empirical data is made based on affinity laws and the last empirical data is for equipment of size 3 600l /h versus the assumption a maximum capacity of 32 000l/h. - Only ten machineries are included in the scaling up.

61
6 CONCLUSION Population growth puts pressure on food availability making research in food technologies fundamental for future production. The westernization of diets increasing milk and meat demand threatens the goals to decrease human induced atmospheric emissions. The agricultural sector is the main responsible for anthropogenic impact on the environment. This study aimed at exploring the impact of a new processing technology, ultra-high pressure homogenization. This technology provides emulsion, while destroying microbes. Applied to the production of milk energy consumption is 14% lower than existing technologies at pilot scale, a minimum 15% of energy recovery is achievable. The exploitation of valve temperature could increase energy savings up to reducing by 43% CO2 emissions (Graph 20 and 21). Additionally UHPH milk can become a potential competitor to UHT if further researches on its properties show higher quality for sensory and nutritional values. There is therefore a large potential market for this product. The technology needs time to develop but there are good basis for a successful application.
Graph 19. Climate change savings given by energy recovery and higher efficiency The study of fresh cheese production and the calculation on energy recovery showed the relative importance of processing and the benefits that could derive from technological innovation. Even though not a lot of cheese is wasted, extended shelf life has positive effects, reducing waste and increasing yield, and the benefits more than double if the farming stage is included as well. At industrial scale impacts scale linearly but increased efficiency is shown between different pilot scale equipment and empirical evidence. Synergies, economic benefit and the entire product line should be evaluated to have a comprehensive view on industrial application. UHPH is a promising technology but it still is at early stages of development; in particular in the processing of milk, the energy requirements need to decrease compared to existing practices. The investigation of the use of UHPH in other industries is recommended as its performance could bring significant benefits.
UHPH 90 (no ER) UHPH 90 (ER 100%) UHPH 360 (no ER) UHPH 360 (ER 100%)
0
20
40
60
80
100
120
140
160
UHPH 90 UHPH 360
Clim
ate
chan
ge (k
g of
Co2
eq)
-32%
-43%

62
REFRENCE LIST
Acero, A.A.P., Rodríguez, C. and Ciroth, A., 2014. LCIA methods Impact assessment methods in Life Cycle Assessment and their impact categories. , (February), pp.1–23.
Air Products, 2010. Tomadol Ethoxylated Alcohols. Product Guide.
Alvarez, N., Daufin, G. and Gésan-Guiziou, G., 2010. Recommendations for rationalizing cleaning-in-place in the dairy industry: case study of an ultra-high temperature heat exchanger. Journal of dairy science, 93(2), pp.808–821. Available at: http://dx.doi.org/10.3168/jds.2009-2760.
Amador Espejo, G.G. et al., 2014. Inactivation of Bacillus spores inoculated in milk by Ultra High Pressure Homogenization. Food Microbiology, 44, pp.204–210.
Anelli, n.d. Available at: http://www.anelliluigi.it/inglese/azienda/index.php
APV, 2008. Long Life Dairy , Food and Beverage Products APV Technology Update – Long Life Dairy, Food And Beverage Products. Available at: http://www.apv-tapflo.ro/userfiles/file/Technology_Update_6750_01_08_2008_US.pdf
Arvidsson, R. et al., 2013. HOW TO MAKE POLICY-RELEVANT LIFE CYCLE ASSESSMENTS OF FUTURE PRODUCTS)? LESSONS LEARNED FROM NANOMATERIALS Technology-related. (Grübler 1998).
Bakshi, a S. and Smith, D.E., 1984. Effect of Fat Content and Temperature on Viscosity in Relation to Pumping Requirements of Fluid Milk Products1. Journal of Dairy Science, 67(6), pp.1157–1160. Available at: http://dx.doi.org/10.3168/jds.S0022-0302(84)81417-4.
Barnard, N., 2014. Cows – Not coal – Are the Real Climate Change Culprits. Huffingtonpost. Available at: http://www.huffingtonpost.com/neal-barnard-md/cowsnot-coalare-the-real-_b_5526979.html
Baroulaki, E. and Veshagh, A. 2007. Eco-Innovation: Product Design and Innovation for the Environment. Proceedings of the 14th CIRP Conference on Life Cycle Engineering, Waseda University, Tokyo, Japan, June 11th–13th, 2007
Bouamra-Mechemache, 2008. “ Economic analysis of the effects of the expiry of the EU milk quota system .” , (March), pp.0–98.
Brennan, J.G. and Grandison, A.S., 2012. Mixing, Emulsification, and Size Reduction. In J. G. . Brennan, ed. Food Processing Handbook. Weinheim: Wiley-VCH, pp. 363–406.

63
British Standards Institution (BSI), 2011. PAS 2050: Specifi cation for the assessment of the life cycle greenhouse gas emissions of goods and services. , p.45.
Bylund, G., 2003. Chapter 2: The Chemistry of Milk. In Dairy Processing Handbook. Lund: Tetra Pak Processing Systems, pp. 13–36.
Bylund, G., 1995. Dairy Processing Handbook T. AB, ed., Tetra Pak Processing Systems AB. Available at: http://www.ales2.ualberta.ca/afns/courses/nufs403/PDFs/chapter15.pdf.
Caduff, M. et al., 2011. Power-law relationships for estimating mass, fuel consumption and
costs of energy conversion equipments. Environmental Science and Technology,
45(2), pp.751–754.
Caduff, M. et al., 2014. Scaling Relationships in Life Cycle Assessment. Journal of Industrial Ecology, 18(3), pp.393–406. Available at: http://doi.wiley.com/10.1111/jiec.12122.
Caduff, M. et al., 2012. Wind power electricity: The bigger the turbine, the greener the
electricity? Environmental Science and Technology, 46(9), pp.4725–4733.
Cashman, S. et al., 2009. Charting the Course for Sustainability at Aurora Organic Dairy Phase I!: Energy and Greenhouse Gas Life Cycle Assessment, Available at: http://deepblue.lib.umich.edu/bitstream/handle/2027.42/62094/AOD_report_apr21.pdf?sequence=1andisAllowed=y.
Centers for Disease Control (CDC), 2012. Dairy processing plants: guidelines for the cleaning of dairy plant processing equipment, Available at: http://www.bccdc.ca/NR/rdonlyres/BF40BB53-6264-48AD-8A25-A09F43B5CAF0/0/DairyProcessingCleaning.pdf.
Chavan, R.S. et al. 2011. Milk Processing and Effect of Plasmin Activity on Shelf Life: A Review. Comprehensive Reviews in Food Science and Food Safety, 10, pp. 251-268
Chemicals, P., AE-7 , Alcohol Ethoxylate. , p.7.
Chrisafis, A., 2015. France-to-force-big-supermarkets-to-give-away-unsold-food-to-charity. Available at: http://www.theguardian.com/world/2015/may/22/france-to-force-big-supermarkets-to-give-away-unsold-food-to-charity.
Clare, D. a et al., 2005. Comparison of sensory, microbiological, and biochemical parameters of microwave versus indirect UHT fluid skim milk during storage. Journal of dairy science, 88(12), pp.4172–4182.

64
Company, T.C., Surfactant guide. Available at: http://dwb4.unl.edu/Chem/CHEM869A/CHEM869ALinks/www.tigerchem.com/surf.html.
DRMS, 2014. DHI Glossary, Available at: http://www.drms.org/PDF/materials/glossary.pdf.
Dumay, E. et al., 2013. Technological aspects and potential applications of (ultra) high-pressure homogenisation. Trends in Food Science and Technology, 31(1), pp.13–26.
DuPont, 2004a. Thermodynamic properties of HFC- 134 a.
Eide, M.H., 2002. Life cycle assessment (LCA) of industrial milk production. The International Journal of Life Cycle Assessment, 7(1998), pp.115–126.
Eide, M.H., Homleid, J.P. and Mattsson, B., 2003. Life cycle assessment (LCA) of cleaning-in-place processes in dairies. LWT - Food Science and Technology, 36, pp.303–314.
EngineersEdge, Pipe flow capacity. Available at: http://www.engineersedge.com/pipe_flow_capacity.htm.
Escobar, D. et al., 2011. High-pressure homogenization of raw and pasteurized milk modifies the yield, composition, and texture of queso fresco cheese. Journal of dairy science, 94(3), pp.1201–1210. Available at: http://dx.doi.org/10.3168/jds.2010-3870.
European Commision, UHPH Result In Brief. Available at: http://cordis.europa.eu/result/rcn/51912_en.html
Evans, J., 2014. Are doors on fridges the best environmental solution for the retail sector)? , (2009), pp.1–11.
Fantin, V. et al., 2008. Life Cycle Assessment of Italian High Quality Milk Production. Energy.
FAO, 2015. FAOstats. Available at: http://faostat3.fao.org/home/E
Florristal, 2014. Ultra-Pasteurized Milk. Available at: http://www.westonaprice.org/health-topics/ultra-pasteurized-milk/
Floury, J., Desrumaux, A. and Lardieres, J., 2000. Effect of high-pressure homogenization on droplet size distributions and rheological properties of model. Journal of dairy science, 1, pp.127–134.
Floury, J., Legrand, J. and Desrumaux, A., 2004. Analysis of a new type of high pressure homogeniser. Part B. study of droplet break-up and recoalescence phenomena. Chemical Engineering Science, 59(6), pp.1285–1294.

65
Flysjö, A., 2012. Greenhouse gas emissions in milk and dairy product chains – improving the carbon footprint of dairy products. Available at: http://pure.au.dk/portal/files/45485022/anna_20flusj_.pdf
Foster, C. et al., 2006. Environmental impacts of food production and consumption: A report to the Department for Environment Food and Rural Affairs. London, Manchester Business School, Defra(December), p.199.
Fox, P. F., and McSweeney, P. L. H., 1998. Dairy Chemistry and Biochemistry. Blackie Academic and Professional, an imprint of Chapman and Hall, London.
GEA Process Engineering A/S, GEA Niro Cleaning-in-Place Systems. Available at: http://www.niro.com/niro/cmsdoc.nsf/webdoc/webb7xme7c.
Georget, E. et al., 2014a. (Ultra) High Pressure Homogenization for Continuous High Pressure Sterilization of Pumpable Foods - A Review. Frontiers in Nutrition, 1(August), pp.1–6. Available at: http://journal.frontiersin.org/Journal/10.3389/fnut.2014.00015/full.
Georget, E. et al., 2014b. Bacterial spore inactivation by ultra-high pressure homogenization. Innovative Food Science and Emerging Technologies, 26, pp.116–123. Available at: http://linkinghub.elsevier.com/retrieve/pii/S1466856414001349.
Georget, E. et al., 2013. Spore Inactivation Mechanisms during Industrial Food and Equipment Sterilization. Encyclopedia of Biotechnology in Agriculture and Food, (March), pp.1–6. Available at: http://dx.doi.org/10.1081/E-EBAF-120048482.
Gilbert, N., 2012. One third of our greenhouse gas emissions come from agriculture. Available at: http://www.nature.com/news/one-third-of-our-greenhouse-gas-emissions-come-from-agriculture-1.11708.
González-García, S. et al., 2013. Using Life Cycle Assessment methodology to assess UHT milk production in Portugal. Science of the Total Environment, 442, pp.225–234. Available at: http://dx.doi.org/10.1016/j.scitotenv.2012.10.035.
Graham Corporation, UltraHeat Plate Heat Exchanger Operation , Maintenance and Installation Manual.
Guamis, 2011. UHPH report summary: Final report summary- UHPH (Development and Optimisation of a Continuous Ultra High Pressure Homogeniser for Application on Milks and Vegetable Milks),
Guamis, B., 2007. FP6 Co-operative Research Projects Development and Optimisation of a Continuous Ultra High Pressure Homogeniser for Application on Milks and Vegetable Milks Final report Partner 1,

66
Hammelmann, High pressure plunger pumps. Available at: http://www.hammelmann-process.de/wDeutsch/produkte/.
Hassan, A. et al., 2009. Asian Journal of Food and Agro-Industry. , 2(03), pp.434–447.
Hospido, a., Moreira, M.T. and Feijoo, G., 2003. Simplified life cycle assessment of galician milk production. International Dairy Journal, 13, pp.783–796.
Hummen, T. and Kästner, F., 2014. Evaluating Existing Methodological Approaches for Prospective LCA at Early Technology-Development Stages. Proceedings from the LCA XIV International Conference, October 6-8, 2014, San Francisco, CA, United States
IDF, 2010. A common carbon footprint apprach for dairy. The IDF guide to standard lifecycle assessment methodology for the dairy sector,
Kielczewska, K. et al., 2006. Effects of high-pressure homogenization on the physicochemical properties of milk with various fat concentrations. Polish Journal of Food and Nutrition Sciences, 15(48 89), pp.91–94.
Kim, D. et al., 2013. Life cycle assessment of cheese and whey production in the USA. International Journal of Life Cycle Assessment, 18(5), pp.1019–1035.
Kourie, J.I., 1998. Interaction of reactive oxygen species with ion transport mechanisms. The American journal of physiology, 275(1 Pt 1), pp.C1–C24. Available at: http://dx.doi.org/10.3168/jds.2010-3955.
Lewis, M.J. and Deeth, H.C., 2009. Heat Treatment of Milk. In A. Y. Tamime, ed. Milk Processing and Quality Management. Chichester: Blackwell Publishing, pp. 168–204.
Meyer, E., 2014. China and its coming Great Milk Battle. Forbes. Available at: http://www.forbes.com/sites/ericrmeyer/2014/10/30/china-and-its-impending-great-milk-battle/.
Milani, F.X. et al., 2011. Invited review: Environmental impacts of dairy processing and products: A review. J. Dairy SCI.
Muehlhoff, E., Bennett, A. and McMahon, D., 2013. Milk and dairy products in human nutrition.
Munksgaard, E., 2014. THE R/I NEEDS AND CHALLENGES FOR THE EU FOOD INDUSTRY. Available at: http://www.lets2014.eu/fileadmin/content/presentations/01%20-%20Munksgaard.pdf
Nigri, E.M. et al., 2014. Assessing environmental impacts using a comparative LCA of industrial and artisanal production processes): “ Minas Cheese ” case. , 2014(006356), pp.522–531.

67
Nottel, P., 2011. LCA of milk production in the western cape. Available at: http://awsassets.wwf.org.za/downloads/09024___dairy_lca_executive_summary_july_2011.pdf
Nutter, D.W. et al., 2013. Greenhouse gas emission analysis for USA fluid milk processing plants: Processing, packaging, and distribution. International Dairy Journal, 31(1), pp.S57–S64. Available at: http://dx.doi.org/10.1016/j.idairyj.2012.09.011.
O’Mahony, J.A. and Fox, P.F., 2013. Milk Proteins: Introduction and Historical Aspects. In P. H. McSweeney and P. Fox, eds. Avanced Dairy Chemistry. Volume 1A: Proteins: Basic Aspects. New York: Springer, pp. 43 – 86.
Pagan, B., Prasad, P. and Price, N., 2005. No TitleInnovations in Australian Food Processing – an eco-efficiency perspective. In 6th Asia Pacific Roundtable for Sustainable Consumption and Production. Brisbane.
Particle Sciences, 2011. Emulsion Stability and Testing, Available at: http://www.particlesciences.com/docs/technical_briefs/TB_2011_2.pdf.
Elert, G. 2015. Physicsinfo Hypertextbook. Available at: http://physics.info
PandG, n.d.a. Porduct information sheet - AE-3, Alcohol Ethoxylate. Available at: https://www.pgchemicals.com/wp-content/uploads/2012/01/AE-3-TDS.pdf
PandG, n.d.b. Porduct information sheet - AE-7, Alcohol Ethoxylate. Available at: https://www.pgchemicals.com/wp-content/uploads/2012/01/AE-7-TDS.pdf
Pearson, J., 2014. The “Elephant in The Room” When it comes to Climate change. Urban times. Available at: https://urbantimes.co/2014/04/methane-climate-change/
Ramírez, C. a. and Worrell, E., 2006. Feeding fossil fuels to the soil: An analysis of energy embedded and technological learning in the fertilizer industry. Resources, Conservation and Recycling, 46, pp.75–93.
RapidTables, Power factor. Available at: http://www.rapidtables.com/electric/Power_Factor.htm#power factor definition.
Robertson, G.L., 2013. Packaging of Dairy Products. In Food Packaging: Principles and Practice. CRC Press.
Roibás, L., Elbehri, A. and Hospido, A., 2014. Carbon footprint along the Ecuadorian banana supply chain): Methodological improvements and calculation tool.
Sakai, K., 2007. Ricoh’s Approach to Product Life Cycle Management and technology Development. Proceedings of the 14th CIRP Conference on Life Cycle Engineering, Waseda University, Tokyo, Japan, June 11th–13th, 2007

68
Schmidt, H.J. and Dalgaard, R., 2012. National and farm level carbon footprint of milk - Life cycle inventory for Danish and Swedish milk 2005 at farm gate, Aarhus.
Shibasaki, M., Warburg, N. and Eyerer, P., 2006. Upscaling effect and Life Cycle Assessment. In Proceedings of LCE 2006. pp. 61–64.
SpiraxSarco, n.d. Steam engineering tutorials. Available at: http://www.spiraxsarco.com/resources/pages/steam-engineering-tutorials.aspx
SPX, n.d. Laboratory homogenizer Models 15M and 13M troubleshooting guide. Available at: http://www.spx.com/en/assets/pdf/SB9_Laboratory_Homog_M_Series_3134_US_tcm11-7644.pdf.
SPX, 2013. Long Life Dairy, Food and Beverage Products,
Statistisches Jahrbuch 2011. Statistisches Jahrbuch über Ernährung - Landwirtschaft und Forsten, Landwirtschaftsverlag Münster, Hiltrup, Germany, 2011.
Tetra Pak, 2010. Tetra Alcip CIP. Available at: http://www.tetrapak.com/documentbank/PD10334en.pdf.
Tetra, T. et al., Tetra Damrow TM Double-O Vat 8 Type DB. Available at: http://www.tetrapak.com/documentbank/pd10085_en_low_tetra_damrow_double_o_vat.pdf.
Thoma, G. et al., 2013. Greenhouse gas emissions from milk production and consumption in the United States: A cradle-to-grave life cycle assessment circa 2008. International Dairy Journal, 31(1), pp.S3–S14. Available at: http://dx.doi.org/10.1016/j.idairyj.2012.08.013.
Thomassen, M. a. et al., 2008. Attributional and consequential LCA of milk production. International Journal of Life Cycle Assessment, 13(4), pp.339–349.
Tiger Chemical Company, n.d. Tomadol Ethoxylated Alcohols. Product Guide. Available at: http://www.airproducts.com/~/media/Files/PDF/industries/industrial-and-institutional-cleaning-tomadol-ethoxylated-alcohols-product-guide.pdf
Triowin, UHT milk line. Available at: http://www.triowindairy.com/wodi/Completeline.aspx?id=26.
USG, n.d. Advantages of Hydroelectric Power Production and Usage, Available at: https://water.usgs.gov/edu/hydroadvantages.html
Weidema, B. and Eder, P., 2008. Environmental improvement potentials of meat and dairy products. Available at:

69
http://ftp.jrc.es/EURdoc/JRC46650.pdf\nhttp://www.saiplatform.org/uploads/Library/EnvironmentalImprovementsPotentialsofMeatandDairyProducts.pdf.
Weidema, B., et al. 2009. Meat and milk products in Europe: Impacts and improvements, in Towards a Sustainable Management of the Food Chain, ART
Weidema, B. et al., 2013. Overview and methodology - Data quality guideline for the ecoinvent database version 3. Ecoinvent report No. 1(v3) St. Gallen, 2013-05-06
WHO/FAO, 1993. Codex Alimentarius Commision (WHO/FAO) CAC/RCP 40-1993
Wrap, 2010. Helping consumers reduce food waste – a retail survey. , (May 2010), pp.1–7. Available at: http://www.wrap.org.uk/sites/files/wrap/240412%20Retailer%20review%202011%20ES.pdf
WRAP, 2015. Reducing food waste by extending product life, Available at: http://www.wrap.org.uk/content/reducing-food-waste-extending-product-life.
WRAP, 2013. The Milk Model!: Simulating Food Waste in the Home. Available at: http://www.wrap.org.uk/sites/files/wrap/Milk%20Model%20report.pdf
Yaron, L., 2014. Milk quality in China. DeLaval. Available at: http://www.milkproduction.com/Library/Editorial-articles/Milk-quality-in-China-/.
Yasui, S.,2007. Transition of Environmental Issues – Fundamental Criteria for LC Engineering. Proceedings of the 14th CIRP Conference on Life Cycle Engineering, Waseda University, Tokyo, Japan, June 11th–13th, 2007
Zamora, A., 2009. Ultra-high pressure homogenisation of milk: effects on cheese-making.
Zamora, A. and Guamis, B., 2014. Opportunities for Ultra-High-Pressure Homogenisation (UHPH) for the Food Industry. Food Engineering Reviews. Available at: http://link.springer.com/10.1007/s12393-014-9097-4.