Environmental applications of thermal extraction cone...
9
FIELD ANALYTICAL CHEMISTRY AND TECHNOLOGY 5(1– 2):60– 68, 2001 2001 John Wiley & Sons, Inc. Environmental Applications of Thermal Extraction Cone Penetrometry and Ultrafast Gas Chromatography/Mass Spectrometry Albert Robbat, Jr. Center for Field Analytical Studies and Technology, Chemistry Department, Tufts University, Medford, Massachusetts 02155 Received 28 December 2000; revised 22 January 2001; accepted 24 January 2001 Abstract: This article describes the collection and anal- ysis of organic contaminants at depth without bring- ing soil to the surface. A thermal extraction cone pene- trometer (TECP) probe was used to extract soil-bound semivolatile organics, transferring them to the sur- face for analysis by ultrafast gas chromatography/mass spectrometry (GC/MS). Findings showed that polychlo- rinated biphenyls, polycyclic aromatic hydrocarbons, chlorinated pesticides, and explosives could be col- lected and analyzed in 5 min when the soil-water content was 20% and in 15 min when it was between 20 and 35%. When the TECP was directly connected to the GC/MS, trinitrotoluene (TNT) and four of its synthetic precursors were speciated in 20 sec. Moreover, 51 VOCs were detected by membrane-inlet mass spec- trometry in 10 sec. Organics were “sniffed” from a vial and identified using the Ion Fingerprint Detection TM soft- ware. The algorithms provide the means to untangle complex mass spectra making real-time, electronic nose detection and identification by MS possible. 2001 John Wiley & Sons, Inc. Field Analyt Chem Technol 5: 60–68, 2001 Keywords: thermal extraction cone penetrometry; gas chromatography/mass spectrometry Introduction Field analytics can play a central role in environmental assessment, control, and monitoring. The closer the instru- ment is to the sample, the better (more representative) the data, and the faster information can be obtained about the Correspondence to: A. Robbat, Jr. Contract grant sponsor: U.S. Environmental Protection Agency, NCE- RQA program Contract grant number: R826184010 site. Site-directed sample collection and analysis programs translate into lower site characterization, cleanup, and mon- itoring costs. 1–3 One of our goals was to develop a system that could collect subsurface soil contaminants quickly, without bringing the sample to the surface. A second goal was to match (as closely as possible) the sample-collection rate with the analysis rate, while minimizing human involve- ment as much as possible. Several different and ultimately integrating technologies were developed and presented at the 2000 Pacifichem Conference in the session entitled “Recent Developments in Field Analysis.” Results produced by a thermal extraction cone penetrom- eter (TECP) sample collection and analysis system were de- scribed. The sampling probe is capable of extracting soil gas and soil-bound volatile and semivolatile organic compounds (VOC and SVOC) at depths of up to 25 m. An ultrafast gas chromatography/mass spectrometry (GC/MS) system was described. The GC module is temperature programmable from 0.03 to 100 C/s. Sample introduction is made by sy- ringe injection, TECP probe, or directly from soil or solid- phase adsorbent without changing the GC inlet with the use of a ballistically heated thermal desorption (TD) unit. Fi- nally, the resolving and quantitative application of new mass spectrometry data-analysis software was illustrated. The de- convolution algorithms imbedded in the software uniquely identify structurally different organics in the presence of each other as well as other matrix interferents. Results were presented comparing data produced by the TECP, TD, and soil-solvent extraction methods. Findings showed that the quality of data was as good as that required by EPA stan- dardized methods and that the rate samples can be collected from the subsurface is dependent on geology and soil mois- ture, whereas the rate of analysis is depen-dent only on whether structural isomers must be distinguished.
Transcript of Environmental applications of thermal extraction cone...

FACT WILEY-Interscience LEFT BATCH
shortstandardlong
FIELD ANALYTICAL CHEMISTRY AND TECHNOLOGY 5(1–2):60–68, 2001
� 2001 John Wiley & Sons, Inc.
Environmental Applications of Thermal Extraction ConePenetrometry and Ultrafast Gas Chromatography/MassSpectrometry
Albert Robbat, Jr.Center for Field Analytical Studies and Technology, Chemistry Department, Tufts University, Medford,Massachusetts 02155
Received 28 December 2000; revised 22 January 2001; accepted 24 January 2001
Abstract: This article describes the collection and anal-ysis of organic contaminants at depth without bring-ing soil to the surface. A thermal extraction cone pene-trometer (TECP) probe was used to extract soil-boundsemivolatile organics, transferring them to the sur-face for analysis by ultrafast gas chromatography/massspectrometry (GC/MS). Findings showed that polychlo-rinated biphenyls, polycyclic aromatic hydrocarbons,chlorinated pesticides, and explosives could be col-lected and analyzed in 5 min when the soil-water contentwas �20% and in 15 min when it was between 20 and35%. When the TECP was directly connected to theGC/MS, trinitrotoluene (TNT) and four of its syntheticprecursors were speciated in 20 sec. Moreover, 51VOCs were detected by membrane-inlet mass spec-trometry in �10 sec. Organics were “sniffed” from a vialand identified using the Ion Fingerprint Detection TM soft-ware. The algorithms provide the means to untanglecomplex mass spectra making real-time, electronic nosedetection and identification by MS possible. � 2001 JohnWiley & Sons, Inc. Field Analyt Chem Technol 5: 60–68,2001Keywords: thermal extraction cone penetrometry; gaschromatography/mass spectrometry
Introduction
Field analytics can play a central role in environmentalassessment, control, and monitoring. The closer the instru-ment is to the sample, the better (more representative) thedata, and the faster information can be obtained about the
Correspondence to:A. Robbat, Jr.Contract grant sponsor: U.S. Environmental Protection Agency, NCE-
RQA programContract grant number: R826184010
site. Site-directed sample collection and analysis programstranslate into lower site characterization, cleanup, and mon-itoring costs.1–3 One of our goals was to develop a systemthat could collect subsurface soil contaminants quickly,without bringing the sample to the surface. A second goalwas to match (as closely as possible) the sample-collectionrate with the analysis rate, while minimizing human involve-ment as much as possible. Several different and ultimatelyintegrating technologies were developed and presented at the2000 Pacifichem Conference in the session entitled “RecentDevelopments in Field Analysis.”Results produced by a thermal extraction cone penetrom-
eter (TECP) sample collection and analysis system were de-scribed. The sampling probe is capable of extracting soil gasand soil-bound volatile and semivolatile organic compounds(VOC and SVOC) at depths of up to 25 m. An ultrafast gaschromatography/mass spectrometry (GC/MS) system wasdescribed. The GC module is temperature programmablefrom 0.03 to 100�C/s. Sample introduction is made by sy-ringe injection, TECP probe, or directly from soil or solid-phase adsorbent without changing the GC inlet with the useof a ballistically heated thermal desorption (TD) unit. Fi-nally, the resolving and quantitative application of newmassspectrometry data-analysis software was illustrated. The de-convolution algorithms imbedded in the software uniquelyidentify structurally different organics in the presence ofeach other as well as other matrix interferents. Results werepresented comparing data produced by the TECP, TD, andsoil-solvent extraction methods. Findings showed that thequality of data was as good as that required by EPA stan-dardized methods and that the rate samples can be collectedfrom the subsurface is dependent on geology and soil mois-ture, whereas the rate of analysis is depen-dent only onwhether structural isomers must be distinguished.

shortstandardlong
FIELD ANALYTICAL CHEMISTRY AND TECHNOLOGY—2001 61
FACT WILEY-Interscience RIGHT BATCH
Experiment
The thermal extraction cone penetrometer was initiallydeveloped as a stand-alone unit; see Figure 1(b). It consistsof a 20–40-ton truck, hydraulically lifted over 3-ft pipe sec-tions. The weight of the truck pushes the pipe into the earth’ssurface. The collection probe reaches sampling depth bymeans of threading together the appropriate number of pipes.The TECP heated transfer line is woven through the pipeprior to operation. It is connected on one end to a heatedsampling probe and on the other to the collection chamberof the controller unit; see Figure 2. Details of the TECPsystem have been published elsewhere.4,5 The probe tem-perature was maintained at 400�C, which produced soil tem-peratures of�300 �C. The system was operated at slightlyreduced pressures. Nitrogen was used as the carrier gas tohelp transport the collected vapors to the surface, where theywere freeze trapped at�10 �C in the collection chamber,and to backflush the system. All experiments were carriedout with the following system parameters: modified Rey-nolds number,Rem � 6000; ratio of carrier-gas collectionvolume to system dead volume,V0 � 32; and carrier gaslinear velocity� � 1.8 m/s.The thermal desorber (300�C � 10 s) and ultrafast GC
were made at Tufts.4 Organics were swept onto the capillarycolumn by helium at 2 ml/min. TheGC columnwasRestek’s15-m MXT-5 (0.28-mm i.d., with 0.5-�m film thickness of5% diphenyl, 95% dimethyl polysiloxane), which was resis-tively heated from 10 to 250�C in 20 s. Column cool-downtime was�5 s. The GCmodule was connected to an Agilentmodel 5972 mass spectrometer. The MS was scanned from50 to 450 amu at 3 scans/s. Agilent’s Chemstation softwarewas used to control the MS and to acquire data. The IonFingerprint DetectionTM (IFD) mass spectrometry data anal-ysis software was developed at Tufts and commercializedby Ion Signature Technology. IFD was used to identify andquantify target compounds. Details of how the deconvolu-tion and quantitation algorithms work were previously pub-lished in this journal and elsewhere.2,6
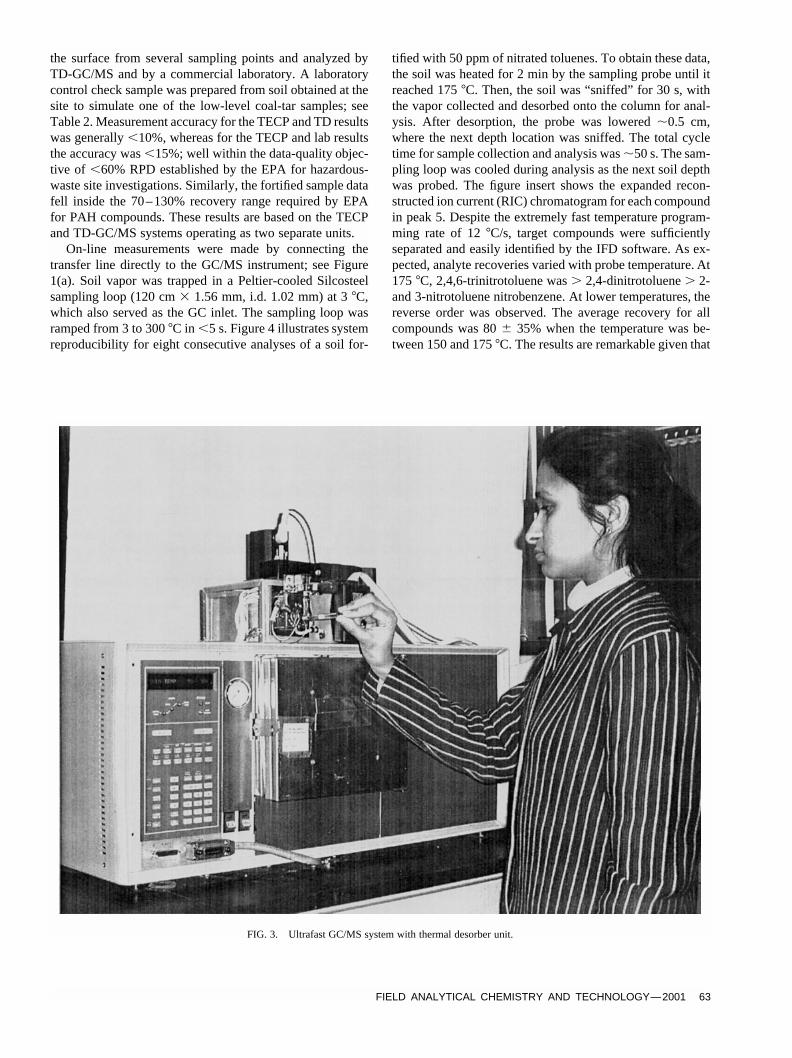
All samples were introduced through the same inlet;therefore, the same 5-point calibration curve was usedfor all analyses. TD analysis was made by packing knownquantities of soil into an empty glass tube. The sleevewas inserted into the desorber by lifting the pressure-fittedlever that held the syringe injector in place; see Figure 3.HPLC-grade solvents were used as received by the manu-facturer.
FIG. 1. Thermal extraction cone penetrometer (TECP) connected to the GC/MS (a) and as a separate unit (b).

FACT WILEY-Interscience LEFT BATCH
shortstandardlong
62 FIELD ANALYTICAL CHEMISTRY AND TECHNOLOGY—2001
Results and Discussion
The dependence between the TECP sample collection ef-ficiency and soil temperature as a function of soil type, watercontent, and collection time was studied.4,7 Experimentsshowed that the “effective” soil extraction temperature var-ied somewhat with soil type but more so with moisture con-tent, distance from the probe, and operating procedures. Forsoils containing up to 20% water, only 5 min were neededto collect organics within the EPA-acceptable soil-solventrecovery range (see Table 1), whereas 15 min were neededfor soils�20% and�35%. Soils this wet reach a maximumtemperature of 100�C 1–2 mm from the probe, which isinsufficient to volatilize and extract soil-bound SVOCs. Fur-ther research showed that the water vapor produced duringheating must be pushed away from the collection windowto improve SVOC recoveries. This led to a change in theprocedure for collecting VOCs. For example, if the sample-collection system was turned on during the first 5 min ofheating, VOC recoveries increased by�80% over the con-centrations shown in the table. Then, SVOCs were collectedafter back-flushing the “local” environment for 5 min. Soil
temperatures 1–2 mm from the collection window increasedto �300 �C over the next few minutes. These findings sug-gest that the 5- and 15-min data are independent of watercontent, except for those compounds susceptible to ther-mal degradation in the presence of metallic material orsteam (e.g., DDT), as long as the specified procedure wasused.TECP linear dynamic range experiments were carried
out between the concentration range of 0.5 to 50 ppm forPCBs, PAHs, chlorinated pesticides, and nitrated toluenes.Aroclor 1248 was used to study PCB response, with con-gener detection and quantification made by chlorinationlevel. No attempt was made to separate PAH isomersphenanthrene and anthracene, chrysene and benzo(a)anthra-cene, and the benzo(b and k)fluoranthenes, because the goalwas to match the analysis time with the dry soil collectiontime. Regression analysis revealedr2 � 0.99 for all com-pounds.The TECP and ultrafast TD-GC/MS were brought to a
manufactured gas plant and evaluated for field ruggednessand data quality. Pushes were made, with samples collectedand analyzed at several locations. Soil was also brought to
FIG. 2. TECP controller unit and transfer line.
shortstandardlong
FIELD ANALYTICAL CHEMISTRY AND TECHNOLOGY—2001 63
FACT WILEY-Interscience RIGHT BATCH
the surface from several sampling points and analyzed byTD-GC/MS and by a commercial laboratory. A laboratorycontrol check sample was prepared from soil obtained at thesite to simulate one of the low-level coal-tar samples; seeTable 2. Measurement accuracy for the TECP and TD resultswas generally�10%, whereas for the TECP and lab resultsthe accuracy was�15%; well within the data-quality objec-tive of �60% RPD established by the EPA for hazardous-waste site investigations. Similarly, the fortified sample datafell inside the 70–130% recovery range required by EPAfor PAH compounds. These results are based on the TECPand TD-GC/MS systems operating as two separate units.On-line measurements were made by connecting the
transfer line directly to the GC/MS instrument; see Figure1(a). Soil vapor was trapped in a Peltier-cooled Silcosteelsampling loop (120 cm� 1.56 mm, i.d. 1.02 mm) at 3�C,which also served as the GC inlet. The sampling loop wasramped from 3 to 300�C in�5 s. Figure 4 illustrates systemreproducibility for eight consecutive analyses of a soil for-
tified with 50 ppm of nitrated toluenes. To obtain these data,the soil was heated for 2 min by the sampling probe until itreached 175�C. Then, the soil was “sniffed” for 30 s, withthe vapor collected and desorbed onto the column for anal-ysis. After desorption, the probe was lowered�0.5 cm,where the next depth location was sniffed. The total cycletime for sample collection and analysis was�50 s. The sam-pling loop was cooled during analysis as the next soil depthwas probed. The figure insert shows the expanded recon-structed ion current (RIC) chromatogram for each compoundin peak 5. Despite the extremely fast temperature program-ming rate of 12�C/s, target compounds were sufficientlyseparated and easily identified by the IFD software. As ex-pected, analyte recoveries varied with probe temperature. At175 �C, 2,4,6-trinitrotoluene was� 2,4-dinitrotoluene� 2-and 3-nitrotoluene nitrobenzene. At lower temperatures, thereverse order was observed. The average recovery for allcompounds was 80� 35% when the temperature was be-tween 150 and 175�C. The results are remarkable given that
FIG. 3. Ultrafast GC/MS system with thermal desorber unit.

FACT WILEY-Interscience LEFT BATCH
shortstandardlong
64 FIELD ANALYTICAL CHEMISTRY AND TECHNOLOGY—2001
TABLE 1. TECP recovery as a function of soil heating time and water content
Compound (50 ppm each)
5 min�15% water%R1 (%RSD)
5 min25% water%R2 (%RSD)
15 min25% water%R3 (%RSD) R3/R1
PCBs,Aroclor 1248 95 35 93 98
PAHsNaphthalene 85 (15) 15 (19) 38 (25) 45Acenaphthylene 88 (10) 24 (15) 46 (20) 52Acenaphthene 88 (10) 20 (20) 51 (28) 58Fluorene 87 (8) 28 (14) 70 (18) 80Phenanthrene andAnthracene
86 (12) 22 (15) 76 (15) 88
Fluoranthene 81 (11) 22 (18) 85 (12) 105Pyrene 86 (11) 28 (10) 84 (13) 98Chrysene andBenzo(a)anthracene
82 (19) 21 (13) 76 (16) 93
Benzo(b andk)fluoranthene
92 (14) 18 (12) 87 (15) 95
Benzo(a)pyrene 81 (10) 18 (18) 83 (11) 103Indeno(1,2,3-cd)-anthracene
80 (12) 10 (21) 88 (14) 110
Dibenz(a,h)anthracene 83 (10) 12 (23) 75 (18) 90Benzo(g,h,i)perylene 80 (9) 10 (15) 82 (10) 102
Cl- pesticidesAldrin 70 (15) 30 (20) 66 (22) 95�-BHC 87 (10) 25 (18) 84 (18) 97�, �-BHC 80 (15) 27 (20) 78 (15) 98�-BHC 82 (12) 25 (20) 85 (20) 103Chlordane 65 (10) 17 (28) 58 (17) 894,4� DDD 82 (17) 32 (18) 51 (25) 624,4� DDE 75 (16) 26 (15) 71 (18) 954,4� DDT 80 (20) 25 (20) 60 (25) 75Dieldrin 70 (12) 35 (35) 42 (25) 52Endosulfan I 72 (18) 25 (15) 68 (15) 95Endosulfan II 88 (15) 25 (15) 92 (17) 105Endosulfan sulfate 85 (18) 30 (27) 91 (17) 107Endrin 83 (13) 27 (30) 33 (30) 40Endrin aldehyde 87 (10) 35 (28) 44 (30) 50Endrin ketone 90 (13) 29 (30) 38 (31) 42Heptachlor 90 (15) 22 (25) 81 (14) 92Heptachlor epoxide 88 (12) 29 (21) 89 (16) 101Methoxychlor 80 (12) 35 (27) 67 (20) 87
ExplosivesNitrobenzene 75 (18) 10 (35) 37 (33) 492-Nitrotoluene 85 (20) 9 (40) 34 (33) 403-Nitrotoluene 88 (18) 12 (33) 32 (30) 362,4-Dinitrotoluene 95 (12) 30 (25) 84 (22) 882,4,6-Trinitrotoluene 90 (10) 27 (22) 81 (15) 90

shortstandardlong
FIELD ANALYTICAL CHEMISTRY AND TECHNOLOGY—2001 65
FACT WILEY-Interscience RIGHT BATCH
FIG. 4. TECP–TD GC/MS on-line chemical analysis of nitrated toluenes from soil; eight repetitive analyses. Insert shows the RIC chromatograms fortarget compounds in peak 5.

FACT WILEY-Interscience LEFT BATCH
shortstandardlong
66 FIELD ANALYTICAL CHEMISTRY AND TECHNOLOGY—2001
FIG. 5. Membrane inlet MS response of 51 VOCs. All compounds detected and analyzed in�10 s. Selected compounds shown in the figure.
TABLE 2. Comparison of TD, TECP, and solvent-extracted results for fortified and coal tar samples
PAHs
Percent recovery
Fortified samplea
TD TECP RPD
Coal tar sampleb
TD TECP RPD
Coal tarsample method
8270Com lab andTECP RPD
Naphthalene 18 12 10 16 11 9 18 12Acenaphthylene 69 60 3 57 50 3 60 5Acenaphthene 79 70 3 66 55 5 75 8Fluorene 77 69 3 62 50 5 70 8Phenanthrene and Anthracene 85 70 5 65 41 11 60 9Fluoranthene 0.46 0.46 0 0.48 0.57 �4 0.60 1Pyrene 82 72 3 72 58 5 80 8Chrysene andBenzo(a)anthracene
68 52 7 60 50 5 75 10
Benzo(b and k)fluoranthene 52 45 4 40 42 �1 50 4Benzo(a)pyrene 64 57 3 49 42 4 55 7Benz(a,h)anthracene 39 29 7 27 17 11 30 14Indeno(1,2,3-cd)pyrene 39 25 11 26 18 9 30 13Benzo(g,h,i)perylene 26 21 5 19 23 �5 22 �1
a Fortified soil sample made to the same approximate concentration as the coal tar sample.b Coal tar soil sample collected from manufactured gas plant.

shortstandardlong
FIELD ANALYTICAL CHEMISTRY AND TECHNOLOGY—2001 67
FACT WILEY-Interscience RIGHT BATCH
they include the thermal extraction collection efficiencyfrom soil as well as the loss of volatiles between the timethe soil was spiked and actually analyzed. The data are con-sistent with the findings shown in Table 1, with precisionand accuracy within the EPA prescribed levels.The resolving power of the software was illustrated in an
experiment where 51 VOCs were identified in the presenceof each other in seconds. The data were produced with theuse of a membrane-inlet mass spectrometer from Bruker In-struments. A standard solution was prepared containing 52VOCs, passed by the inlet and “sniffed” for�10 s. The vialwas removed and then sniffed again for 10 s. Figure 5 showsthe total and reconstructed (quant) ion current chromato-grams and a partial list of those compounds found in thevial. Figure 6 illustrates the overlapping RIC scan signal forthe three ions used to identify 1,1,1- (117, 99, 97) and 1,1,2-trichloroethane (83, 97, 99). The algorithms extract the tar-get ions and computed relative ratios, and compare the signalagainst library values. The output is shown in the figure.Identification is made when at least six consecutive scansthrough the chromatogram possess the correct relative abun-dances. In contrast, no ions were found for hexachlorobu-
tadiene, which produced a nondetect response by the soft-ware. Because no target ions were extracted from the totalsignal, it is presumed that this compound did not make itinto the instrument. Research is in progress to determine thequantitative quality of the data.In summary, the research presented illustrates two differ-
ent applications of MS as an electronic nose. The TECPmethod makes remote, real-time chemical measurements ofsemivolatiles possible. The combination of a 25-m heatedtransfer line with ultrafast GC/MSmakes speciation possiblefor an unprecedented range of target compounds. IFD, witheither ultrafast GC/MS or direct MS, should provide oppor-tunities when making real-time, on-line chemical measure-ments in environmental, forensic, national security, process,and quality control applications as well as the monitoring offreshness in food and beverages.
Acknowledgments
The authors appreciate the donation of the Agilent massspectrometer, and the data from Bruker Daltronics used todemonstrate the membrane inlet VOC results.
FIG. 6. The 1,1,1- and 1,1,2-trichloroethane isomers were identified from the RIC chromatograms by extracting and comparing the relative abundancesof one different and two common fragment ions.

FACT WILEY-Interscience LEFT BATCH
shortstandardlong
68 FIELD ANALYTICAL CHEMISTRY AND TECHNOLOGY—2001
References
1. Robbat A, Jr., Smarason S, Gankin Y. Dynamic work plans and fieldanalytics, the keys to cost-effective hazardous waste site investigations.Field Anal Chem Technol 1998;2(5):253–265.
2. Robbat A, Jr., Smarason S, Gankin Y. Fast gas chromatography/massspectrometry analysis in support of risk-based decisions. Field AnalChem Technol 1999;3(1):55–66.
3. Johnson R, Quinn J, Durham L, Williams G, Robbat A, Jr. Adaptivesampling and analysis programs for contaminated soils. Remediation1997;2:81–96.
4. Gorshteyn A, Smarason S, Robbat A, Jr. Speciation of subsurface con-
taminants by cone penetrometry gas chromatography/mass spectrome-try. Environ Sci Technol 1999;33:2474–2480.
5. Gorshteyn A, Kataenko Z, Smarason S, Robbat A, Jr. Subsurface de-tection of environmental pollutants. Instrum Sci Technol 1999;27(1):111–121.
6. Gankin Y, Gorshteyn A, Smarason S, Robbat A, Jr. Time-condensedanalyses by mass spectrometry. Anal Chem 1998;70:1655–1663.
7. Gorshteyn A, Robbat A, Jr. Rapid in situ collection and analysis ofsemivolatile organics by thermal extraction cone penetrometry gas chro-matography/mass spectrometry. Field Anal Chem Technol 2000;4(2–3):85–92.