
Environmental and Economic Analysis of Emerging … the study estimated that gasification (excluding...
70
January 10, 2012 RTI Project No. 0212876.000 Environmental and Economic Analysis of Emerging Plastics Conversion Technologies Final Project Report Prepared for American Chemistry Council 700 2 nd Street, NE Washington, DC 20002 Prepared by RTI International 3040 Cornwallis Road Research Triangle Park, NC 27709‐2194
Transcript of Environmental and Economic Analysis of Emerging … the study estimated that gasification (excluding...

January 10, 2012 RTI Project No. 0212876.000
Environmental and Economic Analysis of Emerging Plastics Conversion
Technologies
Final Project Report
Prepared for
American Chemistry Council 700 2nd Street, NE
Washington, DC 20002
Prepared by
RTI International 3040 Cornwallis Road
Research Triangle Park, NC 27709‐2194

i
Contents
Executive Summary ............................................................................................................ ES‐1
Section 1: Introduction ........................................................................................................... 1
1.1 Conversion Technology Development Stages .................................................................... 1
1.2 Barriers to Emerging Technologies for Municipal Solid Waste .......................................... 6
1.3 Report Structure ................................................................................................................. 6
Section 2: Conversion Technology Categories ......................................................................... 7
2.1 Pyrolysis .............................................................................................................................. 7 2.1.1 Types of Pyrolysis .............................................................................................. 7
2.1.2 Issues Associated with Pyrolysis ....................................................................... 8
2.2 Gasification ......................................................................................................................... 8 2.2.1 Types of Gasification ......................................................................................... 8
2.2.2 Issues Associated with Gasification .................................................................. 9
2.3 Plasma Arc ........................................................................................................................... 9 2.3.1 Types of Plasma Arc ........................................................................................ 10
2.3.2 Issues Associated with Plasma Arc ................................................................ 10
2.4 Anaerobic Digestion .......................................................................................................... 10
Section 3: Technology Vendor Case Examples ....................................................................... 12
3.1 Pyrolysis Technology Vendors .......................................................................................... 12 3.1.1 Agilyx, Tigard, Oregon ..................................................................................... 12
3.1.2 Envion: Derwood, MD (to be relocated to Florida in 2011/2012) .................. 14
3.1.3 Climax Global Energy: Georgia ........................................................................ 17
3.1.4 JBI: Niagara Falls, New York ............................................................................ 19
3.2 Gasification Technology Vendors ..................................................................................... 21 3.2.1 Enerkem: Westbrook, PQ, Canada ................................................................. 21
3.2.2 Plasco: Ottawa, Ontario, Canada .................................................................... 25
3.2.4 Ze‐gen: Attleboro, MA .................................................................................... 28
3.3 Plasma Arc Gasification ..................................................................................................... 30 3.3.1 Geoplasma‐ St Lucie, Florida ........................................................................... 30

ii
Section 4: Environmental and Cost Assessment for Technology Categories .......................... 33
4.1 General Approach for the Environmental and Cost Assessment ..................................... 34 4.1.1 Goals ............................................................................................................... 34
4.1.2 Scope and Boundaries .................................................................................... 34
4.2 Life Cycle Inventory Methodology, Assumptions and Modules for Waste Conversion Technologies ..................................................................................................................... 36 4.2.1 Treatment of Material and Energy Recovery ................................................. 37
4.2.2 Items Excluded from the Life Cycle Inventory ................................................ 37
4.2.3 LCI Parameters Tracked and Reported ........................................................... 38
4.3 Key Data and Assumptions Used in the LCIs ..................................................................... 40
4.4 Environmental and Cost Assessment Results ................................................................... 43 4.4.1 Gasification Results ......................................................................................... 43
4.4.2 Pyrolysis Results .............................................................................................. 49
Section 5: Findings ................................................................................................................ 55
5.1 Key Findings ...................................................................................................................... 56
Section 6: Recommendations ............................................................................................... 58
6.1 Recommendations ............................................................................................................ 58
References............................................................................................................................. 60
Appendix A: Conversion Technology Data ............................................................................ 61
Table A‐1. Gasification Technology Data ..................................................................................... 62
Table A‐2. Pyrolysis Technology Data .......................................................................................... 64

ES‐1
Executive Summary
Purpose
This study, commissioned by the American Chemistry Council’s Plastics Division and conducted by RTI International, investigated the range of emerging waste conversion technologies that use plastics as all or a portion of their feedstocks. The focus of the study was to report on the environmental aspects of the technologies, using a life cycle approach, and to report what is known about the economics of these technologies.
Scope
There are currently 86 waste‐to‐energy facilities in the United States that accept municipal solid waste (MSW) and processing it with conventional mass‐burn technologies. These facilities are large in scale, require significant capital investments, and are often co‐located with an MSW source. These facilities convert MSW directly into steam or energy. This study does not address these conventional waste‐to‐energy technologies.
There are a wide range of other technologies under development or in various stages of commercialization that are capable of converting plastics and/or MSW directly into fuels or raw materials. These waste conversion technologies are the subject of this study.
Waste conversion technologies of particular interest fall into two general groups: pyrolysis and gasification. Both processes heat the waste stream at high temperatures to reduce the waste to simple hydrocarbons.
Methodology
RTI conducted a search of the published literature on waste conversion technologies coupled with a survey of companies known and identified to be developing, or having deployed, waste conversion technologies.
Key Findings
The study yields the following key findings:
1. A range of conversion technologies are already technologically feasible, and more may be possible. The study identified 41 conversion technologies facilities in development, in demonstration phase, or in full‐scale commercialization. The primary feature differentiating technologies is the feedstock. Pyrolysis technologies are generally suited to handling feedstock from waste plastics; gasification technologies are generally suited to accepting MSW; anaerobic digestion and concentrated acid hydrolysis are more suited for organic wastes.
ES‐2
2. Conversion technologies are expected to begin breaking through to commercial viability with a short horizon – in 5 to 10 years. Plastics‐to‐oil pyrolysis technologies are generally closer to full scale commercialization than MSW‐based technologies (typically gasification), in part because of the more consistent feedstock composition and supply for the former.
3. Life‐cycle environmental review shows that waste conversion technologies have significant environmental benefits in energy saved and greenhouse gases averted compared to landfill disposal. Specifically, the study estimated that gasification (excluding energy production and materials recycling offsets) of MSW saves 6.5–13 million Btu (MMBtu) per ton as compared to landfill disposal. Pyrolysis of waste plastics saves 1.8–3.6 MMBtu per ton as compared to landfill disposal. Likewise, study results show that gasification of MSW saves 0.3–0.6 tons of carbon equivalent (TCE) emissions per ton of MSW treated as compared to landfill disposal. Pyrolysis of waste plastics saves 0.15–0.25 TCE emissions per ton as compared to landfill disposal.
4. The primary drivers for waste conversion technologies include economic and non‐economic aspects. Key drivers include the alternate costs for disposition of the waste (generally landfill costs), meeting waste diversion goals and targets, and developing alternative energy sources.
5. The study finds that waste conversion technologies are already able to produce fuel outputs at lower costs than landfill disposition in some regions. Survey data indicates that the cost to process the waste is approximately $50 per ton (for pyrolysis and gasification technologies), and is generally related to the cost of electricity or fuel required to run the process. U.S. averages for landfill disposal and recycling, for comparison, range from $30‐75/ton depending on region.

1
Section 1: Introduction
RTI International (RTI) conducted a global literature search and review of all published or otherwise available life‐cycle inventory (LCI) studies of various end‐of‐life, integrated, resource‐management options, with a focus on energy recovery and plastics material. The research and studies obtained indicated that mechanical recycling is a favorable waste management option for plastics. However, a large fraction of plastics waste cannot be readily mechanically recycled because of limiting factors such as cost and contamination. Using a life‐cycle approach shows that waste‐to‐energy (WTE) is preferable to landfill for this unrecovered fraction (RTI, 2010).
Significant new growth prospects for traditional “mass burn” WTE facilities are limited in the United States. However, new technologies to convert municipal and other waste streams into fuels and electricity, termed conversion technologies, are rapidly developing. Conversion technologies are in increasing demand due to energy concerns and decreasing landfill space in certain parts of the U.S. These technologies have the potential to serve multiple functions, such as diverting waste from landfills, reducing dependence on foreign oil, and lowering environmental footprint. Furthermore, they are particularly difficult to define as their market is not well established and many of their design and operational features are not openly communicated by their vendors.
ACC commissioned RTI to conduct research to examine emerging plastic waste conversion technologies (e.g., pyrolysis, gasification) and to examine and quantify their cost and life‐cycle environmental footprints. This study was designed to include real‐world case examples and data and information from open literature, complemented by a survey of technology vendors, to develop a better understanding of the range of emerging conversion technologies available that use plastics as all or a portion of their feedstock, to identify and profile specific technology vendors, and to identify and quantify the potential cost and life‐cycle environmental burdens/benefits of the technologies as compared to existing landfill disposal. Technology categories are described in detail, and potential benefits and impediments are reviewed. Additionally, a LCI analysis was performed for the general technology categories using on‐the‐ground data from technology vendors in combination with data obtained from the literature.
1.1 Conversion Technology Development Stages
There are a number of ongoing efforts in North America to develop and commercialize waste conversion technologies. The current situation is very dynamic with new technology proposals, new vendors, mergers and acquisitions, and redesigns or closings occurring almost weekly.
It is useful to consider the technology development stages as illustrated in Figure 1‐1 when discussing waste conversion technologies. There are technologies at every stage of the development cycle. At the time of this report, there were only a few commercial‐scale

2
Figure 1‐1. Stages of Waste Conversion Technology Development. Note: Most of the facilities
investigated within this report are in the stages within the shaded area.
operating facilities. Most facilities are at pilot or demonstration scale. It was found that even facilities that are commercial scale are often operating in more of a demonstration mode and do not have waste contracts and/or energy or product contracts in place.
For this study, focus was placed on technology vendors and facilities that were at the pilot through commercial plant stages. Figure 1‐2 illustrates the locations of existing North American waste conversion facilities by main technology category of anaerobic digestion, concentrated acid hydrolysis, gasification, and pyrolysis. Gasification and pyrolysis are the primary technology categories that can accept waste plastics. Figure 1‐3 and Figure 1‐4 illustrate the locations and stage of technology development of facility for gasification and pyrolysis technologies, respectively.
Because there were so few true commercial facilities in operation, it was difficult to present reliable estimates for cost and life cycle environmental aspects. Most of the facilities covered in this report were still in pilot and demonstration stages. As a facility transitions to a fully operational commercial facility, one would expect the process inputs/outputs to stabilize and cost and environmental aspects more consistent and reliable.

3
Figure 1‐2. Waste Conversion Facility Types and Locations in North America.

4
Figure 1‐3. Gasification Facility Locations and Status in North America.

5
Figure 1‐4. Pyrolysis Facility Locations and Status in North America.

6
1.2 Barriers to Emerging Technologies for Municipal Solid Waste
Three main areas of issues must be successfully addressed for any of these technologies to be implemented successfully: legislative/regulatory, contract and market development, and social stigma.
One of the most significant barriers that exist for these conversion facilities is the regulatory aspect. Solid waste handling, water, and air permits must first be obtained through the local health department. Water quality permits are necessary to regulate discharges to surface and ground water. The local or county planning agency likely has requirements for the planned facility that encompass building, grading, water system, shoreline, utility, site plan review, septic system, floodplain development, variance (zoning, shoreline, etc.), toxic air emissions, Title V emissions, and outdoor burning. The permitting process is overall a complex one, and the facility owners could easily have difficulties that lead to substantial delays in construction. It is not uncommon for companies to apply for and be rejected from these permits several times. Without acquiring permits, these facilities may not begin construction operations.
After firms receive permits to operate, they must be able to secure contracts to ensure a feedstock. The quantity of feedstock needs to be more or less constant through the project’s life because the systems are optimized for a specific flow rate. It is also necessary for quality and volume of feedstock to be taken into account. Before a facility may be built, a comprehensive evaluation of the positive and negative impacts that the proposed facility might have on the natural environment, as well as social and economic consequences, must be performed. If the evaluation requires an Environmental Impact Statement, public commenting periods and other regulatory waiting periods will also be necessary
If markets are not developed for recycled products from the pre‐sorting process, revenue that otherwise would have been generated is lost. Furthermore, if no market share exists and clients are not found for the oil or gas products, the facilities will be forced to close due to a lack of revenue.
The public’s negative association with thermal treatment waste facilities is another barrier that needs to be overcome. In addition, smell, noise, and visual aesthetics complaints are fairly common from affected community members after waste management facilities have been installed.
1.3 Report Structure
Section 2 of this report contains general descriptions and definitions for conversion technology categories and subcategories. Section 3 provides profiles of real‐world companies that are developing and commercializing technologies and specifics about their respective processes. Section 4 includes the approach, key assumptions, and results for life cycle inventory (LCI) analyses constructed for the main categories of conversion technologies studied (gasification and pyrolysis) based on company‐specific data and information and also data and information collected from the literature. Section 5 presents the overall findings and recommendations.

7
Section 2: Conversion Technology Categories
In this section, the following categories of thermal and biochemical conversion technologies are described: pyrolysis, gasification, plasma arc, and anaerobic digestion. Thermal conversion processes are characterized by higher temperatures and conversion rates than biochemical processes. These technologies contain a continuum of processes ranging from thermal decomposition in a primarily non‐reactive environment (commonly referred to as pyrolysis/cracking processes) to decomposition in a chemically reactive environment, (or gasification processes).
2.1 Pyrolysis
Pyrolysis is defined as an endothermic process, also referred to as cracking, involving the use of heat to thermally decompose carbon‐based material in the absence of air or oxygen (i.e., no burning). Its main product is a gaseous mixture of CO and H2 called “syngas” that can be used for steam and electricity generation. Other byproducts of this process are commonly reported, but the list and proportion of each differs depending on reactor design, reaction conditions, and feedstock.
2.1.1 Types of Pyrolysis Various technology vendors include different variations and names for pyrolysis processes in their technology descriptions, which can be confusing to waste managers. Technologies which are categorized as pyrolysis generally belong to one of the following process categories:
• Thermal pyrolysis/cracking—The feedstock is heated at high temperatures (350–900 °C) in the absence of a catalyst. Typically, thermal cracking yields low‐octane liquid products and a gas product that require refining to be upgraded to useable fuel products.
• Catalytic pyrolysis/cracking—The feedstock is processed using a catalyst. The presence of a catalyst reduces the required reaction temperature and time (compared to thermal pyrolysis). The catalysts used in this process can include acidic materials (e.g., silica‐alumina), zeolites (e.g., HY, HZSM‐5, mordenite), or alkaline compounds (e.g., zinc oxide). Research has shown that this method can be used to process a variety of plastic feedstocks, including low‐density polyethylene (LDPE), high‐density polyethylene (HDPE), polypropylene (PP), and polystyrene (PS).
• Hydrocracking (sometimes referred to as “hydrogenation”)—The feedstock is reacted with hydrogen and a catalyst. The process occurs under moderate temperatures and pressures (e.g., 150–400 °C and 30–100 bar hydrogen). Most research on this method has involved generating gasoline fuels from various waste feedstock, including MSW plastics, plastics mixed with coal, plastics mixed with refinery oils, and scrap tires.

8
2.1.2 Issues Associated with Pyrolysis
The process of pyrolysis creates residues including char, silica (sand), and other bottom ash. Some of these residues can be reused while others must be disposed of in a landfill. One major problem is the amount of residual waste produced that may call for landfill disposal is about 15‐20 percent of the overall feedstock used in the process.
Another issue that must be addressed is the possible difficulty in choosing a location due to competing land uses. It is possible that the MSW handling facility will lack compatibility with the surrounding area. Problems of litter, odor, traffic, noise, and dust must also be assessed. Although these problems do exist, this form of technology does have the ability to be in compliance with an array of emission standards, making it a more viable option for the management of solid waste.
2.2 Gasification
In gasification, feedstock is converted to a synthesis gas (syngas), primarily carbon monoxide (CO) and hydrogen (H2), in an oxygen‐deficient atmosphere. Gasification is an endothermic process and requires a heat source, such as syngas combustion, char combustion, or steam. The primary product of gasification, syngas, can be converted into heat, power, or chemical products, or used in fuel cells. The current main types of gasification processes for MSW include three major types:
2.2.1. Types of Gasification
• Hightemperature gasification—gasification is the partial oxygenation of carbon‐based feedstock to generate syngas. The process is similar to pyrolysis, except that air or steam is added to promote gasification, forming carbon monoxide, hydrogen, and methane. The high temperature gasification reactor as described in ARI (2007) can reach up to 1,200 °C and produces an inert slag byproduct that does not need vitrification processing. The syngas and steam (also produced from this process) are used for power generation. Typically, this technology processes a mix of carbonaceous waste including paper, plastics, and other organics with a moisture content of up to 30 percent, which avoids the need for drying. In general, there are no water emissions because conventional water treatment systems are used to convert process discharges to useable process and/or cooling water. Treatment systems include settling and precipitation to capture and remove solids, which are returned to the high‐temperature reactor.
• Lowtemperature gasification—the low temperature gasification reactor as described in ARI (2007) and RTI (2004) operates at temperatures between 600 and 875 °C and produces ash that could be sent to a vitrification process to make it inert and available for other uses. Syngas is the main product from this process and is used for electricity generation. This process can also recover steam energy. Separate estimates of energy from syngas and steam are obtained. This technology is assumed to require a feedstock with a moisture content of 5 percent or less and includes a drying pre‐processing. A mix of gases and aerosols are produced from

9
gasification and are sent to a quench. The resulting liquid is cooled with chilled water, and water is recovered and sent to a solids mixing tank. Char, brine, and bio‐oils may also be recovered. Bio‐oils are recycled back to the process, and char and brine are included as water and solid waste emissions.
• Plasma Gasification—plasma gasification converts selected waste streams including paper, plastics, and other organics, hazardous waste, and chemicals to syngas, steam, and slag. In this technology, the gasification reactor uses a plasma torch where a high‐voltage current is passed between two electrodes to create a high‐intensity arc, which in turn rips electrons from the air and converts the gas into plasma or a field of intense and radiant energy with temperatures of thousands of °Celsius. The heated and ionized plasma gas is then used to treat the feedstock. Pet coke is assumed to be added to the reactor to provide a more reducing atmosphere and to stabilize the slag. No drying pre‐processing of the feedstock is required and the feedstock is assumed to have up to 30% moisture content. Syngas and steam are then used for power generation, included in the estimate of total electricity offsets, and assumed to replace solar energy. The slag, also produced in this process, is quenched prior to use.
2.2.2 Issues Associated with Gasification
As with pyrolysis, residues such as slag and ash will be produced in the gasification process that will need to be disposed of at a landfill. The leachability characteristics of ash will need to be assessed, and specific linings will need to be used in the landfill that this waste is disposed in. Slag is non‐leachable and does not pose the same problem. If a market is developed for slag, it may be sold. If not, slag may easily be landfilled. As with all electricity generation associated with MSW, surrounding land users may not want a processing facility to be in their vicinity. Also, issues of odor, litter, noise, and dust will need to be addressed.
Another potential issue that may need to be assessed is the level of pre‐sorting necessary. Some pre‐processing will be needed for many of these facilities. For some gasification technologies, however, a significant presorting process will be required, including the removal of recyclables, sorting, shredding, and drying. The presorting process is necessary to make the feedstock more homogenous and to increase efficiency of the overall process. As much as two‐thirds of the raw feedstock might need to be removed before the gasification procedure can take place; however, like the pyrolysis process, it is possible for gasification technologies to comply with a variety of emissions standards. Factors such as this one may make it a more attractive option for landfill management and electricity generation.
2.3 Plasma Arc A plasma arc device is a heating method that uses high temperatures to reduce MSW into elemental byproducts. The plasma itself is a collection of free‐moving ions and electrons formed with the use of a large voltage across a gas volume at atmospheric pressure. Electrons in the gas molecules are then stripped away and move toward the positive side of voltage. The

10
gas molecules are converted into positively charged ions able to transfer an electric current and produce heat. The same process is intrinsic to the formation of lightning in the atmosphere.
2.3.1 Types of Plasma Arc
Two types of plasma arc devices or plasma “torches” exist: the transferred torch and non‐transferred torch. The former produces an electric field between an electrode, located at the tip of the torch, and the reactor wall. When the strength of the field is high enough, an electric arc is created. The electric arc is comparable to a spark plug in an automobile. The non‐transferred torch creates the electric arc within the torch and sends a process gas through the arc where it is heated and exits through the torch as a hot gas. Temperatures of 7,000 °F and higher are generated in the ionized plasma. In the reactor chamber, non‐ionized gas temperatures can reach 1,700‐2,200 °F. Slag temperatures are approximately 3,000 °F. The high temperatures are able to break apart the molecules to produce simpler molecules including carbon monoxide, hydrogen, and carbon dioxide. An inert glassy slag material is obtained and can then be used for construction purposes as an aggregate. The whole process is assumed to have no emissions and any used water or air is cleaned and reused in the plasma arc process.
2.3.2 Issues Associated with Plasma Arc
Disadvantages exist for plasma arcs, especially in relation to feedstock size, electricity requirements and cost issues. Before MSW can be used in this process, the feedstock must be shredded to a size of six inches or less. A large portion of electricity generated is necessary for the operation of the plasma torches. This leads to a net reduction in electricity generation from the facility. It can vary significantly and depends largely on the throughput. The parasitic load, or energy consumed even when the system is not in use, is also significant. Major cost issues exist for this type of technology and include capital, operation, and maintenance costs. The facility’s cost of capital includes that of the reactor, residue handling system, and cleaning and monitoring devices. The costs of labor, overhead, taxes, administration, insurance, indirect costs, electricity costs are the major operation and maintenance costs. Revenue may be generated from the slag byproduct if a market is developed for it, which can help to offset the major costs associated with the plasma arc technology. Currently, no plasma arc facilities are operating at the commercial level in the U.S.
2.4 Anaerobic Digestion
Anaerobic digestion (AD) is a bacterial fermentation process that occurs without the presence of oxygen. A biogas of methane (CH4) and carbon dioxide (CO2) is formed. AD occurs naturally in niches such as wetlands and is also the primary decomposition process that takes place in landfills. The process also occurs in the stomachs of ruminant animals. It has been used in many wastewater treatment facilities for sludge breakdown and stabilization. Worldwide, AD is used to lessen landfill waste and recover energy.
The main feedstock used with this AD technology is the organic fraction of municipal solid waste. The organic fraction is the portion of waste that comes from biogenic sources, such as paper and paperboard, wood, leather, yard trimmings, food, textiles and yard trimmings. Some

11
AD facilities do accept plastics, but it is generally not desirable. Therefore, AD was not included for further analysis in this study.

12
Section 3: Technology Vendor Case Examples
In this section, case examples of specific conversion technology vendors that manage plastics waste (or MSW) are highlighted including:
• Pyrolysis Technology Vendors: o Agilyx (OR) o Envion (MD) o Global Climax Energy (GA) o JBI (NY)
• Gasification Technology Vendors: o Enerkem (Canada) o Plasco (Canada) o Ze‐gen (MA) o Geoplasma (FL)
These vendors were selected based upon their relatively more advanced stage of technology development and their willingness to participate in the project.
As part of the data collection process, RTI designed a data collection questionnaire to collect LCI data and sent to each of the case study vendors. Six of the facilities‐ Agilyx, Envion, Climax, JBI, Enerkem, Ze‐gen‐ participated by emailing or phoning in responses. Simultaneously, data and information from additional publicly available data sources for each vendor were identified and compiled. Each section and data table in Section 3 indicates whether the data was obtained via communication with the facility or through literature, such as engineering reports, outreach materials, websites and/or environmental assessment reports. For case study facilities which did not participate in the survey process, the data obtained for the study has been collected from literature resources only.
3.1 Pyrolysis Technology Vendors
3.1.1 Agilyx, Tigard, Oregon
Agilyx, formerly known as Plas2Fuel, was founded in 2004 and has an operating demonstration facility in Oregon. Agilyx uses waste plastics of any type (1–7) as feedstock and converts it into synthetic crude oil. The plastic waste can be commingled and no pre‐sorting or pre‐cleaning is needed. The company estimates that approximately 10 tons of plastic may be converted to 60 barrels (or 2,520 gallons) of oil on a daily basis through a pyrolysis process. All of the information and data about Agilyx was obtained via phone survey.
Process Details One main purpose of the Agilyx system is to handle any type of plastic feedstock and contamination level, thus reducing time and cost of the process. Agilyx uses custom‐designed cartridges to convey feedstock to their processing equipment. Each system is modular and may

13
be located at the collection facility to reduce costs associated with feedstock transportation. These systems may be scaled up or down, based on the amount of feedstock available.
Pre‐processing of the plastic waste includes industry‐standard grinding and shredding to a density target of 20‐21 lbs/ft3. The cartridges are filled with plastic feedstock and inserted into a Plastic Reclamation Unit, which is a large processing vessel. A light industrial burner heats air to about 1100 °F, and the air is circulated around the exterior of the cartridge while the plastics are transformed from a solid to a liquid, and finally a gas. In the gaseous form, the plastics have been broken down into oil‐sized molecules. The heating system is closed loop in order to diminish heat loss. The gases are removed from the cartridge into a central condensing system with the use of temperature and a vacuum. The gases are cooled in this system and condensed into synthetic crude oil. Waste materials are extracted from the stream, while lightweight gases that do not condense continue downstream. The light gases contain about 80% methane, propane, and butane species. The gases are then treated by an Environmental Control Device. The synthetic crude oil moves into a coalescing and settling process and is eventually moved to an aboveground storage tank outside the facility for transport to a refinery. Crude oil may be refined into ASTM‐spec products including ultra‐low sulfur diesel. The process is set up to operate on a continuous basis, 24 hours a day, seven days a week. It is assumed for purposes of this report that operations occur 312 days a year for 24 hours a day.
Performance Information Agilyx’s performance information includes a process energy ratio, which measures the Btus received from the process (output) for each Btu input to the process. According to the company’s representatives, the process energy ratio (without including the energy value found in char) is about 5:1. With the energy value of the char included the ratio is about 6:1. The Btu value of the crude oil produced is about 19,250 Btu/lb. The energy load requirements are purchased from the local utility company(s). Agilyx has the ability to generate both heat and electricity onsite (i.e., go off‐grid), but the costs are lower when purchasing power. Natural gas is used as a supplemental fuel, but other fuels could be used as well.
Process Emissions Table 3‐1 provides a summary of air and water process emissions. Water requirements are minimal because it is recycled and filtered for contaminants. Sorbent cartridges, or wastewater treatment filters, are sent to a contractor to be cleaned and then are reused. No other inputs, such as catalysts, are necessary for the process. The primary residual in the process is char, and the company is attempting to find a commercial outlet for the product. About 8 percent of the feedstock generally becomes char, but the values can range from 1‐50 percent depending on the type of plastic used as feedstock.
Air emissions include permitted VOC, NOx and CO emissions. PM and SO2 are considered de minimus and are unregulated. Approximately 1500 short tons per year of carbon dioxide are emitted from the light industrial burners. Agilyx is permitted to emit 39 short tons per year of nitrogen oxides and 39 short tons per year of VOCs but only discharge around 2.5 of each pollutant. Agilyx is also allowed to emit 99 short tons per year of carbon monoxide but actually

14
emits about 1.5. Emissions of HCl, SO2, NOx, and VOC are based on a proposed limit, not actual emissions levels.
Table 3‐1. Air and Water Emission Estimates for the Agilyx Pyrolysis Process.
Air Emissions Questionnaire PM (lb/dry ton) Not regulated CO2 biogenic (lb/dry ton) CO2 total (lb/dry ton) 962 CH4 (lb/dry ton) NA Sulphur dioxide (SO2) (lb/dry ton) De minimus VOCs (lb/dry ton) 1.6 Nitrous oxide (N2O) (lb/dry ton) De minimus NOx as NO2 (lb/dry ton) 1.6 Carbon monoxide (CO) (lb/dry ton) 1 Mercury (Hg) (lb/dry ton) ND Cadmium (Cd) (lb/dry ton) NA Lead (lb/dry ton) NA Dioxins and furans (lb/dry ton) NA Water Emissions Data Water Effluent (lb/dry ton) NA BOD (lb/dry ton) NA COD (lb/dry ton) NA Residual Wastes Data Char (lb/dry ton) 160
Cost Information
Agilyx did not provide any cost information about their processes.
Additional Aspects and Future Outlook Agilyx is the only known company who has a refinery off‐take agreement within the plastics conversion industry. Currently, they are shipping synthetic crude oil from their showcase facility in Portland, Oregon, to U.S. Oil and Refining Co., located in the Pacific Northwest. This agreement may give the company a competitive advantage because they already have a customer base.
3.1.2 Envion: Derwood, MD (to be relocated to Florida in 2011/2012)
Envion was founded in 2004 and focuses solely on the conversion of waste plastics to oil. Advantages of the process include relatively easy reactor construction and operations as well as high efficiency and high Btu value of output products. One reactor that demonstrates the company’s operations has been running since 2009. In terms of design capacity, a single Envion unit can process up to 10,000 tons of plastic waste annually. The company estimates that each ton of plastic may be converted to three to five barrels of refined petroleum through a pyrolysis process. This technology can be scaled up or down through the addition of reactors. Envion provided LCI data through a combination of personal communications and transmittal of a 2010

15
independent engineering report, although general process information has been obtained from their website (RW Beck, 2010).
Process Details The Envion technology uses chipped plastics as feedstock for the pyrolysis process. An illustration of the process is shown in Figure 3‐1. The plastics must be chipped to less than 1.5 inches and melted. Approximately 1.22 tons of raw feedstock per hour can be processed. About 1.8 tons per hour are processed after water and contaminants are purged. The feedstock is composed of high‐density polyethylene (HDPE), polypropylene (PP), low‐density polyethylene (LDPE), polystyrene (PS), polyethylene terephthalate (PET), and polyvinyl chloride (PVC). PS, HDPE, LDPE, and PP are preferred because they provide the best oil yield. Only restricted amounts of PET containers are used because they lead to much higher values of waste product, mainly sludge. PVC plastics are also used in very small amounts due to the chlorine compounds released in the cracking process. The exact proportions of feedstock types are unknown but would likely be comparable to the typical MSW plastic composition.
In the pretreatment process, plastics move through a magnetic removal section and into the melting and screening section where they are liquefied at 300 °Celsius. The plastics then go through a screen to filter non‐plastic contaminants like glass and non‐magnetic metals. The feedstock and remaining organic contaminants (approximately 6 percent) pass through the screen to the main cracking reactor where plastics become a hydrocarbon vapor. In order to power the cracking process, Envion uses far infrared (FIR) heaters. Crude oil exits as an “oil gas” through a packed tower in order to remove contaminants. Oil gas is cooled and moved to tanks that separate reactor effluent into three streams: process gas stream, product oil stream, and water stream. Light components in the oil gas stream, such as butane, propane, and methane, exit the separation tank and are moved to an ICE gen‐set to produce electricity for the process. The efficiency of the ICE gen‐set depends on the composition of the process gas. The product oil is eventually transferred to primary oil tanks. Waste oil and water contaminants condense to liquid form and are sent to the sludge tank.
The sludge oil tank remains at an elevated temperature so contents do not solidify. To empty the tank, some product oil is moved to the sludge oil tank to blend the oil so it may be moved to a heated asphalt transfer truck. The gas that does not condense is sent to an ICE generator to produce electricity. A portion of the process electricity may be offset by this gas.
Other inputs for this process include about 750 KW for the nominal electric load and up to 0.435 tons of water per ton of raw plastic, depending on the amount of water needed for the cooling tower. Material byproducts include process gas that is currently used to offset 10 ‐ 25 percent of electricity used in the process. Sludge is another byproduct and accounts for about 15 percent of overall feedstock. Currently, the sludge is stored in barrels since the Btu value of the sludge indicates that it may have market potential as an energy source. Residuals include non‐metal contaminants at a rate of 0.52 TPD, or about 2 percent of the feedstock. About 1.56 TPD of small contaminants are collected, which makes up about 6 percent of the overall feedstock.

16
Figure 3‐1. Envion Pyrolysis Process Flow Diagram.
(Source: www.envion.com)
Performance Information Approximately one short ton of plastic produces 4.22 barrels of oil with a heating value of 18,347 Btu through the Envion process; however, the exact volume is dependent on the feedstock. The parasitic load is about 480 KWh/ton of waste after process gas has been combusted to generate electricity. The energy recovery efficiency of the Envion technology can be highly variable depending on the feedstock, but is generally about 62%.
Process Emissions Table 3‐2 provides a summary of air and water process emissions associated with the Envion technology. Estimates of emissions were gathered from the vendor and include small amounts of methane, sulfur dioxide, and nitrous oxide emissions. Mercury emissions are about .016 micrograms/ton of waste. Lead emissions are 0.106 mg/L of oil. Envion did not provide any information on water emissions.
Cost Information The cost per design capacity is estimated to be $7.6 million per unit or $280,700/TPD. In terms of process cost per ton, estimates range from $17 to 60, assuming 80 percent of electricity use in the production process is from the grid. Costs would be lower if the process relied solely on their own power generation.

17
Table 3‐2. Air and Water Emission Estimates for the Envion Pyrolysis Process.
Air Emissions Literature Data Questionnaire PM (lb/dry ton) Negligible Negligible CO2biogenic (lb/dry ton) Negligible CO2total (lb/dry ton) 7.4-18.5 Methane (CH4) (lb/dry ton) 26-65 VOC (lb/dry ton) Negligible HCl (lb/dry ton) Negligible Hydrocarbons (lb/dry ton) Sulphur dioxide (SO2) (lb/dry ton) Negligible Nitrous oxide (N2O) (lb/dry ton) Negligible NOx as NO2 (lb/dry ton) 36.2-90.5 Carbon monoxide (CO) (lb/dry ton) 3.6-9 Mercury (Hg) (lb/dry ton) Cadmium (Cd) (lb/dry ton) Lead (lb/dry ton) .0002 Dioxins and furans (lb/dry ton) Water Emissions Data Water Effluent BOD COD Residual Wastes Data Inorganic sludge (lb/dry ton) 300 Solid residues (lb/dry ton) 160
Additional Aspects and Future Outlook Interestingly, the sludge currently considered a waste byproduct has an energy value. If a market niche is found, the sludge could be sold as an energy product leading to greater returns for the company. It would also mean that disposal issues for the waste sludge would be taken care of.
In terms of the final oil products, Envion has great flexibility depending on what customers prefer to purchase. The Envion Oil Generator (EOG) can create kerosene, jet fuel, diesel, or gasoline fuels, which could mean a greater market base. The facility may also be used to create more plastic products or other petroleum‐derived manufactured goods.
3.1.3 Climax Global Energy: Georgia
Climax Global Energy is a company that exclusively uses plastics as its feedstock in order to produce high quality synthetic oil and wax. Climax uses a pyrolysis process to transfer the plastics to the end products. Climax is able to accept any type of plastic and receives their source material from municipalities and private companies within a 50‐mile radius. No pre‐cleaning or pre‐sorting processes are necessary; feedstocks are fed directly into a pyrolysis chamber. In order to power this process, microwave energy or diesel generators may be used. Vitrified solid residuals are one byproduct of this process. Approximately 5‐10% of the original

18
mass of the feedstock is non‐toxic ash that must be landfilled. Climax Global Energy provided LCI data through submittal of the data questionnaire and follow‐up communications.
Process Details The Climax Global technology uses mixed, post‐consumer plastics as feedstock for its pyrolysis process. The plastics must be chipped to shred prior to being processed. Approximately 20 tons of raw feedstock per day is processed. Moisture content of the feedstock ranges from 0 to 5 percent. One ton of waste plastic yields 5 barrels of synthetic oil.
The feedstock is converted using average bulk reactor temperatures of 400 °Celsius. Inputs to the process include a minimal amount of inert nitrogen and 1–3 gallons of water per minute. Three to four tons of light gas (C1 to C4) are produced as byproducts. One to three tons of solid carbonaceous residue and any inert materials from the feedstock stream, such as rocks, dirt, and glass, are removed as a part of the process.
Performance Information Climax Global Energy has an energy recovery efficiency of approximately 75 percent. The commodity wax has approximately 6 million MMBtus per barrel. The internal parasitic power requirement is expected to be about 18,000 kW per day. No external fuel use is required in order for the facility to begin operations.
Process Emissions Emissions have been summarized in Table 3‐3. The facility is known to emit PM, CO2 and hydrocarbons. SO2, N2O, VOCs, NOx and CO have yet to be determined. Byproducts of the plasma gasification process include vitrified inorganic residue and non‐toxic ash. Additionally, less than one gallon of water effluent per hour is produced during the process.
Cost Information The cost per design capacity is estimated to be $250,000/TPD, including materials, handling & balance of plant.
Additional Aspects and Future Outlook A positive attribute for Climax is their ability to create many different products from their plastic feedstock. For example, commodity wax is one product that has a variety of uses, such as cosmetics, adhesives, and coatings. The company can also produce oils that can be refined into ultra‐low‐sulfur diesel and high‐grade synthetic lubricants. The variability of product output places Climax in an excellent position to determine the highest valued product and produce that in order to maximize profits.

19
Table 3‐3. Air and Water Emission Estimates for the Climax Pyrolysis Process.
Air Emissions Questionnaire PM (lb/dry ton) 20 CO2 biogenic (lb/dry ton) CO2 total (lb/dry ton) 500 CH4 (lb/dry ton) HCl (lb/dry ton) Hydrocarbons (lb/dry ton) Sulphur dioxide (SO2) (lb/dry ton) Nitrous oxide (N2O) (lb/dry ton) NOx as NO2 (lb/dry ton) Carbon monoxide (CO) (lb/dry ton) Mercury (Hg) (lb/dry ton) Cadmium (Cd) (lb/dry ton) Lead (lb/dry ton) Dioxins and furans (lb/dry ton) Water Emissions Data Water Effluent BOD COD Residual Wastes Data Char Spent catalyst
3.1.4 JBI: Niagara Falls, New York
JBI uses a proprietary pyrolysis process, Plastic2Oil (P2O), to convert mixed, non‐recycled plastic waste to gasoline, diesel and light‐fraction gases. JBI receives feedstock from a variety of sources, including commercial and industrial partners, and is currently seeking a permit to use MSW‐based feedstock. JBI has been operating at commercial status in Niagara Falls, New York, since 2010 and anticipates one jointly‐operated site in Canada and several in Florida. JBI provided LCI data through submittal of the data questionnaire and follow‐up communications.
The P2O processor is highly automated and runs continuously, as long as feedstock is loaded into the hopper. Approximately 1800 pounds of feedstock can be converted per hour. The process currently converts up to 20 tons of plastics per day; however, 30 ton‐per‐day units are in development. The footprint for the processing equipment is less than 1000 square feet.
Process Details Feedstock is first shredded or pre‐melted and conveyed to the reactor via hopper and conveyor system. The reactor cracks the plastics into short, gaseous hydrocarbons. The heavy fraction gases are condensed and stored in fuel tanks and the light fraction gases are compressed and stored to be used to internally power the P2O process or sold separately.
Inputs include natural gas for start‐up and proprietary catalysts, water and electricity during P2O processing. P2O is permitted to generate electricity onsite using process gases as fuel.

20
Since the process can convert approximately 8% percent of the plastic feedstock into these light‐fraction process gases, the grid electricity requirement averages around 67 kWh.
For every ton of plastic processed, approximately 5 pounds of non‐hazardous solids, 136 pounds of char, and spent catalysts are produced in addition to the gasoline, diesel, syngas and residual light fraction gases. Residues are removed automatically.
Performance Information The Plastic2Oil process has a recovery efficiency rate of approximately 92% percent. Each ton of plastic produces 1734 pounds of gasoline and diesel as well, 0.18 pounds of syngas, and residuals that have been found to have a heating value of 10,600 Btu.
The company reports a high level of vertical integration due to co‐locating with plastic waste sources, scaling the equipment to meet the feedstock supply, and using a highly automated process. Additionally, the process partially relies on the off‐gases generated internally, reducing the operating costs and offsetting electricity grid mix emissions.
Process Emissions Table 3‐4 summarizes estimates for air and water emissions. Primary air emissions from the P2O process include particulate matter, carbon dioxide, nitrogen oxides, hydrocarbons and VOC’s; however, JBI is not required to monitor emissions or install emissions control technologies.
In terms of GHG emissions, converting one ton of plastic using JBI’s P2O process yields approximately 0.29 pounds of carbon equivalents. The process also reports 2.41 pounds of NOx emitted for every ton of waste plastics. JBI reports that the atmospheric emissions are less than a natural gas furnace. Water is used for gas cooling, and wastewater from this step is reused, but no water effluent is generated.
Cost Information The estimate for cost per design capacity is $587,000 for the entire machine. For operational costs, a cost of $7 per hour is required to cold‐start and power the processing equipment. Plastics are generally provided to JBI at no cost.
Additional Aspects and Future Outlook In addition to receiving permits to begin commercial operations in New York, JBI recently announced a joint venture with OxyVinyl Canada to produce oil onsite using the waste plastics generated by OxyVinyl. JBI is currently focusing on creating additional partnerships with organizations that have existing permits and high‐volume, waste plastic streams, to maximize consistent feedstock volume while minimizing the permitting processes.

21
Table 3‐4. Air and Water Emission Estimates for the P2O Gasification Process.
Air Emissions Questionnaire PM (lb/ton plastics) 0.038 CO2 equivalents (lb/ton plastics) 0.29 Hydrocarbons (lb/ton plastics) 0.00034 Sulphur dioxide (SO2) (lb/ton plastics) 0.014 Nitrous oxide (N2O) (lb/ton plastics) NOx as NO2 (lb/ton plastics) 2.41 Carbon monoxide (CO) (lb/ton plastics) 0.29 VOC (lb/ton plastics) 0.017 HAP (lb/ton plastics) 0.00034 Water Emissions Data No water emission in process Residual Wastes Data Char 136 Spent catalyst proprietary
3.2 Gasification Technology Vendors
3.2.1 Enerkem: Westbrook, PQ, Canada
Enerkem uses a gasification process to convert waste materials to syngas as an intermediate product. Sources of feedstock include MSW, refuse‐derived fuel (RDF) from sorted MSW, woody wastes from construction and demolition, used telephone poles, and other wastes from industrial, commercial and institutional (ICI) . Ethanol, electricity, and other green chemicals are options for final products.
The company currently has two operational facilities: a pilot‐scale plant in Sherbrooke PQ, Canada and an operating pilot‐scale demonstration plant at Westbrook, PQ, Canada. Enerkem also has begun construction on two commercial facilities, one in Pontotoc, MS, and one in Edmonton, AB, Canada, that are anticipated to begin full operations in 2012, respectively. All information about the anticipated Pontotoc, MS plant was obtained from the Environmental Assessment (U.S. DOE, 2010). Information about the Canadian facilities was obtained from a combination of personal communications and literature search.
The commercial demonstration facility has been in operational since 2009 and in its demonstration stage has managed approximately 39 tons per day of feedstock on a dry basis. Commercial‐scale demonstration signifies that the facility is in the next‐to‐final stage of the technology development cycle and is a commercial‐scale facility running smaller batches of waste to refine the process. The planned commercial facilities will have a capacity of approximately 330 dry tons per day.
Process Details The Enerkem gasification process is illustrated in Figure 3‐2. The first step in the process is to dry, sort, and shred the waste. Three types of feedstock are used: (a) refuse‐derived fuel (RDF)

22
that has been sorted from MSW, (b) construction and demolition (C&D) waste, and (c) institutional, commercial, and small industry (ICI) waste. The pre‐sorting of RDF waste includes sorting and biological treatment followed by processing to a fluff. The facility can also accept more traditional pelletized RDF. C&D wood is shredded and ICI is sorted and also shredded. All pre‐processing occurs at the facility. The inorganic matter content of each type of feedstock is generally 15 percent of total weight for RDF and ICI while C&D wood is less than 5 percent.
The shredded fluff from MSW, C&D, and ICI waste is fed into a bubbling fluidized gasifier, where the waste is converted into syngas. Inert residues are removed and can be used as aggregate for construction. Next, the syngas goes through a series of steps that clean and condition the syngas. These systems include cyclones, cooling, water treatment, and washing. Wastewater is a main byproduct of this portion of the process but is reused. The heating value of syngas is between 6 and 12 megajoules per standard cubic meter depending on the gasification process. Electricity can produced with the use of syngas in an ICE generator‐set. Enerkem is currently installing an ICE gen‐set.. Alternatively, the syngas can enter catalytic reactors, where it is converted into liquid fuel, including second generation ethanol, advanced biofuels, and/or green chemicals. Conversion to ethanol requires oxygen and steam inputs for this step of the process. The exact process configuration and end product(s) will be tailored to the markets and contractual arrangements.
Figure 3‐2. Enerkem Gasification Process Flow Diagram. (source: http://enerkem.com/en/our‐solution/technology/process.html)
Performance Information Performance information includes the efficiency of the process in terms of converting Btus of waste input into Btus of syngas and/or ethanol output, as well as the reliability of the technology in commercial operating conditions. Enerkem characterizes the conversion efficiency of their gasification process as the ratio of the lower heating value (LHV) of the

23
syngas to the LHV of the input feed and states that it is higher than 72 percent. In addition, high or low grade heat recovery is an option that Enerkem states can provide 5‐10 percent additional conversion efficiency. The internal parasitic power requirement to operate the gasification process is approximately 600 KWh per dry ton when electricity is the end product and 490 KWh per dry ton when ethanol is the end product. In addition, natural gas is required (15.72 lbs per ton of MSW) for facility start‐up but is not used as a co‐fuel for normal process operation.
Since the Enerkem facility is operating as a commercial‐scale demonstration facility, information about the reliability of the process at commercial operating conditions is not available at this time.
Process Emissions Table 3‐5 summarizes estimates for air and water emissions that are available through publicly available sources as well as through a questionnaire and follow‐up telephone calls with Enerkem staff. In general, the data quality for emissions estimates is low since the facility is still in the demonstration stage. As the facility transitions to a fully operational commercial facility, one would expect the process inputs/outputs to stabilize and emissions more consistent for measurement.
Primary air emissions from the Enerkem process include CO2 and NOx, as well as traces of methane, HCL, hydrocarbons, SO2, and CO. Mercury, cadmium, lead, ammonia, dioxins, and furans emissions are all below Canadian (and EU) regulations. Ammonia is also an emission that must be controlled. It has to be scrubbed out and thus removed from the circulating scrubbing water. The recovered NH3 can be sold or reintroduced in the gasifier where it is converted into N2 and H2. A steady‐state level of NH3 is thus achieved, and the syngas maintains a concentration below the regulations.
In terms of GHG emissions, Enerkem estimates that approximately 40 percent of the carbon in the feed is turned into CO2, but approximately 75 percent of the produced CO2 is recovered and reused. The ratio of biogenic to fossil carbon in CO2 depends on the ratio of biogenic to fossil material in the RDF feed stream. Personal communications with Enerkem indicate that the biogenic to fossil carbon fraction ratio is typically 3–4:1 for the RDF since it contains about 20 percent plastics and 60 to 70 percent biomass.
Water is used for gas cooling, and wastewater from this step is reused. The process is a net water producer. Enerkem estimates that it purges 1 ton of process water per ton of feed (dry basis). They clean this water and return about 80% of the purged water to the process. The remaining excess water generated is evaporated in a cooling tower or discharged as wastewater. Enerkem data provide a range of 544 to 1270 pounds of water generated per tonne of waste processed, depending on the moisture content removed in the drying/dehydrating step.

24
Table 3‐5. Air and Water Emission Estimates for the Enerkem Gasification Process. Air Emissions Public Data (Web) Questionnaire EA—MS plant PM <10 mg/Nm3 NA 0.353 lb/ton
CO2biogenic NA Biogenic to fossil ratio: 3 or 4 to 1 No increase in global biogenic emissions
CO2total 1840 lb/ton of waste 40 % of the C in the feed is turned into CO2; 366 lb/ton of waste 403.88 lb/ton
S <20 mg/Nm3 NA NA CH4 1.3 mg/Nm3 no emissions 1.89 lb/ton HCl <5 mg/Nm3 neutralized by process NA Hydrocarbons 11.9 mg/Nm3 trace NA Sulphur dioxide (SO2) < 20 mg/Nm3 trace 0.186 lb/ton Nitrous Oxide (N2O) not measured 0.395 lb/ton
NOx as NO2 150-250 mg/Nm3 below 150 ppm when syngas is combusted 1.11 lb/ton
Carbon monoxide (CO) 50 mg/Nm3 trace 1.46 lb/ton
Mercury (Hg) NA Below Canadian and EU regulatory levels NA
Cadmium (Cd) NA NA NA
Lead NA Below Canadian and EU regulatory levels NA
Dioxins and furans 0.000006 mg/Nm3 Below Canadian and EU regulatory levels and UK
Water Emissions Data Water Effluent 600 lb/ton of waste 600 - 1400 lb/ton of waste 1995 lb/ton BOD NA NA NA COD NA NA NA Residual Wastes Data Char NA NA 297.32 lb/ton Spent catalyst NA NA 3.39 lb/ton Residual wastes produced by the process include primarily gasifier char and residual catalysts from the catalytic synthesis stage. No estimate for char production was provided, but the char would require disposal. If the process is tailored to produce alcohol fuels as the main product, then residual catalysts would be produced and also require disposal.
Cost Information Estimates for capital and operating costs were collected through publicly available sources as well as through a questionnaire and follow‐up telephone calls with Enerkem staff. Similar to emissions, presenting reliable estimates of costs is difficult since the facility is still in the demonstration stage. As the facility transitions to a fully operational commercial facility, one would expect the process inputs/outputs to stabilize and costs to be more consistent and reliable.
Estimates for cost per design capacity for the Enerkem Pontotoc, MS, facility is $424,242 per dry ton. For their 330 dry‐ton‐per‐day facility, the total capital cost would be approximately $140 million.

25
Additionally, an external source presentation indicates operational costs ranging from approximately $45 to $0 per ton of waste for the Quebec facility1.
Additional Aspects and Future Outlook Ethanol, electricity, and other green chemicals are options for final products for the planned facilities. The exact process configuration and operational specifics will be tailored to the markets and contractual arrangements.
3.2.2 Plasco: Ottawa, Ontario, Canada
Plasco Energy Group is a company that operates a commercial‐scale demonstration facility working closely with the city of Ottawa. The partnership began in April 2006, and the facility was constructed at the site of existing landfill space. Currently, the facility is permitted to process 93 tons per day of solid waste and is able to generate 4 MW of electricity. Plasco Energy Group provided RTI with an independent comparative analysis of Plasco and other WTE facilities as well as with a process brochure (Pembina, 2009; Plasco, 2011). Additionally, general process information and semi‐annual emissions reports were obtained from their website (Plasco, 2010).
Process Details Plasco Energy Group’s Ottawa Trail Road Facility is a waste‐to‐energy facility that utilizes post‐consumer recycled MSW. MSW is first shredded and then goes into the conversion chamber, which converts waste into crude syngas with the use of recycled heat. Solid residue is removed to another chamber called the Carbon Recovery Vessel (CRV), where solids are melted with a plasma torch. Plasma heat stabilizes solids and transforms any volatile compounds and fixed carbon into crude syngas, which then flows back to conversion chamber.
The crude syngas moves to the refinement chamber, and plasma torches are utilized to clean and refine the gas. This refined gas is termed PlascoSyngas. At this point, PlascoSyngas moves to the Gas Quality Control Suite, which removes heavy metals and PM found in the MSW. It also neutralizes acid gases. PlascoSyngas is now able to be used in ICE gen‐set to generate electricity. Another waste product is water that must be disposed after the process through a licensed carrier (Pages 1‐1, 1‐2, and 3‐3); however, Plasco will be a net producer of water because the excess moisture in the waste is removed at high temperatures. The water is then filtered and cleaned to potable water standards.
The process flow diagram for Plasco is Figure 3‐3.
1 http://www.sgc.se/gasification2009/Resources/05_Esteban_Chornet_Enerkem.ppt.pdf

26
Figure 3‐3. Plasco Gasification Process Flow Diagram. (Source: www.plascoenergygroup.com)
Performance Information
No data was obtained for the energy conversion efficiency of the process; however, Plasco reports that 98% of the waste processed is converted to marketable products. Additionally, a 2009 study comparing Plasco to standard waste‐to‐energy processes indicates that each ton of waste produces between 2000 and 3000 cubic meters of syngas with an energy content of 3 to 5 megajoules per cubic meter, depending on the feedstock content. Higher energy content in feedstock yields higher energy content and higher volumes of syngas. If accurate, syngas would yield 3165 to 7912 Btus per pound of waste. This estimate is significantly less than the other gasification processes studied here; however, the study estimates that when used to generate electricity, the Plasco process produces more energy than incineration for energy recovery and landfill gas to energy.
Process Emissions Table 3‐6 provides a summary of emissions from the Plasco process. Slag is one residual from the Plasco process. Slag is transformed to pellets, which are inert vitrified, or glass, residues that do not leach and are not toxic. Converter ash is another inert byproduct that is also produced when the CRV is not running. The ash is then landfilled. Baghouse ash is another waste product sent offsite as hazardous waste.

27
Table 3‐6. Air and Water Emission Estimates for the Plasco Gasification Process.
Air Emissions
Literature Data (Pembina Study
modeling full-scale commercial operations)
Literature Data (Semi-annual reports for Plasco Trail Road
demonstration facility) Literature Data
(ICF, 2009) PM (lb/ton) 0.044 0.008‐0.039 0.042 CO2 biogenic (lb/ton) 467.040 CO2 total (lb/ton) 636.64‐727.9 1047.560 CO2 equivalents (lb/ton) 708 440 CH4 (lb/ton) 0.0002 HCl (lb/ton) 0.02596 0.00088‐0.0021 0.024 Nitrogen Oxide (N2O) (lb/ton)
0.485‐0.949 0.00005
Sulphur dioxide (SO2) (lb/ton)
0.116 0.075‐0.141 0.172
Nitrous Oxide (N2O) (lb/ton) 0.001
Nox as NO2 (lb/ton) 0.168 1.45‐1.87 0.172
Carbon monoxide (CO) (lb/ton)
0.44 0.194‐0.331 0.410
Heavy Metals (lb/ton)
Mercury (Hg) (lb/ton) 0.5‐20 ug/Rm3 6 e‐07
Cadmium (Cd) (lb/ton) 0.00028‐0.00048 8 e‐06 Lead (lb/ton) 0.0004‐0.00362 1 e‐05 TNMOC (lb/ton) Dioxins and furans (lb/ton) 0 8.74‐52.34 ug/Rm3 Water Emissions Data Water Effluent (lb/ton) 2906.1‐7189.7 BOD COD Residual Wastes Data Char Potable water Spent catalyst
Cost Information
No cost information for the Plasco technology was provided; however, the website indicates that approximately $270 million in capital has been raised and invested in Plasco since 2005. Additionally, an external source presentation2 indicates that capital costs are approximately $86/ton of waste.
2 http://www.seas.columbia.edu/earth/wtert/meet2010/Proceedings/presentations/CASTALDI.pdf

28
Additional Aspects and Future Outlook Since the Plasco facility is still in a demonstration phase, details of the facility’s operations may not necessarily be representative of the actual levels of efficiency and waste outputs that will occur in a commercial‐scale facility. Although the demonstration facility might not perform as well as the planned commercial‐scale one, a technical review conducted in 2009 displayed results in favor of Plasco’s operations. Pembina Institute did an analysis of the commercial version of the current demonstration facility in comparison with incineration, anaerobic digestion, and landfill gas with gas capture facilities located around the world. The life cycle analysis results showed that air emissions were lower or about the same for Plasco when compared to other systems, with the exception of heavy metals and PM. Plasco had a heightened ability to generate a greater energy value per waste unit. The company was also capable of generating more marketable products from a given waste stream and was also able to remove more sulfur, heavy metals, and PM before combustion than the other companies. The results of the study lead to a favorable conclusion of Plasco’s planned commercial‐scale facility in terms of environmental effects and efficiency levels.
3.2.4 Zegen: Attleboro, MA
Ze‐gen is a company founded in 2004. The company is expected to complete construction and begin operations in 2012 of the Attleboro Clean Energy Project, located within the Attleboro Corporate Campus in Massachusetts. The facility will be co‐located with an industrial wastewater treatment facility. The design capacity is expected to be between 75 and 150 tons per day. The energy products are steam and syngas. The synthesis gas (syngas) has one‐quarter the energy density of natural gas and may be utilized as a fuel similar to natural gas. The company also has a demonstration facility located in New Bedford, MA, that opened in 2007. Ze‐gen provided LCI data through submittal of the data questionnaire and follow‐up communications.
Process Details Ze‐gen will construct a liquid‐metal gasification facility that utilizes post‐recycled, processed waste material. The facility will accept the following feedstocks: creosote‐treated railroad ties, non‐recycled plastics, and clean wood waste. Pre‐processing of the feedstock will be necessary and will occur through a contracted processer offsite. After pre‐processing is complete, the moisture content of the feedstock will be less than 20 percent and the inorganic matter content will be less than 5 percent. Other inputs are required for air emissions control such as sodium hydroxide, calcium hydroxide, aqueous ammonia, and activated carbon.
Synthesis gas (syngas) will be created through a thermo‐chemical process with the use of liquid copper. The temperature of the gasifier will be about 2,200 °F. The process of gasification will divide organic and inorganic components. The organic components will be reacted to produce syngas, while inorganic components will be removed. The syngas will be used in a boiler that will produce steam and power a generator to yield electricity.

29
Performance Information The Attleboro Clean Energy Project is expected to have an energy recovery efficiency of approximately 48 percent. The internal parasitic power requirement is expected to be less than one MW. The regional electricity grid mix displaced by delivered electricity is 9% coal, 38% natural gas, 25% oil, and 14% hydroelectric power and renewable. In order for the facility to begin operations, supplemental fuel use will be necessary at a rate of approximately 1,500 MMBtu of natural gas per start up.
Process Emissions Table 3‐7 summarizes the proposed process emissions limits for the Ze‐gen technology. Some process emissions that will be regulated by the Massachusetts Department of Environmental Protection include PM, CO2, CH4, HCl, NOx, VOCs, CO, Hg, Cd, NH3, and Pb. The Commonwealth of Massachusetts does not treat carbon emissions as neutral unlike most other states. In their report, Ze‐gen computes carbon contributions in three ways: avoided emissions, total carbon + biogenic, and carbon without including biogenic emissions. Ze‐gen provided a range of emissions, and for this report the upper bounds of emissions levels were used. Wastewater will be another byproduct of the gasification process, and occur at a rate of about 45 gallons per minute. Residuals will also be present from those inorganic components that have been removed from liquid metal. The components will be made into vitreous, glass‐like slag. About 1.5 tons of slag is expected to be generated per day.
Table 3‐7. Air and Water Emission Estimates for the Ze‐Gen Gasification Process.
Air Emissions Questionnaire PM (lb/dry ton) .01CO2 biogenic (lb/dry ton) CO2 equivalent (lb/dry ton) CO2 fossil (lb/dry ton) 345 CH4 (lb/dry ton) HCl (lb/MMBtu) 0.008 lbHydrocarbons (lb/dry ton) Sulphur dioxide (SO2) (lb/dry ton) 0.38Nitrous Oxide (N2O) (lb/dry ton) NOx as NO2 (lb/dry ton) 0.19VOCs3 (lb/dry ton) 0.04 Carbon monoxide (CO) (lb/dry ton) 0.13Mercury (Hg) (lb/ MMBtu) 3.4E‐06 Cadmium (Cd) (lb/ MMBtu) 5.1E‐07 Lead (lb/MMBtu) 7.19E‐06
Dioxins and furans (lb/dry ton) Water Emissions Data Water Effluent BOD COD
3 Note: This is the proposed limit, not actual emissions data

30
Residual Wastes Data Char Slag (lb/dry ton) 30Gasifier solid residues (lb/dry ton) 30Spent catalyst
Cost Information No cost information for the Ze‐Gen technology was provided or found through literature and web searches.
Additional Aspects and Future Outlook Currently, Ze‐gen is testing the viability of using a number various feedstocks, including its ability to use marine debris plastic floating along the surface of the ocean. If successful, the company could remove some of the waste that is detrimental to the overall ecosystem health of the ocean while converting waste to usable fuel.
3.3 Plasma Arc Gasification
3.3.1 Geoplasma St Lucie, Florida
Jacoby Development Inc. formed Geoplasma, LLC in 2003 in order to work on research and development for conversion technologies. Geoplasma is a planned facility that has received its final air permit from the Florida Department of Environmental Protection. The facility is set to produce 22 megawatts of power with the use of 600 tons of waste on a daily basis. Geoplasma, St. Lucie will be constructed at the St. Lucie County Solid Waste Facility.
Process Details The facility will use Class I waste, which includes solid waste that is not hazardous waste and waste not banned from disposal in a lined landfill. It will also process construction and demolition (C & D) waste, tires, and yard waste. Geoplasma will reduce monetary and time costs associated with transport of waste to the facility because they will be collocated with the waste facility. The feedstocks will be received in the existing receiving‐and‐baling recycling building. Supplementary storage will be constructed similar to the existing one. A conveyer system will transport waste fuel to the initial processing location to reduce the size of the material. The moisture content of the feedstock is assumed to be 30%. In order to minimize fugitive emissions and odors, air for the gasifier will be pulled from the waste processing area and conveyer system.
The waste will also be mixed with coke and limestone. Coke will be necessary to mix with MSW and tire fuel to have a porous bed at the bottom of the gasifier. Limestone will be used for flue gas desulfurization (FGD). The mixed feedstock will be fed into the plasma heat gasifier. The organic constituents will undergo a conversion process into a syngas, which will then be combusted in a multi‐stage thermal oxidizer, and followed by a heat‐recovery steam generator (HRSG) to produce high‐pressure, high‐temperature steam. The steam will power a steam turbine electrical generator (STG). The STG will supply electricity to the grid. Exhaust gas from

31
the HRSG will be filtered through an emission control system before it is discharged to reduce harmful pollutants.
Performance Information No information on the energy performance of Geoplasma’s anticipated facility supplied by the vendor; however, the Florida Department of Environmental Protection cites that the facility is anticipated to produce approximately 22 megawatts of power from approximately 600 tons per day of waste.
Process Emissions Emissions have been summarized in Table 3‐8. Geoplasma is considered a major source of hazardous air pollutant (HAP) emissions and is in accordance with Title V major source category. Table 3‐8 provides a summary for air emissions of the facility. No water emissions were available. Since the facility is not yet functioning, the potential‐to‐emit value was used instead of actual emissions levels. The facility was also assumed to be operating 312 days a year on a 24‐hour basis. Emissions that have limits include NOx, CO, SO2, VOC, HCl, PM, lead, Hg, Cd, D/F, VE, and NH3. Limestone is used in air pollution control equipment to minimize SO2 emissions. Another input is powdered activate carbon (PAC) delivery, which will be used to manage Hg, trace metals, and complex organic compounds.
Byproducts of the plasma gasification process include vitrified inorganic residue. The bottom of the gasifier will also discharge some residue metals into water. Sand‐like aggregate and metal nodules will be produced from this mixture at a rate of 13,200 lb/hr. The two byproducts will be separated, stored, and loaded to trucks to be sold offsite. Spent PAC will be accumulated in the system baghouse, and moved to a storage silo at a rate of 900 lb/hour. In order to reduce PM emissions, the PAC will be transferred through an enclosed conveyer to the silo. Gypsum is another process byproduct and is expected to be produced by the FGD system at a rate of 900 lb/hour.
The Geoplasma data collected were not analyzed during this analysis for several reasons. Most importantly, the Geoplasma process data were the only data that was able to be collected for the Plasma Arc process. Additionally, we were not able to obtain all of the process information needed for the LCI.
Cost Information No cost information was provided by the company and was not available at the time of this report. It is likely that since this project is still in the evaluation and permitting process, the final costs were not known.

32
Table 3‐8. Air and Water Emission Estimates for the Geoplasma Gasification Process.
Air Emissions Literature Data (from FL Technical Evaluation
PM (lb/wet ton) .2
CO2 biogenic (lb/wet ton) CO2 total (lb/wet ton) CH4 (lb/wet ton) HCl (lb/wet ton) .13
VOC (lb/wet ton) .25
Hydrocarbons (lb/wet ton)
Sulphur dioxide (SO2) (lb/wet ton) .13
Nitrous Oxide (N2O) (lb/wet ton) NOx as NO2 (lb/wet ton) .25
Carbon monoxide (CO) (lb/wet ton) .25
Mercury (Hg) (lb/wet ton) 5.34E‐05
Cadmium (Cd) (lb/wet ton) Lead (lb/wet ton) 0.35 tons per year
Ammonia (NH3) (lb/wet ton) 2
Dioxins and furans (lb/wet ton) 3.63E‐06
Water Emissions Data Water Effluent BOD COD Residual Wastes Data Char Spent PAC
Additional Aspects and Future Outlook According to the public’s comments on the draft permit, support for the facility is widespread. One potential issue that may need to be addressed in the future is that excess emissions are allowed during startup, shutdown, or malfunction (SSM). The Blue Ridge Environmental Defense League specifically cited that this flexibility in emissions levels is unacceptable. If there are issues that lead to SSM during Geoplasma’s operations that lead to significantly higher emissions, it is possible that this issue may come up again.

33
Section 4: Environmental and Cost Assessment for Technology Categories
For the environmental and cost assessment, we wanted to use a systematic and standard methodology for characterizing the environmental aspects and potential impacts of diversion alternatives that allows comparing the environmental performance of systems. We utilized a LCA (life cycle assessment) methodology. LCA is a technique for assessing the environmental aspects and potential impacts of a system from raw materials acquisition through production, use, and disposal. According to the internationally accepted ISO 14040 standard, conducting an LCA includes compiling an inventory (called an LCI – Life Cycle Inventory) of relevant inputs and outputs of a system, evaluating the potential environmental and health impacts of those inputs and outputs (called an LCIA – Life Cycle Impact Assessment), and interpreting the results in relation to the objectives of the study. In this study, we took the LCA through the inventory analysis (LCI) stage, only aiming to identify and evaluate the general environmental performance and cost of the conversion technologies and to compare them to a reference waste management option (landfill).
Using a life cycle perspective encourages planners and decision makers to consider the environmental aspects of the entire waste management system. These include activities that occur outside of the traditional framework of activities, from the point‐of‐waste collection to final disposal. For example, anyone evaluating options for recycling should consider the net environmental benefits (or additional burdens), including any potential displacement of raw materials or energy. Similarly, when energy is recovered through waste combustion, conversion technologies, or landfill gas‐to‐energy, the production of fuels and the generation of electricity from the utility sector is displaced.
In this respect, LCA (and LCI) can be a valuable tool to ensure that a given technology creates actual environmental improvements rather than just transfers environmental burdens from one life cycle stage to another or from one environmental media to another. This analysis is also useful for screening systems to identify the key drivers behind their environmental performance.
First Law of Thermodynamics In conducting a life cycle inventory for conversion technologies, it is useful to review the laws of thermodynamics. These laws succinctly define the possibilities and the necessary limitations on conversion processes. The First Law of Thermodynamics states that energy can be neither created nor destroyed. Because energy must always be conserved, it can only be converted from one form to another and ‘energy out’ must balance the ‘energy in’. Therefore, the resource produced during conversion must equal the net addition of the energy extracted from the waste supply, any feedstock energy used, and the losses in the form of heat or waste product. This corresponds with the Second Law states of Thermodynamics, which states that although energy cannot be created or destroyed, some of the usable energy will be converted to unusable energy during conversion (e.g., uncaptured heat, unusable byproducts). Also, energy must always flow from high temperatures to low temperatures and that, taken together, the laws indicate that 100 percent conversion efficiency is not possible.

34
4.1 General Approach for the Environmental and Cost Assessment
An LCI methodology was used to guide the environmental and cost assessment. The focus of this study was only on those materials currently destined for the landfill and not those currently being recycled. Our general approach was to develop inventories of energy, emissions and cost for the gasification and pyrolysis systems and to utilize RTI’s existing MSW DST to capture the other life cycle components (e.g., materials pre‐processing [separation], landfill disposal, energy production, transportation, and materials production activities). The data and models in the MSW DST have been developed for the U.S. Environmental Protection Agency (U.S. EPA) and have been extensively peer reviewed for quality assurance.
The environmental and cost inventories for gasification and pyrolysis do not represent any one specific technology or vendor. Rather, data collected for selected technology vendors as profiled in Section 3 were supplemented with data collected from the literature, and lower—upper bound ranges were developed for the two technology classes (i.e., gasification, pyrolysis).
4.1.1 Goals
The overall goal of the analysis is to estimate the impacts that mixed waste and plastic waste conversion technologies have on the environment and public health. In general, the analysis will seek to answer questions in two categories:
• What are the life cycle environmental burdens/benefits of conversion technologies?
• How do the life cycle environmental burdens/benefits of conversion technologies compare to the baseline practice of landfill disposal for post‐recovery material?
The goal of the LCA is not necessarily to draw definitive conclusions about conversion technologies or the environmental preference of conversion technologies when compared to the existing landfill base case. Rather, the goal is to better understand the potential environmental and burdens and benefits that may result from the commercialization of conversion technologies, the tradeoffs of employing conversion technologies as alternatives to existing MSW management practices, and the variables that influence the potential environmental impacts of conversion technologies.
4.1.2 Scope and Boundaries
Gasification and pyrolysis have different functional units, which is the reason why we are not attempting to compare the two systems. The function of the gasification technology system is to transform the mixed waste fraction of post‐recovery (i.e., residual waste after recycling and composting) waste into energy and useful products. The functional unit is then a mass unit (e.g., a ton of MSW) of mixed waste. The pyrolysis technology system manages plastic waste. Therefore, the functional unit is a mass unit of plastics waste (e.g., a ton of plastics).
Figure 4‐1 illustrates the system boundaries defined for a conversion technology in this assessment. In the figure, the boundaries include not only the conversion technology and other
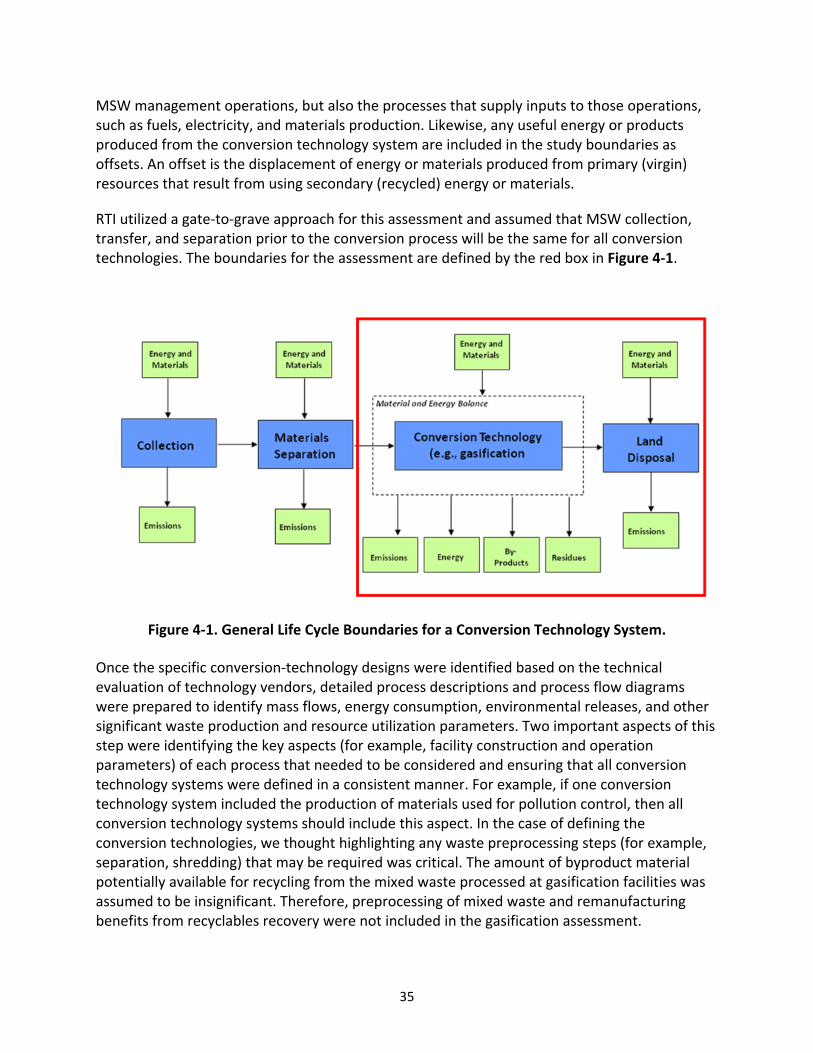
35
MSW management operations, but also the processes that supply inputs to those operations, such as fuels, electricity, and materials production. Likewise, any useful energy or products produced from the conversion technology system are included in the study boundaries as offsets. An offset is the displacement of energy or materials produced from primary (virgin) resources that result from using secondary (recycled) energy or materials.
RTI utilized a gate‐to‐grave approach for this assessment and assumed that MSW collection, transfer, and separation prior to the conversion process will be the same for all conversion technologies. The boundaries for the assessment are defined by the red box in Figure 4‐1.
Figure 4‐1. General Life Cycle Boundaries for a Conversion Technology System. Once the specific conversion‐technology designs were identified based on the technical evaluation of technology vendors, detailed process descriptions and process flow diagrams were prepared to identify mass flows, energy consumption, environmental releases, and other significant waste production and resource utilization parameters. Two important aspects of this step were identifying the key aspects (for example, facility construction and operation parameters) of each process that needed to be considered and ensuring that all conversion technology systems were defined in a consistent manner. For example, if one conversion technology system included the production of materials used for pollution control, then all conversion technology systems should include this aspect. In the case of defining the conversion technologies, we thought highlighting any waste preprocessing steps (for example, separation, shredding) that may be required was critical. The amount of byproduct material potentially available for recycling from the mixed waste processed at gasification facilities was assumed to be insignificant. Therefore, preprocessing of mixed waste and remanufacturing benefits from recyclables recovery were not included in the gasification assessment.

36
In comparing conversion technologies to existing landfill disposal practices, we needed to have consistent data for each burden (for example, dioxin/furan emissions) across all unit processes in the waste management system. Therefore, if data for any given burden was not consistently available across all processes included in the system, then the burden was not included in the comparative results of conversion technologies to existing management practices. However, we did consider all burdens in this report when describing specific conversion technologies. In general, the main categories of inputs and outputs that are reported for each conversion technology system are consistent with those that RTI includes in its MSW DST. These include annual estimates for energy consumption, air emissions, water pollutants, and solid waste. In deciding upon which LCI burdens to include in the analysis, we decided to focus on energy and criteria air pollutants.
4.2 Life Cycle Inventory Methodology, Assumptions and Modules for Waste Conversion Technologies
As part of the life cycle inventory (LCI) approach adopted for the environmental and cost assessment, data was collected to quantify the relevant inputs and outputs of the technology systems. Data was collected, reviewed, and compiled based on the conversion technology system boundaries (Figure 4‐1). Internal and external contacts were worked with to identify available data for each of the conversion technologies. Data were collected from the following sources:
• Technology vendors. • Publicly available literature. • Federal reports. • State and municipal governments. • Industry reports. • Trade associations. • Waste collection, processing, and disposal facility records and reports.
The scope and boundaries for each major conversion technology category are based on the technology class definitions and vendor‐specific process flow diagrams presented in Sections 2 and 3 of this report as well as other information collected from the literature. Each process flow diagram shows the major process steps that occur in processing and converting waste input. In addition, the diagrams show the main material‐and‐energy inputs and outputs for each conversion technology.
As shown by the process flow diagrams, the processes for which data are presented are not cradle‐to‐grave, but rather gate‐to‐gate. This is because the conversion technologies by themselves are just one process step within the system. Only after all of the pieces of life cycle inventory data from each process step within the system boundaries are assembled can the inventory module for each conversion technology be completed. These inventory modules rely on the material and energy data provided by the vendors and/or obtained from the literature as a starting point and then add the inventory information for upstream and downstream steps.
37
In general, the construction of the LCI module for each conversion technology is depicted as follows:
LC input/output burdens – Offsets = Net LCI Coefficients For example, gasification may use natural gas as a supplemental fuel. The amount of natural gas consumed for a given tonnage of waste processed is calculated in the material and energy model. This amount is multiplied by the environmental burdens associated with producing the natural gas and added to the inventory for the technology. Similarly, the gasification process generates some residual waste and char that is landfilled. The environmental burden associated with the transportation and landfill disposal of these residuals was added to the inventory for the technology.
Material and energy offsets are netted out of the LCI. In the case of pyrolysis, the main products are waxes and liquid fuels, each having a number of possible end uses. For this study, we assumed that it would be used as a replacement for fuel oil. The quantity of commodity oil that is produced by the process (as given by the material and energy model) is converted to an equivalent functional amount of fuel oil. That amount of fuel oil offset is then multiplied by the inventory burdens associated with fuel oil production, and these burdens are netted out of the inventory for the technology.
4.2.1 Treatment of Material and Energy Recovery
The amount of byproduct material potentially available for recycling from the mixed waste processed at gasification facilities was assumed to be insignificant. Therefore, preprocessing of mixed waste and remanufacturing benefits from recyclables recovery were not included in the gasification assessment.
For energy‐related offsets, we assumed that electrical energy produced from landfill gas‐to‐energy and conversion technology systems displaces electrical energy produced from fossil sources. The exact mix of fossil fuels displaced is based on the U.S. average grid mix. Electrical energy is produced mainly from the gasification technologies.
For the pyrolysis/cracking technologies, commodity oils/waxes are the main product. We assumed that the commodity oils/waxes displace petroleum‐based crude oil.
4.2.2 Items Excluded from the Life Cycle Inventory
A number of items have been excluded from the LCI because they are typically found to be negligible in terms of the inventory totals. These items are described below.
The energy and environmental burdens associated with the manufacture of capital equipment are not included in the life‐cycle profiles. This includes equipment to manufacture buildings, motor vehicles, and industrial machinery. The life cycle burdens associated with such capital equipment generally, for a ton of materials, become negligible when averaged over the millions

38
of tons of product that the capital equipment manufactures over its lifetime as compared to the burdens associated with the processing steps.
The fuels and power consumed to heat, cool, and light manufacturing establishments are omitted from the calculations. For most industries, space conditioning energy is quite low compared to process energy. Energy consumed for space conditioning is usually less than 1 percent of the total energy consumption for the manufacturing process. The energy associated with research and development, sales, and administrative personnel or related activities have not been included in this analysis.
For each system evaluated, small amounts of miscellaneous materials are associated with the processes that are not included in the LCI results. Generally these materials make up less than 1 percent of the mass of raw materials for the system. For example, the use of biocides and other conditioning chemicals for cooling water are not documented and included in the inventory results, except to the extent that these materials contributed to waterborne emissions from the facilities.
The Geoplasma data collected were not analyzed during this analysis for several reasons. Most importantly, the Geoplasma process data were the only data that could be collected for the Plasma Arc process. Additionally, we were not able to establish contact with the vendor during the investigation and were not able to obtain all of the process information needed for the LCA.
4.2.3 LCI Parameters Tracked and Reported
The main categories of LCI inputs and outputs that were tracked and reported as part of this study include annual estimates for the following:
• Energy consumption and production. • Criteria air emissions. • Greenhouse gas emissions. • Waterborne pollutants. • Residual solid wastes.
Descriptions of what comprises each of these main categories are provided in the following sections.
Energy Consumption Annual energy consumed is aggregated across process and transportation steps in the life cycle of each conversion technology module. All fuel and electrical energy units are converted to British thermal unit (Btu) values. Electricity production assumes the average U.S. conversion efficiency of fuel to electricity and accounts for transmission and distribution losses in the power lines. Therefore, the kWh value is the aggregated amount of electricity used by the system, as delivered to the various facilities in the life cycle. The Btu value accounts for the average mix of fuels (for example, coal, natural gas, hydroelectricity, nuclear) used by utilities to produce electricity in the United States.

39
Where energy is produced by a process and displaces the production of electricity or a fuel by a utility or the petroleum sector, respectively, such as the combustion of MSW with energy recovery, a credit is given to the extent that it displaces power generation by the utility sector or production of the fuel. For this study, we used the U.S. average electrical energy grid mix to calculate the life cycle inventory burdens associated with electrical energy consumption, as well as the credits associated with electrical energy offsets. Figure 4‐2 presents the fuel mix in the U.S. average electrical energy grid (U.S.EIA, 2009).
Figure 4‐2. U.S. Average Electrical Energy Grid Mix of Fuels.
Air Emissions
Air emissions can result from two primary sources in the life cycle: process‐related activities or fuel‐related activities. Process emissions are those that are emitted during a processing step, but not as a result of fuel combustion. For example, the calcining of limestone to produce lime emits CO2. The quantity of CO2 emitted from this process would be listed under process air emissions. Fuel‐related emissions are those emissions that result from the combustion of fuels. For example, the combustion of wood byproducts in a paper mill produces a fuel‐related solid waste, ash. The emissions reported in the data tables in the product summaries are the quantities that reach the environment (air, water, and land) after pollution control measures have been taken.
Atmospheric emissions include substances released to the air that are regulated or classified as pollutants. Emissions are reported as pounds of pollutant per annual tonnage of waste managed. Atmospheric emissions also include CO2 releases, which are calculated from fuel combustion data or process chemistry. CO2 emissions are not regulated; however, we are

40
reporting them in this study because of the growing concern about global warming. CO2 emissions are labeled as being from either fossil or nonfossil fuels.
CO2 released from the combustion of fossil carbon sources (for example, coal, natural gas, or petroleum) or released during the reaction of chemicals derived from these materials is classified as fossil CO2. CO2 released from mineral sources (for example, the calcining of limestone to lime), is also classified as fossil CO2. CO2 from sources other than fossil carbon sources (that is, from biomass) is classified as nonfossil carbon dioxide. Nonfossil CO2 includes CO2 released from the combustion of plant or animal material or released during the reaction of chemicals derived from these materials. The labeling of the CO2 releases as either fossil or nonfossil is done to aid in the interpretation of the life cycle inventory data. The source of CO2 releases is an important issue in the context of natural carbon cycle and global warming.
Waterborne Pollutants Waterborne wastes are produced from both process activities and fuel‐production activities. These are reported as pounds of pollutant per tonnage of waste managed. Similar to air emissions, the waterborne pollutants include substances released to the surface and groundwater that are regulated or classified as pollutants. The values reported are the average quantity of pollutants still present in the wastewater stream after wastewater treatment and represent discharges into receiving waters.
Air or waterborne emissions that are not regulated or reported to regulatory agencies are not reported in the inventory results presented in the material summaries. Reliable data for any such emissions would be difficult to obtain, except for a site‐specific study where additional testing was authorized. Conversely, some air and waterborne emissions data that are regulated and reported may not have been included in the inventory results. The data used represent the best available from existing sources.
Solid Waste Similar to air and water emissions, solid wastes are produced from process and fuel production activities and are reported as pounds of pollutant per tonnage of waste managed. Process solid wastes include mineral processing wastes (such as red mud from alumina manufacturing), wastewater treatment sludge, solids collected in air pollution control devices, trim or waste materials from manufacturing operations that are not recycled, and packaging materials from material suppliers.
Fuel‐related solid wastes are fuel production and combustion residues, such as the ash generated by burning coal or wood.
4.3 Key Data and Assumptions Used in the LCIs
Table 4‐1 presents key LCI Assumptions for the different conversion processes.

41
Table 4‐1. Key Assumptions Used in the LCIs.
Parameter Assumption General Waste Input Gasification: post‐recovery MSW
Pyrolysis: waste plastics Waste Composition Gasification: average United States Post‐recovery
Composition from U.S.EPA (2008) Pyrolysis: 100% plastics
Transportation Distances Conversion facility to ash landfill 30 miles one way Gasification facility to landfill 30 miles one way Gasification Basic Design Accepts mixed waste, syngas as the main product Waste Input Heating Value 12 MMBtu/ton (based on waste composition) Assumed Offset for Energy Recovery Solid waste to electricity: U.S. average electricity grid mix
of fuels Pyrolysis Basic Design Only accepts plastics, oil/wax as the main product Waste Input Heating Value 28 MMBtu/ton (plastics only) Assumed Offset for Energy Recovery Fuel oil Landfill Basic Design Conventional, Subtitle D Type Time Period for Calculating Emissions 100 years Landfill Gas Collection Efficiency 75% Landfill Gas Management Energy Recovery Assumed Offset U.S. average electricity grid mix of fuels
At least 3 technology vendors per technology (i.e., gasification and pyrolysis) were contacted to obtain process data. However, not all the vendors provided data, and in some cases the data obtained were not complete. Therefore, RTI reviewed the literature for additional data and selected ranges for relevant input parameters to reflect the uncertainty and variability in the data obtained. Tables 4‐2 and 4‐3 present the data ranges used for modeling, and Appendix A presents the original data used to select those ranges.

42
Table 4‐2. Gasification Process Data.
Parameters Units Value Process Inputs and Outputs
Inpu
ts
Power consumption / parasitic load KWh/dry ton 200 ‐ 490
Other inputs (e.g., water, oxygen, etc.)
Oxygen lb/dry ton 1,446
Catalysts and chemicals lb/dry ton 107
Diesel for preprocessing gal/dry ton 0.05
Caustic for gas cleaning and cooling lb/dry ton 10 Activated Carbon for gas cleaning and
cooling gal/dry ton 0.2
Feldspar for gas cleaning and cooling gal/dry ton 0.1
Water gal/dry ton 540 ‐ 1,622
Supplemental fuel use Natural Gas lb/dry ton 16 ‐ 87
Out
puts
Energy product (e.g., syngas, ethanol, hydrogen, electricity,
steam) Electricity KWh/dry ton 925
‐ 1,302
Material Byproducts
Residual gas lb/dry ton 428
Sulphur lb/dry ton 3 ‐ 3
Salt lb/dry ton 9 ‐ 13
Slag lb/dry ton 24 ‐ 424
Residuals (e.g., ash, char, slag, etc.)
Char lb/dry ton 297 Slag lb/dry ton 75
Gasifier solid residues lb/dry ton 25 ‐ 120 Spent catalysts and chemicals lb/dry ton 3
Inorganic sludge lb/dry ton 45 Non-hazardous solid waste lb/dry ton 13
Air Emissions Data PM lb/dry ton 0.01 ‐ 0.35 PM10 lb/dry ton 0.001 Biogenic Carbon Dioxide (CO2 bio) lb/dry ton 467
Fossil Carbon Dioxide (CO2 fossil) b/dry ton 345 ‐ 1,048
Methane (CH4) lb/dry ton 2.E-04 ‐ 2
HCl lb/dry ton 0 ‐ 0.03
Sulphur dioxide (SO2) lb/dry ton 0 ‐ 0.4 Sulphur oxide lb/dry ton 5.E-05 Nitrous Oxide (N2O) lb/dry ton 0.001 ‐ 0.40
NOx expressed as NO2 lb/dry ton 0.2 ‐ 1
Carbon monoxide (CO) lb/dry ton 0.1 ‐ 1 Mercury (Hg) lb/dry ton 6.E-07 Cadmium (Cd) lb/dry ton 8.E-06 Lead lb/dry ton 1.E-05 VOC lb/dry ton 1 ‐ 0.04 HAP lb/dry ton 0.1 Acetaldehyde lb/dry ton 0.1 TNMOC lb/dry ton 0 ‐ 0.2 Dioxins and furans lb/dry ton 0 Water Emissions Data Water Effluent gal/dry ton 600 ‐ 1,400
Cost Data Cost per design capacity $/dtpd 499,109

43
Table 4‐3. Pyrolysis Process Data.
Parameters Units Value Process Inputs and Outputs
Inpu
ts Power consumption / parasitic load KWh/dry ton 0.3 ‐ 480
Other inputs (e.g., water, oxygen, etc.) Water gal/dry ton 30 ‐ 216
Supplemental fuel use Natural Gas MMBtu/dry ton 0.03
Out
puts
Energy product (e.g., syngas, ethanol, hydrogen, electricity,
steam)
Syngas MMBtu/dry ton 0.2
Synthetic crude oil lb/dry ton 37 ‐ 39
Light fraction (liquid) lb/dry ton 300 ‐ 400
Gas fraction lb/ dry ton 200 ‐ 500
Gasoline lb/ dry ton 23
Diesel lb/dry ton 1,711
Residuals (e.g., ash, char, slag, etc.)
Char lb/dry ton 136 ‐ 160
Solid residues lb/dry ton 160 Inorganic sludge lb/dry ton 300
Non-hazardous solid waste lb/dry ton 5 Water losses gal/dry ton 25 Air Emissions Data PM lb/dry ton 0.04 ‐ 15
Fossil Carbon Dioxide (CO2 Fossil) lb/dry ton 500 ‐ 962
Methane (CH4) lb/dry ton 26 ‐ 65
HCl lb/dry ton 3.E-04
Hydrocarbons lb/dry ton 0.01 ‐ 8
Nitrous Oxide (N2O) lb/dry ton 2
NOx expressed as NO2 lb/dry ton 0.3 ‐ 91
Carbon monoxide (CO) lb/dry ton ‐ 9
Lead lb/dry ton 2.E-04 ‐ 0.02
VOC lb/dry ton 3.E-04 ‐ 2
Cost Data Cost per design capacity $/dtpd 29,350 - 280,699
4.4 Environmental and Cost Assessment Results
LCI results for energy consumption and greenhouse gas (GHG) emissions as carbon equivalents (CE), as well as cost results are presented and discussed in this section of the report. We present results on both a per‐ton‐of‐waste‐input and per‐million‐Btu‐of‐energy‐produced bases. Presenting results on a Btu basis is useful for comparing conversion technologies to one another as well as to other energy production processes. However, presenting results on a per ton of waste input basis is more relevant for comparing waste conversion technologies to baseline landfill disposal.
4.4.1 Gasification Results
The cost and LCI results for energy and GHG emissions for gasification of MSW are presented in this section. The amount of byproduct material potentially available for recycling from the

44
mixed waste processed at gasification facilities was assumed to be insignificant. Therefore, preprocessing of mixed waste and remanufacturing benefits from recyclables recovery were not included in the gasification assessment. The cost and LCI results include burdens associated with the transportation and disposal of residuals. The benefits only include the energy recovered.
Energy For gasification, energy is consumed to pre‐process the incoming MSW, power the gasifier and ancillary systems, transport residuals, and dispose of residuals in a landfill. Energy in the form of syngas is the main output from the gasification process. Typically this syngas is combusted on‐site in an ICE gen‐set to produce electricity. This is the process modeled in the LCI. The syngas can be directly used for fuel or power or converted to liquid fuel, and these options were not modeled as they are less common.
The net energy consumption results for gasification are shown in Figure 4‐3 on a per‐ton‐waste‐consumed basis and in Figure 4‐4 per‐Btu‐of‐energy‐produced basis. As shown in the figures, the energy (in the form of electrical energy) produced from the gasification process generates significant energy offsets. The gasification process itself is a net electricity producer (i.e., the energy produced is larger than the energy consumed) with some variation (according to the data obtained from the different vendors and the literature) in the amount of energy produced in the range of over 4 MMBtu per ton or over 2 MMBtu per MMBtu of energy produced.
Figure 4‐3. Net Energy Consumption Per Ton for Gasification of MSW.
Energy Con
sumption (M
MBT
U/dry to
n)
Min Values Max Values Typical

45
Figure 4‐4. Net Energy Consumption Per MMBtu for Gasification of MSW.
GHG Emissions Figures 4‐5 and 4‐6 show the gasification process producing a net GHG emission savings at the lower end of emissions generation from the process, which results from the displacement of conventional electricity production (assuming displacement of fossil fuels in the U.S. average grid mix of fuels for electricity production). The emissions data obtained for the gasification piece of the LCI exhibits a wide range of variation from a net savings of approximately 0.28 TCE/dry ton (~0.09 TCE/MMBtu energy produced) to a burden of 0.05 TCE/dry ton (~0.01 TCE/MMBtu energy produced) as illustrated by the min and the max bars.
Figure 4‐5. Net Carbon Equivalents Per Ton for Gasification of MSW.
Energy Con
sumption (M
MBT
U/M
MBT
U
energy produ
ced)
Min Values Max Values Typical
Carbon
Equ
ivalen
ts (T
CE/dry to
n)
Min Values Max Values Typical

46
Figure 4‐6. Net Carbon Equivalents Per MMBtu for Gasification of MSW.
Cost
Cost data were only available for one of the gasification technology vendors in Section 3. Figures 4‐7 and 4‐8 show the cost (or revenue) by process as well as the total net operational cost of approximately ($48) to ($12) per ton of MSW or ($16) to ($2) per MMBtu of energy produced. This result signifies that the revenues received from the sale of electricity are greater than the cost to process the MSW via the gasification technology. In Figures 4‐7 and 4‐8, the process cost/revenue is per vendor supplied values, and the remaining residuals disposal cost are per RTI’s MSW DST.
Figure 4‐7. Net Cost Per Ton for Gasification of MSW.
Carbon
Equ
ivalen
ts (T
CE/M
MBT
U ene
rgy
prod
uced
)
Min Values Max Values Typical
Cost ($
/dry to
n)
Min Values Max Values Typical

47
Figure 4‐8. Net Cost Per MMBtu for Gasification of MSW.
Comparison of Gasification to Landfill Base Case
The results for gasification of MSW were compared to results for a landfill base case for MSW. A low—high range was developed for the landfill base case using a landfill with gas collection and flaring for the “low” end of the range and a landfill with gas collection and energy recovery for the “high” end of the range. The landfill base case was modeled using RTI’s MSW DST and is representative of a U.S. average.
Figures 4‐9 through 4‐11 show the results for net energy consumption, carbon emissions, and cost. Regarding energy, as shown in Figure 4‐9, the net energy saved using the gasification technology vs. landfill disposal is approximately 6.5–13 MMBtu/dry ton of MSW. For GHG emissions, as shown in Figure 4‐10, the gasification technology results in a net reduction of approximately 0.3–0.6 TCE per dry ton of MSW processed.
As illustrated in Figure 4‐11, the net cost for the base case landfill disposal of MSW ranges from approximately $40–85 less than landfill disposal on per dry ton basis.
Cost ($
/MMBT
U ene
rgy prod
uced
)
Min Values Max Values Typical

48
Figure 4‐9. Net Energy Consumption for Landfill Basecase and Gasification of MSW.
Figure 4‐10. Net Carbon Equivalents for Landfill Basecase and Gasification of MSW.
‐14
‐12
‐10
‐8
‐6
‐4
‐2
0
2
Low High Low High
Landfill (MSW) Gasification (MSW)Enegy Co
nsum
ption (M
BTU/dry ton
)
‐0.40
‐0.30
‐0.20
‐0.10
0.00
0.10
0.20
0.30
0.40
Low High Low High
Landfill (MSW) Gasification (MSW)
Carbon
Emission
s (TCE/dry ton
)

49
Figure 4‐11. Net Cost for Landfill Basecase and Gasification of MSW.
4.4.2 Pyrolysis Results
The LCI results for energy and GHG emissions for pyrolysis of plastics are presented in this section.
Energy For pyrolysis, energy is consumed to power the process and ancillary systems and transport and dispose of residuals in a landfill. Energy in the form of petroleum product (e.g., sweet diesel, petroleum wax) is the main output from the pyrolysis process. Typically this product is transported off‐site for use.
The LCI results for energy consumption for pyrolysis are shown in Figure 4‐12 on a per‐ton basis and in Figure 4‐13 per MMBtu of energy produced. According to these Figures the petroleum product output generates large energy offsets. The pyrolysis process can be considered a net energy producer (i.e., the energy produced is larger than the energy consumed) with some variation in the amount of energy produced according to the data obtained from the different vendors and the literature.
‐60
‐50
‐40
‐30
‐20
‐10
0
10
20
30
40
50
Low High Low High
Landfill (MSW) Gasification (MSW)Cost ($/dry ton
)

50
Figure 4‐12. Net Energy Consumption Per Ton for Pyrolysis of Plastics.
Figure 4‐13. Net Energy Consumption Per Btu for Pyrolysis of Plastics.
GHG Emissions
Consistent with the energy results, Figures 4‐14 and 4‐15 show that pyrolysis of plastics results in GHG emission savings, which are mostly due to emission savings from the replacement of conventional energy (petroleum) products. The emissions data obtained for pyrolysis exhibits a wide range of variation as illustrated by the min and the max bars.
Energy Con
sumption (M
MBT
U/dry to
n)
Min Values Max Values Typical
Energy Con
sumption (M
MBT
U/M
MBT
U
energy produ
ced)
Min Values Max Values Typical

51
Figure 4‐14. Net Carbon Equivalents Per Ton for Pyrolysis of Plastics.
Figure 4‐15. Net Carbon Equivalents Per Btu for Pyrolysis of Plastics.
Cost
The net (expenses‐revenue) cost per ton for pyrolysis of plastics is shown in Figures 4‐16 and 4‐17. As shown in this figure, the net cost range is negative, signifying a net revenue stream that results from the market value of the petroleum product being greater than the cost to process the plastics into petroleum via the pyrolysis process.
The conversion efficiency (e.g., number of barrels of oil per ton of plastics) and contracted market price for the recovery petroleum product are highly significant to the net cost. Facilities
Carbon
Equ
ivalen
ts (T
CE/dry to
n)
Min Values Max Values Typical
Carbon
Equ
ivalen
ts (T
CE/M
MBT
U ene
rgy
prod
uced
)
Min Values Max Values Typical

52
will likely align their specific technology to obtain the specific petroleum product (syn diesel, petroleum wax, etc.) that yields the highest market price.
Figure 4‐16. Net Cost per Ton for Pyrolysis of Plastics.
Figure 4‐17. Net Cost per Btu for Pyrolysis of Plastics.
Comparison to Landfill Base Case In this section, the results for pyrolysis of plastics are compared to results for a landfill base case for plastics. A low—high range was developed for the landfill base case using a landfill
Cost ($
/dry to
n)
Min Values Max Values Typical
Cost ($
/MMBT
U ene
rgy prod
uced
)
Min Values Max Values Typical

53
with gas collection and flaring for the low end of the range and a landfill with gas collection and energy recovery for the high end of the range. However, since plastics waste isn’t expected to produce any gas, this distinction is not relevant and only done to be consistent with the gasification results. Again, the landfill base case was modeled using RTI’s MSW DST and is representative of a U.S. average.
Figures 4‐18 through 4‐20 show the results for net energy consumption, carbon emissions, and cost. Regarding energy, as shown in Figure 4‐18, the net energy saved using the pyrolysis technology vs. landfill disposal is approximately 1.8—3.6 MMBtu per ton. For GHG emissions, as shown in Figure 4‐19, the pyrolysis technology results in a net reduction of approximately 0.15—0.25 TCE per ton of plastics processed.
As illustrated in Figure 4‐20, the net cost for the base case landfill disposal is positive. Compared to the landfill disposal cost, the pyrolysis technology saves approximately $250—300 in net revenue on a per‐ton basis.
Figure 4‐18. Net Energy Consumption for Landfill Base Case and Pyrolysis of Plastics.
‐3.5
‐3.0
‐2.5
‐2.0
‐1.5
‐1.0
‐0.5
0.0
0.5
1.0
Low High Low High
Landfill (Plastics) Pyrolysis (Plastics)
Enegy Co
nsum
ption (M
BTU/dry ton
)

54
Figure 4‐19. Net Carbon Equivalents for Landfill Base Case and Pyrolysis of Plastics.
Figure 4‐20. Net Cost for Landfill Base Case and Pyrolysis of Plastics.
‐0.30
‐0.25
‐0.20
‐0.15
‐0.10
‐0.05
0.00
0.05
Low High Low High
Landfill (Plastics) Pyrolysis (Plastics)Carbon
Emission
s (TCE/dry ton
)
‐300
‐250
‐200
‐150
‐100
‐50
0
50
Low High Low High
Landfill (Plastics) Pyrolysis (Plastics)
Cost ($/dry ton
)

55
Section 5: Findings
There are some inherent limitations associated with plastics recycling. Plastics are formed by the polymerization of simple monomers (polymers and resins are two terms that may be used for specific plastics). Two main classification types exist: thermoplastics and thermosets. Thermoplastics may be heated and solidified more than once without major property changes (with the exception of contamination). Thermosets may only be heated and solidified one time. Therefore, thermoplastics are capable of being recycled while thermosets are not.
Conversion technologies present an alternative option to landfill and mass burn waste combustion for managing non‐recycled plastics; however, there are currently very few commercially operating facilities in North America. We estimated in this study there were nine pyrolysis and seven gasification demonstration and commercially operating facilities in North America4 that process post‐recovered MSW and/or waste plastics. In general, plastics‐to‐oil pyrolysis facilities are more at the commercially operating stage in the U.S., while MSW‐based technologies (typically gasification) are still in the demonstration phase at the time of this report. Plastics‐to‐oil pyrolysis technologies were reported to receive plastics from both materials recycling facilities and industrial partnerships. Due to the small size and flexibility of plastics‐to‐oil facilities, industrial and other small‐scale partnerships which divert non‐recycled plastics from landfills directly to these facilities may represent an efficient and economic opportunity.
The primary objective of the study was to estimate the potential environmental and economic benefits and life cycle burdens of the technologies and help answer the following questions:
• What are the main conversion technologies for plastics?
• What is the current state and forward outlook for each technology?
• Can plastic waste conversion technologies currently address the need for managing non‐recycled plastics?
• Are plastic waste conversion technologies economically competitive and environmentally competitive with other waste management options?
To address these questions, a literature search and vendor survey was conducted. Conversion technology vendors were identified and asked to provide process and cost data. Additionally, publicly available data sources were retrieved to complement the data received from each vendor.
4 This includes demonstration and commercial scale facilities only. Proposed and planned facilities were not included.

56
5.1 Key Findings
Based on the data collection and analyses, the study offers the following insights on the science and status of plastics conversion technologies in North America:
• Conversion technologies do present another option (in addition to mass burn waste combustion) for managing non‐recoverable plastics. At present, there are very few commercially operating facilities in North America. A number of “first‐generation” demonstration facilities are built and operating in North America, and we estimate it will be 5‐10 years before these facilities transition to commercial operations. Thus, conversion technologies cannot immediately address landfill diversion needs but may be capable of addressing them in the future. The capability of conversion technologies to meet landfill diversion goals will depend heavily on the success of these first‐generation facilities.
• It is difficult to compare the cost and performance of pyrolysis and gasification technologies directly due to differences in feedstock. In general, pyrolysis technologies utilize only plastics whereas gasification technologies utilize MSW. Therefore, there are differences in feedstock energy value as well differences in beneficial offsets. For pyrolysis, beneficial offsets are primarily based on the conversion of plastics to hydrocarbon oil. For gasification, beneficial offsets can include energy production and also the energy recovery of valuable recyclables (e.g., metals, glass, and other inorganics) in the up‐front sorting process. For this study, the amount of material potentially available for recycling from the mixed waste processed at gasification facilities was assumed to be insignificant. Therefore, preprocessing of mixed waste and remanufacturing benefits from recyclables recovery were not included in the gasification assessment.
• Based on a high‐level life cycle environmental assessment conducted for pyrolysis and gasification technologies, the technologies appear to offer environmental benefits as compared to landfill disposal. Specifically, we estimated that gasification (excluding energy production and materials recycling offsets) of MSW saves 6.5–13 MMBtu per ton as compared to landfill disposal. Pyrolysis of waste plastics saves 1.8–3.6 MMBtu per ton as compared to landfill disposal. Likewise, our results show that gasification of MSW saves 0.3–0.6 tons of carbon equivalent (TCE) emissions per ton of MSW treated as compared to landfill disposal. Pyrolysis of waste plastics saves 0.15–0.25 TCE emissions per ton as compared to landfill disposal. In addition to presenting results on the basis of per ton of waste input, we also presented results on a per unit of energy produced basis (see Section 4). Both the per ton of waste input and per unit of energy produced bases provided the same directional results. However, it is difficult to compare the conversion technologies to landfill disposal on a per unit of energy basis since landfills are not designed with energy recovery as their primary function.
• Different technology vendors/facilities have specific variations on the process to enhance conversion efficiency and/or to tailor the end product to local markets.

57
The primary objective of the conversion technologies is to convert waste into useful energy products, which can include synthesis gas, petroleum products, and/or commodity chemicals. Syngas can be used directly in industrial boilers or in an ICE gen‐set to produce electrical energy. Petroleum products and commodity chemicals are typically tailored to specific end‐users (e.g., petroleum wax for cosmetics manufacturers). Each end product has different life‐cycle offsets that can affect the overall environmental impact of the process.
• There are a number of vendors for pyrolysis and gasification technologies, although most are currently in the demonstration stage of development. Plastics‐to‐oil pyrolysis technologies are generally further along than MSW‐based technologies (typically gasification), in part because of the decreased variability of the incoming feedstock for the former.
• Estimates provided by technology vendors indicate cost/ton is comparable to other MSW options, such as recycling and landfilling. Vendors estimate that the cost to process the waste is approximately $50 per ton (for pyrolysis and gasification technologies), which is generally related to the cost of electricity or fuel required to run the process. U.S. averages for landfill disposal and recycling, for comparison, range from $30‐75/ton depending on region.
• There is a high level of uncertainty associated with the environmental and cost data associated with these technologies. Because most conversion facilities are demonstration plants, they are operating in batch‐test mode and not as continuous‐mode commercial plants. Until there are commercially operating facilities in North America, there will not be good real‐world data to characterize the environmental aspects and costs for these technologies.
Given the developmental stage and the current capacities of technologies, our preliminary estimates suggest that conversion technologies would offset significantly less than 1% percent of annual North American oil consumption. The average size of a plastics‐to‐oil facility is in the range of 10‐30 tons per day. If there were 100 plastics‐to‐oil facilities in North America by 2015, conversion production could offset approximately 6,000‐18,000 barrels of oil per day, assuming 1 ton of plastic yields 6 barrels of oil. In contrast, total consumption of crude oil in North America is forecast to be 21.57 million barrels per day in 20155. While MSW‐based conversion facilities are anticipated to convert 7‐10 times more waste to energy, estimates still indicate significantly less than 1% percent of annual North American oil consumption.
5 http://www.researchandmarkets.com/research/96a49e/united_states_oil_and_gas_report_q1_2011

58
Section 6: Recommendations
6.1 Recommendations
Although “first‐generation” demonstration waste conversion facilities have been built and are currently operating in North American, RTI estimates it will be 5‐10 years before these facilities transition to commercial operations in North America. There are a number of proposed gasification and pyrolysis facilities in North America, but the exact number is unknown (up‐to‐date information on proposed developments was generally difficult to ascertain). Anecdotal evidence suggests that project viability may in part be affected by difficulties encountered in scale‐up of facilities from demonstration to commercial scale (especially MSW‐based plants), financial backing/economic conditions, and highly variable permitting classifications at local, state, and provincial levels.
Ultimately, the findings from this research show that pyrolysis and gasification technologies are designed to handle two very different types of waste feedstock. Pyrolysis technologies are generally designed to use only waste plastics; whereas gasification is generally designed to use bulk MSW. Both technologies have their benefits (and burdens). Decisions about their adoption will likely be made on a site or region basis and depend on characteristics such as waste composition, contracts for assuring steady waste feedstock supply, market prices for electricity and fuels, and distance to markets.
The economic sustainability of pyrolysis and gasification facilities will depend on the markets for energy and commodity petroleum products. Each facility will likely tailor its process to match local market conditions and contractual arrangements. For example, if the price of crude oil continues to increase, technologies that convert plastics and MSW to synthetic petroleum and/or liquid transportation fuels will be able to generate more revenue from the sale of products and become more cost competitive. Two of the plastics‐to‐oil vendors currently have off‐take agreements, indicating a growing economic viability.
Real‐world cost and environmental information for North America is difficult to obtain, due primarily to the current stage of technology development of conversion technologies in the U.S. As more commercial‐scale facilities are built and operating, it would be beneficial to reassess the cost and life cycle environmental aspects of conversion technologies as compared to competing waste management alternatives.
Additional research that could be done in the near term to advance the understanding of conversion technologies might include examining sensitivities and “break‐even” points relative to cost and environmental aspects for key parameters such as:
• Feedstock composition (e.g., high vs. low btu value feedstock) • Plant energy conversion efficiency • Recovery of byproduct materials for recycling (for MSW technologies) • Beneficial offsets for different end‐product alternatives

59
• Distance to market for liquid fuels • Market prices for energy products • Market prices for recyclable and other byproduct streams.
The future of these technologies will depend heavily on the success of first‐generation facilities, but some successes are already coming to fruition. Two facilities have off‐take agreements, and almost all of the surveyed vendors have recently received awards for innovation and/or clean energy solutions. Conversion technologies should be considered an emerging, viable option for managing non‐recycled plastics and MSW in the near future.

60
References FL DEP (Florida Department of Environmental Protection, Office of Permitting and Compliance),
2011. Emission Sources: NSR/PSD Construction Permits ‐ St. Lucie Plasma Gasification Facility, St. Lucie County, Florida. Available at: http://www.dep.state.fl.us/Air/emission/construction/geoplasma.htm
ICF International. 2009. A Life Cycle Assessment of Plasma Conversion at Trail Road Landfill in
Ottawa and Landfilling of Waste at the Halton Regional Landfill, Phase 1 Final Report. Prepared for Ontario Ministry of Environment. March.
RW Beck, 2010. Independent Engineer’s Report, Envion Plastic‐to‐Oil Technology. Prepared for
Envion. June. Plasco Energy Group, 2010. Semi‐Annual Report. January 22 – July 31, 2010. 141 RT 3388 Rev A.
Available at: http://www.zerowasteottawa.com/docs/141‐RT‐3388_RevA_Plasco%20Energy%20Group%20Demonstration%20Project%20Jan%202010%20‐%20July%202010%20Semi%20Annual%20Progress%20Report%20Plasco%20Trail%20Road%20FINAL.pdf
Plasco Energy Group, 2011. What Becomes of 1 Ton of Waste? February. The Pembina Institute, 2009. Life‐cycle Environmental Performance of Waste‐to‐Energy
Technologies: A Comparative Analysis for Plasco Energy. March. Prepared by: Matt McCulloch, P.Eng; Jeremy Moorhouse, E.I.T; Rich Wong, E.I.T.
U.S.DOE (Department of Energy). 2010. Construction and Operation of a Heterogeneous Feed
Biorefinery Enerkem Corporation Pontotoc, Mississippi. Report No.: EA‐1790: Final Environmental Assessment (2010/09) Available at: http://energy.gov/nepa/downloads/ea‐1790‐final‐environmental‐assessment
U.S.EIA (Energy Information Administration). 2009. Electric Power Monthly with data for August
2009. Report No.: DOE/EIA‐0226 (2009/11) Available at: http://www.eia.doe.gov/cneaf/electricity/epm/epm_sum.html
U.S.EPA (Environmental Protection Agency). 2008. Municipal Solid Waste Generation,
Recycling, and Disposal in the United States: Facts and Figures for 2008. Available at: http://www.epa.gov/waste/nonhaz/municipal/pubs/msw2008rpt.pdf
Environment and Industry Council (EPIC) Canadian Plastics Industry Association, 2004. The
Gasification of Residual Plastics Derived from Municipal Recycling Facilities. Available at: http://www.plastics.ca/articles_merge/gasification_pf.php

61
Appendix A: Conversion Technology Data

62
Table A1. Gasification Technology Data
Parameters Units
Information/data from Vendor Vendor's information/data available in the Literature
High Temperature Gasification High Temperature Gasification High Temperature Gasification With Plasma Arc
Syngas Cleaning Enerkem (Pontotoc) Ze-gen Plasco*
General Information
Location NA Pontotoc, MS (PROPOSED) Narragansett Bay, Massachusetts Ottawa, Ontario, Canada (ICF, 2009)
Years of Operation yr expected to open late 2011 expected to open 2012 Process Information
Cost per design capacity $/dtpd 499,109 Design capacity dtpd 75-150 147
Type of Feedstock (% compositions, if available) NA
post-MRF-sorted MSW, industrial waste, construction and demolition waste, treated
wood, bagasse, corn stover, wheat straw, rice hulls, wood chips, sawdust, bark, thinning,
limbs, needles
95% wood based material, consisting of railroad
crossties (90%), clean wood waste (5%), non-
recycled source-separated plastics (5%)
Paper and paperboard (24.3%), Plastics (16.2%), Metals (7.2%), Glass (6.1%), Rubber & Leather (3.3%), Textiles
(5.9%), Wood (7.4%), Food Scraps (18%), Yard Trimmings (7.3%), Miscellaneous Inorganic Waste (2.2%), Other (2%)
Feedstock preprocessing requirements NA Yes- MSW would be sorted, shredded and dried. Shredding and sorting done at waste
manager site.
Yes- MSW would be sorted, shredded and dried.
Shredding and sorting by contracted processor.
Yes-The first stage in the waste conversion process is thereclamation of metals from the waste stream for recycling. The remaining material is shredded to
facilitate consistent flow into the conversion chamber.
Inorganic matter content of feedstock <% <5 Moisture content of feedstock <% 15 <20 NR Efficiency of the electricity generating unit (ICE) % 85 Energy recovery efficiency % 48
Process Inputs and Outputs
Inpu
ts
Tonnage of feedstock (actual capacity) dtpd 3.E+02 1.E+02 [1] 1.E+02 [2] Power consumption / parasitic load KWh/dry ton 5.E+02 2.E+02
Other inputs (e.g., water, oxygen, etc.)
Oxygen lb/dry ton 1.E+03 Diesel for preprocessing gal/dry ton 5.E-02
Caustic for gas cleaning and cooling lb/dry ton 1.E+01 Activated Carbon for gas cleaning and cooling gal/dry ton 2.E-01
Feldspar for gas cleaning and cooling gal/dry ton 1.E-01 Water gal/dry ton 2.E+03 5.E+02
Supplemental fuel use Natural Gas lb/dry ton 2.E+01 2.E+03 [5] 9.E+01
Out
puts
**
Energy product (e.g., syngas, ethanol, hydrogen, electricity, steam)
Electricity KWh/dry ton 9.E+02 - 1.E+03 Syngas MMBtu/dry ton 9.E+01 [3] Steam MMBtu/dry ton 1.E+01
Ethanol lb/dry ton 560-615
Material Byproducts
Residual gas lb/dry ton 4.E+02 Sulphur lb/dry ton 3.E+00 - 3..E+00
Salt lb/dry ton 9.E+00 - 1.E+01 Slag lb/dry ton 2.E+01 - 4.E+02
Residuals (e.g., ash, char, slag, etc.)
Char lb/dry ton 3.E+02 Slag lb/dry ton 8.E+01
Gasifier solid residues lb/dry ton 1.E+02 3.E+01 Spent catalysts and chemicals lb/dry ton 3.E+00
Inorganic sludge lb/dry ton 4.E+01 Non-hazardous solid waste lb/dry ton 1.E+01
Potable water gal/dry ton 5.E+02 - 3.E+03 Water losses gal/dry ton 1.E+03 5.E+02 Air Emissions Data PM lb/dry ton 4.E-01 1.E-02 4.2.E-02 - 4.4.E-02 PM10 lb/dry ton 7.E-04 Biogenic Carbon Dioxide (CO2bio) lb/dry ton 5.E+02

63
Parameters Units
Information/data from Vendor Vendor's information/data available in the Literature
High Temperature Gasification High Temperature Gasification High Temperature Gasification With Plasma Arc
Syngas Cleaning Enerkem (Pontotoc) Ze-gen Plasco*
Fossil Carbon Dioxide (CO2fossil) lb/dry ton 4.E+02 3.E+02 1.E+03 Methane (CH4) lb/dry ton 2.E+00 2.E-04 HCl lb/dry ton 8.E-03 [4] 2.E-02 - 3.E-02 Hydrocarbons lb/dry ton Sulphur dioxide (SO2) lb/dry ton 2.E-01 4.E-01 1.E-01 - 2.E-01 Sulphur oxide lb/dry ton 5.E-05 Nitrous Oxide (N2O) lb/dry ton 4.E-01 7.E-04 NOx expressed as NO2 lb/dry ton 1.E+00 2.E-01 2.E-01 - 2.E-01 Carbon monoxide (CO) lb/dry ton 1.E+00 1.E-01 4..E-01 - 4.E-01 Mercury (Hg) lb/dry ton 3.E-06 [4] 6.E-07 Cadmium (Cd) lb/dry ton 5.E-07 [4] 8.E-06 Lead lb/dry ton 7.E-06 [4] 1.E-05 VOC lb/dry ton 9.E-01 4.E-02 HAP lb/dry ton 1.E-01 NH3 slip lb/dry ton Dioxins and furans lb/dry ton 0.E+00 H2S lb/dry ton NH3 lb/dry ton AS lb/dry ton AL lb/dry ton B lb/dry ton BA lb/dry ton BE lb/dry ton CR lb/dry ton CU lb/dry ton FE lb/dry ton MN lb/dry ton NI lb/dry ton SB lb/dry ton SE lb/dry ton SN lb/dry ton ZN lb/dry ton Acetaldehyde lb/dry ton 6.E-02 TNMOC lb/dry ton 2.E-01 - 2.E-01 Water Emissions Data Water Effluent gal/dry ton 600-1400 BOD lb/dry ton COD lb/dry ton PB lb/dry ton H2S lb/dry ton AS lb/dry ton AL lb/dry ton B lb/dry ton BA lb/dry ton BE lb/dry ton CD lb/dry ton CR lb/dry ton CU lb/dry ton FE lb/dry ton HG lb/dry ton MN lb/dry ton NI lb/dry ton SB lb/dry ton SE lb/dry ton SN lb/dry ton ZN lb/dry ton

64
Table A2. Pyrolysis Technology Data
Parameters Units Information/Data From Vendors Information/Data From Literature
Envion Agilyx Climax JBI H. Smart Veba BP
General Information Location NA Derwood, MD Tigard, OR Fairfax, SC Niagara Falls, NY Bottrop, Germany Years of Operation yr 1 reactor, 1.5 years Over 1 year
Process Information Cost per design capacity $/dry tons 280,699 250,000 29,350 Design capacity dtpd 29 20 20 53 641 Type of Feedstock (% compositions, if available) NA 100% plastic 100% plastic 2,4,5 for highest yield polyolefins
Feedstock preprocessing requirements NA feedstock is chipped to 1.5 inches or smaller industry standard
grinding/shredding shred or pre-melt Inorganic matter content of feedstock <% 100 100 100 <5% 4.5 Moisture content of feedstock <% 2 0-5 <10% Efficiency of the electricity generating unit (ICE) % N/A
Energy recovery efficiency % 30-80%, with 62-70% being bell curve high probability 82-85% see
comment 75 92% 80
Process Inputs and Outputs
Inpu
ts
Tonnage of feedstock (actual capacity) dtpd 3.E+01 1.E+01 20 Power consumption / parasitic load KWh/dry ton 5.E+02 3.E-01 2.E+02 3.E-02
Other inputs (e.g., water, oxygen, etc.)
Oxygen lb/dry ton N/A Catalysts and chemicals lb/dry ton trade secret 8.E-01
CaO lb/dry ton 1.E-04 Ammonia lb/dry ton 0.E+00 6.E-01
sand lb/dry ton 0.E+00 4.E-06
Hyrdrogen lb/dry ton 2
E-Gas lb/dry ton 22
HCl lb/dry ton 2
Water gal/dry ton 1.E+02 2.E+02 3.E+01 4.E+02
Supplemental fuel use Natural Gas MBtu/dry ton 3.E+01 4.E+00 Steam MBtu/dry ton 7.E-02
Syngas MMBtu/dry ton 2.E-01
synthetic crude oil mmBtu/dry ton 3.7.E+01 3.9.E+01 3.E+01 2.E+02
light fraction (liquid) lb/dry ton 300-400 3.E-02 1.E-04 gas fraction lb/dry ton 200-500 7.E-05
diesel lb/dry ton 1.7.E+03 1.5.E+03 Gasoline lb/dry ton 2.3.E+01 2.0.E+01
CaCl2 lb/dry ton 2.E+00
Residuals (e.g., ash, char, slag, etc.)
Char lb/dry ton 2.E+02 1.E+02 Solid residues lb/dry ton 2.E+02
Spent catalysts and chemicals lb/dry ton trade secret 6.E+01
Inorganic sludge lb/dry ton 3.E+02 n/a Spent SCR catalyst 2.E-01
Non-hazardous solid waste lb/dry ton 5 1.E-02 2.E+01
Residue to incineration lb/dry ton 2.E+00 waxy filter to incineration lb/dry ton 3.E-05
Water losses gal/dry ton 3.E+01 4.E+02 Air Emissions Data PM lb/dry ton negligible 2.E+01 4.E-02 PM10 lb/dry ton Fossil Carbon Dioxide (CO2fossil) lb/dry ton 1.E+03 5.E+02 0.E+00 CO2 lb/dry ton 7.38-18.45 0.E+00 9.E+02 Methane (CH4) lb/dry ton 26-65 0.E+00

65
Parameters Units Information/Data From Vendors Information/Data From Literature
Envion Agilyx Climax JBI H. Smart Veba BP
HCl lb/dry ton 3.E-04 Hydrocarbons lb/dry ton 8.E+00 1.E-02 4.E+00 Sulphur dioxide (SO2) lb/dry ton 0.E+00 1.E-06 Sulphur oxide lb/dry ton TBD (minimal) 0.E+00 Nitrous Oxide (N2O) lb/dry ton TBD (minimal) 2.E+00 NOx expressed as NO2 lb/dry ton 36.2-90.5 2.E+00 TBD (minimal) 3.E-01 2.E-01 2.E-07 Carbon monoxide (CO) lb/dry ton 3.58-8.95 1.E+00 TBD (minimal) 0.E+00 6.E-01 Mercury (Hg) lb/dry ton 0.E+00 Cadmium (Cd) lb/dry ton Lead lb/dry ton 2.E-04 2.E-02 VOC lb/dry ton Negligible 2.E+00 TBD (minimal) 3.E-04 2.E-01 HAP lb/dry ton NH3 slip lb/dry ton 0.E+00 Dioxins and furans lb/dry ton 0.E+00 H2S lb/dry ton 0.E+00 NH3 lb/dry ton 0.E+00 1.E-02 AS lb/dry ton 0.E+00 AL lb/dry ton 0.E+00 B lb/dry ton 0.E+00 BA lb/dry ton 0.E+00 BE lb/dry ton 0.E+00 CR lb/dry ton 0.E+00 CU lb/dry ton 0.E+00 FE lb/dry ton 0.E+00 MN lb/dry ton 0.E+00 NI lb/dry ton 0.E+00 SB lb/dry ton 0.E+00 SE lb/dry ton 0.E+00 SN lb/dry ton 0.E+00 ZN lb/dry ton 0.E+00 Acetaldehyde lb/dry ton 0.E+00 TNMOC lb/dry ton 0.E+00 Water Emissions Data Water Effluent gal/dry ton BOD lb/dry ton COD lb/dry ton PB lb/dry ton H2S lb/dry ton AS lb/dry ton AL lb/dry ton B lb/dry ton BA lb/dry ton BE lb/dry ton CD lb/dry ton CR lb/dry ton CU lb/dry ton FE lb/dry ton HG lb/dry ton MN lb/dry ton NI lb/dry ton SB lb/dry ton SE lb/dry ton SN lb/dry ton ZN lb/dry ton