
Comparison of Effectiveness of Base Isolation System Using ...

Brodogradnja/Shipbuilding/Open access Volume 70 Number 3, 2019
61
Nader R. Ammar
http://dx.doi.org/10.21278/brod70304 ISSN 0007-215X
eISSN 1845-5859
ENVIRONMENTAL AND COST-EFFECTIVENESS COMPARISON OF
DUAL FUEL PROPULSION OPTIONS FOR EMISSIONS REDUCTION
ONBOARD LNG CARRIERS
UDC 629.542:629.5.016
Review paper
Summary
The selection of the suitable propulsion system for LNG carrier highly affects the ship
capital and life cycle costs. The current paper compares between the available propulsion
systems for LNG carriers from environmental and economic points of view operated with
heavy fuel oil (HFO) and marine gas oil (MGO). In addition, the cost-effectiveness for
emission reduction due to using dual fuel propulsion options using natural gas fuel (NG) is
calculated. As a case study, large conventional LNG carrier class has been investigated. The
results show that steam turbine (ST), Ultra-ST, dual fuel diesel engine (DFDE), and combined
gas and steam (COGAS) propulsion options can comply with NOx and SOx emissions
regulations set by IMO using dual fuel mode with NG percentages of 87.5%, 82%, 98.5% and
94%, respectively. DFDE operated with pilot HFO and NG is the most economic propulsion
option. It reduces the dual fuel costs by 1.37 MUS$/trip compared with HFO cost. The annual
cost-effectiveness for the most economic and emission compliance propulsion option is 6.07
$/kg, 6.39 $/kg, and 0.55 $/kg for reducing NOx, SOx, and CO2 emissions, respectively.
Key words: LNG carriers; Propulsion options; Boil-off gas; Environmental and
economic analysis; EEDI; Fuel saving cost-effectiveness
1. Introduction
The demand on natural gas supply has been increased in the last years to reduce the
exhaust gas emissions especially the greenhouse gas [1, 2]. Because of these demands,
liquefied natural gas (LNG) market is increasing with the increased number of LNG vessels
[3-5]. LNG reduces the gas volume by 600 times using deep cooling of −163 °C at a pressure
slightly higher than the atmospheric pressure [6, 7]. Boil-off gas (BOG) is one of the main
characteristics of the LNG tanks [8]. Therefore, the selection of the LNG carrier propulsion
system is constrained by LNG properties and different economic and environmental factors
[9]. There is no standard marine power plant for LNG ships [10]. Different propulsion
systems are installed onboard varying from turbines to internal combustion engines.
LNG carriers are designed according to the gas code regulations of the international
maritime organization (IMO). The gas tanks are built using “cargo containment system”.
Nader R. Ammar Environmental and cost-effectiveness comparison of dual fuel propulsion
options for emissions reduction onboard LNG carriers
62
They are arranged as spherical (moss), membrane, or prismatic type tanks [11]. BOG occurs
in these tanks due to the heat transfer from the surrounding environment which results in
evaporation of the liquefied gases. This evaporation rate is increased during cargo
transportation [12-14].
On the other hand, the application of natural gas in marine engines depends on its
properties. Natural gas is lighter than air, and in the case of leakage it disperses to the
atmosphere. Evaporation process of the LNG makes it easy to float away unlike other liquid
fuels which remain near the engine and the bilge. The flammability of NG is only possible
within a tight mixture with air ranging (5%: 15 %). The properties of NG and conventional
marine fuel oil are summarized in Table 1 [15-17].
Table 1 Comparison between NG and marine fuel oil properties
2. Propulsion options for LNG carriers
The type and the classification of LNG propulsion system are highly affected by the
generation of the BOG and the emission regulations set by the IMO [12]. Steam turbine (ST)
based propulsion system was the first system to be used for LNG carriers since 1960 [18]. It is
allowed for burning the used fuel together with the generated BOG during transportation. In
2003, internal combustion engines replaced the ST, due to the improvement in their
performance and efficiency. In addition, the dual fuel diesel engine (DFDE) permits the
burning of the BOG with the heavy fuel oil [19]. DFDE was started in 4-stroke engine, since
2003. At present, 2-stroke engines can also use NG as a fuel. This can lead to a dramatically
change in the LNG propulsion system [14]. The main propulsion systems used in LNG
carriers are steam turbine, DFDE, slow speed diesel engine, and gas turbine in combined
cycle.
2.1 Steam turbine propulsion (ST)
Steam turbine is the first propulsion system used for LNG carriers because of the boiler
flexibility to burn the natural BOG from the cargo. This propulsion system normally consists
of two boilers each produces steam with a rate of 80-90 ton/hr at 60-70 bar and 520 oC [20].
The total power of the plant is 35-45 MW produced through high, intermediate, and low
pressure turbines. For speed reversal, the low pressure turbine incorporates a stern turbine on
the same rotor shaft. The electric power demand onboard is supplied by two steam turbines
generators and one medium-speed diesel generator. The estimated overall thermal efficiency
of 30 MW conventional steam power plant powered by Mitsubishi is 35% [21]. In order to
improve the thermal efficiency of the steam power plant, reheating of the high pressure steam
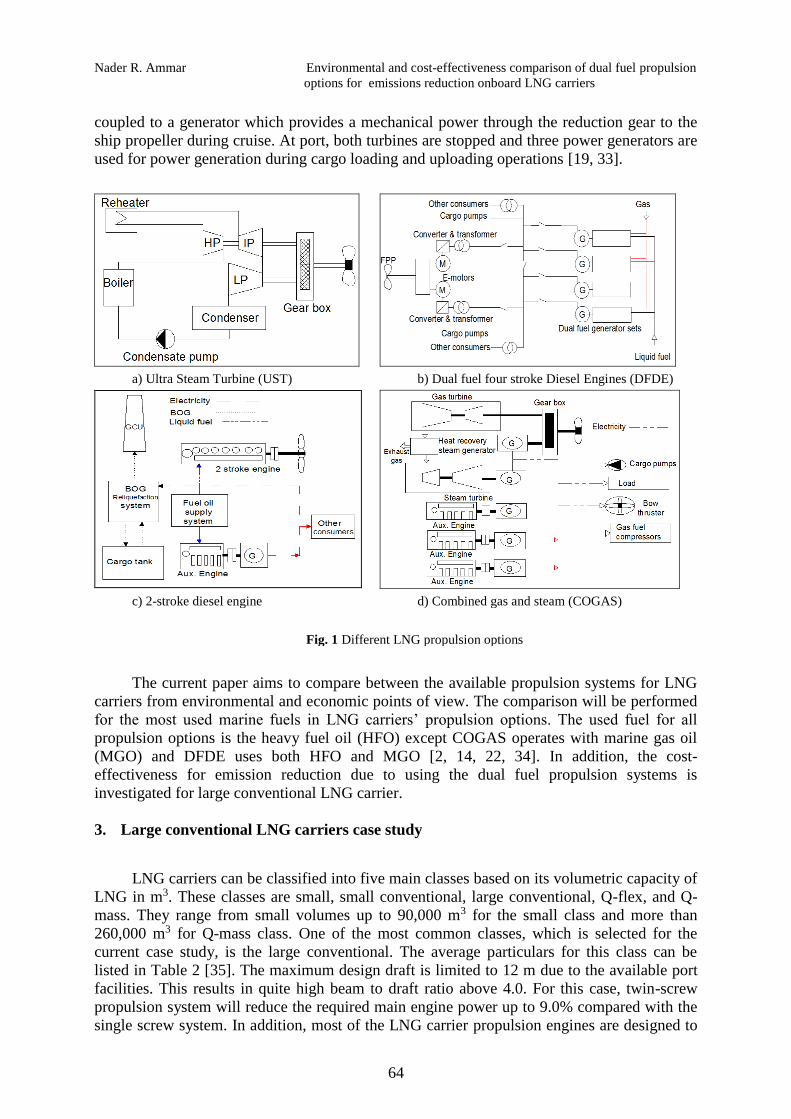
turbine is incorporated [14, 22]. This improved cycle is called Ultra Steam Turbine (UST) as
shown in Fig. 1a. The modified cycle saves 15% of the fuel consumption compared with the
conventional steam power plant with an overall fuel efficiency of 41%. This can be
Property Marine fuel oil Natural gas
Ignition temperature, °C 250 600
Density, kg/m3@ 1 bar 850 0.74
LCV, MJ/kg 42 50
Carbon contents (%) 84.7 70
Hydrogen contents (%) 12 20
Environmental and cost-effectiveness comparison of dual fuel propulsion Nader R. Ammar
options for emissions reduction onboard LNG carriers
63
considered as a competitive to the DFDE power plant from fuel consumption point of view
[23-25].
2.2 Dual fuel diesel engine (DFDE)
Medium speed diesel engines can be considered as an alternative to the conventional
steam turbines with low fuel efficiency. They can burn both the liquid and gas fuels in the
dual fuel mode. The BOG is used in the gas mode operation with lean air to fuel ratio on the
principle of the Otto cycle with pilot diesel fuel injection in the cylinder for ignition. The
engine is operated using a completely liquid fuel, marine diesel oil (MDO) or heavy fuel oil
(HFO), when the amount of the BOG is insufficient. In this case, the BOG is burned in the
gas combustion unit (GCU) with the disadvantage of the energy loss. This loss associated
with the losses of the electrical components of the used propulsion system can be ranged from
6% to 8%, when comparing DFDE with other marine power plants. Fig. 1b shows the DFDE
propulsion plant for an LNG carrier. This system uses electric propulsion where the electrical
power for both the propulsion and the cargo handling are in altered operating time phase
which reduces the net power requirement compared with the mechanical propulsion plant. On
the other hand, this propulsion system requires a complex control system especially air to fuel
ratio controller [2, 26].
2.3 Slow speed diesel engine (SSDE)
Slow speed diesel engines are used for LNG carrier propulsion especially for large
capacities over 200,000 m3 and the long distance tradeoff ships. It is the most efficient
propulsion engine used onboard ships, at the moment. The main advantages of slow speed
diesel engine are the high efficiency, low maintenance and operating costs, and the possibility
of burning low-quality cheap fuels [27]. This propulsion system uses both the gas combustion
unit (GCU) and the reliquefaction plant for the naturally generated BOG as shown in Fig. 1c.
The reliquefaction plant converts the generated BOG into a liquid and this reduces any loss in
the transported cargo. In case of any breakdown in this system or during any maintenance
procedures, the GCU is used to burn the BOG to avoid any damage in the LNG tanks because
of the increase in the storage pressure [14]. The auxiliary and electric powers in this
propulsion system are provided using 4-stroke diesel generators. In case of twin screw
propellers, shaft disconnecting devices are used in each shaft line to immediately disconnect
the failed engine from the propulsion shaft line and continue the ship voyage [28, 29].
2.4 Gas Turbines in combined cycle (COGAS)
The combined cycle is an unusual propulsion system for LNG carriers, because it does
not provide a good flexibility especially for auxiliary power generators. Although gas turbines
(GT) have many advantages such as good reliability, high power to weight ratio, compact
size, and quick response to power demand, ship owners do not prefer using it because of the
low fuel efficiency. Most of the applications of the gas turbines in the marine field are used in
their combined cycle especially for naval and offshore industry [30-32]. Fig. 1d shows a
combined gas and steam turbines (COGAS) propulsion power arrangement for LNG carrier.
The gas turbine provides the propulsion torque after using a reduction gear. The exhaust gas
boiler is operated using the heat lost in the exhaust gases generated from the gas turbine. It is
Nader R. Ammar Environmental and cost-effectiveness comparison of dual fuel propulsion
options for emissions reduction onboard LNG carriers
64
coupled to a generator which provides a mechanical power through the reduction gear to the
ship propeller during cruise. At port, both turbines are stopped and three power generators are
used for power generation during cargo loading and uploading operations [19, 33].
a) Ultra Steam Turbine (UST) b) Dual fuel four stroke Diesel Engines (DFDE)
c) 2-stroke diesel engine d) Combined gas and steam (COGAS)
Fig. 1 Different LNG propulsion options
The current paper aims to compare between the available propulsion systems for LNG
carriers from environmental and economic points of view. The comparison will be performed
for the most used marine fuels in LNG carriers’ propulsion options. The used fuel for all
propulsion options is the heavy fuel oil (HFO) except COGAS operates with marine gas oil
(MGO) and DFDE uses both HFO and MGO [2, 14, 22, 34]. In addition, the cost-
effectiveness for emission reduction due to using the dual fuel propulsion systems is
investigated for large conventional LNG carrier.
3. Large conventional LNG carriers case study
LNG carriers can be classified into five main classes based on its volumetric capacity of
LNG in m3. These classes are small, small conventional, large conventional, Q-flex, and Q-
mass. They range from small volumes up to 90,000 m3 for the small class and more than
260,000 m3 for Q-mass class. One of the most common classes, which is selected for the
current case study, is the large conventional. The average particulars for this class can be
listed in Table 2 [35]. The maximum design draft is limited to 12 m due to the available port
facilities. This results in quite high beam to draft ratio above 4.0. For this case, twin-screw
propulsion system will reduce the required main engine power up to 9.0% compared with the
single screw system. In addition, most of the LNG carrier propulsion engines are designed to
Environmental and cost-effectiveness comparison of dual fuel propulsion Nader R. Ammar
options for emissions reduction onboard LNG carriers
65
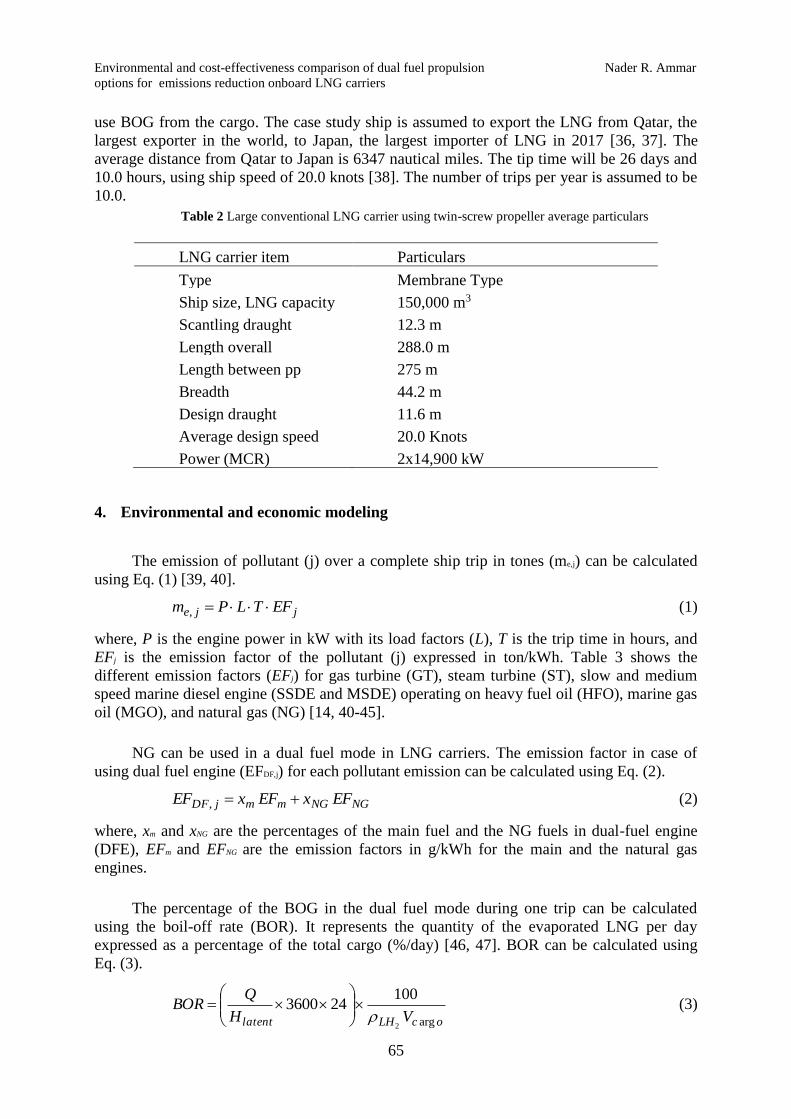
use BOG from the cargo. The case study ship is assumed to export the LNG from Qatar, the
largest exporter in the world, to Japan, the largest importer of LNG in 2017 [36, 37]. The
average distance from Qatar to Japan is 6347 nautical miles. The tip time will be 26 days and
10.0 hours, using ship speed of 20.0 knots [38]. The number of trips per year is assumed to be
10.0.
Table 2 Large conventional LNG carrier using twin-screw propeller average particulars
LNG carrier item Particulars
Type Membrane Type
Ship size, LNG capacity 150,000 m3
Scantling draught 12.3 m
Length overall 288.0 m
Length between pp 275 m
Breadth 44.2 m
Design draught 11.6 m
Average design speed 20.0 Knots
Power (MCR) 2x14,900 kW
4. Environmental and economic modeling
The emission of pollutant (j) over a complete ship trip in tones (me,j) can be calculated
using Eq. (1) [39, 40].
jje EFTLPm =, (1)
where, P is the engine power in kW with its load factors (L), T is the trip time in hours, and
EFj is the emission factor of the pollutant (j) expressed in ton/kWh. Table 3 shows the
different emission factors (EFj) for gas turbine (GT), steam turbine (ST), slow and medium
speed marine diesel engine (SSDE and MSDE) operating on heavy fuel oil (HFO), marine gas
oil (MGO), and natural gas (NG) [14, 40-45].
NG can be used in a dual fuel mode in LNG carriers. The emission factor in case of
using dual fuel engine (EFDF,j) for each pollutant emission can be calculated using Eq. (2).
NGNGmmjDF EFxEFxEF +=, (2)
where, xm and xNG are the percentages of the main fuel and the NG fuels in dual-fuel engine
(DFE), EFm and EFNG are the emission factors in g/kWh for the main and the natural gas
engines.
The percentage of the BOG in the dual fuel mode during one trip can be calculated
using the boil-off rate (BOR). It represents the quantity of the evaporated LNG per day
expressed as a percentage of the total cargo (%/day) [46, 47]. BOR can be calculated using
Eq. (3).
ocLHlatent VH
QBOR
arg2
100243600
= (3)

Nader R. Ammar Environmental and cost-effectiveness comparison of dual fuel propulsion
options for emissions reduction onboard LNG carriers
66
where, Q is the heat exchange in LNG tanks in kW , ρ is the density of LNG in kg/m3, and
Hlatent is the heat of vaporization in kJ/kg. The average BOR values for new LNG tankers
range from 0.10 to 0.15% /day for loaded voyage and from 0.06 to 0.10 %/day for ballast
voyage [48-50].
Table 3 Emission factors for different LNG propulsion options in g/kWh
Engine type Fuel used Emission factors (g/kWh)
NOx SOx CO2
SSDE HFO (2.7%S) 17 12.9 550
MSDE
HFO (2.7%S) 14.00 11.24 677.91
MGO (0.1%S ) 13.20 0.40 646.08
NG 2.16 0.0 548.2
COGAS MGO (0.1%S ) 14 0.0 590
NG 0.9 0.0 510
ST HFO (2.7% S) 11.0 1.0 930
NG 0.4 0.0 241
UST HFO (2.7% S) 8.25 0.75 697.5
NG 0.3 0.0 180.75
The emission factors for LNG ship should be compared with the required IMO emission
rates for NOx, SOx and CO2. For NOx emissions, the emission limit equations, expressed in
g/kWh, of the applicable Tier III values, only for NECA (NOx Emission control areas ), based
on the rated engine speeds in rpm are shown in Eq. (4) [28, 40, 44, 51-53].
= −
20000.2
20001309
1304.3
2.0,
rpmfor
rpmforrpm
rpmfor
NO IIITierx (4)
SOx emissions are limited by the sulfur percent in the used marine fuel. For 2020 IMO
SOx regulations, the permitted sulfur percent in the fuels is 0.5% [40, 51, 54-56]. On the other
hand, greenhouse gas (GHG) emissions especially CO2 emissions are limited by IMO through
introducing Energy Efficiency Design Index (EEDI) and Energy Efficiency Operational
Indicator (EEOI) [57]. The calculated EEDI should be compared with the reference values
for EEDI in three phases according to the ship type. For LNG ship, the reference and the
calculated values for the EEDI are based on the ship deadweight (DWT) as expressed in Eqs.
(5) and (6) [46, 47, 58-62].
474.0. 7.2253 DWTEEDI ref = (5)
( )
( )DWTVf
SFCCSFCCP
DWTVf
SFCCSFCCPEEDI
refc
fuelAEfuelFpilotAEpilotFAE
refc
fuelMEfuelFpilotMEpilotFMEcal
++
+=
,,,,
,,,,.
(6)
Environmental and cost-effectiveness comparison of dual fuel propulsion Nader R. Ammar
options for emissions reduction onboard LNG carriers
67
where, PME is the is the main engine power, it can be calculated using Eq. (7). PAE is the
auxiliary power required to operate the accommodation of crew and the main engine, Vref is
the reference ship speed in knots, CF is the fuel conversion factor to CO2 emissions. IF LNG
carrier uses reliquefaction plant, PAE will include PAE,Reliq for the EEDI calculation, COPReliq. and
COPcooling are the coefficients of performance for the reliquefaction and cooling plants,
respectively as expressed in Eqs. (8) - (10) [47, 63, 64].
MCRPME = 75.0 (7)
.Re,250025.0 liqAEAE PMCRP ++= (8)
.Rearg.Re, liqocliqAE COPBORVP = (9)
cooling
latentLHliq
COP
HCOP
=
360024
2
.Re
(10)
The cubic capacity correction factor (fc), used in Eq. (6), equals 1.0 except for direct-
diesel-driven LNG carrier. It can be calculated using Eq. (11), where R is the ship deadweight
divided by the cargo capacity.
56.0−= Rfc (11)
From economic point of view, the annual cost for installation each propulsion system
(AC) depends on the capital cost value (CC), the average expected working years (n), and the
interest rate (i) [65]. AC can be calculated using Eq. (12).
( )
( ) 11
1
−+
+=
n
n
i
iiCCAC (12)
In addition, the annual fuel saving cost due to using NG (FSNG) in dual fuel mode
onboard LNG carrier can be calculated using Eq. (13).
( ) ( )nDFDONG PICCFS −= 1 (13)
where, CDO and CDF are the diesel fuel and the dual-fuel costs, respectively. (PI) is the annual
fuel price change percent over the working years (n) of the ship life cycle.
Finally, the annual cost-effectiveness of each propulsion system (ACE) for reducing a
pollutant emission (j) after using dual fuel engine can be calculated using Eq. 14 [40, 42].
jj
ER
OCACACE
+= (14)
where, OC is the operating and maintenance costs for the propulsion system in $/year. ERj is
the annual emission reduction in (j) after using dual fuel engine expressed in ton/year.
5. Results and discussion
In this section, the environmental results for different LNG carrier propulsion options
using HFO and MGO are discussed. In addition, the economic and cost-effectiveness analysis
for the dual fuel operated propulsion options, using NG, are calculated.

Nader R. Ammar Environmental and cost-effectiveness comparison of dual fuel propulsion
options for emissions reduction onboard LNG carriers
68
5.1 Environmental results
Fuel efficiency not only affects the operating costs of the marine propulsion power plant
but also extremely influence the emitted exhaust gas emissions. Although the efficiency of
steam power plant is lower than internal combustion engines, UST with reheating has
improved the efficiency of the steam cycle to a comparative level. Typical efficiencies of
157,000 m3 LNG carrier using ST, UST, SSDE with reliquefaction plant, dual fuel MSDE,
and COGAS power plants are 35%, 41%, 40%, 42%, and 50%, respectively [2, 29, 66]. UST
emission factors are reduced by 25% compared with the simple GT cycle [14]. LNG carrier
propulsion systems can fulfill the required levels of NOx and SOx emission levels set by IMO
depending on the used plant and the fuel type. Fig. 2 shows the relative NOx and SOx
emissions from the five most used marine power plants for LNG carriers using HFO and
MGO. Any observed power plant satisfies IMO standards (for both SOx and NOx) if the
relative emissions are 100% or lower. In order to calculated the emission levels set by IMO,
the average rpm for ST, SSDS, DFDE, GT is assumed to be 3500 rpm, 85 rpm, 750 rpm, and
3600 rpm, respectively [67-69]. It can be noted from Fig. 2 that all power plants could comply
with IMO-SOx emission levels using MGO. In contrast, all power plants cannot achieve these
levels using HFO. On the other hand, all power plants cannot fulfill the required IMO-NOx
emission levels.
Fig. 2 NOx and SOx emissions comparison using HFO and MGO
Due to the strict IMO regulations that limit the exhaust gas emissions from ships, it is an
important factor to consider using the BOG as a secondary fuel in LNG carriers during the
design process. This will help in reducing the exhaust gas emissions. From section 2, SSDE
propulsion option use BOG either in a reliquefaction plant or in GCU. Thus, it is not included
in the dual fuel mode. Fig. 3 shows NOx and SOx emissions from LNG propulsion plants
using HFO and MDO in dual fuel mode using BOR of 0.15%/day for the loaded voyage [48-
50]. The share percentages of these BOG in LNG propulsion fuel is calculated based on the
fact that each cubic meter of diesel oil consumption is equivalent for 1197 m3 of NG [44]. In
addition, the volume of NG is reduced by 600 times when converted to the liquid state [40,
70]. The percentages of BOG in dual fuel mode range from 55.47% to 79.49% using ST and
COGAS, respectively for the case study. Using BOG, both NOx and SOx emission rates
cannot be complied with IMO regulations, using different LNG propulsion options, as shown
in Fig. 3.

Environmental and cost-effectiveness comparison of dual fuel propulsion Nader R. Ammar
options for emissions reduction onboard LNG carriers
69
Fig. 3 NOx and SOx emissions comparison using the main-engine fuel and BOR of 0.15%/day
From Fig. 3, NG percent can be increased in the dual fuel mode to reduce the exhaust
gas emissions to the accepted rates set by IMO for NOx and SOx emissions. The minimum
NG percentages in dual fuel mode for the different propulsion options are 87.5%, 82%, 98.5%
and 94% to achieve the required IMO values for NOx and SOx emissions using ST, UST,
DFDE, and COGAS, respectively as shown in Fig. 4. The shares of BOG in these percentages
are 55.47%, 65.0%, 66.67%, and 79.49%, respectively. Moreover, using dual fuel will reduce
CO2 emissions because of the reduced carbon content in NG compared with liquid marine
fuels. Fig. 4 shows the relative CO2 emissions of different LNG carrier propulsion systems
using dual fuel propulsion systems with the accepted NOx and SOx emission levels set by
IMO. CO2 emissions from ships are one of the major concerns of the IMO due to its bad
influence on the global warming. The highest and the lowest CO2 emission reduction
percentages are achieved by the ST and the COGAS with percentages of 64.83% and 12.75%,
respectively. These reductions in CO2 emissions will improve the energy efficiency of the
ship through calculating EEDI and EODI [62].
Fig. 4 CO2 emissions comparison for different LNG propulsion options
CO2 emissions presented in Fig. 4 have to be complied with the required IMO
regulations. In addition, the newly built LNG carriers should be designed to be energy
efficient to reduce carbon dioxide emissions through calculating the energy efficiency design
index (EEDI). It depends on the type of the ship, the main and auxiliary engines, the
construction, and the used fuel. It calculates the amount of CO2 emissions per unit distance of
cargo transportation. Fig. 5 shows the permitted CO2 emissions set by IMO in gCO2/ton-NM
(Required EEDI). The values of the EEDI for LNG carriers depend on the ship deadweight
presented in three phases according to the ship built year. The base line values will be reduced
Nader R. Ammar Environmental and cost-effectiveness comparison of dual fuel propulsion
options for emissions reduction onboard LNG carriers
70
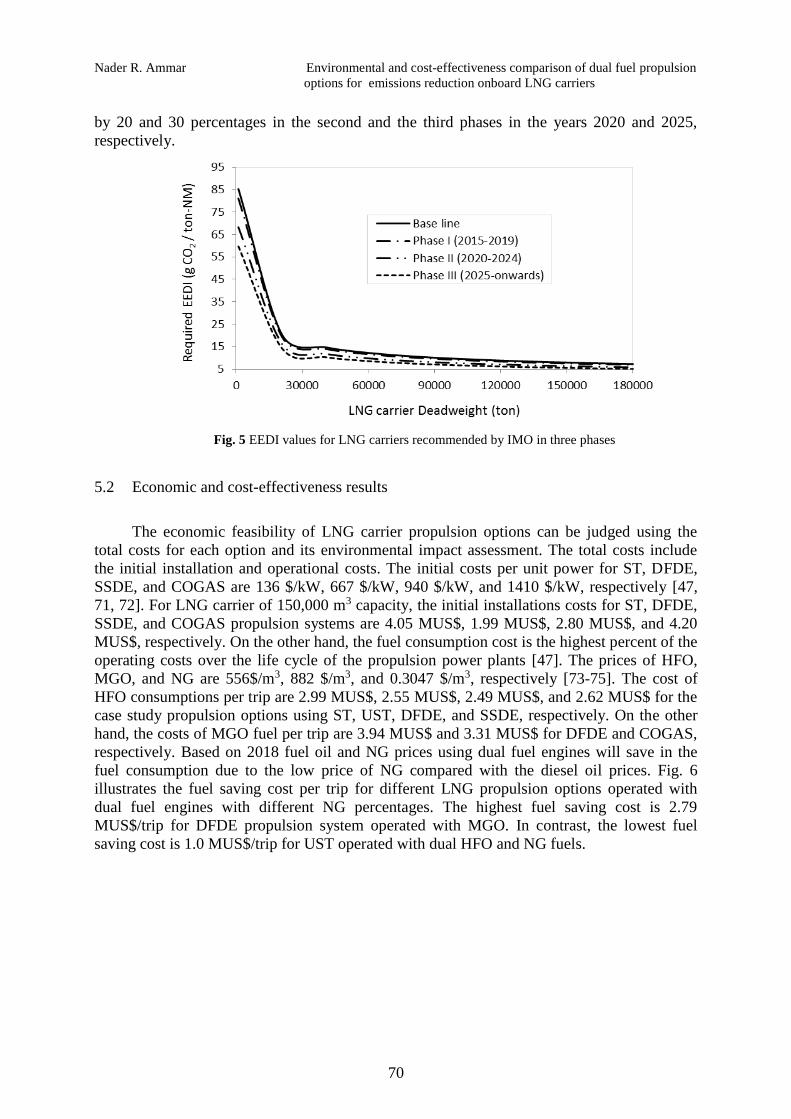
by 20 and 30 percentages in the second and the third phases in the years 2020 and 2025,
respectively.
Fig. 5 EEDI values for LNG carriers recommended by IMO in three phases
5.2 Economic and cost-effectiveness results
The economic feasibility of LNG carrier propulsion options can be judged using the
total costs for each option and its environmental impact assessment. The total costs include
the initial installation and operational costs. The initial costs per unit power for ST, DFDE,
SSDE, and COGAS are 136 $/kW, 667 $/kW, 940 $/kW, and 1410 $/kW, respectively [47,
71, 72]. For LNG carrier of 150,000 m3 capacity, the initial installations costs for ST, DFDE,
SSDE, and COGAS propulsion systems are 4.05 MUS$, 1.99 MUS$, 2.80 MUS$, and 4.20
MUS$, respectively. On the other hand, the fuel consumption cost is the highest percent of the
operating costs over the life cycle of the propulsion power plants [47]. The prices of HFO,
MGO, and NG are 556$/m3, 882 $/m3, and 0.3047 $/m3, respectively [73-75]. The cost of
HFO consumptions per trip are 2.99 MUS$, 2.55 MUS$, 2.49 MUS$, and 2.62 MUS$ for the
case study propulsion options using ST, UST, DFDE, and SSDE, respectively. On the other
hand, the costs of MGO fuel per trip are 3.94 MUS$ and 3.31 MUS$ for DFDE and COGAS,
respectively. Based on 2018 fuel oil and NG prices using dual fuel engines will save in the
fuel consumption due to the low price of NG compared with the diesel oil prices. Fig. 6
illustrates the fuel saving cost per trip for different LNG propulsion options operated with
dual fuel engines with different NG percentages. The highest fuel saving cost is 2.79
MUS$/trip for DFDE propulsion system operated with MGO. In contrast, the lowest fuel
saving cost is 1.0 MUS$/trip for UST operated with dual HFO and NG fuels.

Environmental and cost-effectiveness comparison of dual fuel propulsion Nader R. Ammar
options for emissions reduction onboard LNG carriers
71
Fig. 6 Fuel saving cost per trip using dual fuel propulsion options for LNG carrier
The economic assessment for LNG carrier propulsion options complied with IMO
regulations using dual fuel mode can be evaluated using the total annual costs for each option.
Fig. 7 shows the total annual costs and emission reduction percentages for ST, UST, DFDE,
and COGAS propulsion options operated in dual fuel mode. The total annual costs for ST,
UST, and DFDE, propulsion options operated with HFO-NG dual fuel are 15.05 MUS$,
15.90 MUS$, and 13.38 MUS$, respectively. The reduction percentages in NOx emissions for
these options compared with the HFO operated engines are 84.32%, 79.02%, and 83.3%,
respectively. For SOx emissions, the reduction percentages will be 87.5%, 82%, 98.5%,
respectively. On the other hand, the total annual costs for MGO-NG dual fuel operated
COGAS propulsion system is 17.38 MUS$ with zero SOx emissions and 87.96% NOx
emission reduction percent.
Fig. 7 Total annual costs and emission reduction percentages for dual-fuel propulsion options
From Fig. 7, DFDE operated with dual HFO and NG is the most economic and emission
compliance propulsion option for large conventional LNG carrier. The annual costs for capital
Nader R. Ammar Environmental and cost-effectiveness comparison of dual fuel propulsion
options for emissions reduction onboard LNG carriers
72
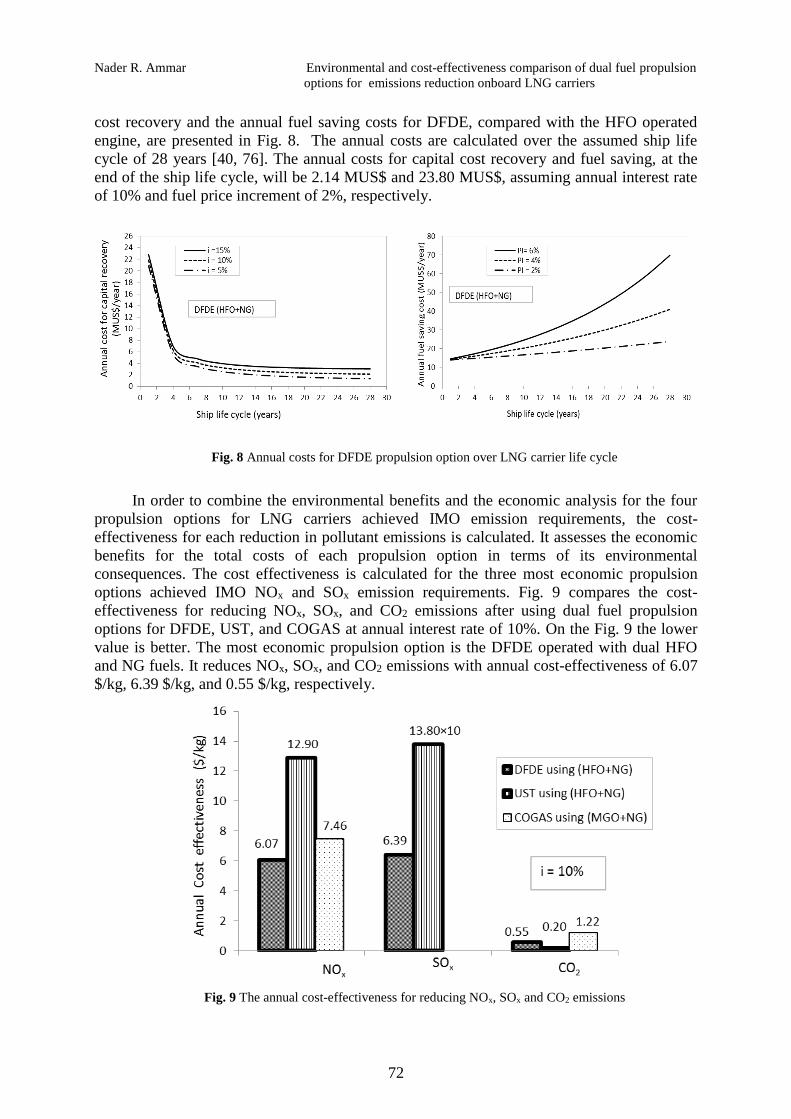
cost recovery and the annual fuel saving costs for DFDE, compared with the HFO operated
engine, are presented in Fig. 8. The annual costs are calculated over the assumed ship life
cycle of 28 years [40, 76]. The annual costs for capital cost recovery and fuel saving, at the
end of the ship life cycle, will be 2.14 MUS$ and 23.80 MUS$, assuming annual interest rate
of 10% and fuel price increment of 2%, respectively.
Fig. 8 Annual costs for DFDE propulsion option over LNG carrier life cycle
In order to combine the environmental benefits and the economic analysis for the four
propulsion options for LNG carriers achieved IMO emission requirements, the cost-
effectiveness for each reduction in pollutant emissions is calculated. It assesses the economic
benefits for the total costs of each propulsion option in terms of its environmental
consequences. The cost effectiveness is calculated for the three most economic propulsion
options achieved IMO NOx and SOx emission requirements. Fig. 9 compares the cost-
effectiveness for reducing NOx, SOx, and CO2 emissions after using dual fuel propulsion
options for DFDE, UST, and COGAS at annual interest rate of 10%. On the Fig. 9 the lower
value is better. The most economic propulsion option is the DFDE operated with dual HFO
and NG fuels. It reduces NOx, SOx, and CO2 emissions with annual cost-effectiveness of 6.07
$/kg, 6.39 $/kg, and 0.55 $/kg, respectively.
Fig. 9 The annual cost-effectiveness for reducing NOx, SOx and CO2 emissions

Environmental and cost-effectiveness comparison of dual fuel propulsion Nader R. Ammar
options for emissions reduction onboard LNG carriers
73
6. Conclusions
Environmental, economic and cost-effectiveness analysis for the available LNG carrier
propulsion options operated with heavy fuel oil (HFO), marine gas oil (MGO), and dual fuel
(with natural gas) were investigated. These options include steam turbine (ST), ultra steam
turbine (UST), dual fuel diesel engine (DFDE), slow speed diesel engine (SSDE), and
combined gas and steam (COGAS) propulsion systems. The used fuel for all the propulsion
options is the HFO except COGAS operates with MGO and DFDE uses both HFO and MGO.
The main conclusions for large conventional LNG carrier with a capacity of 150,000 m3 are:
• From environmental point of view, ST, UST, DFDE, and COGAS propulsion options
can fulfill the required IMO values for NOx and SOx emissions using NG percentages
in dual fuel mode with percentages of 87.5%, 82%, 98.5% and 94%, respectively. The
shares of boil off gas (BOG) in these percentages are 55.47%, 65.0%, 66.67%, and
79.49%, respectively. The highest CO2 emission reduction percent is achieved by the
UST with a reduction percent of 64.83% from the same cycle without NG.
• From economic point of view, Using BOG as fuel will save the cost of fuel
consumption by 19.08%, 22.35%, 22.9% and 46.62% for ST, UST, DFDE and
COGAS propulsion options, respectively. Increasing NG percentages to achieve the
NOx and the SOx emission rates set by IMO for ST, UST, and COGAS propulsion
options will save the dual fuel cost by 1.53 MUS$/year, 1.0 MUS$/year, and 2.02
MUS$/year, respectively. On the other hand, DFDE operated with dual HFO and NG
is the most economic propulsion option with total annual costs of 13.38 MUS$ and
emission reduction percentages of 83.30%, 98.50%, and 18.85% for NOx, SOx and
CO2 emissions, respectively.
• From cost-effectiveness point of view, the total annual costs for ST, UST, and DFDE,
propulsion options operated with HFO-NG dual fuels are 15.05 MUS$, 15.90 MUS$,
and 13.38 MUS$, respectively. On the other hand, the total annual costs for MGO-NG
dual fuel operated COGAS propulsion system is 17.38 MUS$. DFDE operated with
HFO and NG fuels is the most economic and IMO emission compliance propulsion
option. It reduces NOx, SOx, and CO2 emissions with annual cost-effectiveness of 6.07
$/kg, 6.39 $/kg, and 0.55 $/kg, respectively.
Nomenclature Abbreviations
AC Annual cost for installation, $/year BOG Boil-off gas
BOR Boil-off gas rate, %/day CO2 carbon dioxide
C Annual fuel cost, $/year COGAS Combined gas and steam
CF Fuel conversion factor to CO2 emissions DFDE Dual fuel diesel engine
COP Coefficient of performance GCU Gas combustion unit
EEDI Energy Efficiency Design Index, gCO2/ton-NM GT Gas turbine
EF Engine emission factor, kg/kWh HFO Heavy fuel oil
ER Emissions reduction percentage,% IMO International Maritime Organization
FS Fuel saving cost, $/year LNG Liquefied natural gas
FSE Fuel saving cost-effectiveness, $/ton MGO Marine gas Oil
i Annual interest rate, % MSDE Medium speed marine diesel engine
L Engine load percent in ship modes NG Natural gas
LCV Lower calorific value, kJ/kg NOx Nitrogen Oxides Emissions

Nader R. Ammar Environmental and cost-effectiveness comparison of dual fuel propulsion
options for emissions reduction onboard LNG carriers
74
m Mass, kg S Sulfur
MCR Maximum continuous rating of the engine, kW SSDE Slow speed marine diesel engine
n Expected ship working years SOx Sulfur Oxides Emissions
P Engine power at maximum continuous rating, kW ST Steam turbine
PI Annual fuel price change percent, % UST Ultra steam turbine
SFC Specific fuel consumption, g/kWh
T Engine running time, h
Vref Reference ship speed, knots
x Fuel percentage in dual fuel engine
Subscript
DF Dual fuel diesel engine
DO Diesel oil
j Type of pollutant, SOx, NOx or CO2
m Engine main fuel
NG Natural gas
Reliq. Reliquefaction
REFERENCES
[1] Schebach, K.e.-a., The next generation of large LNG carriers, in Proc. of the 9th International Marine
Design Conference, 15-19 May 2006, Ann Arbor,MI2006.
[2] Sinha, R.P. and W.M.N.W. Nik, Investigation of propulsion system for large LNG ships, in IOP
Conference Series: Materials Science and Engineering, Mater. Sci. Eng. 36 012004.
https://doi.org/10.1088/1757-899X/36/1/012004
[3] Kumar, S., et al., Current status and future projections of LNG demand and supplies: A global
prospective. Energy Policy, 2011. 39(7): p. 4097-4104. https://doi.org/10.1016/j.enpol.2011.03.067
[4] Maxwell, D. and Z. Zhu, Natural gas prices, LNG transport costs, and the dynamics of LNG imports.
Energy Economics, 2011. 33(2): p. 217-226. https://doi.org/10.1016/j.eneco.2010.06.012
[5] Aguilera, R.F. and R. Aguilera, World natural gas endowment as a bridge towards zero carbon
emissions. Technological Forecasting and Social Change, 2012. 79(3): p. 579-586.
https://doi.org/10.1016/j.techfore.2011.09.004
[6] Querol, E., et al., Boil off gas (BOG) management in Spanish liquid natural gas (LNG) terminals.
Applied Energy, 2010. 87(11): p. 3384-3392. https://doi.org/10.1016/j.apenergy.2010.04.021
[7] Kurle, Y.M., S. Wang, and Q. Xu, Simulation study on boil-off gas minimization and recovery
strategies at LNG exporting terminals. Applied Energy, 2015. 156: p. 628-641.
https://doi.org/10.1016/j.apenergy.2015.07.055
[8] Romero Gómez, J., et al., Analysis and efficiency enhancement of a boil-off gas reliquefaction system
with cascade cycle on board LNG carriers. Energy Conversion and Management, 2015. 94: p. 261-274.
https://doi.org/10.1016/j.enconman.2015.01.074
[9] Mohd Noor, C.W., M.M. Noor, and R. Mamat, Biodiesel as alternative fuel for marine diesel engine
applications: A review. Renewable and Sustainable Energy Reviews, 2018. 94: p. 127-142.
https://doi.org/10.1016/j.rser.2018.05.031
[10] Chang, D., et al., A study on availability and safety of new propulsion systems for LNG carriers.
Reliability Engineering & System Safety, 2008. 93(12): p. 1877-1885.
https://doi.org/10.1016/j.ress.2008.03.013.
[11] Kanbur, B.B., et al., Cold utilization systems of LNG: A review. Renewable and Sustainable Energy
Reviews, 2017. 79: p. 1171-1188. https://doi.org/10.1016/j.rser.2017.05.161.
[12] Shin, Y. and Y.P. Lee, Design of a boil-off natural gas reliquefaction control system for LNG carriers.
Applied Energy, 2009. 86(1): p. 37-44. https://doi.org/10.1016/j.apenergy.2008.03.019.
[13] Yu, Y.H., B.G. Kim, and D.G. Lee, Cryogenic reliability of the sandwich insulation board for LNG
ship. Composite Structures, 2013. 95: p. 547-556. https://doi.org/10.1016/j.compstruct.2012.07.007.
[14] Fernández, I.A., et al., Review of propulsion systems on LNG carriers. Renewable and Sustainable
Energy Reviews, 2017. 67: p. 1395-1411. https://doi.org/10.1016/j.rser.2016.09.095.
[15] Gohary, M.M.E. and I.S. Seddiek, Utilization of alternative marine fuels for gas turbine power plant
onboard ships. International Journal of Naval Architecture and Ocean Engineering, 2013. 5(1): p. 21-
32. https://doi.org/10.2478/IJNAOE-2013-0115.

Environmental and cost-effectiveness comparison of dual fuel propulsion Nader R. Ammar
options for emissions reduction onboard LNG carriers
75
[16] Thomson, H., J.J. Corbett, and J.J. Winebrake, Natural gas as a marine fuel. Energy Policy, 2015. 87:
p. 153-167. https://doi.org/10.1016/j.enpol.2015.08.027.
[17] Ogden, J., et al., Natural gas as a bridge to hydrogen transportation fuel: Insights from the literature.
Energy Policy, 2018. 115: p. 317-329. https://doi.org/10.1016/j.enpol.2017.12.049.
[18] Burel, F., R. Taccani, and N. Zuliani, Improving sustainability of maritime transport through utilization
of Liquefied Natural Gas (LNG) for propulsion. Energy, 2013. 57: p. 412-420.
https://doi.org/10.1016/j.energy.2013.05.002.
[19] Gilmore, R., et al., LNG carrier alternative propulsion systems. SNAME-Greek Sect; 2005.
[20] Vanem, E., et al., Analysing the risk of LNG carrier operations. Reliability Engineering & System
Safety, 2008. 93(9): p. 1328-1344. https://doi.org/10.1016/j.ress.2007.07.007.
[21] Komal, D. Chang, and S.-y. Lee, Fuzzy reliability analysis of dual-fuel steam turbine propulsion system
in LNG carriers considering data uncertainty. Journal of Natural Gas Science and Engineering, 2015.
23: p. 148-164. https://doi.org/10.1016/j.jngse.2015.01.030.
[22] Bai, Y. and W.-L. Jin, Chapter 4 - LNG Carrier, in Marine Structural Design (Second Edition), Y. Bai
and W.-L. Jin, Editors. 2016, Butterworth-Heinemann: Oxford. p. 49-71. https://doi.org/10.1016/B978-
0-08-099997-5.00004-6.
[23] Jung, D., S. Park, and K. Min, Selection of appropriate working fluids for Rankine cycles used for
recovery of heat from exhaust gases of ICE in heavy-duty series hybrid electric vehicles. Applied
Thermal Engineering, 2015. 81: p. 338-345. https://doi.org/10.1016/j.applthermaleng.2015.02.002.
[24] Mrzljak, V., I. Poljak, and T. Mrakovčić, Energy and exergy analysis of the turbo-generators and steam
turbine for the main feed water pump drive on LNG carrier. Energy Conversion and Management,
2017. 140: p. 307-323. https://doi.org/10.1016/j.enconman.2017.03.007.
[25] Koroglu, T. and O.S. Sogut, Conventional and advanced exergy analyses of a marine steam power
plant. Energy, 2018. 163: p. 392-403. https://doi.org/10.1016/j.energy.2018.08.119.
[26] Ekanem Attah, E. and R. Bucknall, An analysis of the energy efficiency of LNG ships powering options
using the EEDI. Ocean Engineering, 2015. 110: p. 62-74.
https://doi.org/10.1016/j.oceaneng.2015.09.040.
[27] Shin, Y. and Y.P. Lee, Design of a boil-off natural gas reliquefaction control system for LNG carriers.
Applied Energy, 2009. 86(1): p. 37-44. https://doi.org/10.1016/j.apenergy.2008.03.019
[28] Raj, R., et al., A techno-economic study of shipping LNG to the Asia-Pacific from Western Canada by
LNG carrier. Journal of Natural Gas Science and Engineering, 2016. 34: p. 979-992.
https://doi.org/10.1016/j.jngse.2016.07.024.
[29] Mrzljak, V., I. Poljak, and V. Medica-Viola, Dual fuel consumption and efficiency of marine steam
generators for the propulsion of LNG carrier. Applied Thermal Engineering, 2017. 119: p. 331-346.
https://doi.org/10.1016/j.applthermaleng.2017.03.078.
[30] Moon, K., et al., Fire risk assessment of gas turbine propulsion system for LNG carriers. Journal of
Loss Prevention in the Process Industries, 2009. 22(6): p. 908-914.
https://doi.org/10.1016/j.jlp.2008.11.008.
[31] Gierusz, W., Simulation model of the LNG carrier with podded propulsion Part 1: Forces generated by
pods. Ocean Engineering, 2015. 108: p. 105-114. https://doi.org/10.1016/j.oceaneng.2015.07.031.
[32] Bittante, A., F. Pettersson, and H. Saxén, Optimization of a small-scale LNG supply chain. Energy,
2018. 148: p. 79-89. https://doi.org/10.1016/j.energy.2018.01.120.
[33] Haglind, F., A review on the use of gas and steam turbine combined cycles as prime movers for large
ships. Part III: Fuels and emissions. Energy Conversion and Management, 2008. 49(12): p. 3476-3482.
https://doi.org/10.1016/j.enconman.2008.08.003.
[34] Tan, H., et al., A new boil-off gas re-liquefaction system for LNG carriers based on dual mixed
refrigerant cycle. Cryogenics, 2018. 92: p. 84-92. https://doi.org/10.1016/j.cryogenics.2018.04.009.
[35] MAN. Propulsion Trends in LNG Carriers: Two-stroke Engines. 2013 15 October 2018)]; Available
from: https://www.mandieselturbo.com/docs/default-source/shopwaredocuments/propulsion-trends-in-
lngb395958927f2417aa98957b04cbb684a.pdf?sfvrsn=4.
[36] Bowie, S. Top 10 largest exporters of liquid natural gas. 2018 17 October 2018)]; Available from:
https://www.energydigital.com/top10/top-10-largest-exporters-liquid-natural-gas.
[37] EIA. China becomes world’s second largest LNG importer, behind Japan, U.S. Energy Information
Administration. 2018 17 October 2018]; Available from:
https://www.eia.gov/todayinenergy/detail.php?id=35072.
[38] SEA-DISTANCES.ORG. Sea Distances/port distances - online tool for calculation distances between
sea ports. 2018 17 October 2018)]; Available from: https://sea-distances.org/.
[39] Farooqui, Z.M., K. John, and N. Sule, Evaluation of anthropogenic air emissions from marine engines
in a coastal urban airshed of Texas. Journal of Environmental Protection, 2013. 4: p. 722-731.
https://doi.org/10.4236/jep.2013.47083.
Nader R. Ammar Environmental and cost-effectiveness comparison of dual fuel propulsion
options for emissions reduction onboard LNG carriers
76
[40] Ammar, N.R. and I.S. Seddiek, Eco-environmental analysis of ship emission control methods: Case
study RO-RO cargo vessel. Ocean Engineering, 2017. 137: p. 166 - 173.
https://doi.org/10.1016/j.oceaneng.2017.03.052.
[41] Department of Energy & Climate Change. CHP– Environmental, a detailed guide for CHP developers–
Part 3. 2008 27 October 2018)]; Available from:
https://assets.publishing.service.gov.uk/government/uploads/system/uploads/attachment_data/file/3451
73/Part_3_CHP_Environmental.pdf.
[42] ICF. Towboat emission reduction feasibility study. 2009.
[43] ICF. Current methodologies in preparing mobile source port-related emission inventories. 2009; 50-60.
[44] Banawan, A.A., M.M. El Gohary, and I.S. Sadek, Environmental and economical benefits of changing
from marine diesel oil to natural-gas fuel for short-voyage high-power passenger ships. Proceedings of
the Institution of Mechanical Engineers Part M-Journal of Engineering for the Maritime Environment,
2010. 224(M2): p. 103-113. https://doi.org/10.1243/14750902JEME181.
[45] Seddiek, I.S. and M.M. Elgohary, Eco-friendly selection of ship emissions reduction strategies with
emphasis on SOx and NOx emissions. International Journal of Naval Architecture and Ocean
Engineering, 2014. 6(3): p. 737-748. https://doi.org/10.2478/Ijnaoe-2013-0209.
[46] IMO. Report of the marine environment protection committee on its sixty-second session 2011 27
October 2018)]; Available from: http://www.crs.hr/Portals/0/MEPC%2062-24.pdf.
[47] Ahn, J., et al., Strategy for selecting an optimal propulsion system of a liquefied hydrogen tanker.
International Journal of Hydrogen Energy, 2017. 42(8): p. 5366-5380.
https://doi.org/10.1016/j.ijhydene.2017.01.037.
[48] Głomski, P. and R. Michalski, Problems with Determination of Evaporation Rate and Properties of
Boil-off Gas on Board LNG Carriers. Journal of Polish CIMAC, 2011. 6(1): p. 133-140.
[49] Zakaria, M., K. Osman, and M. Musa, Boil-Off Gas Formation inside Large Scale Liquefied Natural
Gas (LNG) Tank Based on Specific Parameters. Applied Mechanics and Materials, 2012. 229: p. 690-
694. https://doi.org/10.4028/www.scientific.net/AMM.229-231.690.
[50] Dobrota, D., B. Lalić, and I. Komar, Problem of Boil-off in LNG Supply Chain. Transaction on
maritime science, 2013. 2: p. 91-100. https://doi.org/10.7225/toms.v02.n02.001
[51] Welaya, Y.M.A., M.M. El Gohary, and N.R. Ammar, A comparison between fuel cells and other
alternatives for marine electric power generation. International Journal of Naval Architecture and
Ocean Engineering, 2011. 3(2): p. 141-149. https://doi.org/10.3744/Jnaoe.2011.3.2.141.
[52] Li, J., B. Wu, and G. Mao, Research on the performance and emission characteristics of the LNG-diesel
marine engine. Journal of Natural Gas Science and Engineering, 2015. 27: p. 945-954.
https://doi.org/10.1016/j.jngse.2015.09.036.
[53] Talluri, L., D.K. Nalianda, and E. Giuliani, Techno economic and environmental assessment of Flettner
rotors for marine propulsion. Ocean Engineering, 2018. 154: p. 1-15.
https://doi.org/10.1016/j.oceaneng.2018.02.020.
[54] Seddiek, I.S., M.M. Elgohary, and N.R. Ammar, The hydrogen-fuelled internal combustion engines for
marine applications with a case study. Brodogradnja, 2015. 66(1): p. 23-38.
[55] Ammar, N.R. and N.F.S.H. Alshammari, Overview of the Green Hydrogen Applications in Marine
Power Plants Onboard Ships. International Journal of Multidisciplinary and Current Research
(IJMCR), 2018. 6: p. 84-89. https://doi.org/10.14741/ijmcr.v6i01.10912
[56] Ammar, N.R. and I.S. Seddiek, Thermodynamic, environmental and economic analysis of absorption
air conditioning unit for emissions reduction onboard passenger ships. Transportation Research Part D:
Transport and Environment, 2018. 62: p. 726-738. https://doi.org/10.1016/j.trd.2018.05.003.
[57] IMO, Third IMO Greenhouse Gas Study 2014 : Safe, secure and efficient shipping on clean oceans,
2015: London: International Maritime Organization (IMO).
[58] Devanney, J., The impact of the energy efficiency design index on very large crude carrier design and
CO2 emissions. Ships and Offshore Structures, 2011. 6(4): p. 355-368.
https://doi.org/10.1080/17445302.2010.546651.
[59] GL. Guidelines for Determination of the Energy Efficiency Design Index. 2013 3 December 2017)];
Available from: http://rules.dnvgl.com/docs/pdf/gl/maritimerules2016July/gl_vi-13-1_e.pdf.
[60] IRCLASS. Ship Energy Efficiency Management Plan (SEEMP), guidance notes for ship owners and
ship operators. 2013 6 December 2017)]; Available from: http://www.irclass.org/media/1397/ship-
energy-efficiency-management-plan.pdf.
[61] Agnolucci, P., T. Smith, and N. Rehmatulla, Energy efficiency and time charter rates: Energy efficiency
savings recovered by ship owners in the Panamax market. Transportation Research Part A: Policy and
Practice, 2014. 66(Supplement C): p. 173-184. https://doi.org/10.1016/j.tra.2014.05.004.

Environmental and cost-effectiveness comparison of dual fuel propulsion Nader R. Ammar
options for emissions reduction onboard LNG carriers
77
[62] Ammar, N.R., Energy- and cost-efficiency analysis of greenhouse gas emission reduction using slow
steaming of ships: case study RO-RO cargo vessel. Ships and Offshore Structures, 2018. 13(8): p. 868-
876. https://doi.org/10.1080/17445302.2018.1470920.
[63] IMO, Resolution MEPC.213(63), 2012 Guidelines for the development of a ship energy efficiency
management plan (SEEMP), 2012.
[64] IMO, Resolution MEPC 245(66): 2014 guidelines on the method of calculation of the attained Energy
Efficiency Design Index (EEDI) for new ships. MEPC 66/21/Add.1, Annex 5, 4 April 2014. 2014,
International Maritime Organization: London.
[65] Hunt, E. and B. Butman. Marine engineering economics and cost analysis. 1995.
[66] Jeong, J., et al., Comparative analysis of a hybrid propulsion using LNG-LH2 complying with
regulations on emissions. International Journal of Hydrogen Energy, 2018. 43(7): p. 3809-3821.
https://doi.org/10.1016/j.ijhydene.2018.01.041.
[67] GE. LM2500, Gas Turbine for LNG Fueled Propulsion. 2013; Available from:
https://www.ge.com/content/dam/gepower-pgdp/global/en_US/documents/product/lm2500-lng-
product-sheet.pdf.
[68] Mitsubishi. Steam Turbine Generators (AT-Type). 2017 10 October 2018]]; Available from:
https://www.mhi-mme.com/products/boilerturbine/steam_turbine.html.
[69] MAN. Marine Engines & Systems. 2018 10 October 2018]]; Available from: https://marine.man-
es.com/.
[70] Bortnowska, M., Development of new technologies for shipping natural gas by sea. Polish Maritime
Research, 2009. 16(3): p. 70-78. https://doi.org/10.2478/v10012-008-0036-2.
[71] Pauschert, D. Study of equipment prices in the power sector. ESMAP Technical Paper 122/09.
Washington, DC: Energy Sector Management Assistance Program. 2009 10 October 2018]]; Available
from: https://www.esmap.org/sites/esmap.org/files/TR122-
09_GBL_Study_of_Equipment_Prices_in_the_Power_Sector.pdf.
[72] International Gas Union. World LNG report-2015 edition. 2015 10 October 2018)]; Available from:
http://www.igu.org/sites/default/files/node-page-field_file/IGU-World%20LNG%20Report-
2015%20Edition.pdf.
[73] Bunkerworld. Bunkerworld. Fuel prices. Octobern2018 15 October 2018)]; Available from:
http://www.bunkerworld.com/prices/.
[74] Knoema. Natural gas prices forcast: long term 2018 to 2030 data and charts. 2018 15 October 2018)];
Available from: https://knoema.com/ncszerf/natural-gas-prices-forecast-long-term-2018-to-2030-data-
and-charts.
[75] Trading Economics. Natural gas 1990-2018 2018 15 October 2018)]; Available from:
https://tradingeconomics.com/commodity/natural-gas.
[76] Mikelis, N.E., A statistical overview of ship recycling. J. Marit. Affairs, 2008. 7(1): p. 227–239.
https://doi.org/10.1007/BF03195133
Submitted: 26.11.2018.
Accepted: 11.06.2019.
Nader R. Ammar1,2, [email protected] (corresponding author)
1 Department of Marine Engineering, Faculty of Maritime Studies, King
Abdulaziz University, 21589 Jeddah, Saudi Arabia. 2 Department of Naval Architecture and Marine Engineering, Faculty of
Engineering, Alexandria University 21544 Alexandria, Egypt