ENVIRONMENT REPORT 2005 - Morningstar, Inc.
36
AUSTRALIAN FOOD AND GROCERY COUNCIL ENVIRONMENT REPORT 2005
Transcript of ENVIRONMENT REPORT 2005 - Morningstar, Inc.

AUSTRALIAN FOOD AND GROCERY COUNCIL
ENVIRONMENT REPORT 2005

THE FOOD AND GROCERY INDUSTRY IS AUSTRALIA’S
LARGEST MANUFACTURING SECTOR – EMPLOYING MORE THAN 200,000 AUSTRALIANS AND
THE INDUSTRY HAS A TURNOVER OF MORE THAN $73 b A YEAR
ADDING 2.5% TO AUSTRALIA’S GROSS DOMESTIC PRODUCT

AUSTRALIAN FOOD AND GROCERY COUNCIL ENVIRONMENT REPORT 2005 1
Contents2 Environment committee chairman’s introduction
3 Key fi ndings
5 The industry and the environment
7 Environment reporting
8 AFGC initiatives to improve environment reporting
11 2005 environment survey results
12 Water
15 Energy and greenhouse
20 Waste
24 Environment management
31 Future directions
32 References
The AFGC is the peak national organisation
representing Australia’s processed food,
beverage and grocery products industry.
It seeks to help create a business environment
that encourages the food and grocery industry
to grow and remain profi table.

This report refl ects the continual improvements
made by member companies in the collection of
environment data and provides detailed indicators
of the performance of the 11 sectors that make
up our industry. It also shows the resource
intensity of processing different food and grocery
products.
Manufacture is one stage in the production,
consumption and disposal cycle for food and
grocery products. To report accurately and
meaningfully on the environmental performance
of the food and grocery industry, each stage in
the cycle, and its impact on the supply chain,
must be measured.
Environment reporting plays an important role
in furthering cooperation between industry,
government and consumers for the benefi t of the
environment. This report enables the AFGC to
document examples of good performance,
identify areas for improvement and consider key
issues affecting the food and grocery sector.
The Environment Report 2005 highlights the
growing importance of environment reporting in
Australia and demonstrates industry’s ongoing
commitment to improving its environment
management. Since the last report in 2003,
the industry participants have reduced energy
use by 14%, water use by 21%, greenhouse
emissions by 29% and waste to landfi ll by
20% (per unit of production).
Given the improvements made by AFGC
members over the past fi ve years, the challenge
ahead for us is how to continue to reduce the
industry’s footprint on the environment while
still effi ciently meeting the need for greater
food safety through packaging and consumer
demand for smaller size varieties and
convenience products to meet demographic
and social changes.
In the face of this challenge, individual
companies and the industry must not let their
commitment to the environment waver. By
devoting greater resources to environment
management and reporting, we are better able to
determine the real impact we are having and what
opportunities there are for further improvement.
This report is the distillation of the efforts of
many members of the AFGC. I thank them for
their continued efforts.
Don Matthews
Chairman, Environment Committee
President, SCA Australasia
environment committee chairman’s introduction
Don MatthewsChairman, Environment CommitteePresident, SCA Australasia
This is the third environment report produced by the Australian Food and Grocery Council.
It builds substantially on the fi rst report in 2001 and enhances the steps taken by this
industry to report on its environmental performance and identify key issues across the
entire supply chain.

AUSTRALIAN FOOD AND GROCERY COUNCIL ENVIRONMENT REPORT 2005 3
processed food supply chain
primary production
processing packaging retail/ transport
consumption
• The Australian food and grocery industry
is improving its environment reporting in
response to community expectations and
government regulation.
• More than 80% of the companies
surveyed have formal environment
policies, and the percentage of
companies with environment
management systems has increased from
less than 50% in 2003 to more than 60%
in 2005.
• Energy use per kg of fi nished product has
fallen 14% to 1.84 MJ since 2003.
• Greenhouse emissions per kg of fi nished
product have fallen 29% from 0.42 kg in
2003 to 0.30 kg in 2005.
• Water use per kg of fi nished product has
fallen 21% since 2003 from 4.7 L to 3.15 L.
• Almost 90% of waste and by-products
are reused or recycled, with only about
10% going to landfi ll. The food and
grocery sector produces only a small
amount of waste to landfi ll – less than
8 kg per tonne of fi nished product. Total
waste to landfi ll per tonne of fi nished
product has been reduced by more than
20% since 2003.
• Water, waste and greenhouse are the
areas in which member companies
have made the greatest improvements.
• In future, companies will increase their
focus on reducing the relative impact of
packaging within the wider supply chain
highlighted by the increased relevance
of the new National Packaging Covenant
for industry.
• Improved reporting is a priority for the
food and grocery industry. AFGC
members are committed to ensuring their
reporting keeps pace with developments
in the supply chain, changes to the policy
and regulatory environment, and shifts in
community expectations.
key fi ndings

WATER USE PER KG OF FINISHED PRODUCT IS DOWN 21% SINCE 2003
FROM 4.7 LITRES TO 3.15 LITRES

AUSTRALIAN FOOD AND GROCERY COUNCIL ENVIRONMENT REPORT 2005 5
Environment reporting has gained in importance in Australia and overseas, with companies
increasingly recognising it as an essential part of their business planning and growth strategies.
A better understanding of the key threats and opportunities that impact on the sustainability of
industry is necessary for companies to maximise their interests as brand owners and those of
their consumers as brand users.
the industry and the environment
The AFGC recognises that environmental
sustainability is a major issue confronting the
industry. The continued supply of high-quality and
competitively priced raw materials is crucial for a
global manufacturing industry.
Manufacturing inevitably has implications for
resource use. However, the key challenge for the
food and grocery industry is to ensure that
resources are used effi ciently and that the impact
on the environment is minimised.
Accurate and meaningful environment reporting
has the potential to provide critical information for
business analysis that can help companies improve
their performance across the scope of operations.
To this end, the AFGC signed the Eco-Effi ciency
Agreement with Environment Australia in 2000
and, as part of that agreement, produced
environment reports in 2001 and 2003. This
reporting initiative by the AFGC has continued
beyond the life of that agreement, resulting in a
commitment to collect key performance indicator
data from member companies on an annual basis
and publish a public environment report detailing
this data every two years.
The Environment Committee is one of a
number of committees that operate within the
AFGC structure to address specifi c issues relevant
to the food and grocery industry. The Environment
Committee comprises up to 15 representatives
from member companies and is chaired by a
member of the AFGC Board.
The Environment Committee considers and
advises the Board on environment issues and
represents the industry on the development and
implementation of environment policies. Over the
past two years, the Environment Committee’s
work has focused on:
– reporting and benchmarking industry’s
environmental impact
– the National Packaging Covenant and
product stewardship
– water and energy management
– litter management
– sustainability
The World Commission on Environment and
Development defi nes sustainable
development as “development that meets
the needs of the present without
compromising the ability of future
generations to meet their own needs”.
World Business Council for Sustainable Development
(www.wbcsd.org).
Environment Committee members
Mr Don Matthews, SCA Hygiene
Australasia Pty Ltd (Chair)
Ms Fiona Fleming, George Weston Foods Ltd
Dr Simon Chhatbar, Colgate-Palmolive Pty Ltd
Ms Sue Burnet, Clorox Australia Pty Ltd
Dr Russell Peel, Foster’s Group Ltd
Mr Paul Prendergast, Golden Circle Ltd
Mr Janis Cecins, Dairy Farmers Group
Mr Alec Wagstaff, Coco-Cola Amatil (Australia) Ltd
Mr Michel Moutia, Kraft Foods Asia Pacifi c
Mr Lester Gilmore, HJ Heinz Company Australia Ltd
Ms Susan Blacklow, National Foods Ltd
Mr Tim Lane, Masterfoods Australia New Zealand
Dr Ross Hearne, Kimberly-Clark Australia Pty Ltd
Ms Karen Duncan, Nestlé Australia Ltd
Mr Mike Searles, Goodman Fielder Ltd
Mr Kelvin Hawkins, Kellogg (Australia) Pty Ltd
Ms Heather Campbell, Amcor Limited (observer)
Mr Gavin Williams, Packaging Council
of Australia (observer)
Mr Harris Boulton, AFGC
Mr Tony Mahar, AFGC

GREENHOUSE EMISSIONS PER KG OF FINISHED PRODUCT ARE DOWN 29%FROM 0.42 KG IN 2003 TO 0.30 KG IN 2005

AUSTRALIAN FOOD AND GROCERY COUNCIL ENVIRONMENT REPORT 2005 7
Australian companies need to keep building their capacity to report on their environment
management and performance. Environment reporting has come a long way over the past
20 years. Early environment reports tended to provide minimal information and often were an
attempt to mitigate negative perceptions about a company.
environment reporting
Producing an environment report is an important
way to communicate an industry’s environment
management practices and performance to
external stakeholders. In part, this contributes to
the ability of the company to protect brand value,
reputation and increase intelligence gathered for
investment decisions. Environment reporting also
offers signifi cant benefi ts internally to a company.
Measurement and reporting enable better cost
control and lower overheads in what is an
increasingly competitive market.
Environment reporting is now being
incorporated into management structures along
with other key performance indicators.
Regulatory changes are likely to increase
pressure for environment reporting. For example,
in 2005 a federal Parliamentary Joint Committee1
began an inquiry to determine whether it is
appropriate to require companies to report triple
bottom line data. The committee released a
discussion paper in November 2005 that raises
the issues of clarity and comparability in
environment reporting, mandatory reporting and
external verifi cation of data.
Should the committee recommend in its fi nal
report that industry improve its environment
reporting, this will impact policy development.
Companies that already have reporting systems in
place are likely to fi nd any recommended changes
to reporting easier to adopt.
Recently, a number of initiatives have
contributed to the development of reporting
standards to elevate environment reporting to a
level equivalent with fi nancial reporting.
The most common guidelines used in
Australia include:
– Global Reporting Initiative Guidelines
– triple bottom line reporting
The Global Reporting Initiative was established
in 2000 as an independent institution whose
mission is to develop sustainability reporting
guidelines for use globally.
These guidelines are for voluntary use by
organisations for the reporting of the economic,
environmental and social impacts of their activities,
products and services. The use of Global Reporting
Initiative Guidelines is becoming more widespread,
particularly among international companies2.
Triple bottom line reporting aims to provide
simple methodologies and, where possible, link
these methodologies with existing Australian
initiatives, such as the National Pollution
Inventory3. It enables organisations to measure
their performance against environment indicators
that are consistent with the Global Reporting
Initiative’s environment indicators.
Comprehensive environment reporting still has a
long way to go. The existing environment reporting
guidelines recognise that many organisations are
still developing their reporting capacity.
Of those AFGC members who completed the
2005 environment survey, 27% indicated they
produce a public environment report either as a
stand-alone document or as part of their annual
report. This compares favourably with a recent
survey of Australian companies commissioned by
the federal Department of Environment and
Heritage that found only 23% produced a public
environment report4.
Including an external assurance statement
increases the credibility and perceived status of
environment or sustainability reports. Ten years
ago, less than 20% of reports were externally
verifi ed. By 2003, this had doubled to 40%,
suggesting industry is beginning to accept the
importance of external assurance and that
producing a report, in itself, is not suffi cient5.
The AFGC survey showed that about 80% of
AFGC members used internal and/or external
verifi cation for collecting and reporting
environment data (Figure 1).
Wal-Mart will be seeking to source 100% of
its wild fi sh catch for the North American
market from fi sheries that meet independent
environment and sustainability standards.
Wal-Mart meeting with suppliers at Wal-Mart headquarters
in Bentonville, Arkansas, on 19 January 2006.

The Australian food and grocery sector has identifi ed the need to improve its capacity
to report. The AFGC has been collecting environmental data from its members since 1993,
and environmental impacts have been publicly reported since 2001.
AFGC initiatives to improve environment reporting
The fi rst environment survey was conducted in
2001, with subsequent surveys in 2003 and 2005.
Key performance indicator (KPI) data was also
collected in 2004. The AFGC plans to continue its
biannual environment reports, with KPI data
collected in intervening years. As the survey has
been run for several years, it is now established in
many member company reporting systems.
Since its last environment report in 2003,
the AFGC has undertaken a number of
activities to help improve environment reporting.
These include:
– reviewing the AFGC members’
environment survey
– seeking more rigorous methods of
benchmarking industry performance
– participating in the development of
reporting requirements for the National
Packaging Covenant
The AFGC recently commissioned a gap
analysis between the AFGC environment survey,
previous environment reports and emerging
environment reporting standards.
The key fi ndings of this gap analysis included
recommendations to:
– increase the quality of environment data, such
as reporting boundaries and data verifi cation
– supplement the survey with questions to
identify areas where and how environment
reporting may be increased
– obtain information on which members were
producing public environment reports and
their scope
– assess the voluntary and mandatory
environment codes adhered to by members
The results of the analysis and the subsequent
recommendations were incorporated in the 2005
environment survey. The AFGC is committed to
ensuring that industry can report through
rigorous, standardised and recognised systems.
Benchmarking environmental performance
As part of the gap analysis, the AFGC also
commissioned research into methods of
benchmarking the environmental performance
of the Australian food and grocery sector.
This was intended to give the sector an
understanding of how it is performing in
comparison to other industries.
The research found that it is diffi cult to
compare between, or even in, sectors using KPIs
based on environment impacts relative to
production. This is due to the highly variable
nature of manufacturing operations across the
different sectors. However, the research identifi ed
that cross-sectoral comparisons can be made in
environment management systems and practices,
as some elements of environment management
systems are generic across all companies,
although this is dependent on the information
being publicly available.
There is a range of useful proprietary
benchmarking tools available to companies to
help them with this process. The AFGC sourced
benchmark information from the One-2-Five®
suite of tools. These are based on ISO 14001
principles, which provide internationally
recognised standards for assessing environmental
management. The tools provide users with a
benchmark rating against each element of a best
practice environment management system.
Results from thirty food and grocery
companies that have used the One-2-Five® tools
over the past fi ve years to measure energy and
water management were reviewed. This data has

AUSTRALIAN FOOD AND GROCERY COUNCIL ENVIRONMENT REPORT 2005 9
provided an indicative assessment of the relative
performance of the sector and identifi ed key
areas for improvement. Not all of the companies
surveyed were AFGC members, but the
information provides a gross view of the
sector’s performance.
The research indicated that, in general, the food
and grocery sector is performing in line with other
manufacturing industries. The three top performing
areas – and the three areas requiring the greatest
attention – are summarised in Table 1.
This benchmark data shows that compliance
and risk issues generally have been well managed,
however there has been limited action beyond
compliance. Resourcing and budgeting are also
areas that have been well managed, as they are
usually part of standard operating practices.
The research found that companies in the
sector need to work on integrating environment
management. This will require a high level
corporate commitment to underpin any
successful environment management program.
Understanding the opportunities that arise
through reliable data collection and auditing will
also help in the development of action plans.
The AFGC Environment Committee will use
this and other relevant information in the
consideration of its future activities and will report
back on performance and progress in the next
AFGC environment report, scheduled for 2007.
The AFGC does not specifi cally endorse or promote the One-2-Five® tool. It is used as an example of the type of approach to environment management systems that encompass an analysis of process and demonstration of how improvements have been achieved.
Coca-Cola Amatil
Coca-Cola Amatil’s Northmead plant in NSW has
used functional benchmarking with One-2-Five®
Water to facilitate a radical culture shift in the way
the company and employees view water usage.
In 2003, the plant undertook a review of its
water management system as part of the
Sydney Water ‘Every Drop Counts’ program, and
achieved a score of two stars.
Between 2003 and 2005, Coca-Cola
Amatil has shown a commitment and a
proactive approach to water management.
The plant’s 2005 review of its water
management system showed an increase to
an outstanding four-star rating. This was
achieved through a range of activities, such
as improved water metering and greater staff
awareness of water issues. This placed Coca-
Cola Amatil at best practice performance level
in the beverage industry.
Through implementing a range of
management and technical actions, Coca-Cola
Amatil has reduced its water consumption
by 133 ML a year and water costs by 10%
in NSW.
Action Description
Best performing areas
Compliance with legal and
other requirements
Having systems in place to manage compliance and other internal and external
requirements, such as policies, guidelines and industry codes of practice.
Resourcing Having access to the right mix of human resources to ensure implementation of
water and energy projects.
Operating budgets Establishing budgets to effectively track and manage water and energy costs.
Areas requiring improvement
Understanding of performance
and opportunities
The level of understanding of current energy and water performance, and
associated risks and opportunities from attaining best practice.
Demonstrated corporate commitment The extent to which senior management shows that energy and water management
matters, and how effectively this attitude is communicated.
Metering and monitoring The measuring and tracking of energy and water use, and identifying variances
from target levels.
Table 1
Best and worst performing areas for the Australian food and grocery sector

ENERGY USE PER KG OF FINISHED PRODUCT IS DOWN 14%TO 1.84 MJ SINCE 2003

AUSTRALIAN FOOD AND GROCERY COUNCIL ENVIRONMENT REPORT 2005 11
The Environment Report 2005 has three key objectives:
– to report on the environmental performance of the food and grocery industry
– to promote a more systemic approach to environment policy, measurement and reporting
– to communicate the importance of continual improvement in reporting to provide accurate
and meaningful information
2005 environment survey results
The 2005 environment survey comprised a
number of questions about environment
management practices, perceptions and
performance, as well as a number of specifi c KPIs.
In 2005, 46 AFGC member companies took
part in the survey, with 30 providing KPI data.
The total amount of product produced by these
companies exceeded 10.5 Mt in 2004-05.
The survey collected KPI data on:
– the amount of water used per kg of
fi nished product
– the amount of energy used per kg of
fi nished product
– the amount of waste generated and the
proportion recovered for secondary uses
per kg of fi nished product
The purpose of reporting KPIs in this way is to
show the relative amount of resources used per
unit of product. Data is collected against the 11
food and grocery industry sub-sectors defi ned by
the Australia New Zealand Standard Industrial
Classifi cation (ANZSIC) system used by the
Australian Bureau of Statistics.
These sub-sectors include:
– paper and paper products
– meat and meat products
– fruit and vegetable processing
– medicinal and pharmaceutical products
– dairy products
– fl our mill and cereal foods
– oils and fats
– beverages
– home and personal care
– bakery products
– other foods
Thirty AFGC members have provided KPI data,
thereby providing a reasonable sample to illustrate
the overall performance of the whole sector.
However, of these 30 companies there may only be
a small number that are reporting in a sub-sector.
This means that the data collected for each
sub-sector can be signifi cantly infl uenced by the
activities of a single company, as well as the
number of companies that provide data from year
to year. As this is the case, this report focusses on
the performance of the whole food and grocery
sector and the sub-sector data is viewed as
indicative only. For example, in the oils and fats
sector there was only one survey respondent,
and therefore this sector has not been included.
Industry average rates for consumption and use are
indicative and are refl ective of survey participants.

Water is a key input for the processing of most food and grocery products. The amount of
water used in 2004-05 by AFGC members completing the survey was more than 33,000 ML.
water
This is equivalent to water use for the entire
population of Sydney for three weeks6. While
apparently a large amount, water consumption
in processing is very much smaller than other
stages of the production cycle.
The average water consumption per kg of
product for the whole sector in 2005 was 3.15 L
(Figure 2). This is a 33% reduction on 2004
consumption of 4.71 L/kg, and a 21% reduction
on 2003 consumption of 3.99 L/kg.
While the industry average water consumption
was reduced, the responses from a separate
survey question revealed twenty-two companies
had achieved reductions in water use in the past
two years, with fi ve companies reporting
reductions of more than 20% (Figure 4).
Consumption in the sub-sectors ranged from
0.23 L/kg of product for fl our milling and cereal
manufacture to more than 56 L/kg of product
for paper and paper product manufacturing
(Figure 3). The level for paper and paper products
manufacture is higher than the 2001-02 industry
average reported by the Australian Paper Industry
Council of 28.66 kL/t of product7. However, the
fi gure reported by AFGC members is likely to be
higher for a range of reasons. These include the
fact that the usage fi gures are based on the
production of paper products used in the home by
consumers, such as some types of tissues, which
must meet hygiene standards. In addition, the
membership of the Australian Paper Industry
Council encompasses a larger and more diverse
range of paper producers.
The amount of water used in the primary
production of food is signifi cantly greater
per kg of product than in the processing
or packaging of these foods. Primary
production uses between 600 and
50,000 L/kg, compared with 1-9 L/kg for
processing. Packaging uses up to 2.5 L/kg
for heavier packaging and signifi cantly less
than 1 L/kg for lighter packaging.
Consumption uses about 16 L/kg.
The Australian Food and Grocery Council’s
Environment Report 2003.

AUSTRALIAN FOOD AND GROCERY COUNCIL ENVIRONMENT REPORT 2005 13

After carrying out a water effi ciency audit, basic data on
where and how water was being used in the plant was
documented. This enabled effi ciency improvements to be
implemented in key areas. Some of these included new
meters at high-use points and a review of condensate
classifi cation to dirty and clean.
After implementing engineering changes and site use
modifi cations by personnel, previous usage of 460 kL
a day or 167,900 kL a year has been reduced by about
20%. The modifi cation process has returned 100%
on investment.
case study – goodman fielder
Goodman Fielder has reduced
the use of water at its Mascot
facility by about 20% or
33,000 kL a year.
20% REDUCTION
IN WATER USAGE
The site has established water conservation teams to
identify areas in which water could be recycled, reused
or eliminated altogether.
Specifi c areas where water savings have been
achieved include the reuse of water previously directed
to waste at the vacuum pumps in its canned food and
beverage plant.
In addition, by implementing shutdown checklists
during non-production times, the sugar plant has
achieved water reductions that have delivered savings
of up to $20,000 a year.
Golden Circle’s water effi ciency strategy has reduced
its total water consumption in 2005 by 15% over 2004
levels. The water use per tonne of production has been
reduced from 6.47 to 6.05 kL/t of production.
The Golden Circle food and beverage
processing plant in Brisbane has a
policy of continuous improvement in
the area of water use.
case study – golden circle
$20,000
ANNUAL
SAVINGS ACHIEVED
water

AUSTRALIAN FOOD AND GROCERY COUNCIL ENVIRONMENT REPORT 2005 15
Energy plays a vital role in the food and grocery sector. It powers the equipment used to
process and package products in a safe and effi cient manner.
energy and greenhouse
As the sector relies heavily on energy inputs to
create products, signifi cant attention is given to
reducing energy consumption, while still meeting
production and quality standards.
The form of energy used by food and grocery
companies varies across the different sectors of
the industry. Coal is still a signifi cant source of
energy in some fruit and vegetable processing.
Gas provides more than half the energy used in
processing in paper and paper products, bakery
products and dairy. Electricity is the main source
of energy for all other products.
Total annual energy use reported by survey
respondents in 2005 was 19.3 PJ. This is about
0.4% of Australia’s total annual energy
consumption8. Energy use per kg of product was
1.84 MJ, a reduction of 14% from 2003 (Figure
5, p16). More than half of the respondents in the
survey reported reductions in energy use in the
past two years. (Figure 6, p16).
Total greenhouse gas emissions from energy
use in the sector reached nearly 3.2 million
tonnes of CO2e in 2005. This is an overall
reduction in the total greenhouse emission rate
of 15% over 2003 levels.
Gas consumption represented the majority
(55%) of all energy use, with electricity 35% and
coal 10% (Figure 8, p17). Over the last three
years, there has been a marked increase in the
use of gas and a decrease in the use of electricity.
This shift has helped reduce the overall
greenhouse gas emissions from the sector.
The amount of energy used in the processing
of food and grocery products varies greatly from
19.23 MJ per kg for paper product manufacture
to 0.44 MJ/kg for beverage manufacture (Figure
7, p16). Likewise, greenhouse emissions vary
from 2.88 kg of CO2e equivalent emissions per kg
of paper product to 0.09 kg/kg of beverage
product manufactured. Average greenhouse
emissions per kg of total product produced have
fallen 29% from 0.42 kg in 2003 to 0.30 kg in
2005 (Figure 9).

AUSTRALIAN FOOD AND GROCERY COUNCIL ENVIRONMENT REPORT 2005 17

The Swan Brewery in Perth is one of Lion Nathan’s four major
breweries operating in Australia. The plant has undertaken a series
of actions that has reduced its annual greenhouse gas emissions
by about 8900 t of CO2e, which is equivalent to about 21% of its
emissions. The associated reduction in its energy bill also has
delivered benefi ts for the bottom line.
Waste minimisation has been achieved through the responsible
management of brewery effl uent and innovative on-site treatment
of processed water. The Swan Brewery’s process for brewing beer
produces two main by-products: spent grain and waste yeast.
Spent grain is the used husk of the malted barley, and the Swan
Brewery sells this as cattle feed to farmers. The yeast is
thermalised and tanked to pig farms for mixing with other
nutrients for food.
The Swan Brewery waste water treatment plant uses electricity,
representing 16.5% of its total power consumption. The innovative
and newly installed water recycling system recovers water and
redirects it to the evaporative condensers and cooling tower,
saving about 50,000 kL of water and 320,000 kW hours a year.
Further, the installation of variable speed drives on the aerators in
the treatment ponds has resulted in additional greenhouse gas
savings and other environmental benefi ts.
The recycling initiatives have provided for the irrigation of the
brewery’s gardens and grounds. The remaining surplus treated
water is irrigated over licensed spray fi elds and stormwater is
returned to the metropolitan water drain system, thereby ensuring
no contamination of the Canning River system.
case study – lion nathan
Lion Nathan is a company that actively displays an ongoing commitment to sustainable
environment practices. It has a great track record in reducing greenhouse emissions and
has embraced a wide range of public awareness activities.
ANNUAL GREENHOUSE GAS EMISSIONS REDUCED BY ALMOST 21%
Swan Brewery by-products are used as cattle feed or mixed with other nutrients for pig food.

AUSTRALIAN FOOD AND GROCERY COUNCIL ENVIRONMENT REPORT 2005 19
Foster’s Abbotsford Brewery in Victoria employs more than 500
people and produces more than 450 ML of beverages a year.
As the plant’s refrigeration system had been designed initially
for a much larger production volume, it was operating at only 75%
of its capacity, leading to ineffi ciencies. This created a major
challenge for Foster’s in reducing electricity consumption.
Working under the Australian Government’s voluntary Energy
Effi ciency Best Practice Program initiative, Foster’s was able to
bring together key staff with professionals from various technical
fi elds to analyse the plant’s refrigeration system in a task that was
codenamed the Refrigeration Project. Three key outcomes of the
Refrigeration Project were:
1. The refrigeration system was made more fl exible by linking the
previously independent refrigeration sets. This allowed the use
of a combination of any equipment and removed the need to
run unnecessary equipment.
2. Refrigeration processes were scheduled so that loads were
evened out and large peaks in usage were avoided.
3. Variable speed drives were added to equipment, such as
compressors and condensers/cooling tower fans, to allow
the system to be ramped up or down as needed, thereby
reducing power consumption. The variable speed drives also
increased the life of the machinery, as sudden stopping and
starting was avoided.
The Refrigeration Project provides an example of what can be
achieved by looking beyond routine operations and gaining
knowledge from external experts. The project reduced refrigeration
electricity consumption by more than 30% and emissions from the
refrigeration systems by up to 6,830,000 kg of CO2e – exceeding
expectations and the targets set for the project.
case study – foster’s group limited
Foster’s Group Limited has strived to achieve sustainability across its operations for many
years. Foster’s recognises it has a responsibility to all its stakeholders: the community,
shareholders and employees.
ELECTRICITY CONSUMPTION REDUCED BY MORE THAN 30%
Foster’s cooling towers. Foster’s ammonia compressor.
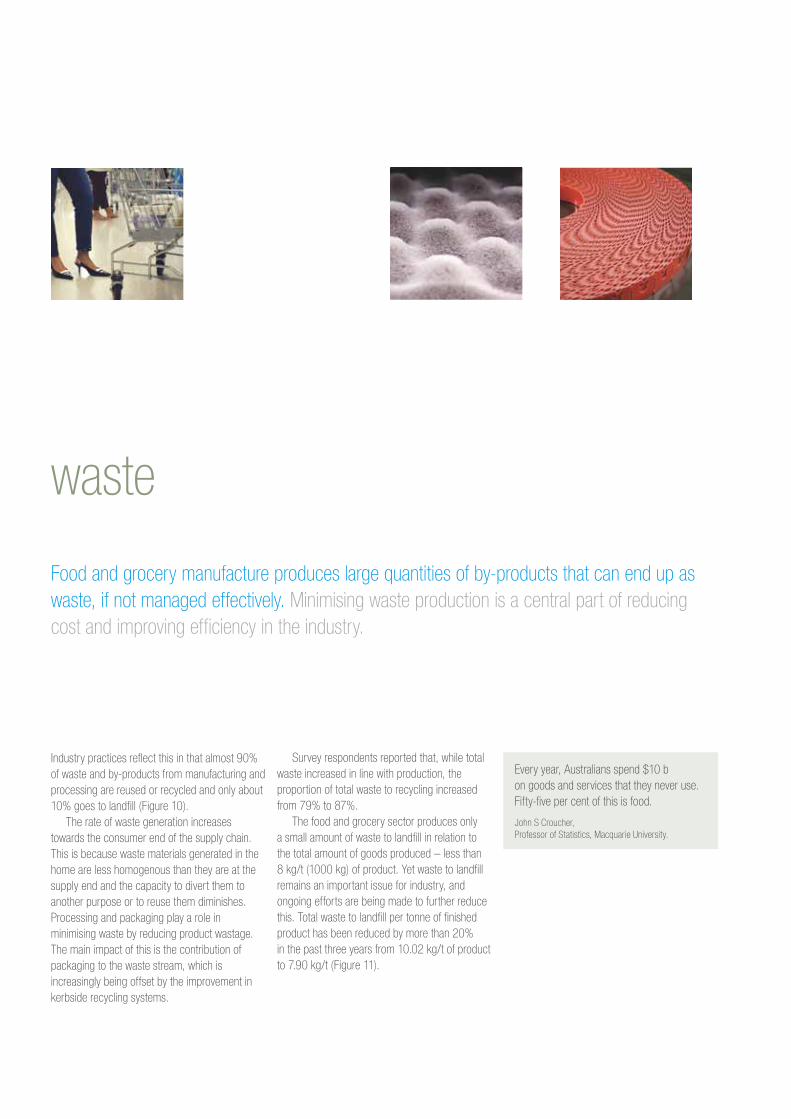
Industry practices refl ect this in that almost 90%
of waste and by-products from manufacturing and
processing are reused or recycled and only about
10% goes to landfi ll (Figure 10).
The rate of waste generation increases
towards the consumer end of the supply chain.
This is because waste materials generated in the
home are less homogenous than they are at the
supply end and the capacity to divert them to
another purpose or to reuse them diminishes.
Processing and packaging play a role in
minimising waste by reducing product wastage.
The main impact of this is the contribution of
packaging to the waste stream, which is
increasingly being offset by the improvement in
kerbside recycling systems.
Survey respondents reported that, while total
waste increased in line with production, the
proportion of total waste to recycling increased
from 79% to 87%.
The food and grocery sector produces only
a small amount of waste to landfi ll in relation to
the total amount of goods produced – less than
8 kg/t (1000 kg) of product. Yet waste to landfi ll
remains an important issue for industry, and
ongoing efforts are being made to further reduce
this. Total waste to landfi ll per tonne of fi nished
product has been reduced by more than 20%
in the past three years from 10.02 kg/t of product
to 7.90 kg/t (Figure 11).
Every year, Australians spend $10 b
on goods and services that they never use.
Fifty-fi ve per cent of this is food.
John S Croucher,
Professor of Statistics, Macquarie University.
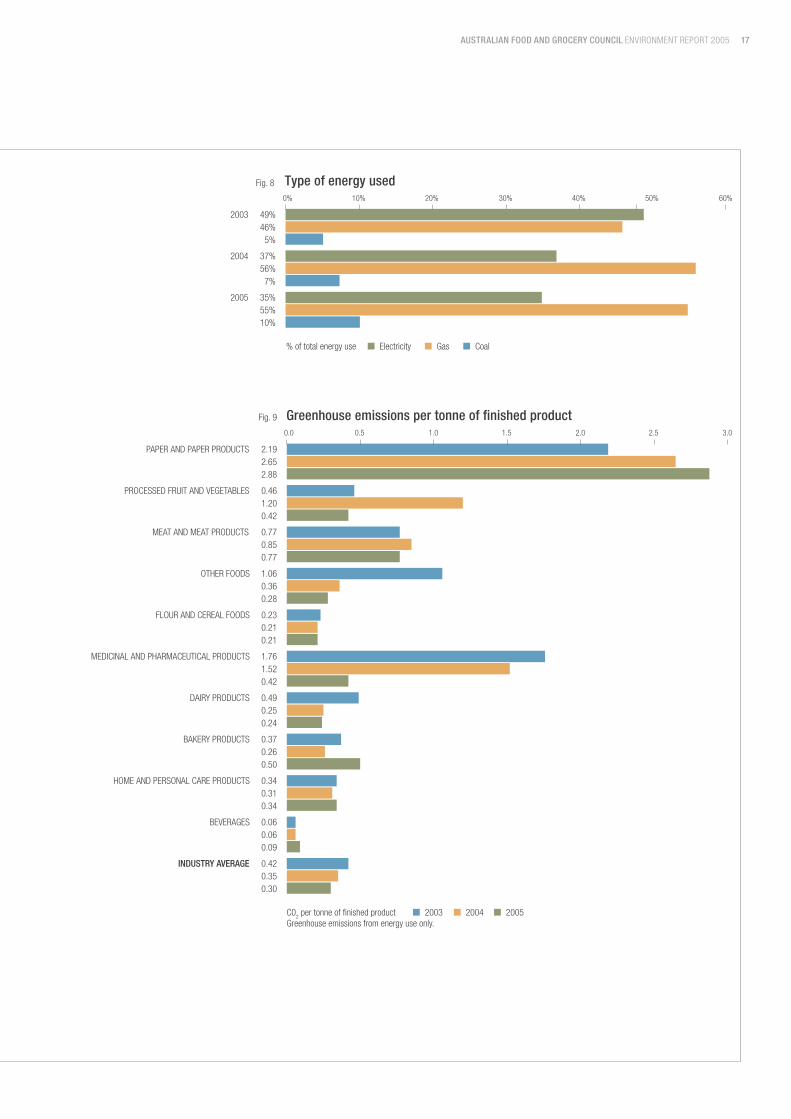
Food and grocery manufacture produces large quantities of by-products that can end up as
waste, if not managed effectively. Minimising waste production is a central part of reducing
cost and improving effi ciency in the industry.
waste

AUSTRALIAN FOOD AND GROCERY COUNCIL ENVIRONMENT REPORT 2005 21

As part of a designated waste management strategy, recyclable
materials – such as particle board, plastics and vegetable matter –
have been identifi ed and separated from the landfi ll stream on-site
prior to removal by contractors.
By implementing a range of activities encompassed in its
strategy and sourcing end markets for solid wastes, the centre is
diverting about 2500 m3 of material from landfi ll a year.
The next step is to try to reuse what cannot be eliminated from
the waste stream. An example of this is cardboard boxes used to
transport the steel caps used on baby food jars. These are reused
as storage boxes for furniture and household removalists.
Materials that cannot be reused in their current form are
delivered to a recycler.
Heinz actively seeks to develop methods and processes, along
with working with waste management businesses, to treat solid
wastes to prevent them going to landfi ll.
As a producer of high-quality baby foods, Heinz recognises the
importance of ensuring the responsible and sustainable use of
resources for future generations.
case study – heinz
The Heinz Infant Feeding Centre of Excellence at Echuca, Victoria, has made significant
improvements to its waste management.
ABOUT 2500 m3 OF MATERIAL DIVERTED EACH YEAR
Heinz production line.Heinz Infant Feeding Centre of Excellence.

AUSTRALIAN FOOD AND GROCERY COUNCIL ENVIRONMENT REPORT 2005 23
case study – clorox australia
Total waste to landfi ll reduced from 442 t in 2001-2002
to 66 t in 2003-2004.
This result has been achieved by increasing the
sorting of recyclable waste materials, particularly waste
wood and aluminium foil from tertiary packaging in the
production sites. Clorox has implemented specifi c sorting
bins for aluminium foil and wood-based products that
previously would have been directed to landfi ll.
The implementation of sorting bins has resulted in
board from the foil crates to be made into compost and
the timber incorporated into new reusable pallets for use
by Clorox.
Clorox Australia has significantly reduced the
amount of solid waste going to landfill.
TOTAL WASTE TO LANDFILL REDUCED FROM 442 TONNES TO 66 TONNES

Signifi cant and long-term environmental improvements can be made through the
implementation of environment management practices. An environment management system
needs to be part of the overall management system and includes the organisational structure,
planning activities, and practices and procedures for developing and implementing
environment policy9.
environment management
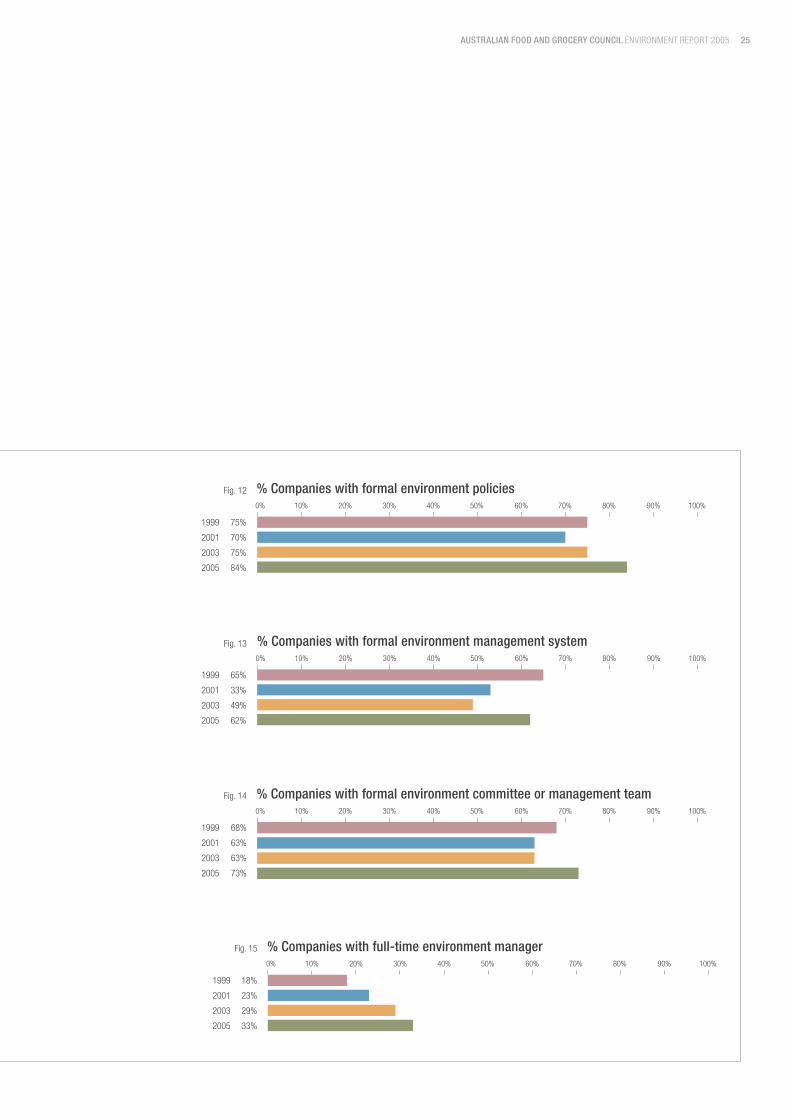
An important initial step in the development of an
environment management system is the adoption
of a formal company environment policy. The food
and grocery industry continues to recognise the
growing importance of environment management.
The results of the survey indicate that the
number of AFGC member companies adopting
formal environment policies has been growing. In
2005, the percentage of companies with formal
environment policies rose to about 80% (Figure
12). In addition, more than 60% of companies
have moved beyond this and have implemented
an environment management system (Figure 13).
Another tangible indicator of business
commitment to environment management is the
establishment of formal environment committees
or teams. More than 70% of respondents
reported the existence of a formal environment
committee or management team in their business
in 2005 (Figure 14). Also, to implement an
environment management system effectively
requires dedicated staff resources. More than
30% of companies now have a full-time
environment manager – this is an increase from
18% in 1999 (Figure 15).
AUSTRALIAN FOOD AND GROCERY COUNCIL ENVIRONMENT REPORT 2005 25
TOTAL WASTE TO LANDFILL PER TONNE OF FINISHED PRODUCT IS DOWN 20%
SINCE 2003
packaging
ALMOST 90% OF WASTE AND BY-PRODUCTS ARE
REUSED OR RECYCLED
AUSTRALIAN FOOD AND GROCERY COUNCIL ENVIRONMENT REPORT 2005 27
Packaging is used to contain and deliver a product
to the consumer. It is essential in terms of its ability
to maintain the particular characteristics and quality
of the product chosen by the consumer to satisfy a
requirement. It plays a vital role in the whole of
system, supplying safe goods and services from
production through to post consumption. While it
has a tangible impact on waste streams, the real
benefi ts are unmistakably recognised in the
economic, environmental and social contribution it
makes to the community. The AFGC’s view is that
packaging must be considered in light of all of the
costs and benefi ts in any debate about waste
management and resource effi ciency.
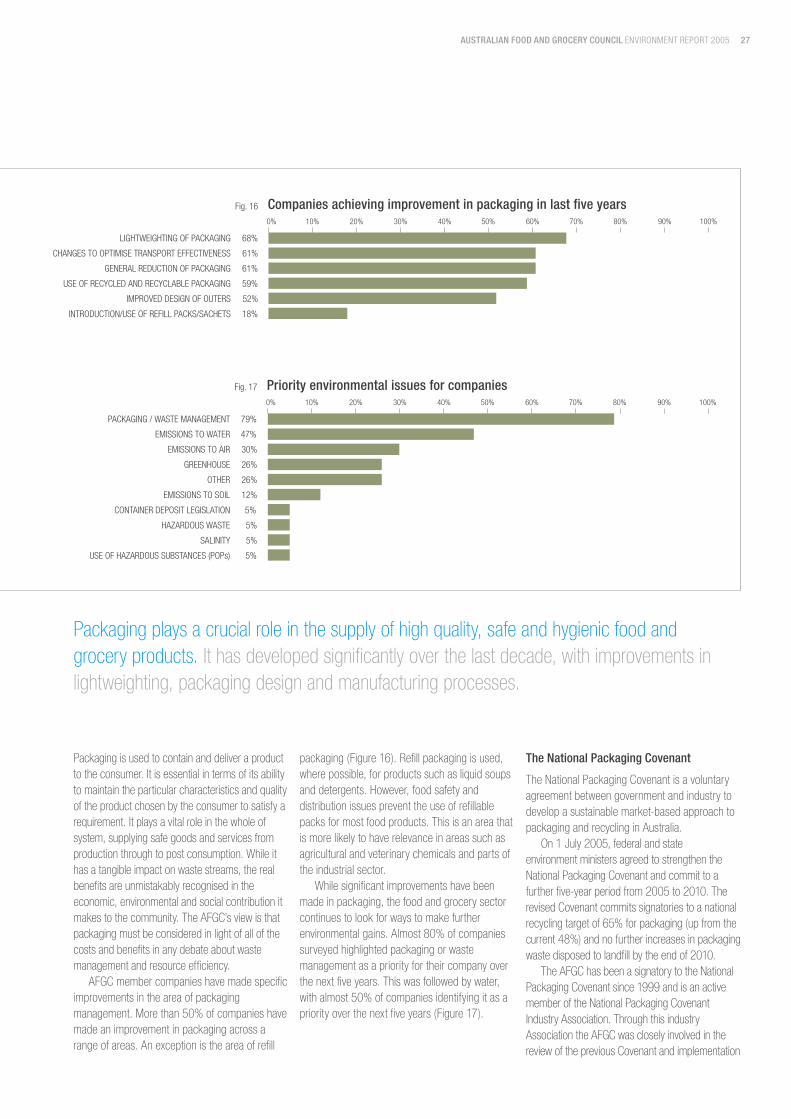
AFGC member companies have made specifi c
improvements in the area of packaging
management. More than 50% of companies have
made an improvement in packaging across a
range of areas. An exception is the area of refi ll
packaging (Figure 16). Refi ll packaging is used,
where possible, for products such as liquid soups
and detergents. However, food safety and
distribution issues prevent the use of refi llable
packs for most food products. This is an area that
is more likely to have relevance in areas such as
agricultural and veterinary chemicals and parts of
the industrial sector.
While signifi cant improvements have been
made in packaging, the food and grocery sector
continues to look for ways to make further
environmental gains. Almost 80% of companies
surveyed highlighted packaging or waste
management as a priority for their company over
the next fi ve years. This was followed by water,
with almost 50% of companies identifying it as a
priority over the next fi ve years (Figure 17).
The National Packaging Covenant
The National Packaging Covenant is a voluntary
agreement between government and industry to
develop a sustainable market-based approach to
packaging and recycling in Australia.
On 1 July 2005, federal and state
environment ministers agreed to strengthen the
National Packaging Covenant and commit to a
further fi ve-year period from 2005 to 2010. The
revised Covenant commits signatories to a national
recycling target of 65% for packaging (up from the
current 48%) and no further increases in packaging
waste disposed to landfi ll by the end of 2010.
The AFGC has been a signatory to the National
Packaging Covenant since 1999 and is an active
member of the National Packaging Covenant
Industry Association. Through this industry
Association the AFGC was closely involved in the
review of the previous Covenant and implementation
Packaging plays a crucial role in the supply of high quality, safe and hygienic food and
grocery products. It has developed signifi cantly over the last decade, with improvements in
lightweighting, packaging design and manufacturing processes.

of the revised Covenant. The National Packaging
Covenant will require the food and grocery sector to
increase and improve environment management
and reporting on a wide range of packaging-related
environmental indicators.
These include:
– the total weight of consumer packaging and
non-recyclable packaging
– the total weight of consumer packaging that is
recycled and sent to landfi ll
– improvements in design, manufacture,
marketing and distribution to minimise the
environmental impacts of packaging
– changes to protection, safety, hygiene, shelf
life or supply chain factors affecting the
amount and type of packaging
– packaging recycling collection systems on site
– implementation of ‘buy recycled’ purchasing
policy or practices
– annual reporting against an action plan
Consistent with the above key performance
indicators, industry signatories will need to document
the implementation of the revised Environmental
Code of Practice for Packaging and Guidelines. The
code provides a tool to help guide companies in the
design and manufacture of innovative packaging that
meets the sometimes confl icting demands of the
market and the environment.
The objective of the code and guidelines is to
ensure that effective and clearly documented
practices are in place to address environmental
concerns in the product development and review
process for packaging and packaged products.
The AFGC took an active role in the review of
the code. It is providing the chair and secretariat for
the Management Committee that was established
to oversee the implementation of the code.
The AFGC strongly supports the National
Packaging Covenant as the best option available.
It allows fl exibility in operations and provides
industry with the chance to self-regulate and
make improvements. The National Packaging
Covenant provides certainty for action
and investment.
It is important to note that, given the
environment ministers set overarching whole-of-
system targets under the new National Packaging
Covenant, reductions need to be made by all
members of the supply chain and not just food
and grocery manufacturers.
The AFGC will continue to work with other
industry associations and the National Packaging
Covenant Industry Association to fi nd ways
packaging manufacturers, brand owners and retailers
can minimise the impact of packaging, while
maintaining the essential functions of protecting the
product and ensuring consumer safety.
case study – nestlé
Nestlé Australia made packaging changes in 2004 that avoided
the use of about 460 t of carton board material.
Nestlé Australia worked closely with supply chain partner
Amcor Fibre Packaging to fi nd ways to reduce product packaging
without compromising its quality. This has resulted in a reduction in
the weight of the packaging board used per square metre and
removes 56 t a year of packaging waste from the environment.
Nestlé has delivered further improvements by down-gauging
the ice-cream packaging inners used at its Mulgrave site in
Victoria, resulting in a saving of 61 t of packaging waste a year.
Again, this was achieved without compromising the quality and
integrity of its packaging.

AUSTRALIAN FOOD AND GROCERY COUNCIL ENVIRONMENT REPORT 2005 29
Whole-of-chain sustainability
The National Packaging Covenant acknowledges
the need for a whole-of-chain approach to the
targets it has established. It is important, however,
to take an even broader approach to environment
management to ensure policies and strategies
refl ect the full environment and economic costs
and benefi ts. As noted in the Environment Report
2003, by focussing on single-issue environmental
outcomes in isolation, without a full understanding
of the overall environment benefi ts and costs, there
is the risk that strategies and policies may reduce,
rather than improve, environmental gains.
The production of food and grocery products
requires numerous resources. These include water,
land, agricultural and forestry products, chemicals
and packaging materials. Energy used in
production, distribution, storage and consumption
also have to be factored in.
The sustainability of the industry and its
products requires sound environment management
throughout the chain of production to the end
consumer. Efforts by AFGC members to track this
impact across the supply chain are the basis for the
2005 report and refl ect the pursuit of continual
improvement. The assessment of these efforts and
the implementation of national policies to optimise
resource use requires consideration of the whole-
of-chain environment impact.
Processing and packaging play a crucial role in
protecting and preserving products, and the
resources embedded in them. The environmental
cost of these processes in the overall system of
providing food and grocery products to Australians
is relatively minor. The industry continues to improve
its performance and reduce the impact on the
environment. But when considered from a whole-of-
system perspective, many of these gains will be able
to deliver only small relative improvements.
The production, processing, packaging and
consumption of food and grocery products have an
impact on the environment. However, this impact
continues to be partly offset by the environment
achievements that have been made in the
processing and packaging stage. In some cases,
the production of recyclable packaging may be
more resource intensive and have a larger negative
environment impact when viewed in the whole-of-
chain approach. The overall environment impact of
packaging needs to be considered, balancing the
resource intensity of production and recyclability
against the need to produce safe, high-quality
consumer products.
Research overseas also has focussed on the
wider sustainability issues of packaging. The
following snapshot looks at the apparent confl icting
issues associated with packaging and the inherent
trade-offs between product development and
packaging to meet the needs of consumers.
case study – george weston foods
Tip Top Bakeries achieved a saving of 1400 t of plastic over a
three-year period by re-engineering its packaging.
Packaged bread has a limited environmental impact due to the
use of reusable bread crates for secondary packaging and the
absence of any tertiary packaging. However, the company
identifi ed an opportunity to further reduce its impact by changing
its primary packaging, namely its bread bags.
Trials found that the bread bags could be made 12.5% lighter
without affecting their integrity.
This initiative was undertaken as part of the company’s
Covenant commitments and provided benefi ts for the environment
and cost savings for the company.

Packaging can be seen in two ways. One, it prevents waste;
two, it creates waste.
Packaging is not a product in itself. It is a means of delivering
products to customers in good condition, enabling products to
pass through the supply chain without being damaged. However,
it becomes waste at the end of its useful life.
Focussing on reducing packaging with the sole aim of creating
less packaging waste can be counterproductive. If goods are
under-packaged, there is a risk they will either be damaged or
spoiled before they reach consumers. This leads to waste and
puts more pressure on resources.
Changing demographics and lifestyles – including the trend
towards smaller households, people living alone, an ageing
population and greater convenience – have an impact on the type
of products demanded by consumers. Industry has no infl uence
over demographic changes, but must be responsive to them.
Industry, however, can determine the type of packaging used.
Packaging needs to fulfi l a number of criteria to ensure that
a product is delivered to consumers in good condition. This can
require a number of trade-offs, such as balancing the need to
reduce the environmental impact of packaging with the need to
ensure it performs well and prevents the waste of products in the
supply chain. The specifi c demands placed on the packaging by
end-users may be relatively limited compared with those
demanded by production, distribution and storage processes.
These demands and trade-offs are rarely evident to consumers.
The challenge is to design packaging systems to get goods
from production to consumption using the minimum amount of
resources and generating the least amount of waste.
Monkhouse C, Bowyer C & Farmer A (2004), Packaging for Sustainability: Packaging in the Context of the Product, Supply Chain and Consumer Needs, Institute for European Environment Policy, Report for the Industry Council for Packaging and the Environment.
Packaging for sustainability?

AUSTRALIAN FOOD AND GROCERY COUNCIL ENVIRONMENT REPORT 2005 31
AFGC member companies can make a substantial
impact on the prosperity and liveability of the
environment in which they operate. In many
cases, the pursuit of environmental gains by
companies can also result in lower production
costs, as demonstrated by the case studies in
this report.
The AFGC has sought to lead the industry by
initiating projects that focus on improving the
overall environmental performance of companies
and their activities through better management
and reporting practices. Further, it has collected
industry information and tracked progress, and
reported this publicly.
Effective whole-of-system environment
reporting can provide a greater understanding of
future risks so they can be incorporated into
investment and product development decisions.
A systemic and recognised approach to industry
reporting provides more reliable data as the basis
for policy decisions and more informed debate in
the community.
The AFGC continues to actively participate in
environment forums and issues, and has helped
facilitate industry’s adoption of the National
Packaging Covenant. However, it considers that
future progress is best achieved through the
development of a comprehensive industry-wide
strategy. The Environment Committee will
continue the work it has been doing to
understand and report on the environmental
impact of food processing and, more broadly, the
other stages of the supply chain cycle: primary
production and consumer recycling.
The challenge remains to engage the industry
to ensure what is being reported represents the
entire sector. The AFGC will continue to seek
greater participation by members in its
environment survey. Over the next few years,
industry can anticipate a continuation of the trend
towards greater reporting requirements and
increased transparency and accountability. In
addition, the AFGC will continue to pursue the
adoption of packaging manufacture, design and
management that takes account of the wider
system approach to environment issues.
This Environment Report 2005 refl ects the
AFGC’s commitment to industry sustainability,
and presents an open and honest approach
to reporting on industry’s achievements
and challenges.
The Australian food and grocery sector has made signifi cant progress in reducing its impact on
the environment in the past few years. The AFGC’s 2005 environment survey shows that the
industry has further reduced its energy and water consumption, greenhouse emissions and
waste to landfi ll and has increasingly adopted a range of environment management systems
and procedures. This progress is commendable, yet there is still scope for improvement.
future directions

1. The Parliamentary Joint Committee on Corporations and Financial Services, Inquiry into Corporate Responsibility,
http://www.aph.gov.au/senate/committee/corporations_ctte/corporate_responsibility/.
2. World Business Council for Sustainable Development (2004), ‘The WBSD on Accountability & Reporting,’ http://www.wbcsd.org.
3. Department of Environment and Heritage (2003), ‘Triple Bottom Line Reporting Guidelines’,
http://www.deh.gov.au/settlements/industry/fi nance/publications/indicators/foreword.html.
4. Center for Applied Energy Research, KPMG and Deni Greene Consulting (2004), The State of Sustainability Reporting in Australia 2004, Kentucky.
5. Association of the Chartered Certifi ed Accountants (2004), ‘Report of the Judges: ACCA Australia and New Zealand Awards
for Sustainability Reporting’, London.
6. Sydney Water Corporation (2005), http://www.sydneywater.com.au.
7. Australian Paper Industry Council (2003), 2003 Public Eco-effi ciency Report, Canberra.
8. Australian Bureau of Statistics (2003), 2003 Year Book Australia, Commonwealth of Australia, Canberra.
9. International Organisation for Standardisation 14001 (2004), ‘Environmental Management Systems – Specifi cation with Guidance for Use’,
http://www.iso.org/iso/en/ISOOnline.frontpage.
references

AAB Holdings Pty Ltd
Arnott’s Biscuits Ltd
Snack Foods Ltd
The Kettle Chip Company Pty Ltd
Asia-Pacifi c Blending Corporation Pty Ltd
Australia Meat Holdings Pty Ltd
Australian Pacifi c Paper Products
Beak & Johnston Pty Ltd
BOC Gases Australia Ltd
Bronte Industries Pty Ltd
Bulla Dairy Foods
Bundaberg Sugar Ltd
Cadbury Schweppes Asia Pacifi c
Cantarella Bros Pty Ltd
Cerebos (Australia) Ltd
Christie Tea Pty Ltd
Clorox Australia Pty Ltd
Coca-Cola Amatil (Aust) Ltd
SPC Ardmona Operations Ltd
Colgate-Palmolive Pty Ltd
Coopers Brewery Ltd
Dairy Farmers Group
Danisco Australia Pty Ltd
Devro Pty Ltd
DSM Food Specialties Australia Pty Ltd
DSM Nutritional Products
Fibrisol Services Australia Pty Ltd
Firmenich Ltd
Fonterra Brands (Australia) Pty Ltd
Foster’s Group Limited
General Mills Australia Pty Ltd
George Weston Foods Ltd
AB Food and Beverages Australia
AB Mauri
Cereform/Serrol
GWF Baking Division
GWF Meat & Dairy Division
George Weston Technologies
Jasol
Weston Cereal Industries
Gillette Australia Pty Ltd
GlaxoSmithKline Consumer Healthcare
Golden Circle Ltd
Goodman Fielder Pty Ltd
Meadow Lea Australia
Quality Bakers Australia Pty Ltd
Green’s Foods Ltd
H J Heinz Company Australia Ltd
Hans Continental Smallgoods Pty Ltd
Harvest FreshCuts Pty Ltd
Heimann Foodmaker Group
Hoyt Food Manufacturing Industries Pty Ltd
J Boag and Son Brewing Ltd
Johnson & Johnson Pacifi c Pty Ltd
Kellogg (Australia) Pty Ltd
Day Dawn Pty Ltd
Kerry Ingredients Australia Pty Ltd
Kimberly-Clark Australia Pty Ltd
Kraft Foods Asia Pacifi c
Lion Nathan Limited
Madura Tea Estates
Manildra Harwood Sugars
MasterFoods Australia New Zealand
Food
Petcare
Snackfood
McCain Foods (Aust) Pty Ltd
McCormick Foods Australia Pty Ltd
Merino Pty Ltd
Merisant Manufacturing Australia Pty Ltd
National Foods Ltd
Nerada Tea Pty Ltd
Nestlé Australia Ltd
Nestlé Foods & Beverages
Nestlé Confectionery
Nestlé Ice Cream
Nestlé Chilled Dairy
Nestlé Nutrition
Foodservice & Industrial Division
Novartis Consumer Health Australasia Pty Ltd
Nutricia Australia Pty Ltd
Nutrinova (Australasia) Pty Ltd
Ocean Spray International, Inc
Parmalat Australia Ltd
Patties Foods Pty Ltd
Peanut Company of Australia Ltd
Pfi zer Consumer Healthcare
Prepared Foods Australia
Procter & Gamble Australia Pty Ltd
PZ Cussons Australia Pty Ltd
Quality Ingredients Ltd
Prima Herbs and Spices
Reckitt Benckiser (Australia) Pty Ltd
Ridley Corporation Ltd
Cheetham Salt Limited
Sanitarium Health Food Company
Longa Life Vegetarian Products Pty Ltd
Sara Lee Australia
Douwe Egberts
Sara Lee Bakery
SCA Hygiene Australasia
Schwarzkopf and Henkel
Sensient Technologies
Simplot Australia Pty Ltd
Specialty Cereals Pty Ltd Spicemasters of Australia Pty Ltd
Spicemasters of Australia Pty Ltd
Stuart Alexander & Co Pty Limited
Sugar Australia Pty Ltd
SunRice
Symrise Pty Ltd
Tetley Australia Pty Ltd
The Smith’s Snackfood Company
Uncle Tobys Pty Ltd
Unilever Australasia
Waters Trading Pty Ltd
Wyeth Australia Pty Ltd
Yakult Australia Pty Ltd
Associate MembersAccenture
Amcor Fibre Packaging
CAS
CHEP Asia-Pacifi c
CoreProcess (Australia) Pty Ltd
Dairy Australia
Exel (Australia) Logistics Pty Ltd
Focus Information Logistics Pty Ltd
Food Liaison Pty Ltd
Foodbank Australia Limited
IBM Business Consulting Services
innovations & solutions
KPMG
Legal Finesse
Linfox Australia Pty Ltd
Meat and Livestock Australia Ltd
Minter Ellison Lawyers
Monsanto Australia Ltd
OTS Search
PricewaterhouseCoopers
Promax Applications Group Pty Ltd
Sue Akeroyd & Associates
Swire Cold Storage
Touchstone Consulting Australia Pty Ltd
Wiley & Co Pty Ltd
afgc membership list

Australian Food and Grocery Council
ABN 23 068 732 883
Level 2, Salvation Army Building, 2-4 Brisbane Avenue, Barton ACT 2600Locked Bag 1, Kingston ACT 2604
Tel: (02) 6273 1466, Fax: (02) 6273 1477E-mail: [email protected], Web: www.afgc.org.au