Entropy-based Abnormal Activity Detection Fusing RGB-D...
7
Entropy-based Abnormal Activity Detection Fusing RGB-D and Domotic Sensors Manuel Fernandez-Carmona, Serhan Cosar, Claudio Coppola, Nicola Bellotto ∗ Abstract— The automatic detection of anomalies in Active and Assisted Living (AAL) environments is important for monitoring the wellbeing and safety of the elderly at home. The integration of smart domotic sensors (e.g. presence detectors) and those ones equipping modern mobile robots (e.g. RGB-D cameras) provides new opportunities for addressing this challenge. In this paper, we propose a novel solution to combine local activity levels detected by a single RGB-D camera with the global activity perceived by a network of domotic sensors. Our approach relies on a new method for computing such a global activity using various presence detectors, based on the concept of entropy from information theory. This entropy effectively shows how active a particular room or environment’s area is. The solution includes also a new application of Hybrid Markov Logic Networks (HMLNs) to merge different information sources for local and global anomaly detection. The system has been tested with a comprehensive dataset of RGB-D and domotic data containing data entries from 37 different domotic sensors (presence, temperature, light, energy consumption, door contact), which is made publicly available. The experimental results show the effectiveness of our approach and its potential for complex anomaly detection in AAL settings. I. I NTRODUCTION One of the current challenges in healthcare systems is the increasing life-expectancy [1]. Longer life-expectancy implies bigger social and economic burdens to cope with chronic illnesses. Improving the quality of life through AAL technologies and promoting independent living at home for elderly people can ease these effects. People with Mild Cognitive Impairment (MCI) are functionally independent, except for occasional episodes of disorientation, memory loss or cognitive difficulty [2]. The EU project ENRICHME 1 focuses on developing new AAL technologies to enable health monitoring, complementary care and social support for elderly people with MCI, helping them to remain active and independent for longer. An important task of the project is the detection of unusual human activities, which are known to be an early indicator of dementia. For example, they are highly correlated with the sundown syndrome, which is manifested through abnormal motor activity levels, particularly in the afternoon [3]. Domotic sensors are a particularly attractive technology for activity monitoring tasks: they are typically cheap, pervasive and unintrusive. These features make them relevant for the detection of activity levels in AAL. However, due to their low consumption and bandwidth, they can only ∗ Authors are with Lincoln Centre for Autonomous Systems (L-CAS), University of Lincoln, LN6 7TS, UK {mfernandezcarmona, scosar, ccoppola, nbellotto }@lincoln.ac.uk 1 ENabling Robot and assisted living environment for Independent Care and Health Monitoring of the Elderly – http://www.enrichme.eu Fig. 1: Robot & domotic sensors integration in ENRICHME. provide a limited amount of information with low resolution (i.e. motion inside a room). These limitations could be solved using more expensive but also data-rich sensors, like the RGB-D camera equipping many of nowadays robots, including the one in ENRICHME (see Fig 1). This sensor provides far more accurate, although localized, information. The challenge is how to effectively combine these different sensor sources in order to detect abnormal activity levels. To this end, the current paper includes three main contributions: • a new entropy-based metric to detect human activity with domotic sensors, which does not require complex training or manual data labelling; • a new application of HMLN to combine different source of information for anomaly detection, merging categorical data from a local (RGB-D) activity detector with the continuous entropy-based one from global (domotic) sensors; • a large public dataset, containing data entries from 37 different domotic sensors (presence, temperature, light, energy consumption, door contact). The remainder of the paper is organized as follows. Sec. II describes relevant state-of-the-art approaches for anomaly detection with domotic sensors. The integrated system of domotic sensors and RGB-D camera is presented in Sec. III. Local and global activity level detectors are explained in Sec. IV. The following Sec. V describes the Markov Logic Network (MLN) implemented to combine the two activity level detectors and discover potential anomalies. The dataset used for the experiments and the results are presented in Sec. VI. Finally, the outcomes and limitations of this approach, as well as future work, are discussed in Sec. VII. 42 2017 IEEE International Conference on Multisensor Fusion and Integration for Intelligent Systems (MFI 2017) November 16 - 18, 2017, Daegu, Korea 978-1-5090-6064-1/17/$31.00 ©2017 IEEE
Transcript of Entropy-based Abnormal Activity Detection Fusing RGB-D...

Entropy-based Abnormal Activity DetectionFusing RGB-D and Domotic Sensors
Manuel Fernandez-Carmona, Serhan Cosar, Claudio Coppola, Nicola Bellotto∗
Abstract— The automatic detection of anomalies in Activeand Assisted Living (AAL) environments is important formonitoring the wellbeing and safety of the elderly at home.The integration of smart domotic sensors (e.g. presencedetectors) and those ones equipping modern mobile robots (e.g.RGB-D cameras) provides new opportunities for addressing thischallenge. In this paper, we propose a novel solution to combinelocal activity levels detected by a single RGB-D camera withthe global activity perceived by a network of domotic sensors.Our approach relies on a new method for computing sucha global activity using various presence detectors, based onthe concept of entropy from information theory. This entropyeffectively shows how active a particular room or environment’sarea is. The solution includes also a new application ofHybrid Markov Logic Networks (HMLNs) to merge differentinformation sources for local and global anomaly detection.The system has been tested with a comprehensive dataset ofRGB-D and domotic data containing data entries from 37different domotic sensors (presence, temperature, light, energyconsumption, door contact), which is made publicly available.The experimental results show the effectiveness of our approachand its potential for complex anomaly detection in AAL settings.
I. INTRODUCTION
One of the current challenges in healthcare systems is
the increasing life-expectancy [1]. Longer life-expectancy
implies bigger social and economic burdens to cope with
chronic illnesses. Improving the quality of life through AAL
technologies and promoting independent living at home for
elderly people can ease these effects.People with Mild Cognitive Impairment (MCI) are
functionally independent, except for occasional episodes of
disorientation, memory loss or cognitive difficulty [2]. The
EU project ENRICHME1 focuses on developing new AAL
technologies to enable health monitoring, complementary
care and social support for elderly people with MCI, helping
them to remain active and independent for longer. An
important task of the project is the detection of unusual
human activities, which are known to be an early indicator
of dementia. For example, they are highly correlated with the
sundown syndrome, which is manifested through abnormal
motor activity levels, particularly in the afternoon [3].Domotic sensors are a particularly attractive technology
for activity monitoring tasks: they are typically cheap,
pervasive and unintrusive. These features make them relevant
for the detection of activity levels in AAL. However, due
to their low consumption and bandwidth, they can only
∗Authors are with Lincoln Centre for Autonomous Systems (L-CAS),University of Lincoln, LN6 7TS, UK {mfernandezcarmona,scosar, ccoppola, nbellotto }@lincoln.ac.uk
1ENabling Robot and assisted living environment for Independent Careand Health Monitoring of the Elderly – http://www.enrichme.eu
Fig. 1: Robot & domotic sensors integration in ENRICHME.
provide a limited amount of information with low resolution
(i.e. motion inside a room). These limitations could be
solved using more expensive but also data-rich sensors, like
the RGB-D camera equipping many of nowadays robots,
including the one in ENRICHME (see Fig 1). This sensor
provides far more accurate, although localized, information.The challenge is how to effectively combine these different
sensor sources in order to detect abnormal activity levels. To
this end, the current paper includes three main contributions:
• a new entropy-based metric to detect human activity
with domotic sensors, which does not require complex
training or manual data labelling;
• a new application of HMLN to combine different
source of information for anomaly detection, merging
categorical data from a local (RGB-D) activity detector
with the continuous entropy-based one from global
(domotic) sensors;
• a large public dataset, containing data entries from 37
different domotic sensors (presence, temperature, light,
energy consumption, door contact).
The remainder of the paper is organized as follows. Sec. II
describes relevant state-of-the-art approaches for anomaly
detection with domotic sensors. The integrated system of
domotic sensors and RGB-D camera is presented in Sec. III.
Local and global activity level detectors are explained in
Sec. IV. The following Sec. V describes the Markov Logic
Network (MLN) implemented to combine the two activity
level detectors and discover potential anomalies. The dataset
used for the experiments and the results are presented
in Sec. VI. Finally, the outcomes and limitations of this
approach, as well as future work, are discussed in Sec. VII.
42
2017 IEEE International Conference on Multisensor Fusion and Integration for Intelligent Systems (MFI 2017)November 16 - 18, 2017, Daegu, Korea
978-1-5090-6064-1/17/$31.00 ©2017 IEEE

II. RELATED WORK
Perhaps, the most obvious choice for anomaly detection
relies on wearable sensors, such as activity trackers. Godfrey
et al. [4] developed an application to detect symptoms of the
sundown syndrome using these sensors. Unfortunately, this
approach is not always suitable for MCI patients as they may
forget or just refuse to wear such devices. Another possible
choice is to analyse video sequences. Xu et al. [5] presented
a method to predict anomalies based on multiple one-class
Support Vector Machine (SVM) models, offering an anomaly
score for video sequences. In [6], instead, an RGB-D camera
was used to detect Activities of Daily Living (ADLs) using
Hidden Markov Models.Domotic sensors are an alternative, usually cheaper choice
for anomaly detection. For example, the authors in [7] used
domotic sensors to track habits based on length, frequency
and periodicity of activity sequences. They developed an
activity recognition algorithm, called Episode Discovery
model, and proposed anomaly analysis based on this
paradigm for their future work. In [8], the authors used
presence detectors to build a spatio temporal behaviour
model. An anomaly in this context is a significant deviation
from the model, detected using a cross-entropy metric. Their
model however is very sensitive to potential misplacements
or faults of the deployed sensors.Fusing various sensing modalities can increase the
robustness of the system and tolerance to occasional data
errors. Though there are a plethora of Bayesian sensor
fusion models, such as Kalman filters and similar, these
are usually inappropriate for estimating discrete labels or
processes where the error characteristics are not easily
parametrised [9]. MLNs do not have this limitation. In
addition, HMLNs are capable to perform inferences mixing
information from both continuous and discrete domains [10].MLNs are able to perform inference using incomplete
inputs [11]. This is a common issue in domotics sensors,
where missing datagrams and faulty sensors are frequent
problems. Chahuara et al. [12] used a MLN for activity
recognition with domotic sensors and microphones in a
real scenario. However, they only used qualitative data
obtained from pre-processed continuous parameters, instead
of exploiting the capability of MLNs to deal with continuous
information directly.Besides MLNs, other statistical approaches were proposed,
for example using Case-Based Reasoning (CBR) and fuzzy
logic to detect anomalies with domotic and physiological
sensors [13]. They also used fuzzy logic to encode additional
rules and detect unusual behaviours. Although an interesting
system, so far this has only been tested in simulations.Public datasets of labelled sensor data are important for the
research community to test and compare different algorithms.
To our knowledge, there are only a few interesting domotic
datasets, in particular the one hosted by Tim van Kasteren2,
and the CASAS extensive collection of datasets3. However,
2https://sites.google.com/site/tim0306/datasets3Center for Advanced Studies in Adaptive Systems – http://ailab.
wsu.edu/casas/datasets/index.html
usually they are provided as plain text or raw Matlab files and
are difficult to handle, especially if of large size. Our publicly
available dataset, instead, was created by systematically
storing raw data in standard MongoDB format.
III. SYSTEM DESCRIPTION
The activity monitoring system in ENRICHME exchanges
information between the domotic sensor network and the
robot (see Fig. 1) through the Ambient Intelligence Server
(AIS). The latter consists of an embedded high-specs PC,
located at home, which acts as a multiprotocol gateway,
collecting and forwarding the information shared by the robot
and other smart sensors in the environment.The AIS is connected via wireless to a set of domotic
sensors for motion, contact, and energy consumption
monitoring. The system is based on the OpenHAB
middleware4, which provides an abstraction layer for
these sensors [14]. OpenHAB supports a wide range of
different domotic technologies with a uniform interface,
decoupling sensor information from specific domotic
protocols or manufacturers. It also provides an interface
and intercommunication5 with the Robot Operating System
(ROS) network, independently from the ambient sensors
actually used.The domotic network available in the ENRICHME’s
homes is Z-Wave. It is a wireless mesh network with
several different models of sensors. In general, these wireless
domotic devices are relatively cheap and easy to deploy
within a user home network. Three particular sensors are
available in our system: contact detectors, energy meters
and multi-parameter sensors. The latter provide information
about human presence, light and temperature. Contact
sensors instead are used to monitor door states (open, close),
while energy sensors are used to monitor the use of relevant
electric appliances, such as microwave, coffee machine, etc.The fact of being physically located in the domestic
environment facilitates the communication of the AIS with
the robot and the smart sensors, avoiding potential problems
due to internet bandwidth or poor quality-of-service. It also
provides the opportunity to extend the system with further
optional wired sensors (e.g. fixed RGB-D camera) directly
connected to the AIS computer.Domotic sensors are usually fixed, preventing sensing
reconfigurations once the system is running. Also, they only
provide limited information, which could be insufficient
to identify potential anomalies. We use therefore a
mobile robot6 (see Fig. 1), equipped with an RGB-D
camera and other sensors, as an extension of the AAL
environment, which provide some additional (localized)
sensing information to overcome these limitations.The robot can navigate in the domestic environment,
monitoring and interacting with the user to offer various
services, such as reminding appointments, suggesting
exercises, or finding lost objects. Using its sensors (RGB-D
4http://www.openhab.org/5https://github.com/corb555/iot_bridge6http://tiago.pal-robotics.com/
43
(a) (b)
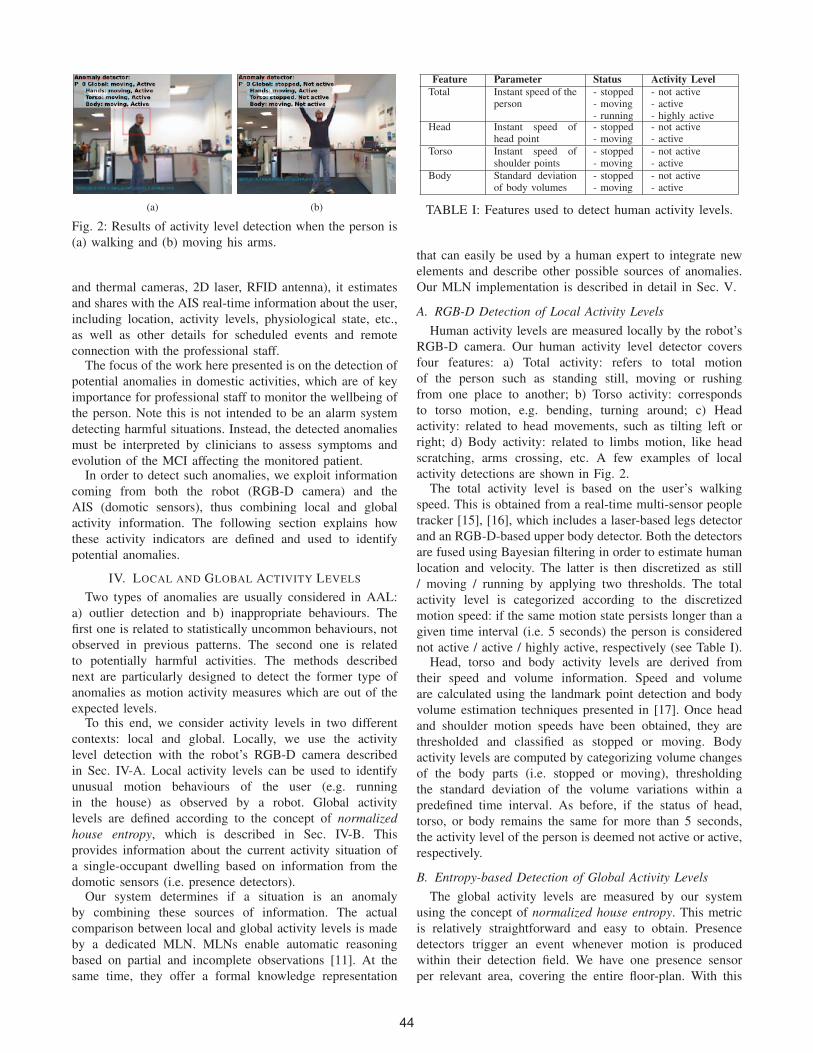
Fig. 2: Results of activity level detection when the person is
(a) walking and (b) moving his arms.
and thermal cameras, 2D laser, RFID antenna), it estimates
and shares with the AIS real-time information about the user,
including location, activity levels, physiological state, etc.,
as well as other details for scheduled events and remote
connection with the professional staff.The focus of the work here presented is on the detection of
potential anomalies in domestic activities, which are of key
importance for professional staff to monitor the wellbeing of
the person. Note this is not intended to be an alarm system
detecting harmful situations. Instead, the detected anomalies
must be interpreted by clinicians to assess symptoms and
evolution of the MCI affecting the monitored patient.In order to detect such anomalies, we exploit information
coming from both the robot (RGB-D camera) and the
AIS (domotic sensors), thus combining local and global
activity information. The following section explains how
these activity indicators are defined and used to identify
potential anomalies.
IV. LOCAL AND GLOBAL ACTIVITY LEVELS
Two types of anomalies are usually considered in AAL:
a) outlier detection and b) inappropriate behaviours. The
first one is related to statistically uncommon behaviours, not
observed in previous patterns. The second one is related
to potentially harmful activities. The methods described
next are particularly designed to detect the former type of
anomalies as motion activity measures which are out of the
expected levels.To this end, we consider activity levels in two different
contexts: local and global. Locally, we use the activity
level detection with the robot’s RGB-D camera described
in Sec. IV-A. Local activity levels can be used to identify
unusual motion behaviours of the user (e.g. running
in the house) as observed by a robot. Global activity
levels are defined according to the concept of normalizedhouse entropy, which is described in Sec. IV-B. This
provides information about the current activity situation of
a single-occupant dwelling based on information from the
domotic sensors (i.e. presence detectors).Our system determines if a situation is an anomaly
by combining these sources of information. The actual
comparison between local and global activity levels is made
by a dedicated MLN. MLNs enable automatic reasoning
based on partial and incomplete observations [11]. At the
same time, they offer a formal knowledge representation
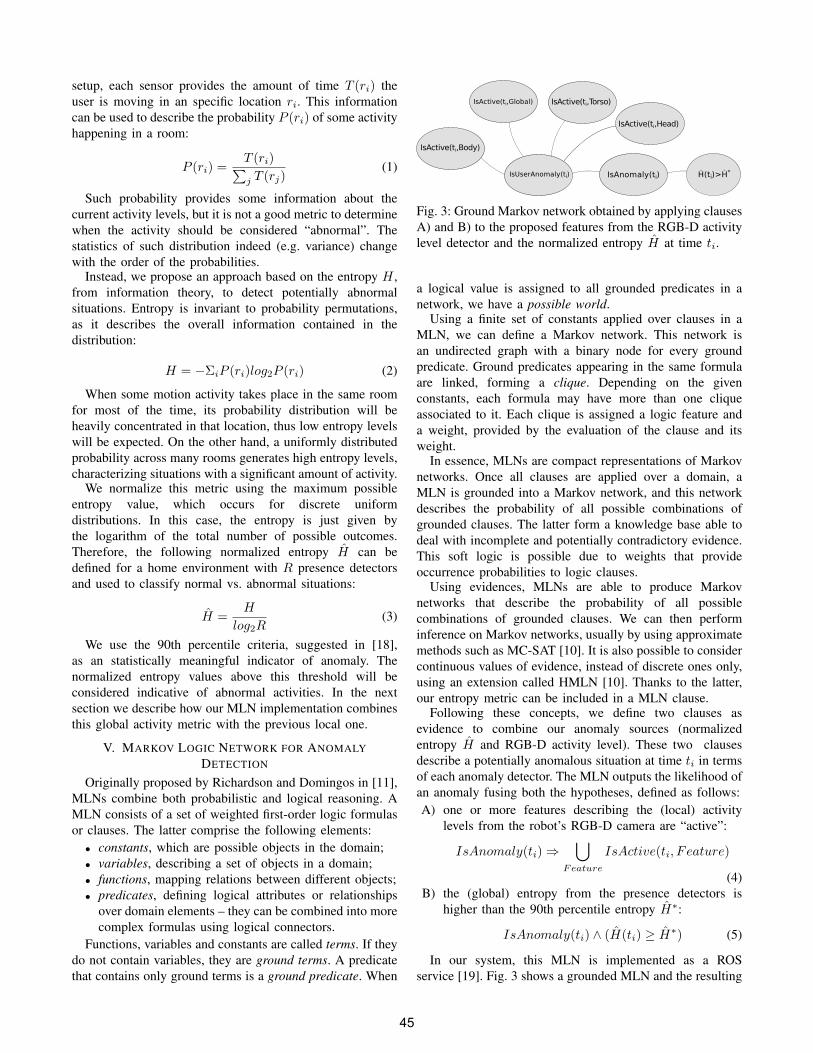
Feature Parameter Status Activity LevelTotal Instant speed of the
person- stopped- moving- running
- not active- active- highly active
Head Instant speed ofhead point
- stopped- moving
- not active- active
Torso Instant speed ofshoulder points
- stopped- moving
- not active- active
Body Standard deviationof body volumes
- stopped- moving
- not active- active
TABLE I: Features used to detect human activity levels.
that can easily be used by a human expert to integrate new
elements and describe other possible sources of anomalies.
Our MLN implementation is described in detail in Sec. V.
A. RGB-D Detection of Local Activity LevelsHuman activity levels are measured locally by the robot’s
RGB-D camera. Our human activity level detector covers
four features: a) Total activity: refers to total motion
of the person such as standing still, moving or rushing
from one place to another; b) Torso activity: corresponds
to torso motion, e.g. bending, turning around; c) Head
activity: related to head movements, such as tilting left or
right; d) Body activity: related to limbs motion, like head
scratching, arms crossing, etc. A few examples of local
activity detections are shown in Fig. 2.The total activity level is based on the user’s walking
speed. This is obtained from a real-time multi-sensor people
tracker [15], [16], which includes a laser-based legs detector
and an RGB-D-based upper body detector. Both the detectors
are fused using Bayesian filtering in order to estimate human
location and velocity. The latter is then discretized as still
/ moving / running by applying two thresholds. The total
activity level is categorized according to the discretized
motion speed: if the same motion state persists longer than a
given time interval (i.e. 5 seconds) the person is considered
not active / active / highly active, respectively (see Table I).Head, torso and body activity levels are derived from
their speed and volume information. Speed and volume
are calculated using the landmark point detection and body
volume estimation techniques presented in [17]. Once head
and shoulder motion speeds have been obtained, they are
thresholded and classified as stopped or moving. Body
activity levels are computed by categorizing volume changes
of the body parts (i.e. stopped or moving), thresholding
the standard deviation of the volume variations within a
predefined time interval. As before, if the status of head,
torso, or body remains the same for more than 5 seconds,
the activity level of the person is deemed not active or active,
respectively.
B. Entropy-based Detection of Global Activity LevelsThe global activity levels are measured by our system
using the concept of normalized house entropy. This metric
is relatively straightforward and easy to obtain. Presence
detectors trigger an event whenever motion is produced
within their detection field. We have one presence sensor
per relevant area, covering the entire floor-plan. With this
44
setup, each sensor provides the amount of time T (ri) the
user is moving in an specific location ri. This information
can be used to describe the probability P (ri) of some activity
happening in a room:
P (ri) =T (ri)∑j T (rj)
(1)
Such probability provides some information about the
current activity levels, but it is not a good metric to determine
when the activity should be considered “abnormal”. The
statistics of such distribution indeed (e.g. variance) change
with the order of the probabilities.Instead, we propose an approach based on the entropy H ,
from information theory, to detect potentially abnormal
situations. Entropy is invariant to probability permutations,
as it describes the overall information contained in the
distribution:
H = −ΣiP (ri)log2P (ri) (2)
When some motion activity takes place in the same room
for most of the time, its probability distribution will be
heavily concentrated in that location, thus low entropy levels
will be expected. On the other hand, a uniformly distributed
probability across many rooms generates high entropy levels,
characterizing situations with a significant amount of activity.We normalize this metric using the maximum possible
entropy value, which occurs for discrete uniform
distributions. In this case, the entropy is just given by
the logarithm of the total number of possible outcomes.
Therefore, the following normalized entropy H can be
defined for a home environment with R presence detectors
and used to classify normal vs. abnormal situations:
H =H
log2R(3)
We use the 90th percentile criteria, suggested in [18],
as an statistically meaningful indicator of anomaly. The
normalized entropy values above this threshold will be
considered indicative of abnormal activities. In the next
section we describe how our MLN implementation combines
this global activity metric with the previous local one.
V. MARKOV LOGIC NETWORK FOR ANOMALY
DETECTION
Originally proposed by Richardson and Domingos in [11],
MLNs combine both probabilistic and logical reasoning. A
MLN consists of a set of weighted first-order logic formulas
or clauses. The latter comprise the following elements:
• constants, which are possible objects in the domain;
• variables, describing a set of objects in a domain;
• functions, mapping relations between different objects;
• predicates, defining logical attributes or relationships
over domain elements – they can be combined into more
complex formulas using logical connectors.
Functions, variables and constants are called terms. If they
do not contain variables, they are ground terms. A predicate
that contains only ground terms is a ground predicate. When
Fig. 3: Ground Markov network obtained by applying clauses
A) and B) to the proposed features from the RGB-D activity
level detector and the normalized entropy H at time ti.
a logical value is assigned to all grounded predicates in a
network, we have a possible world.Using a finite set of constants applied over clauses in a
MLN, we can define a Markov network. This network is
an undirected graph with a binary node for every ground
predicate. Ground predicates appearing in the same formula
are linked, forming a clique. Depending on the given
constants, each formula may have more than one clique
associated to it. Each clique is assigned a logic feature and
a weight, provided by the evaluation of the clause and its
weight.In essence, MLNs are compact representations of Markov
networks. Once all clauses are applied over a domain, a
MLN is grounded into a Markov network, and this network
describes the probability of all possible combinations of
grounded clauses. The latter form a knowledge base able to
deal with incomplete and potentially contradictory evidence.
This soft logic is possible due to weights that provide
occurrence probabilities to logic clauses.Using evidences, MLNs are able to produce Markov
networks that describe the probability of all possible
combinations of grounded clauses. We can then perform
inference on Markov networks, usually by using approximate
methods such as MC-SAT [10]. It is also possible to consider
continuous values of evidence, instead of discrete ones only,
using an extension called HMLN [10]. Thanks to the latter,
our entropy metric can be included in a MLN clause.Following these concepts, we define two clauses as
evidence to combine our anomaly sources (normalized
entropy H and RGB-D activity level). These two clauses
describe a potentially anomalous situation at time ti in terms
of each anomaly detector. The MLN outputs the likelihood of
an anomaly fusing both the hypotheses, defined as follows:
A) one or more features describing the (local) activity
levels from the robot’s RGB-D camera are “active”:
IsAnomaly(ti)⇒⋃
Feature
IsActive(ti, Feature)
(4)
B) the (global) entropy from the presence detectors is
higher than the 90th percentile entropy H∗:
IsAnomaly(ti) ∧ (H(ti) ≥ H∗) (5)
In our system, this MLN is implemented as a ROS
service [19]. Fig. 3 shows a grounded MLN and the resulting
45

graph for a time constant ti. ROS is adopted as common
framework for information exchange, enabling the robot to
access the inference engine. The MLN service can be queried
using evidence provided by any ROS source, including the
normalized house entropy and the RGB-D activity levels.
The output of the inference process is also available to any
other node on the ROS network.
VI. EXPERIMENTS
To evaluate the proposed system, we collected domotic
sensor and RGB-D data for a week in an area of the
L-CAS7 offices resembling a simple living environment
with a kitchenette and a lounge space. The sensors were
mostly concentrated in places where a rich set of activities
are typically performed (entering, exiting, eating, drinking,
resting, etc.). To facilitates the data recording, instead of
the actual robot, we emulated its presence fixing an RGB-D
camera on a tripod in front of the kitchenette. In this way,
it was possible to collect long-term local information about
user activities in this type of area, central to many ADLs.
A. Domotic Sensors Dataset
Twelve different people were working in these premises
during the recordings. The sensors were placed at the
entrance, in the kitchen, lounge area and workshop. Fig. 4
illustrates our sensors deployment and approximate area
coverage.The dataset contains more than 89,000 data entries from
37 different parameters recorded in two MongoDB collection
snapshots. Our database storage offers great advantages for
data management and manipulation compared to traditional
log files and spreadsheet files. This is particularly important
when we record long-term datasets. Here we need not only
data storage, but also efficient and flexible querying methods.
Using the MongoDB’s query capabilities, we can freely
retrieve any interval, sensor set and even combine data from
other sources [20].For the hardware, we used commercial ZWave wireless
domotic sensors provided to ENRICHME by the Fibar
Group8. These sensors are easily deployable, widely
available and have a long battery life. Their small size
makes them also very unintrusive. All the recording and the
processing was done by the same Intel NUC i7-5557U CPU
@ 3.10GHz with 8 GB of RAM, running Linux OS Ubuntu
14.04 64 bits.
B. Human Activity Levels Results
In this first part of the experiments, we consider only
some local human activity levels detected on RGB-D
data. A dedicated ROS module was implemented for the
ENRICHME assistive robot in Fig. 1 and used for our
kitchen camera. Since this is the central area of our
testing environment, users often appear and perform various
activities, which are detected also by the presence sensor.
7Lincoln Centre for Autonomous Systems - http://lcas.lincoln.ac.uk/
8http://www.fibaro.com/
Fig. 4: Domotic sensors deployment in L-CAS.
The bottom graph in Fig. 5 shows the “Total” human
activity level from RGB-D data, as defined in Sec. IV-A,
recorded at the same time as the domotic sensors. Each level
has one associated colour: red for Highly Active, green for
Active and black for Not Active. The Active levels confirm
that the users were performing some activities in the kitchen,
like dish-washing or preparing coffee. The graph shows also
a frequent detection of ’Highly Active’ situations due to
people quickly passing by the kitchen without stopping.
C. Normalized Entropy ResultsWe developed a ROS node that processed data from the
presence detectors to calculate the normalized house entropy.
Our entropy metric is only meaningful when applied to a set
of binary sensors. On a single sensor, of course, it would not
provide enough information about the user activities.Fig. 5 presents a brief time lapse of some sensor
data and the corresponding system entropy. It shows 10
minutes of sensor activations, detecting human motion in
different locations. The thick red line in the top-three graphs
represents the activation probability with respect to all the
available sensors. The fourth graph illustrates the evolution of
the normalized entropy, where the instantaneous values above
Fig. 5: a,b,c) Sensors activations and probabilities of (global)
activities. Only three sensors are shown here, although the
normalized entropy is computed for all the domotic sensors
in the test environment. d) Normalized house entropy based
on the domotic sensors. e) RGB-D detection of (local)
activities. Different colours mean different activity levels.
46
75% are marked in green. In this case the 75% threshold
corresponds to the 90th percentile criteria applied to our
dataset, which is a common statistical indicator of anomaly
detection [18].As expected, the normalized entropy shows high values
when all the sensors are active at the same time. The situation
in the figure corresponds to events in the dataset where
people were meeting after lunch for a coffee or to do some
dish-washing. This type of activities generated high levels
of activity detection in different areas simultaneously. In
Sec. VI-D we will see how these can be considered an
anomaly event (case #4).
D. Anomaly Detection ResultsHere we present the results using our MLN to detect
potential anomalies of the activity levels. An anomaly event
is reported when MLN anomaly probability is over 50 %.
For comparison, we considered also a simple rule-based
system implementing the same set of logic conditions defined
in Sec. V, but without embedding them in a MLN. In
practice, this rule-based detector produced binary outputs
purely based on the simultaneous fulfilment of all rules.Fig. 6 shows the output of both anomaly detectors (MLN
vs. rule-based) and the respective snapshots of the detected
events. Our ground truth is based on the observation of
the RGB-D video stream by a human expert. Each event
is numbered in the lower left corner of the image. Each one
is also marked with a circle, showing which engine detected
the event – blue for the rule-based and green for the MLN
anomaly detector.The events detected during the experiment are also
summarized in Table II. In total, there were eight different
events spotted by the anomaly detectors. The table shows
how many users were currently visible by the RGB-D
camera, which activities they were performing, and which
detector classified them as anomalies. It shows also the
activity level manually annotated as ground truth.The graph in Fig. 6 illustrates the output of the anomaly
detector during the experiment. The output of the rule-based
anomaly detector is a binary function shown in blue. The
output of the MLN anomaly detector is a probability value
shown in red or green, depending if below or above a 50%
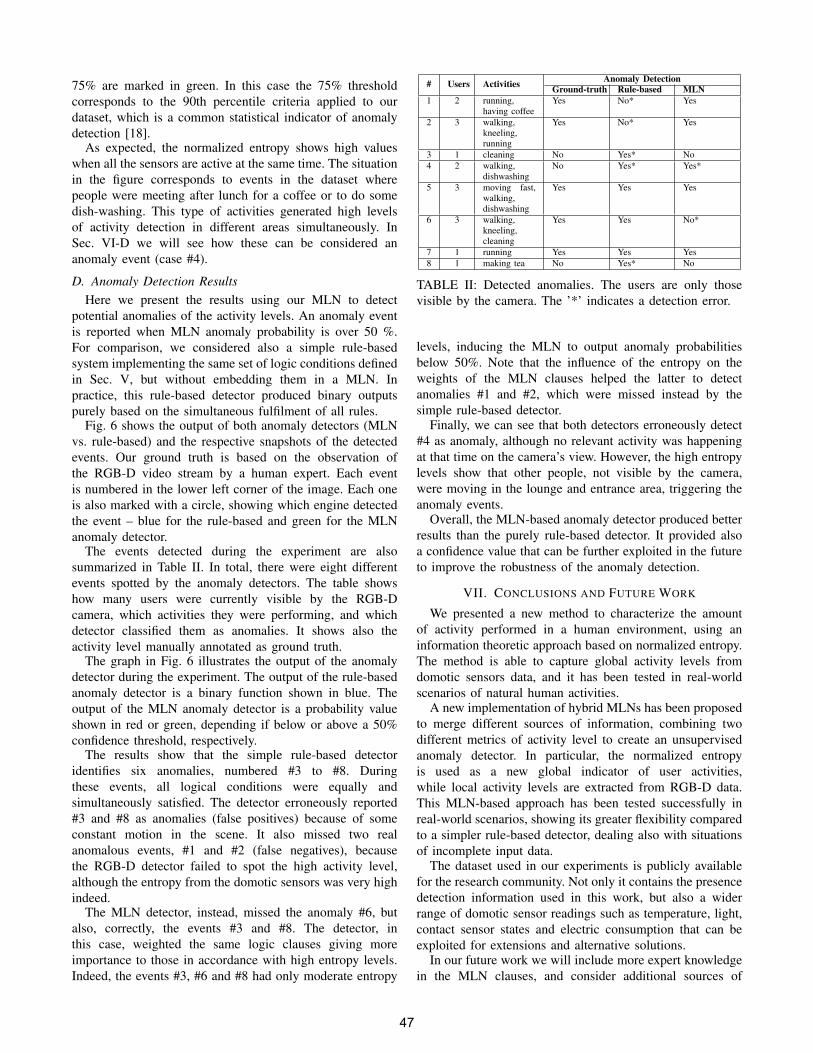
confidence threshold, respectively.The results show that the simple rule-based detector
identifies six anomalies, numbered #3 to #8. During
these events, all logical conditions were equally and
simultaneously satisfied. The detector erroneously reported
#3 and #8 as anomalies (false positives) because of some
constant motion in the scene. It also missed two real
anomalous events, #1 and #2 (false negatives), because
the RGB-D detector failed to spot the high activity level,
although the entropy from the domotic sensors was very high
indeed.The MLN detector, instead, missed the anomaly #6, but
also, correctly, the events #3 and #8. The detector, in
this case, weighted the same logic clauses giving more
importance to those in accordance with high entropy levels.
Indeed, the events #3, #6 and #8 had only moderate entropy
# Users Activities Anomaly DetectionGround-truth Rule-based MLN
1 2 running,having coffee
Yes No* Yes
2 3 walking,kneeling,running
Yes No* Yes
3 1 cleaning No Yes* No
4 2 walking,dishwashing
No Yes* Yes*
5 3 moving fast,walking,dishwashing
Yes Yes Yes
6 3 walking,kneeling,cleaning
Yes Yes No*
7 1 running Yes Yes Yes
8 1 making tea No Yes* No
TABLE II: Detected anomalies. The users are only those
visible by the camera. The ’*’ indicates a detection error.
levels, inducing the MLN to output anomaly probabilities
below 50%. Note that the influence of the entropy on the
weights of the MLN clauses helped the latter to detect
anomalies #1 and #2, which were missed instead by the
simple rule-based detector.Finally, we can see that both detectors erroneously detect
#4 as anomaly, although no relevant activity was happening
at that time on the camera’s view. However, the high entropy
levels show that other people, not visible by the camera,
were moving in the lounge and entrance area, triggering the
anomaly events.Overall, the MLN-based anomaly detector produced better
results than the purely rule-based detector. It provided also
a confidence value that can be further exploited in the future
to improve the robustness of the anomaly detection.
VII. CONCLUSIONS AND FUTURE WORK
We presented a new method to characterize the amount
of activity performed in a human environment, using an
information theoretic approach based on normalized entropy.
The method is able to capture global activity levels from
domotic sensors data, and it has been tested in real-world
scenarios of natural human activities.A new implementation of hybrid MLNs has been proposed
to merge different sources of information, combining two
different metrics of activity level to create an unsupervised
anomaly detector. In particular, the normalized entropy
is used as a new global indicator of user activities,
while local activity levels are extracted from RGB-D data.
This MLN-based approach has been tested successfully in
real-world scenarios, showing its greater flexibility compared
to a simpler rule-based detector, dealing also with situations
of incomplete input data.The dataset used in our experiments is publicly available
for the research community. Not only it contains the presence
detection information used in this work, but also a wider
range of domotic sensor readings such as temperature, light,
contact sensor states and electric consumption that can be
exploited for extensions and alternative solutions.In our future work we will include more expert knowledge
in the MLN clauses, and consider additional sources of
47
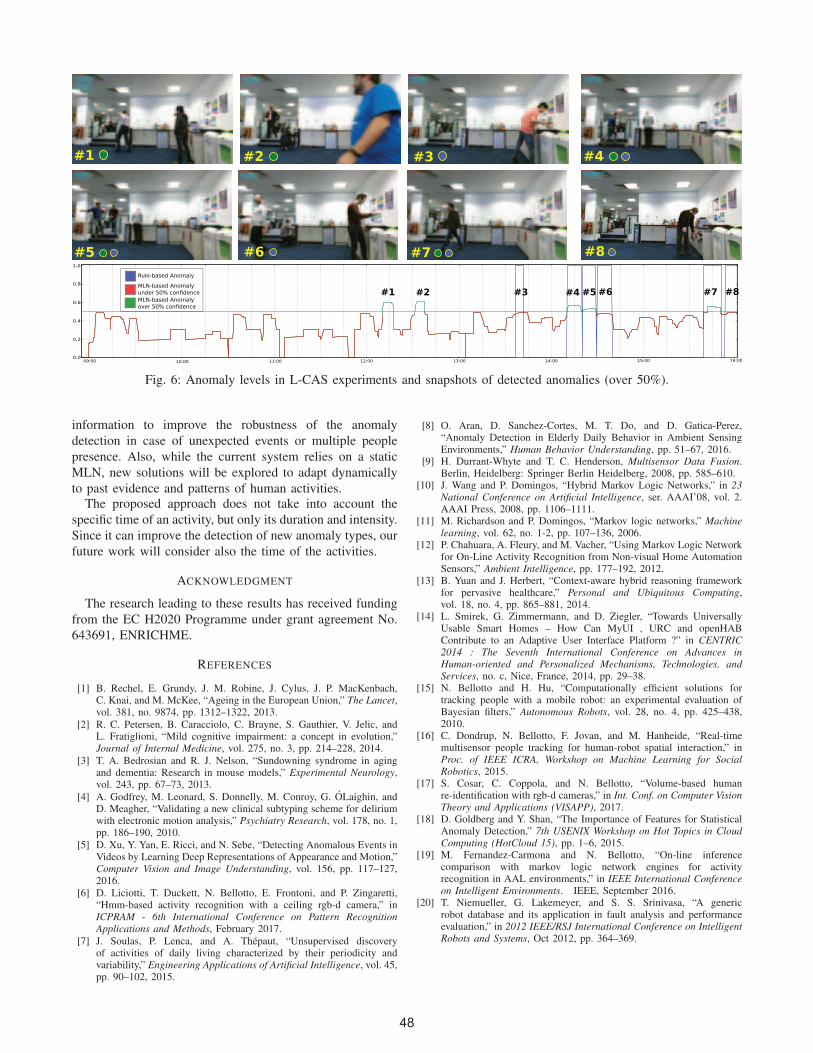
Fig. 6: Anomaly levels in L-CAS experiments and snapshots of detected anomalies (over 50%).
information to improve the robustness of the anomaly
detection in case of unexpected events or multiple people
presence. Also, while the current system relies on a static
MLN, new solutions will be explored to adapt dynamically
to past evidence and patterns of human activities.The proposed approach does not take into account the
specific time of an activity, but only its duration and intensity.
Since it can improve the detection of new anomaly types, our
future work will consider also the time of the activities.
ACKNOWLEDGMENT
The research leading to these results has received funding
from the EC H2020 Programme under grant agreement No.
643691, ENRICHME.
REFERENCES
[1] B. Rechel, E. Grundy, J. M. Robine, J. Cylus, J. P. MacKenbach,C. Knai, and M. McKee, “Ageing in the European Union,” The Lancet,vol. 381, no. 9874, pp. 1312–1322, 2013.
[2] R. C. Petersen, B. Caracciolo, C. Brayne, S. Gauthier, V. Jelic, andL. Fratiglioni, “Mild cognitive impairment: a concept in evolution,”Journal of Internal Medicine, vol. 275, no. 3, pp. 214–228, 2014.
[3] T. A. Bedrosian and R. J. Nelson, “Sundowning syndrome in agingand dementia: Research in mouse models,” Experimental Neurology,vol. 243, pp. 67–73, 2013.
[4] A. Godfrey, M. Leonard, S. Donnelly, M. Conroy, G. OLaighin, andD. Meagher, “Validating a new clinical subtyping scheme for deliriumwith electronic motion analysis,” Psychiatry Research, vol. 178, no. 1,pp. 186–190, 2010.
[5] D. Xu, Y. Yan, E. Ricci, and N. Sebe, “Detecting Anomalous Events inVideos by Learning Deep Representations of Appearance and Motion,”Computer Vision and Image Understanding, vol. 156, pp. 117–127,2016.
[6] D. Liciotti, T. Duckett, N. Bellotto, E. Frontoni, and P. Zingaretti,“Hmm-based activity recognition with a ceiling rgb-d camera,” inICPRAM - 6th International Conference on Pattern RecognitionApplications and Methods, February 2017.
[7] J. Soulas, P. Lenca, and A. Thepaut, “Unsupervised discoveryof activities of daily living characterized by their periodicity andvariability,” Engineering Applications of Artificial Intelligence, vol. 45,pp. 90–102, 2015.
[8] O. Aran, D. Sanchez-Cortes, M. T. Do, and D. Gatica-Perez,“Anomaly Detection in Elderly Daily Behavior in Ambient SensingEnvironments,” Human Behavior Understanding, pp. 51–67, 2016.
[9] H. Durrant-Whyte and T. C. Henderson, Multisensor Data Fusion.Berlin, Heidelberg: Springer Berlin Heidelberg, 2008, pp. 585–610.
[10] J. Wang and P. Domingos, “Hybrid Markov Logic Networks,” in 23National Conference on Artificial Intelligence, ser. AAAI’08, vol. 2.AAAI Press, 2008, pp. 1106–1111.
[11] M. Richardson and P. Domingos, “Markov logic networks,” Machinelearning, vol. 62, no. 1-2, pp. 107–136, 2006.
[12] P. Chahuara, A. Fleury, and M. Vacher, “Using Markov Logic Networkfor On-Line Activity Recognition from Non-visual Home AutomationSensors,” Ambient Intelligence, pp. 177–192, 2012.
[13] B. Yuan and J. Herbert, “Context-aware hybrid reasoning frameworkfor pervasive healthcare,” Personal and Ubiquitous Computing,vol. 18, no. 4, pp. 865–881, 2014.
[14] L. Smirek, G. Zimmermann, and D. Ziegler, “Towards UniversallyUsable Smart Homes – How Can MyUI , URC and openHABContribute to an Adaptive User Interface Platform ?” in CENTRIC2014 : The Seventh International Conference on Advances inHuman-oriented and Personalized Mechanisms, Technologies, andServices, no. c, Nice, France, 2014, pp. 29–38.
[15] N. Bellotto and H. Hu, “Computationally efficient solutions fortracking people with a mobile robot: an experimental evaluation ofBayesian filters,” Autonomous Robots, vol. 28, no. 4, pp. 425–438,2010.
[16] C. Dondrup, N. Bellotto, F. Jovan, and M. Hanheide, “Real-timemultisensor people tracking for human-robot spatial interaction,” inProc. of IEEE ICRA, Workshop on Machine Learning for SocialRobotics, 2015.
[17] S. Cosar, C. Coppola, and N. Bellotto, “Volume-based humanre-identification with rgb-d cameras,” in Int. Conf. on Computer VisionTheory and Applications (VISAPP), 2017.
[18] D. Goldberg and Y. Shan, “The Importance of Features for StatisticalAnomaly Detection,” 7th USENIX Workshop on Hot Topics in CloudComputing (HotCloud 15), pp. 1–6, 2015.
[19] M. Fernandez-Carmona and N. Bellotto, “On-line inferencecomparison with markov logic network engines for activityrecognition in AAL environments,” in IEEE International Conferenceon Intelligent Environments. IEEE, September 2016.
[20] T. Niemueller, G. Lakemeyer, and S. S. Srinivasa, “A genericrobot database and its application in fault analysis and performanceevaluation,” in 2012 IEEE/RSJ International Conference on IntelligentRobots and Systems, Oct 2012, pp. 364–369.
48