Entrepreneurship Training and Self-Employment among University ...
39
DISCUSSION PAPER SERIES Forschungsinstitut zur Zukunft der Arbeit Institute for the Study of Labor Entrepreneurship Training and Self-Employment among University Graduates: Evidence from a Randomized Trial in Tunisia IZA DP No. 7079 December 2012 Patrick Premand Stefanie Brodmann Rita Almeida Rebekka Grun Mahdi Barouni
Transcript of Entrepreneurship Training and Self-Employment among University ...

DI
SC
US
SI
ON
P
AP
ER
S
ER
IE
S
Forschungsinstitut zur Zukunft der ArbeitInstitute for the Study of Labor
Entrepreneurship Training and Self-Employment among University Graduates: Evidence from a Randomized Trial in Tunisia
IZA DP No. 7079
December 2012
Patrick PremandStefanie BrodmannRita Almeida
Rebekka GrunMahdi Barouni

Entrepreneurship Training and Self-Employment among University Graduates:
Evidence from a Randomized Trial in Tunisia
Patrick Premand World Bank
Stefanie Brodmann
World Bank
Rita Almeida World Bank and IZA
Rebekka Grun World Bank
Mahdi Barouni
CERES, Republic of Tunisia
Discussion Paper No. 7079 December 2012
IZA
P.O. Box 7240 53072 Bonn
Germany
Phone: +49-228-3894-0 Fax: +49-228-3894-180
E-mail: [email protected]
Any opinions expressed here are those of the author(s) and not those of IZA. Research published in this series may include views on policy, but the institute itself takes no institutional policy positions. The IZA research network is committed to the IZA Guiding Principles of Research Integrity. The Institute for the Study of Labor (IZA) in Bonn is a local and virtual international research center and a place of communication between science, politics and business. IZA is an independent nonprofit organization supported by Deutsche Post Foundation. The center is associated with the University of Bonn and offers a stimulating research environment through its international network, workshops and conferences, data service, project support, research visits and doctoral program. IZA engages in (i) original and internationally competitive research in all fields of labor economics, (ii) development of policy concepts, and (iii) dissemination of research results and concepts to the interested public. IZA Discussion Papers often represent preliminary work and are circulated to encourage discussion. Citation of such a paper should account for its provisional character. A revised version may be available directly from the author.

IZA Discussion Paper No. 7079 December 2012
ABSTRACT
Entrepreneurship Training and Self-Employment among University Graduates: Evidence from a Randomized Trial in Tunisia*
In economies characterized by low labor demand and high rates of youth unemployment, entrepreneurship training has the potential to enable youth to gain skills and create their own jobs. This paper presents experimental evidence on a new entrepreneurship track that provides business training and personalized coaching to university students in Tunisia. Undergraduates in the final year of licence appliquée were given the opportunity to graduate with a business plan instead of following the standard curriculum. This paper relies on randomized assignment of the entrepreneurship track to identify impacts on labor market outcomes one year after graduation. The analysis finds that the entrepreneurship track was effective in increasing self-employment among applicants, but that the effects are small in absolute terms. In addition, the employment rate among participants remains unchanged, pointing to a partial substitution from wage employment to self-employment. The evidence shows that the program fostered business skills, expanded networks, and affected a range of behavioral skills. Participation in the entrepreneurship track also heightened graduates’ optimism toward the future shortly after the Tunisian revolution. JEL Classification: O12, J24, I21, L26 Keywords: youth employment, self-employment, entrepreneurship training,
program evaluation, behavioral skills, soft skills Corresponding author: Rebekka Grun The World Bank 1818 H Street Washington, DC 20433 USA E-mail: [email protected]
* We thank Luca Etter for invaluable support and co-leadership during the implementation phase of the program, as well as Maaouia Ben Nasr and Leila Baghadi for excellent support during follow-up data collection. This study would not have been possible without the support of Ali Sanaa, Rached Boussema, Fatma Moussa and multiple staff in the Tunisian Ministère de Formation professionnelle et de l’Emploi (MFPE) and the Ministère de l’Enseignement supérieur et de la Recherche scientifique (MERS). We thank Hosni Nemsia and his team for effective data collection. We acknowledge the financial support of the Spanish Impact Evaluation Trust Fund and of the Gender Action Plan at the World Bank. We are very grateful for useful comments provided by participants in the Tunis World Bank workshop on activation, as well as seminar participants at the World Bank and IZA. We also thank colleagues who provided comments including Harold Alderman, Najy Benhassine, Roberta Gatti, David Margolis, Daniela Marotta, Eileen Murray, Berk Ozler, Bob Rijkers and Insan Tunali.
2
1. Introduction
Youth employment is at the center of the policy agenda around the world. The 2013 World
Development Report emphasizes that employment not only matters for individuals’ welfare, but
also for social cohesion (World Bank, 2012a). The Arab Spring highlighted the dramatic
consequences of high youth unemployment in countries such as Egypt or Tunisia. Throughout
most of the Middle East and North Africa, youth unemployment rates are particularly high
among university graduates, and policymakers often look for innovative and effective policies to
facilitate the transition of youth from education to work (World Bank, 2012b).
In economies characterized by constrained labor demand from the private sector and high rates
of youth unemployment, entrepreneurship-support interventions targeting students are promising
policy options. Entrepreneurship training has the potential to enable graduates to gain skills and
create their own jobs, as well as possibly also better align their skills with private employers’
needs. Some OECD countries are providing entrepreneurship education to university students
(Oosterbeek et al., 2008). Yet despite the potential of entrepreneurship training, evidence on how
such programs shape students’ skills and facilitate entry into self-employment remains thin.
Tunisia has long experienced high unemployment, particularly among new university graduates.
For instance, 46 percent of graduates of the 2004 class were still unemployed eighteen months
after graduation (MFPE and World Bank, 2009). Recent data show that graduates’
unemployment has been rising. Based on the Tunisian Labor Force Survey, unemployment
among youth holding a university degree increased from 34 percent in 2005 to 56 percent in
2011. In this context, Tunisia has attempted various reforms aiming to promote employability or
self-employment among university graduates. This paper presents results from a randomized
control trial evaluating a unique reform: the introduction of an innovative entrepreneurship track
in the university curriculum.
In 2009, Tunisia mainstreamed a new entrepreneurship track into the applied undergraduate
(licence appliquée) curriculum. Students enrolled in the last year of their licence appliquée were
invited to apply to the entrepreneurship track, which entailed business training as well as
3
personalized coaching sessions.1 Students could then graduate by writing a business plan instead
of a traditional undergraduate thesis. Upon graduation, participants were invited to submit their
business plans to a competition (concours des meilleurs plan d’affaires “entreprendre et
gagner”). The fifty winners of the competition became eligible to receive seed capital to
establish their business.
In this paper, we identify the impact of the entrepreneurship track on beneficiaries’ labor market
outcomes by relying on randomized assignment. Half of the 1,702 students who applied to the
program in 2009/10 were randomly selected to participate in the entrepreneurship track while the
other half were assigned to the standard curriculum. Students graduated in June 2010 and were
re-interviewed between April and June 2011. We show that the entrepreneurship track
significantly increased the rate of self-employment among university graduates approximately
one year after graduation, but that the effects are small in absolute terms, ranging from 1 to 4
percentage points. Given the low prevalence of self-employment in the control group, these
small absolute effects imply that program participants were on average 46 to 87 percent more
likely to be self-employed compared with graduates from the control group.2 However, the
employment rate among beneficiaries remained unchanged, which in partial equilibrium points
to a substitution from wage employment to self-employment. The evidence suggests that the
program affected employment outcomes through a range of channels. In particular, it fostered
business skills, expanded networks, and shaped behavioral skills. Participation in the
entrepreneurship track also heightened graduates’ sense of opportunities and optimism towards
the future shortly after the Tunisian revolution.
To our knowledge, the analysis of the Tunisian entrepreneurship track provides the first
experimental evidence on the effectiveness of entrepreneurship education targeted to university
students3, as well as the first evidence on entrepreneurship-support interventions in the Middle
East and North Africa (Angel-Urdinola et al., 2010). Furthermore, we analyze the effectiveness 1 The program was implemented in all Tunisian universities delivering licences appliquées, including Ez-Zitouna, Jendouba, Gabès, Gafsa, Tunis, Kairouan, Mannouba, Monastir, Carthage, Sfax, Sousse, Tunis, and Tunis El-Manar. 2 As we will discuss below, the rate of self-employment in the control group is 4%. This is in line with the low rate of self-employment among university-educated in Tunisia in general. Among 25 – 34 year old with a university degree, 4.6 percent were classified as independent workers and 5.6 percent as employers according to the Labor Force Survey of 2010. 3 Oosterbeek et al. (2008) analyze the impact of entrepreneurship education on students’ entrepreneurship competencies and intentions in the Netherlands. They find few positive effects, but their study used a quasi-experimental approach with a small sample size and high attrition rates.
4
of the training not only in facilitating entry self-employment, but also in shaping a range of
behavioral skills.
As such, this paper contributes to different strands of the literature. For instance, it relates to
studies analyzing the effectiveness of skills training programs to foster employability and
productivity among youth in developing countries. Most of the existing evidence comes for Latin
American programs and tends to focus on vocational training for at-risk youth (Ibararran and
Rosas, 2008). Furthermore, few papers rely on experimental methods in developing country
settings (see Almeida et al., 2011a, Angel-Urdinola et al., 2010, Betcherman et al., 2004, 2007,
and Kluve et al., 2010 for recent reviews). Attanasio et al. (2011) study the Jóvenes en Acción
program in Colombia. They find that vocational training programs significantly increased the
probability of employment for women and increased the level of income for both men and
women. In particular, women earned about 18 percent more than they would have without the
program and men earned 8 percent more. Most of the effects are driven by the on-the-job
training component, with classroom training playing a much smaller role in promoting
employability. Card et al. (2011) study the effectiveness of a youth employment program in the
Dominican Republic. They do not find any significant effects on employment, but find positive
effects at the margin on labor earnings shortly after the program finished. Recent studies have
assessed the effectiveness of programs aiming to shape soft skills, which may be particularly
malleable among youth (Almlund et al., 2012). For instance, Groh et al. (2012) present evidence
from Jordan on the effectiveness of wage subsidies and soft skills training in helping female
community college graduate find employment. They show that wage subsidies are effective in
increasing employment in the short-term, but that a soft skills training program has no average
impact on employment. Our paper complements these studies but is unique in using a
randomized approach to analyze the impact of providing entrepreneurship training to young
university students and focus on their decision to enter self-employment.
This paper also relates to studies analyzing the effectiveness of entrepreneurship-support
interventions in developing countries. Entrepreneurship is a key building block of productivity
growth (Baumol, 1968), and a large share of the labor force in most developing countries is self-
employed (Gollin, 2002; Banerjee and Duflo, 2008). Evaluations of entrepreneurship-support
interventions such as business training and grants have shown that they can be effective in

5
fostering self-employment and earnings. However, most of the evidence to date has focused on
either existing business or on individuals that are low skilled (McKenzie and Woodruff, 2012).
In contrast, our paper is to our knowledge the first study focusing on youths’ transition from
education to work, and entry into self-employment. Previous studies often focus on the activation
of low productivity workers, the inactive, or the unemployed. For example, Almeida and Galasso
(2010) or De Mel et al. (2010) analyze the effects of business training on a sample of potential
business owners, while Klinger and Schündeln (2011) study entrepreneurs with existing
businesses of about ten employees on average. In Argentina, the Microemprendimientos
Productivos project provides financial support in the form of in-kind grants to finance inputs and
equipment with the aim of jumpstarting self-employment and reducing dependence on welfare
payments. Almeida and Galasso (2010) show that combining entrepreneurship support and micro
grants was effective in increasing self-employment, particularly for women with related labor
market experience. In Sri Lanka, De Mel et al. (2012) find that the ILO “Start and Improve your
business” training program sped up the process of opening a business among women who were
interested in starting enterprises. In addition, they also find improved profitability and better
practices in these new businesses. When the training was targeted to women already in business,
they find more limited changes in business practices but no impacts on profitability. Klinger and
Schündeln (2011) study the effect of entrepreneurship training provided by an NGO on firm
outcomes in Central America. Using a discontinuity design, they find that receiving business
training significantly increased the probability that training participants would start a business or
expand an existing business. The program seemed to be more effective among women when they
also won a monetary prize. A set of studies looks at the effectiveness of business training
targeted to micro finance clients. Karlan and Valdivia (2011) study the impact of training
provided by FINCA in Peru, a program targeted at improving business practices. Results show
that the program was not associated with significant increases in sales, profits, or employment.
Drexler et al. (2010) compare two training programs on mostly female micro finance clients in
the Dominican Republic. They show that a small training program may have improved business
practices and sales in bad weeks, but did not have a significant impact on average sales. Bruhn
and Zia (2011) randomized the business training provided by a local NGO - the Entrepreneurship
Development Center (EDC) - for its microfinance clients in Bosnia-Herzegovina. They find

6
some improvements in business practices, but no increases in business profits or in business
survival rates.
Finally, a number of recent papers attempt to profile successful entrepreneurs in terms of
preferences or behavioral skills (Elston et al., 2005, Djankov et al., 2006; de Mel et al., 2010).
Unlike our paper, only a few studies have provided evidence on employment programs that
shape these behavioral skills or attitudes. Carneiro et al. (2010) show that that participants in
Chile Solidario have greater self-esteem and higher perceived self-efficacy in the labor market as
well as greater optimism towards the future.4 In Jordan, Groh et al. (2012) find that a soft skills
training course improved female graduates’ mental health and positive thinking. Blattman et al.
(2011) show that in Northern Uganda, the NUSAF Youth Opportunities Program that provides
cash grants for investments in seed capital or vocational training had some limited effects on
dimensions of social cohesion. Likewise, Blattman and Annan (2011) show that reintegration
and agricultural livelihoods program for high-risk Liberian youth have positive impacts on social
inclusion, through improvements in social engagement, citizenship and stability. In this paper,
we measure how the entrepreneurship training program affected individual’s behavioral skills
and their attitudes towards the future.
The rest of the paper is organized as follows. Section 2 briefly sets the country context and
describes the entrepreneurship track. Section 3 describes the randomized assignment and take-up
of the entrepreneurship track. Section 4 describes the empirical strategy. Section 5 discusses the
main effects of the program on labor market outcomes, while Section 6 discusses some of the
main channels behind these impacts. Section 7 concludes.
2. The Tunisian entrepreneurship track: Business training and coaching
In Tunisia, both the graduation rate from university and the unemployment rate among tertiary
educated youth have been increasing steadily. Access to post-secondary education has soared
over the past decade. Gross enrollment rates in tertiary education reached 34 percent in 2009, up
from 12 percent in 1995 (EduStats, 2011). At the same time, unemployment rates among youth
with a higher education degree have reached alarming levels. According to data from the 4 An ongoing World Bank evaluation of the youth training program Juventud y Empleo, a comprehensive training program in the Dominican Republic shows similar results: preliminary evidence shows significant effects on future expectations, job satisfaction, and job search attitudes.

7
Tunisian Labor Force Survey, unemployment among youth (aged 29 or below) holding a
university degree increased from 34 percent in 2005 to 56 percent in 2011. These figures are
suggestive of a long education-to-work transition for university graduates. University graduates
constitute a large share of unemployed youth in Tunisia. While tertiary educated youth (15-29
years old) made up less than 16 percent of those employed in the Tunisian labor market in 2010,
they accounted for over 34 percent of the unemployed. In this context, the graduates’
employment problem has become one of the main concerns for policymakers in Tunisia.
As part of a Development Policy Loan aiming to support a broad set of employment policies in
Tunisia, an innovative entrepreneurship track was introduced into the tertiary curriculum in
academic year 2009/10. Up to then, during the last semester of the applied undergraduate
curriculum, students took an internship and wrote an academic thesis as graduation requirements.
In June 2009, the Ministry of Education and Higher Education passed a reform creating an
entrepreneurship track where students would receive business training and coaching to develop a
business plan. In August 2009, the Ministries of Education and Higher Education and of
Vocational Training and Labor jointly signed an order to allow students to graduate by
submitting their business plan instead of a traditional thesis. The newly established
entrepreneurship track aimed primarily at increasing self-employment and fostering an
entrepreneurship culture among university graduates, as well as more broadly at improving
participants’ employment outcomes.
To increase students’ awareness of the new track, communication campaigns took place on
campus and through the media to inform students about the newly introduced alternative to the
standard curriculum. Once in the entrepreneurship track, students were offered support for
developing a business plan through business training and personalized coaching. The
entrepreneurship track provided students with: (i) entrepreneurship courses organized by the
public employment office; (ii) external private sector coaches, mainly entrepreneurs or
professionals in an industry relevant to the student’s business idea; and (iii) supervision from
university professors in development and finalization of the business plan. For each student, the
final product of the program was a comprehensive business plan that served as an undergraduate
thesis. Participants were also given the option to submit their business plan to a competition,
with a chance to win seed capital to fund their project.
8
Selected students participated in the program between February and June 2010, starting with
intensive business training to develop, modify, or refine an initial business idea. Students took
twenty days of full-time intensive training at local employment offices (Agence Nationale
d’Emploi et de Travail Indépendent, ANETI) between February and March 2010. The training
was called Formation Création d’Entreprise et Formation des Entrepreneurs (CEFE) and was
already part of the active labor market menu offered by ANETI. The training was conducted in
small groups and included practical research on the ground, aimed at fostering participants’
behavioral skills, business skills and networking skills.
The first part of the training consisted of four modules: (a) for the person, aimed at developing an
entrepreneurship culture and behavioral skills; (b) for the project, aimed at developing business
ideas through brainstorming and followed by SWOT (strength, weaknesses, opportunities, and
threat) analysis to isolate the best project idea for each participant; (c) for management, aimed at
general management principles (including leadership, partnership choice, organization, time
management, and planning tools); and (d) for marketing, aimed at identification of the relevant
market and market research (competition, clients, technology standards, etc.) as input into cost
analysis.
Following this initial part of the training program, participants had the opportunity to present
their ideas and get feedback from bankers and experts. After project ideas were refined to reflect
this feedback, students participated in three additional modules on information research, business
plan and networks: (a) information research -- participants had three days to research facts
pertaining to implementation of their projects on the ground; (b) business plan training --
participants were taught how to estimate key parameters, such as investments (inception costs
and financing), revenues, and business expenses (purchases, personnel costs, imports, financing
expenses, amortization, etc.); and (c) building networks -- at least five resource persons
(business specialists) were invited to give talks.
Students were then assigned a personalized coach and received supervision from a university
professor to develop the business plan. Coaches were private sector entrepreneurs or specialized
coaches from ANETI or the Ministry of Industry’s network of start-up offices (Agence de
Promotion de l’Industrie, API). Students were expected to participate in eight coaching sessions,

9
either individually or in small groups. Coaching took place from April to June 2010. In parallel,
students also received supervision from one of their university professors.
In June 2010, the business plans were completed and defended by students at their university as
part of the graduation requirements. After the defense, program participants were eligible to
submit their business plan to a national business plan thesis competition. The jury selected fifty
winners who were eligible to receive seed capital for establishing the business outlined in their
business plans. The first five winners were eligible for seed capital of 15,000 Dinars each
(approximately US$10,000), the next twenty winners, 7,000 Dinars; and the last twenty-five
winners, 3,000 Dinars.
3. Randomized assignment and entrepreneurship track take-up
In 2009/10, 18,682 students were enrolled in the third year of licence appliquée in Tunisian
universities. All these students were invited to fill in an application form for the entrepreneurship
track in November or December 2009. In total, 1,702 students (or 9.1 percent of all eligible
students nationwide) applied to participate in the newly established entrepreneurship track. Of
those, 1,310 students applied individually and 392 applied in pairs, so that in total, 1,506 projects
were registered.
Table 1 shows the number of enrolled students and applicants by gender and university. The
third column shows the distribution of the application rate. The last two columns present the
distribution of all students enrolled in the third year of licence appliquée in 2009/10 and of
applicants, by gender and respectively by university. Two-thirds of the applicants were women.
While this is a high participation rate for women, the program did not especially attract women
as they were equally represented in the overall population of licence appliquée students.
Demand for the program varied across universities. Four universities account for 66 percent of
participants to the entrepreneurship track: Table 1 shows that the application rate to the program
was particularly high at the universities of Gafsa (28.7 percent), Monastir (16.3 percent), Sfax
(14.2 percent), and Jendouba (13.9 percent). By contrast, demand was relatively low among
students from Tunis El Manaar (1.2 percent) and in Manouba (0.7 percent). Differences in
application rates are likely explained by regional variations in the implementation of the
10
information campaigns and intensity of advertisement about the program5, as well as regional
variations in youth unemployment and perceived employment opportunities.6
Baseline data for the impact evaluation are obtained from two sources. An application form was
collected in November and December 2009. Additional information (particularly on individual
entrepreneurship traits) was collected through a phone survey in January and February 2010.
The baseline survey suggests that the intervention responded to a strong demand from students
and that applicants had high expectations for their participation in the program. 85 percent of
applicants already had a project idea at the time of application. Students had various reasons for
applying: 72 percent of applicants listed their willingness to realize one of their project ideas as
the main reason; 56 percent of students indicated that they applied to have more flexibility; 30
percent to gain experience to find a job; 29 percent due to the lack of salaried jobs; and 12
percent because of family tradition. Applicants’ expectations were high: 88 percent of applicants
expected that the intervention would facilitate their insertion in the labor market, and 89 percent
expected to have higher earnings thanks to the intervention.
The impact evaluation relies on randomized assignment among applicants to the
entrepreneurship track to estimate the causal impact of the program. Given the oversubscription
to the program, half of the applicants were randomly assigned to the entrepreneurship track and
the other half were assigned to continue with the standard curriculum. Randomized assignment
was conducted at the project level, stratified by gender and by the subject students were reading
for (divided into fourteen groups7). 757 projects were assigned to the treatment group (658
individual projects, and 99 projects in pair). 742 projects were assigned to the comparison group
(652 individual projects; 97 projects in pairs).
5 University professors played an instrumental role in informing students about the program. 84 percent of all applicants heard about the program through professors, 39 percent from posters, and 17 percent from other students, friends, and relatives. 6 Application to the entrepreneurship track was particularly high in regions with the highest unemployment. For instance, Gafsa exhibited the highest youth unemployment rate (close to 50 percent) and also had the largest application rate to the entrepreneurship track (28.7 percent of all eligible students in licence appliquée). Similarly, Jendouba has the second highest unemployment rate (35 percent) and a participation rate to the entrepreneurship track of 13.9 percent. 7 The fourteen groups of subjects were: Economics and Finance; Accounting; Business Administration; Marketing; Humanities; Languages; Science; Technical; Telecommunications; Civil Engineering; Informatics; Sports and Tourism; Food/Agriculture, and Other.

11
After the baseline data was collected and the randomization performed, students participated in
the entrepreneurship track between February 2010 and June 2010, when they graduated. Follow-
up data were collected through face-to-face interviews between April and June 2011,
approximately nine to twelve months after the end of the academic year.8 The instrument
included questions related to socio-economic characteristics and a detailed labor module. The
survey also collected a range of other indicators including information on aspirations for the
future, personality traits, and behavioral skills related to entrepreneurship. Thorough tracking
procedures led to low non-response rates at follow-up9: 92.8 percent of the 1,702 applicants were
tracked, a low attrition rate given the high mobility of the population of graduates.10 Importantly,
attrition was balanced and uncorrelated with treatment status. 11
Table 2 presents the average baseline characteristics of the treatment group (assigned to the
entrepreneurship track) and the control group (assigned to the standard curriculum), as well as
differences between the two at baseline.12 Randomization achieved good balance. There were
few systematic differences between participants and non-participants and the differences were
quantitatively small.13 Empirical analysis will control for the few characteristics that are
statistically different between the two groups at baseline.
Administrative records from ANETI show imperfect compliance with assignment to the
treatment group. Of the 856 students who applied and were randomly assigned to the
entrepreneurship track, 67 percent completed the business training at the local employment
office, and 59 percent completed both business training and coaching. Overall, 41 percent
dropped out of the program prior to completing both training and coaching. The magnitude of 8 In October 2010, qualitative data were collected to gather students’, coaches’, and professors’ perceptions on the implementation of the intervention. 9 Detailed contact information was collected in the baseline surveys. This included students’ address, email address, landline and cell phone numbers, as well as their parents’ address, landline and cell phone numbers. Most students register at employment offices upon graduation, and contact information (phone numbers and address) from the employment office database was also collected and merged with the data (see World Bank and MFPE, 2012). 10 The attrition rate is lower to the one achieved for other surveys in the country. For instance, the attrition rate for the 2005 Tunisia graduate tracer survey was 11 percent. Oostenbeck et al. (2008) have an attrition rate of 56 percent in their study of entrepreneurship education for university students in the Netherlands. 11 Attrition in the full baseline sample was 7.2 percent at follow-up. At baseline, 10.1 percent of applicants could not be reached for the complementary phone survey conducted in January and February 2010. Combined attrition in either this baseline phone survey or the follow-up survey collected in 2011 is 15.9 percent. Attrition in both surveys was 1.4 percent. All of these attrition indicators were balanced across treatment and comparison groups. 12 Table 2 is presented for the effective sample used for estimations and composed of the 1,580 students that could be tracked at follow-up. Results are almost identical when using the full baseline sample of 1,702 students. 13 For example, participants seemed to be on average older and had more years of experience than non-participants.

12
these drop-out rates are consistent with other similar entrepreneurship training program analyzed
in the literature, such as Groh et al. (2012) or de Mel, McKenzie and Woodruff (2012).
Anecdotal evidence from qualitative interviews with graduates, coaches, and professors points to
a number of reasons for students dropping out of the entrepreneurship track, including some lack
of information and implementation challenges. The program was being implemented for the first
time, and in some universities, students were informed late or insufficiently of the modalities of
their participation in the entrepreneurship track.14 The quality of the training and coaching
sessions also varied both by training location and by coach or facilitator.15
Table 3 presents marginal effects from the estimation of a logit model to describe the profile of
students who complied with their assignment to the entrepreneurship track and completed it.
Students who had a project idea at the time of application were more likely to comply with their
assignment to the treatment group by completing the business training and personalized coaching
sessions. In contrast, male students were more likely to drop out, and so were students in an
Economics, Finance, or Business stream.16 These students may have been more familiar with the
entrepreneurship training content and as such may have perceived a relatively lower value-added
of the entrepreneurship track compared to students from other subjects. Variations in drop-out
rates across regions are also observed: compared to Tunis, compliance with treatment was lower
in Sfax, but higher in Sousse, Monastir, Kairouan, Gafsa, and Jendouba, which are also the
regions with relatively higher unemployment rates.
Administrative data reveal high compliance for students assigned to the control group. The
twenty days of CEFE training was regularly provided by employment offices so that some
control students may also have been able to take the training after graduating, although
personalized coaching would not have been available to them. Administrative and survey data
show that take-up of the CEFE training was low in the control group, with only twenty-nine
students (or 3.4 percent of the control group) completing the CEFE training after graduation. 14 A student from Gabes, for example, reported that she was asked by the employment office to decide whether she wanted to remain in the traditional track or take up the entrepreneurship track before she fully understood what the latter entailed. As a result, she eventually decided to drop out of the entrepreneurship track. 15 Given the high expectations at the onset of the program, some students were disappointed in the training and dropped out. Other students dropped out due to exams conflicting with the twenty days of training when attendance was mandatory. 16 Data from a graduate tracer study in Tunisia suggest that graduates from Economics, Business, and Law were particularly prone to long unemployment spells after graduation (MFPE and World Bank, 2009).

13
4. Empirical identification strategy
4.1 Hypotheses
The first and main hypothesis considered in this paper is whether the training and coaching
delivered as part of entrepreneurship track increased self-employment among graduates. We test
whether the entrepreneurship track was effective at promoting self-employment by using three
indicators. The first indicator captures whether the respondent was self-employed at any point
over the 12 months prior to the survey. The second indicator relies on a 7 day recall consistent
with official definitions in Tunisia. The third indicator is more conservative as it uses a 7 day
recall but excludes individuals self-employed in seasonal activities. Importantly, none of the self-
employment indicators includes family workers.
As a second hypothesis, we test whether the entrepreneurship track increased overall
employment among beneficiaries. On the one hand, skills acquired during the entrepreneurship
training may be transferable across occupations. The entrepreneurship track can potentially equip
graduates with skills valued by employers and as such increase students’ probability of finding
wage jobs. On the other hand, the assignment to the entrepreneurship track may induce a
substitution away from wage employment. For instance, the program may negatively affect the
probability that participants find wage jobs in the private sector, either because it equips students
with the wrong types of skills for wage employment or because the standard curriculum may be
more valuable to find wage jobs since it includes writing an academic thesis and undertaking an
internship. To shed light on these potential mechanisms, we estimate the impact of the
entrepreneurship track on overall employment as well as its two main components, self-
employment (as above) and wage employment. We also measure the impact of the interventions
on other variables capturing employment status (unemployed, studying, inactive). All these
indicators are based on a 7 day recall period, consistent with official definitions in Tunisia.
Finally, we estimate the impact of the intervention on some characteristics of employment,
including hours worked, earnings, and self-reported reservation wage for public and private
sector wage employment, as well as social security coverage.
Third, we analyze a series of mechanisms through which the intervention can potentially affect
employment outcomes. These different channels relate to the content of the business training
14
described in section 2. The training aims to provide participants with business skills, technical
knowledge and experience directly useful to produce a business plan. It connects beneficiaries to
a wider social network, including entrepreneurs and bankers. In parallel, a component of the
training curriculum aims to shape students’ behavioral skills and personality. Finally, the
entrepreneurship training improves participants’ access to information about credit. Participants
in the entrepreneurship track also have the possibility of obtaining a financial prize if they enter
and win the business plan competition. Therefore, we estimate the impact of the intervention on
intermediary outcomes related to business skills, networks, behavioral skills, and access to credit
with the objective of teasing out the channels through which the entrepreneurship track affected
employment outcomes.
For each set of outcome and intermediary outcome variables, we present both intent-to-treat
(ITT) and treatment-on-the-treated (TOT) estimates. Results are highly consistent across the two
sets of estimates. ITT estimates constitute our preferred set of estimates since they capture the
impact of offering business training and coaching independently of actual take-up.
4.2 Intention to treat (ITT)
Identification of program impacts relies on the randomized assignment of applicants to the
entrepreneurship tracks to treatment and control groups. We first present intent-to-treat (ITT)
estimates, obtained by comparing average outcomes for the treatment and comparison groups at
follow-up. ITT estimates capture the impact of offering business training and coaching
independently of actual take-up. To obtain ITT estimates, we estimate the following empirical
model using Ordinary Least Squares (OLS):
𝑌𝑖 = 𝛽𝑇𝑖 + γ𝑋𝑖 + 𝜋𝑖𝑠 + 𝜀𝑖 (1)
where 𝑌𝑖 is the outcome of interest for student i at follow-up, Ti is a binary variable for being
randomly assigned to the treatment group, Xi is a set of control variables, πis are fixed effects for
each randomization strata (by gender and the fourteen subject groups) and εi is a mean-zero
error term.17
17 We include a binary variable for each randomization strata to increase power (Bruhn and McKenzie, 2009).
15
We present results for three specifications. In specification I, X1i includes a constant and a set of
control variables from the baseline application form, including age at first job, previous
experience in self-employment, prior experience with projects, prior experience in helping an
entrepreneur, and mother’s employment status. Standard errors are clustered by strata (university
and gender). In specification II, Xi contains a constant and an expanded set of controls (X2i)
including those from the baseline application form as well as additional variables from the
baseline phone survey capturing behavioral skills (patience, willingness to take risk,
impulsiveness, tenacity, and sense of achievement). This expanded set of controls reduces the
effective sample size to 1,432 due to combined attrition in the baseline phone survey and the
follow-up survey. Standard errors are again clustered by strata. Finally, results from specification
III are obtained by using the same set of control variables as for specification I (X1i) and standard
errors clustered by the governorate where students live at baseline.
4.3 Treatment on the treated (TOT)
In addition to ITT estimates, we also present and briefly discuss treatment on the treated (TOT)
estimates. TOT estimates capture the impact of the entrepreneurship track for the students who
complied with their assignment to the treatment or control group. The last section has
documented that not all students assigned to the treatment group remained in the program (and a
few control students took up the training component of the entrepreneurship track). TOT
estimates account for this noncompliance and isolate the impact of actually receiving the
intervention for students who complied with their original assignment to the treatment or control
group. In the empirical analysis, compliance for students in the treatment group is defined as
completing the business training and receiving coaching18. TOT estimates are derived for a
range of outcomes of interest by instrumenting actual completion of the entrepreneurship track
with the randomized assignment to the entrepreneurship track.
The first stage isolates the effect of being randomly assigned to the entrepreneurship track on
completing the entrepreneurship training and receiving coaching. The impact of the treatment on
the likelihood of completing entrepreneurship training and attending coaching sessions can be
estimated via OLS regression for the following equation: 18 Results are very similar when compliance is defined as completing the business training only and are not presented here.

16
𝑈𝑖 = 𝛽𝑇𝑖 + 𝛾𝑋𝑖 + 𝜋𝑖𝑠 + 𝜀𝑖 (2)
where Ui is the information (from administrative records) on whether student i completed
entrepreneurship trainings and received coaching during academic year 2009/2010, Ti is an
indicator variable for randomized assignment to the treatment group, Xi is a vector of controls,
πis are strata fixed-effects, and εi is a mean-zero error term. The coefficient β indicates the causal
effect of being selected for the entrepreneurship track via lottery on the likelihood of actually
completing the entrepreneurship track.
In a second stage, the effect of increased take-up of business training and coaching sessions on
employment (and other) outcomes is estimated. Randomized assignment to the entrepreneurship
track generates a large and exogenous increase in program take-up in the treatment group. The
exogenous variation in take-up predicted in the first stage (equation (2)) can be used to estimate
the TOT estimates per the following equation:
𝑌𝑖 = 𝜃Û𝑖 + 𝜉𝑋𝑖 + 𝜋𝑖𝑠 + 𝜀𝑖 (3)
where Yi is the outcome of interest at follow-up of individual i and Û𝑖 is the predicted program
take-up from the first stage. The coefficient θ gives the TOT, which is the impact of actually
taking up entrepreneurship training or coaching for students who complied with their assignment
to the treatment or control group.
TOT estimates are local average treatment effects and should be interpreted as such. They are
estimated for students who complied with their assignment to the treatment group and actually
took up the program because they were selected to participate. The previous section showed the
characteristics of the compliers and revealed that students who dropped out had some different
characteristics. Very few students in the control group took the entrepreneurship training after
graduation. In this sense, TOT estimates essentially produce the average impact of the program
for students who had the characteristics of compliers.
Importantly, almost all the results below are robust across ITT and TOT estimates, with TOT
estimates of larger magnitude as would be expected. Given the consistency of the results across
both sets of estimates, we mainly focus on discussing ITT estimates since they are more easily
interpreted and directly policy-relevant.

17
5. Results: Labor market outcomes
This section presents program impacts on the main labor market outcomes by estimating
equation (1) with OLS and equation (3) with two-stage least squares. The main findings are
reported in Table 4 for a series of labor market outcomes including self-employment (Panel A),
employment status (Panel B), and proxies for employment characteristics such as whether the
individual has a contract, is covered by social security, labor earnings or the number of hours
worked (Panel C). In Table 4, the first column reports the number of observations; the second
and third columns report the sample means for the dependent variable in the control and
treatment groups. The next 4 columns present results from specification I followed by
specifications II and III. ITT estimates are in columns (1), (3) and (5), TOT estimates in columns
(2), (4) and (6).
5.1 Impacts on self-employment
Estimates show that the intervention increased self-employment among program participants
approximately one year after graduation. The positive impact of the entrepreneurship track on
graduates’ self-employment holds across a range of indicators, such as whether the individual
reported having been self-employed in any activity over the last year, whether he/she was self-
employed in any activity last week, or whether he/she was self-employed in permanent activities
last week. All indicators exclude family workers. Focusing on self-employment in any activity in
the last 7 days (the official definition of self-employment in Tunisia), the ITT estimate shows a 3
percentage point increase in the probability of being self-employed. For those students who
actually completed the program (training completion and coaching), the TOT estimate reveals a
5 percentage point increase in the likelihood of being self-employed in any activity in the last
week.
While increases in self-employment are robust across specifications and indicators, the estimated
effects are small in absolute terms, ranging for 1 to 4 percentage points for ITT estimates. Since
the rate of self-employment is low in the control group to start with, even these small absolute
impacts lead to relatively large effect sizes. Indeed, the average self-employment rate in the
control group is 4.4 percent. Therefore, a 3 percentage point increase in self-employment in any
activity over the last week is equivalent to a 68 percent increase over the self-employment rate in

18
the control group. The average effect sizes for program impacts on self-employment are
displayed in Panel D of Table 4. Average effect sizes range from 46 to 87 percent depending on
the specification and self-employment indicator.
5.2 Impacts on employment status
Table 4 (Panel B) makes clear that young university graduates are particularly vulnerable to the
lack of salaried jobs. Only 28 percent of students in the control group were employed one year
after graduation, contrasting with 48 percent being unemployed.19
While the program had impacts on self-employment, we find no evidence that the program
significantly affected overall employment as captured by the likelihood of being employed in the
last 7 days. In fact, estimates are negative and point to a reduction in the probability that program
beneficiaries hold salaried employment. Even though the effect is not significant, the decrease in
wage employment is of the same magnitude as the increase in self-employment. Similar to
findings in Fairlie et al. (2012) in the US, these results suggest that the program changed the
composition of employment by inducing a substitution from wage employment to self-
employment for participants in the entrepreneurship track.
Importantly, the substitution from wage to self-employment is a partial equilibrium effect, and
does not take into account potential general equilibrium effects. Indeed, the shift from wage
employment into self-employment may free up job opportunities for non-participants, therefore
potentially leading to higher employment overall in general equilibrium. The impact evaluation
design would not allow identifying such general equilibrium effects.
Overall, while the program increased graduates’ self-employment in a context where the supply
of jobs is limited, the results show that the entrepreneurship track did not promote graduates’
chances of finding a salaried job nor did it seem to have any impact on beneficiaries’ probability
of being employed in any activity one year after graduation. On the one hand, this is explained
by the fact that the entrepreneurship track is only effective in increasing self-employment for a
limited (although significant) number of students. On the other hand, the evidence does not
19 These results are comparable with data from a tracer survey of university graduates from the class of 2004, which found that 46 percent of graduates were still unemployed 18 months after graduation (MFPE and World Bank, 2009).

19
support the hypothesis that the entrepreneurship track would also better align students’ skills
with employers’ needs and improve their prospect of finding wage jobs. On the contrary, the
results suggest trade-offs between policies that aim to promote self-employment and policies that
aim to facilitate the transition from education to wage jobs.
5.3 Impacts on employment characteristics
Table 4 (Panel C) presents the impacts of the entrepreneurship track on employment
characteristics, including hours worked, earnings, having a contract, being covered by social
security, working in a large firm, and reservation wages. The variables capturing the
characteristics of employment (including earnings) contain zeros for those individuals not
working. Two important outcomes considered in the analysis are whether the worker is
employed in a job with social security coverage and whether he/she has a written contract. These
variables are binary; i.e., they take a value of one if an individual is employed with social
security coverage or has a written contract and zero if he/she is not working at all or works
without coverage or without a written contract. This distinction allow us to shed some light on
the program’s potential effect on entry into higher-end, formal sector jobs.
The results show that the entrepreneurship track did not promote higher quality jobs among
participants. In particular, there were no significant program impacts on employment in the
formal sector, firm size, hours of work, or earnings. These results are consistent with the findings
that overall employment remained unchanged.20
The results show weak but consistent evidence that the program increased students’ reservation
wage for private sector jobs (i.e. the minimum wage at which an individuals would accept a job
offer), but did not affect their reservation wage for public sector jobs. Studies have shown that
the earnings and security provided by public sector jobs are highly valued by youth, a factor that
contributes to high unemployment and inactivity rates in Tunisia (World Bank, 2012b). As such,
finding higher reservation wage for private jobs is consistent with the program leading to greater
valuation of self-employment or entrepreneurial activities in general. This result can contribute
20 Conditional on being wage-employed, i.e., only looking at employed individuals, the results suggest that program beneficiaries hold slightly better quality jobs, as they were more likely to have full-time contracts, and less likely to be supported by a wage-subsidy (stages d'Initiation à la Vie Professionnelle “SIVP”), but more likely to hold term contracts (contrats à durée déterminée “CDD”).
20
to explain the partial substitution from wage to self-employment documented above. It also
suggests that self-employment is a substitute for private sector jobs but not with public sector
jobs.21
6. Channels of impact
The previous section documented that the program increased self-employment among
participants, and suggested a partial substitution from wage employment to self-employment.
This section attempts to tease out the channels through which the program affected employment
outcomes. This is done by presenting impacts on intermediary outcomes such as: (i) business
skills; (ii) networks; (iii) preference and behavioral skills; (iv) attitudes towards the future; and
(v) access to credit. Tables 5, 6 and 7 display results for these channels and the same
specifications as in Table 4.
6.1 Business skills
Table 5 (Panel A) presents evidence that the intervention produced strong impacts on
participants’ self-reported business skills. A major objective of the entrepreneurship track was to
equip students with technical knowledge on how to produce a business plan and practical
experience in developing a project.
Results show that beneficiaries report having more practical experience in realizing projects –
the average ITT was a 10 percentage point increase in practical experience, a 27 percent increase
over the control group. Program graduates also have significantly better knowledge about topics
taught in the entrepreneurship track, including in being able to list the components of a business
plan (for instance a supply assessment or a marketing plan). For example, 77 percent of program
graduates reported knowing how to produce a business plan, compared to 45 percent in the
control group. These impacts are closely related to the core content of the business training
offered by the national employment office and as such were expected. They do suggest that not
all students assigned to the entrepreneurship track fully acquired the technical knowledge that
was taught, consistent with the dropout patterns documented above.
21 Consistent with a higher reservation wage for private sector jobs, individuals in the treatment group are more likely to reject a job offer because the salary is too low.

21
6.2 Networks
Table 5 (Panel B) reports program impacts on a number of networking proxies, including
whether the beneficiaries registered at employment offices, whether they knew an entrepreneur,
an employment officer or a banker, and how often he/she interacted with him. Results show that
the entrepreneurship training was effective in increasing the business and employment networks
of participants. Participants are marginally more likely to be registered at employment offices, an
indicator obtained directly from administrative data, not from the follow-up survey. Graduates
that were assigned to the entrepreneurship track are also more likely to know an employment
agent, even though they do not interact with the employment agent more frequently than
graduates from the control group. Furthermore, there is evidence that the program increased the
probability of knowing an entrepreneur, as well as knowing and interacting frequently with a
banker. Interestingly, however, program participants were less likely to seek advice from a
professor to develop a new project idea.
6.3 Behavioral skills
As discussed in section 2, the entrepreneurship training contained a module “for the person”
aiming to develop entrepreneurial traits and behavioral skills. These behavioral skills are likely
most malleable among youth (Almlund et al., 2011). In Tunisia, during qualitative interviews,
some training facilitators stressed that as part of this module one of their main objectives was to
change students’ behavioral skills to contribute to “turn them into entrepreneurs.” We now
consider whether the program impacted a range of behavioral skills often associated with
entrepreneurship.
First, Table 6 (Panel A) presents estimates of program impacts on risk and time preference
parameters. Indicators of willingness to take risk include a direct self-reported measure (“on a
scale from 1-10, how willing are you to take risks?”), as well as the certainty equivalent for an
imaginary lottery where the respondent would have a 50 percent chance of winning 0 and a 50
percent chance of winning 2000 TND. Based on this last question, we also create a binary
variable taking the value of 1 if the individual is a risk-taker (i.e. with a certainty equivalent
larger than 1000 TND). Finally, we create a proxy for “patience”, taking a value of 1 if
respondents reveal a preference for 1000 TND in 6 months rather than to 800 TND now. Table 6

22
(Panel A) shows no evidence that the program had an impact on self-reported risk and time
preference parameters. Preference parameters appear stable and unaffected by the intervention.
Panel B of Table 6 contains a range of behavioral skills, sometimes referred to as soft skills,
entrepreneurial skills, or personality traits. The first five indicators are from the “Big Five” scale,
the most common measures of personality traits (Gosling, 2003; Almlund et al., 2011). The “Big
Five” captures key soft skills including extraversion, agreeableness, conscientiousness,
emotional stability, and openness to experience. Based on de Mel et al. (2010), we also include
measures of behavioral skills capturing a range of entrepreneurial traits such as impulsiveness,
passion for work, tenacity, polychronicity, locus of control, achievement, power motivation,
centrality of work, and personal organization. All measures of behavioral skills are externally
standardized so that they have a mean of 0 and a standard deviation of 1 in the control group.
Therefore, all coefficients can be interpreted in terms of standard deviations from the average
“level” of these skills in the control group.
The results reveal that the intervention led to measurable, significant, and robust changes in
several domains of the “Big Five.” First, assignment to the entrepreneurship track led to a
significant decrease in agreeableness. ITT estimates reveal a decrease ranging from 0.23 to 0.25
standard deviations compared to the level of agreeableness in the control group. This result is
noteworthy because the literature has suggested that agreeableness is negatively associated with
occupations such as business professionals or managers (Cobb-Clark and Tan, 2010).22 To the
extent that being less agreeable indeed contributes to making a better entrepreneur, these results
suggest that behavioral skills for entry into self-employment can differ from behavioral skills
needed to hold a salaried job. The types of behavioral skills shaped by the entrepreneurship
training may therefore contribute to the partial substitution between wage employment and self-
employment documented above.
Table 6 (Panel B) also show that the entrepreneurship track led to a significant (although less
robust) increases in extraversion. This result is consistent with some of the emphasis of the
entrepreneurship training on making students more outspoken and assertive.
22 Specifically, Cobb-Clark and Tan (2010) find that a one-standard deviation increase in agreeableness is associated with a 2.8 percent decrease in the probability of being a manager, and a 2.9 percent decrease in being a business professional.

23
The other two results related to the “Big Five” are more mixed. Table 6 (Panel B) reveals a
decrease in conscientiousness and emotional stability among graduates who were assigned to the
entrepreneurship track. Conscientiousness has been shown to be positively associated with a
range of life outcomes (Almlund et al., 2011). These results may suggest that different
behavioral skills are shaped through different formative experiences. It is possible that the
process of writing an academic thesis – as students in the control group had to do - may be
relatively more effective in shaping traits such as conscientiousness or emotional stability than
entrepreneurship training.23 By contrast, there is no evidence that the entrepreneurship training
positively affected these traits.
The results also reveal some differences in entrepreneurial traits beyond the “Big Five.” A
decrease in impulsiveness is observed: participants feel they reflect more before acting. At the
same time, centrality of work increased, suggesting beneficiaries care more about their work.
Most other entrepreneurial traits, including power motivation and tenacity, were unchanged,
however.
Overall, the results confirm that behavioral skills can be malleable and that the entrepreneurship
track affected them. They also suggest that different behavioral skills may be shaped by different
types of training or activities. As such, the content of skills training requires particular attention
since different skills map to different occupations: equipping trainees with a particular set of
soft-skills mapping to entrepreneurial activities may not help them enter into wage employment.
6.4 Optimism and attitudes towards the future
Some of the strongest results in Table 6 are displayed in Panel C and relate to attitudes towards
the future. Beneficiaries report being much more optimistic about the future, are much more
likely to report feeling like they are moving forward in life, or thinking about how to move
forward in life. Students assigned to the entrepreneurship track also reveal having relatively more
faith in the future compared to graduates from the control group. These results are robust and are
23 The decrease in conscientiousness may also be explained by conscientiousness being related to some facets of conformism, as well as a desire for “getting things done”, possibly leading to higher pay-offs than being meticulous when it comes to leading projects.

24
consistent across a range of different indicators measured independently24. Overall, these results
suggest that program participants perceived a heightened sense of opportunities for the future.
6.5 Access to credit
Access to credit is one of the most frequently cited barriers to entrepreneurship, particularly in
Tunisia.25 The entrepreneurship track did not directly aim to alleviate credit constraints, but
some aspects of the training involved providing information to students about credit applications,
as well as connecting them to bankers. Table 7 (Panel A) shows that the treatment group was
more likely to be confident to be able to obtain credit and to have actually applied for credit
(conditional on having a business idea). However, they were not more likely to know how to
apply for credit and were also no more likely to have obtained credit. These findings suggest that
the intervention improved beneficiaries’ confidence in obtaining outside credit. Still, they do not
provide direct evidence that the intervention alleviated credit constraints.
As a robustness check, Panels B, C, and D in Table 7 present impact estimates for the main
employment outcomes after removing prize winners from the sample. This is done by removing
the 50 students who chose to enter the business plan competition and won a prize, even though in
practice fewer than 15 students cashed their prize. While there is clearly selection into winning a
prize, the winners were arguably students with the best prospects to become self-employed to
start with. As such, removing winners from the sample most likely provide conservative
estimates of program impact. Table 7 shows that, although program impacts on self-employment
in permanent activities are not significant anymore, the results are overall very similar. As such,
this robustness test suggests that the results in section 5 are mainly driven by the effects of
business training and coaching, not so much by the seed capital attached to the competition, even
though we cannot formally disentangle the two.
Finally, in the follow-up survey, graduates in the treatment group report that lack of access to
credit remains the most binding constraint for entry into self-employment. In fact more than 70
24 The optimism indicator itself is aggregated from 6 questions 25 Tunisia ranks 87th on the “ease of getting credit” indicator (see World Bank, 2012). Start-up financing is provided by the BFPME (Bank for financing Small and Medium Enterprises of 100,000 – 10 million TND) and the BTS (Bank for financing micro enterprises of <100,000 TND). Own funds required for a credit is between 35-40 percent at the MFPME and 10 percent at the BTS. There are also a number of support funds available such as FOPRODI (Industrial Decentralization and Investment Fund), or SICAR (a venture capital firm).

25
percent of program beneficiaries state that access to credit is the main constraint for entry into
self-employment. Overall, evidence that the intervention improved access to credit is at most
limited.
7. Conclusion
This paper relies on randomized assignment to evaluate impacts from the introduction of an
entrepreneurship track for applied university students in Tunisia. The new track offered business
training and personalized coaching for students to develop a business plan for a project of their
choice. Students had to defend the business plan (instead of undertaking an internship and
writing a thesis) to graduate, and were also invited to submit the business plan to a competition.
We evaluate the impact of randomized assignment to the entrepreneurship track on employment
outcomes, as well as on intermediary outcomes such as business skills, networks, and behavioral
skills.
We find that assignment of university students to the entrepreneurship track was effective in
increasing self-employment among graduates approximately one year after graduation, but that
the effects are small in absolute terms, ranging from 1 to 4 percentage points in the probability of
being self-employed. Given the low prevalence of self-employment in the control group, these
small absolute effects imply that beneficiaries of the pilot program were on average 46 to 87
percent more likely to be self-employed compared with graduates from the control group.
However, the intervention did not increase the overall employment rate among beneficiaries. In
partial equilibrium, these results suggest a substitution effect from wage employment into self-
employment, similar to findings in Fairlie et al. (2012) in the U.S. They are also consistent with
findings that private sector reservation wages are higher among participants in the
entrepreneurship track. Therefore, the results highlight potentially important policy trade-offs
between programs that aim to increase wage employment and programs that aim to foster entry
into self-employment.
The evidence also reveals some of the channels behind the employment impacts by showing that
the program fostered business skills, expanded business networks, as well as affected a range of
behavioral skills and attitudes towards the future. For instance, participants in the
entrepreneurship track were found to become more extroverted, less agreeable, less

26
conscientious, and less emotionally stable. These results point to differentiated skill needs in
wage and self-employment, which can explain part of the observed substitution between wage
employment and self-employment. Findings also suggest that different behavioral skills are
shaped through different formative experiences, and that the process of writing an academic
thesis may be relatively more effective in shaping traits such as conscientiousness than
entrepreneurship training. As such, these results confirm that behavioral skills are indeed
malleable, but also highlight that the content of skills training requires particular attention to the
extent that different skills may be needed for different occupations.
As stated above, the design of the impact evaluation does not allow us to formally disentangle
the effects of the entrepreneurship track (business training and personalized coaching) from the
start-up capital offered to winners of the business plan competition. However, fewer than fifteen
winners actually cashed their prize and evidence that the intervention alleviated credit constraints
for participants is very limited. Indeed, most of the findings also remain robust when restricting
the sample to students who did not win a prize. We interpret this as suggestive that the results are
mainly driven by participation in the entrepreneurship track (training and coaching) rather than
by the prizes. In fact, participants report lack of access to credit as the largest constraint to entry
into self-employment.
Finally, the follow-up survey was conducted 3-6 months after the Tunisian revolution.26 The
occurrence of the revolution does not affect the internal validity of the findings, but the post-
revolution political and economic context may have implications for their external validity. On
the one hand, between 2010 and 2011, a large number of jobs were lost in the country, with
immediate consequences for youth unemployment. In 2011, new social programs were rolled out
and may also have affected job search intensity among graduates. On the other hand, students
perceived the revolution as having improved prospects for growth opportunities in the medium
term. The follow-up survey shows that most respondents had positive perceptions of their
prospects in the labor market, including a stronger desire to find a job and to seek self-
employment. Overall, it is therefore not clear how the context of the revolution may have
affected the external validity of the findings related to labor market outcomes, and in particular
26 The baseline survey was collected between December 2009 and February 2010 and the follow-up survey was collected between April and June 2011. The Tunisian revolution took place in January 2011.

27
the relative attractiveness of wage employment and self-employment. Still, the results showing
that participants to the entrepreneurship track are more optimistic suggest that graduates feel
more confident to be able to benefit from new opportunities opened to them. As such, they point
to the broader impacts of employment programs on youth behaviors and attitudes towards the
future.
References
Almeida, R., J. Arbelaez, M. Honorati, A. Kuddo, T. Lohmann, M. Ovadiya, L. Pop, M. Sanchez-Puerta, and M. Weber. (2011). “Improving Access to Jobs and Earnings Opportunities: The Role of Activation and Graduation Policies” Social Protection and Labor Discussion Paper No. 1204. Washington, DC, World Bank.
Almeida, R., and E. Galasso. (2010). "Jump-Starting Self-employment? Evidence Among Welfare Participants in Argentina." World Development, 38 (5).
Almlund, M., A. L. Duckworth, J. J. Heckman and T. Kautz (2011). “Personality Psychology and Economics.” NBER Working Paper No. 16822.
Angel-Urdinola, D; A. Semlali, and S. Brodmann (2010). “Non Public Provision of ALMPs in AMCs: An Inventory of Youth Programs”. Social Protection and Labor Discussion Paper No. 1005. Washington, D.C., World Bank.
Attanasio, O. P., A. D Kugler., and C. Meghir. (2011) “Subsidizing Vocational Training for Disadvantaged Youth in Colombia: Evidence from a Randomized Trial.” American Economic Journal: Applied Economics, 3 (3).
Banerjee, A. and E. Duflo. (2008). “What is middle class about the middle classes around the world?” Journal of Economic Perspectives, 22(2).
Baumol, W. (1968). “Entrepreneurship in Economic Theory.” American Economic Review, Papers and Proceedings, 58 (2).
Betcherman, G., K. Olivas, and A. Dar. (2004). "Impacts of Active Labor Market Programs: New Evidence from Evaluations with Particular Attention to Developing and Transition Countries." Social Protection and Labor Discussion Paper No. 0402. Washington, D.C., World Bank
Betcherman, G., M. Godfrey, S. Puerto, F. Rother, and A. Stavreska (2007) “A Review of Interventions to Support Young Workers: Findings of the Youth Employment Inventory.” Social Protection and Labor Discussion Paper No. 0715. Washington, D.C., World Bank.
Blattman, C. and J. Annan. (2011). “Reintegrating and employing high risk youth in Liberia: Lessons from a randomized evaluation of a landmine Action and agricultural training program for ex-combatants”. IPA, Yale University.

28
Blattman, C., N. Fiala, and S. Martinez. (2011). “Can Employment Programs Reduce Poverty and Social Instability? Experimental Evidence from a Ugandan aid program.” Social Protection and Labor Discussion Paper No. 1120. Washington, D.C., World Bank
Bruhn, M. and D. McKenzie (2009). "In Pursuit of Balance: Randomization in Practice in Development Field Experiments." American Economic Journal: Applied Economics, 1(4).
Bruhn, M. and B. Zia. (2011). “Business and Financial Literacy for Young Entrepreneurs: Evidence from Bosnia-Herzegovina.” Mimeo. Washington D.C., World Bank.
Card, D., P. Ibarraran, F. Regalia, D. Roasas-Shady, and Y. Soares. (2011). “The Labor Market Impacts of Youth Training in the Dominican Republic.” Journal of Labor Economics, 29 (2).
Carneiro, P., E. Galasso, and R. Ginja. (2010). “The Impact of Providing Psycho‐Social Support to Indigent Families and Increasing their Access to Social Services: Evaluating Chile Solidario.” Evaluation report, UCL, London.
Cobb-Clark, D. A. and M. Tan (2010). “Noncognitive skills, occupational attainment, and relative wages.” Labour Economics 18(1).
De Mel, S., D. McKenzie and C. Woodruff. (2010). “Who are the Microenterprise Owners? Evidence from Sri Lanka in Tokman v. de Soto.” In: J. Lerner and A. Schoar (eds.) International Differences in Entrepreneurship, NBER, 2010.
De Mel, S., D. McKenzie, and C. Woodruff. (2012). “Business Training and Female Enterprise Start-up, Growth and Dynamics in Sri Lanka.” Policy Research Working Paper No. 6145, World Bank, Washington D.C.
Djankov, S., Y. Qian and G. Roland & Ekaterina Zhuravskaya. (2006). “Entrepreneurship in Brazil, China, and Russia.” CEPR Working Papers No. 0066, London.
Drexler, A., G. Fischer and A. Schoar. (2010) “Keeping it simple: Financial Literacy and Rule of Thumbs.” CEPR Working Paper No. 7994, London.
Elston, J.A., G.W. Harrison and E.E. Rutström. (2005). “Characterizing the Entrepreneur Using Field Experiments”. Max Planck Institute of Economics Working Paper.
Fairlie, R., D. Karlan and J. Zinman (2012). “Behind the GATE Experiment: Evidence on Effects of and Rationales for Subsidized Entrepreneurship Training”. CEPR Discussion Paper No. 17804. London.
Gollin, D. (2002). “Getting Income Shares Right, Journal of Political Economy 110 (2).
Gosling, S. (2003). "A very brief measure of the Big-Five personality domains." Journal of Research in Personality 37(6).
29
Groh, M., N. Krishnan, McKenzie, D. and T. Vishwanath (2012). “Soft skills or hard cash ? the impact of training and wage subsidy programs on female youth employment in Jordan”, Policy Research Working Paper No. 6141, World Bank, Washington D.C.
Ibarraran, P., and D. Rosas. (2008). “Evaluating the Impact of Job Training Programs in Latin America: Evidence from IDB Funded Operations.” Inter-American Development Bank, Washington D.C.
Karlan, D., and M. Valdivia. (2011). “Teaching Entrepreneurship: Impact of Business Training on Microfinance Institutions and Clients.” Review of Economics and Statistics, 93 (2).
Klinger, B., and M. Schündeln. (2011) “Can Entrepreneurial Activity be Taught? Quasi-Experimental Evidence from Central America.” World Development 39 (9).
Kluve, J., F. Rother, and M. L. Sánchez-Puerta. (2010). “Training Programs for the Unemployed, Low Income and Low Skilled Workers.” In Skills Development Strategies to Improve Employability and Productivity: Taking Stock and Looking Ahead by R. Almeida, J. Behrman and D. Robalino (Editors) World Bank, Washington D.C.
McKenzie, D. and Christopher Woodruff. (2012). What are we learning from business training and entrepreneurship evaluations around the developing world? Policy Research Working Paper No. 6202, World Bank, Washington D.C.
MFPE and World Bank. (2009): “Dynamique de l’emploi et adéquation de la formation parmi les diplômés universitaires. Analyse comparative des résultats de deux enquêtes (2005 et 2007).” Washington, D.C., World Bank.
Oosterbeek, H., Mirjam van Praag and Auke Ijsselstein. (2008). “The Impact of Entrepreneurship Education on Entrepreneurship Competencies and Intentions: An Evaluation of the Junior Achievement Student Mini-Company Program.” IZA Discussion Paper No. 3641, Bonn.
World Bank. 2012a. World Development Report 2013: Jobs. World Bank, Washington DC.
World Bank. 2012b. Jobs in the Middle East and North Africa. World Bank, Washington DC.

30
Table 1: Characteristics of Students in Licence Appliquée and Entrepreneurship Track
Female 12,539 1,129 9.0% 67.1% 66.3%Male 6,143 573 9.3% 32.9% 33.7%Gafsa 1,060 304 28.7% 5.7% 17.9%Monastir 1,935 316 16.3% 10.4% 18.6%Sfax 2,005 284 14.2% 10.7% 16.7%Jendouba 1,550 216 13.9% 8.3% 12.7%Ez-Zitouna 93 10 10.8% 0.5% 0.6%Kairouan 1,237 109 8.8% 6.6% 6.4%Carthage 2,012 120 6.0% 10.8% 7.0%Gabès 1,798 108 6.0% 9.6% 6.3%Sousse 2,351 141 6.0% 12.6% 8.3%Tunis 1,010 61 6.0% 5.4% 3.6%Tunis El-Manar 1,787 22 1.2% 9.6% 1.3%Manouba 1,659 11 0.7% 8.9% 0.6%
18,682 1,702 9.1% 100% 100%Source : Observatoire National de l’Emploi et des Qualifications.
Gender
Uni
vers
ity
Total
Number of students enrolled
in "Licence Appliquée"
Number of applicants to
entrepreneurship track
Application rate Distribution among applicants
Distribution among students in
"licence appliquée"
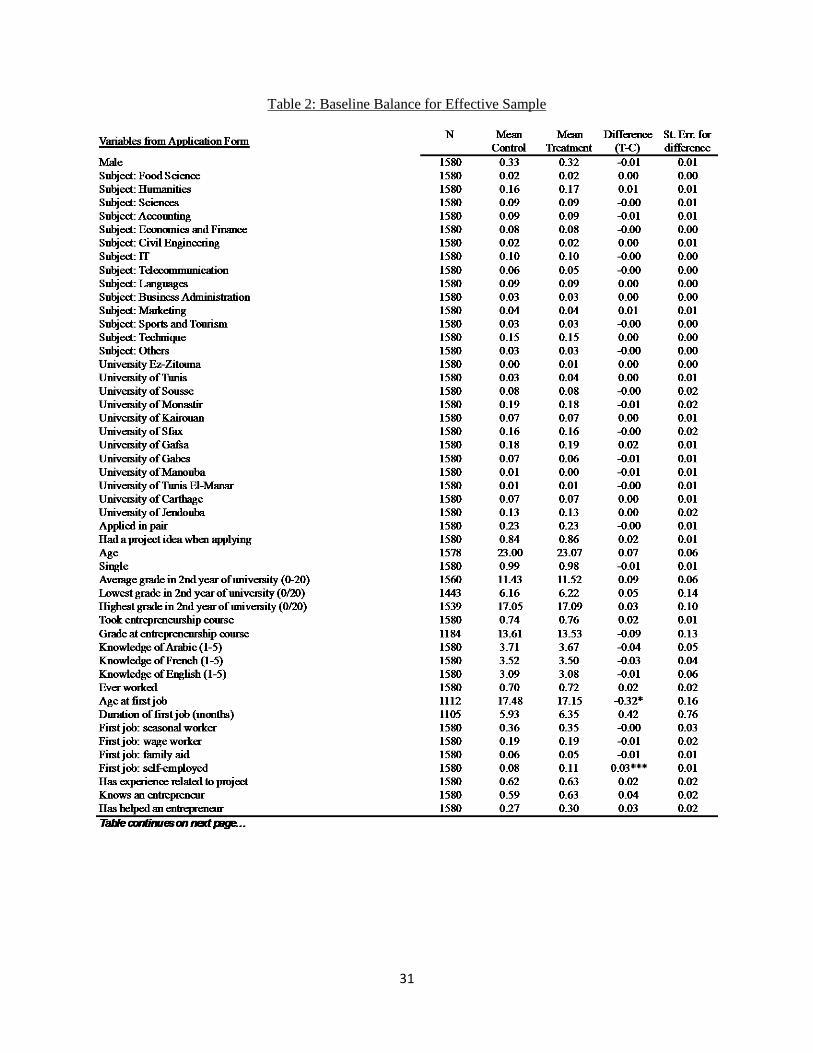
31
Table 2: Baseline Balance for Effective Sample
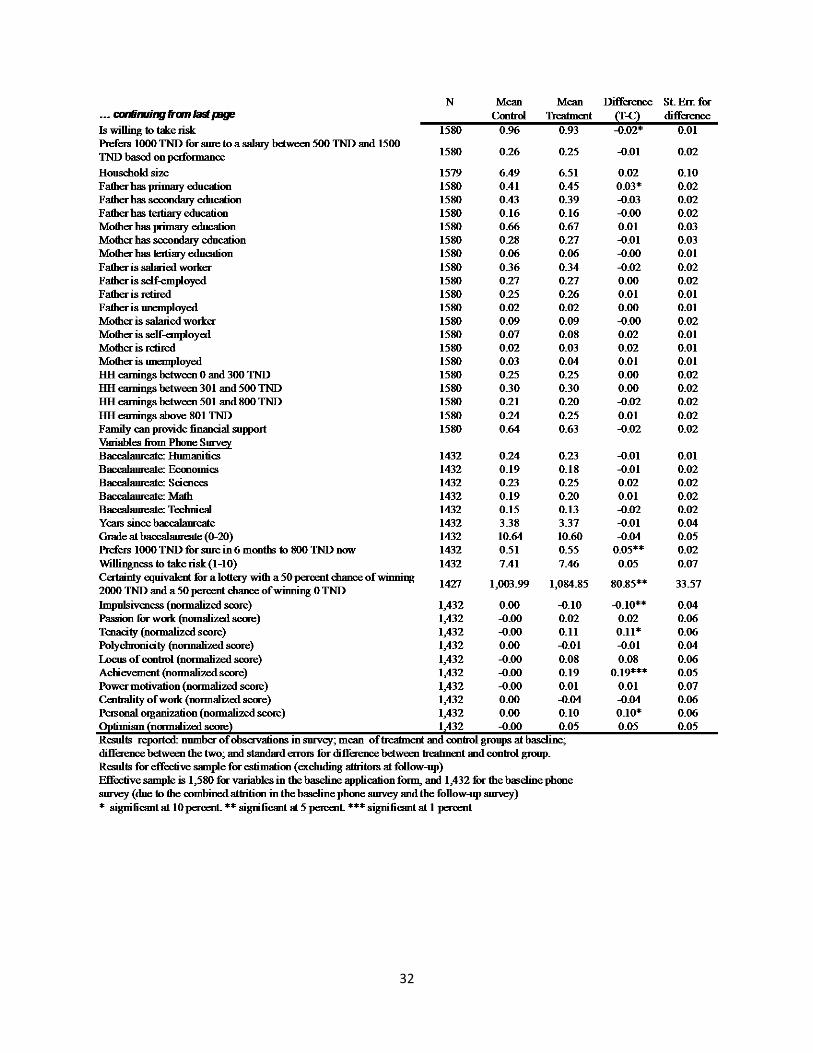
32
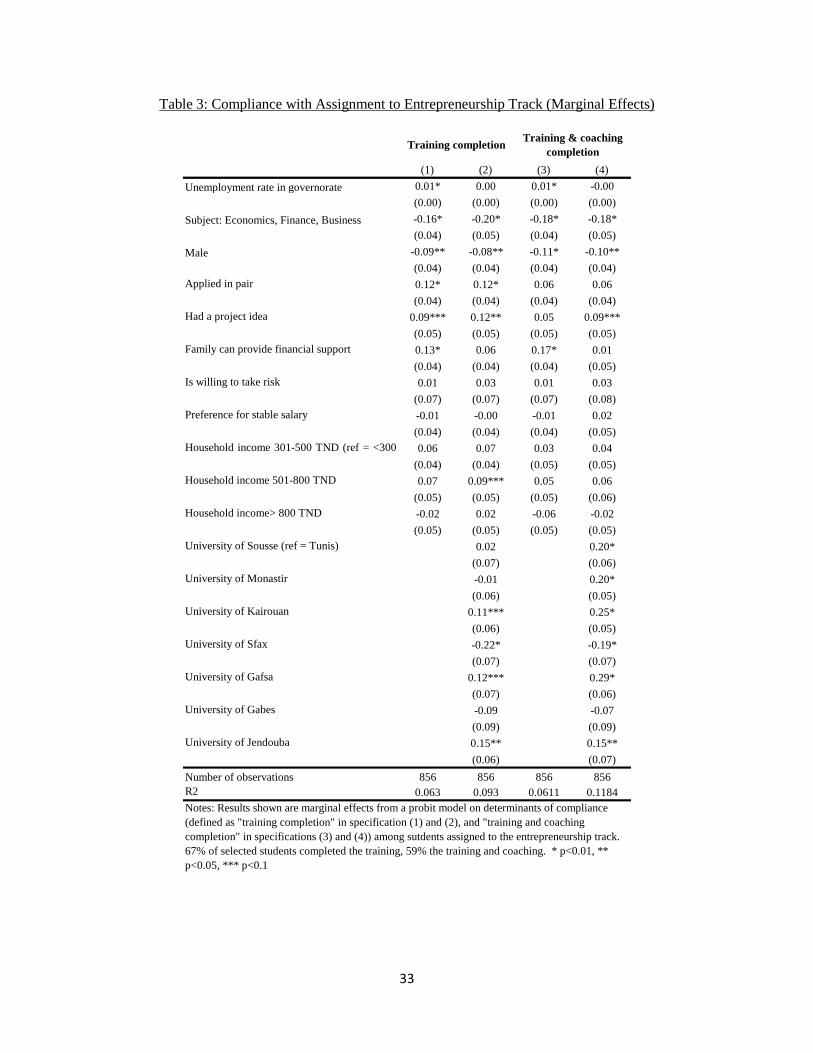
33
Table 3: Compliance with Assignment to Entrepreneurship Track (Marginal Effects)
(1) (2) (3) (4)Unemployment rate in governorate 0.01* 0.00 0.01* -0.00
(0.00) (0.00) (0.00) (0.00)Subject: Economics, Finance, Business -0.16* -0.20* -0.18* -0.18*
(0.04) (0.05) (0.04) (0.05)Male -0.09** -0.08** -0.11* -0.10**
(0.04) (0.04) (0.04) (0.04)Applied in pair 0.12* 0.12* 0.06 0.06
(0.04) (0.04) (0.04) (0.04)Had a project idea 0.09*** 0.12** 0.05 0.09***
(0.05) (0.05) (0.05) (0.05)Family can provide financial support 0.13* 0.06 0.17* 0.01
(0.04) (0.04) (0.04) (0.05)Is willing to take risk 0.01 0.03 0.01 0.03
(0.07) (0.07) (0.07) (0.08)Preference for stable salary -0.01 -0.00 -0.01 0.02
(0.04) (0.04) (0.04) (0.05)Household income 301-500 TND (ref = <300 0.06 0.07 0.03 0.04
(0.04) (0.04) (0.05) (0.05)Household income 501-800 TND 0.07 0.09*** 0.05 0.06
(0.05) (0.05) (0.05) (0.06)Household income> 800 TND -0.02 0.02 -0.06 -0.02
(0.05) (0.05) (0.05) (0.05)University of Sousse (ref = Tunis) 0.02 0.20*
(0.07) (0.06)University of Monastir -0.01 0.20*
(0.06) (0.05)University of Kairouan 0.11*** 0.25*
(0.06) (0.05)University of Sfax -0.22* -0.19*
(0.07) (0.07)University of Gafsa 0.12*** 0.29*
(0.07) (0.06)University of Gabes -0.09 -0.07
(0.09) (0.09)University of Jendouba 0.15** 0.15**
(0.06) (0.07)Number of observations 856 856 856 856R2 0.063 0.093 0.0611 0.1184
Training & coaching completionTraining completion
Notes: Results shown are marginal effects from a probit model on determinants of compliance (defined as "training completion" in specification (1) and (2), and "training and coaching completion" in specifications (3) and (4)) among sutdents assigned to the entrepreneurship track. 67% of selected students completed the training, 59% the training and coaching. * p<0.01, ** p<0.05, *** p<0.1
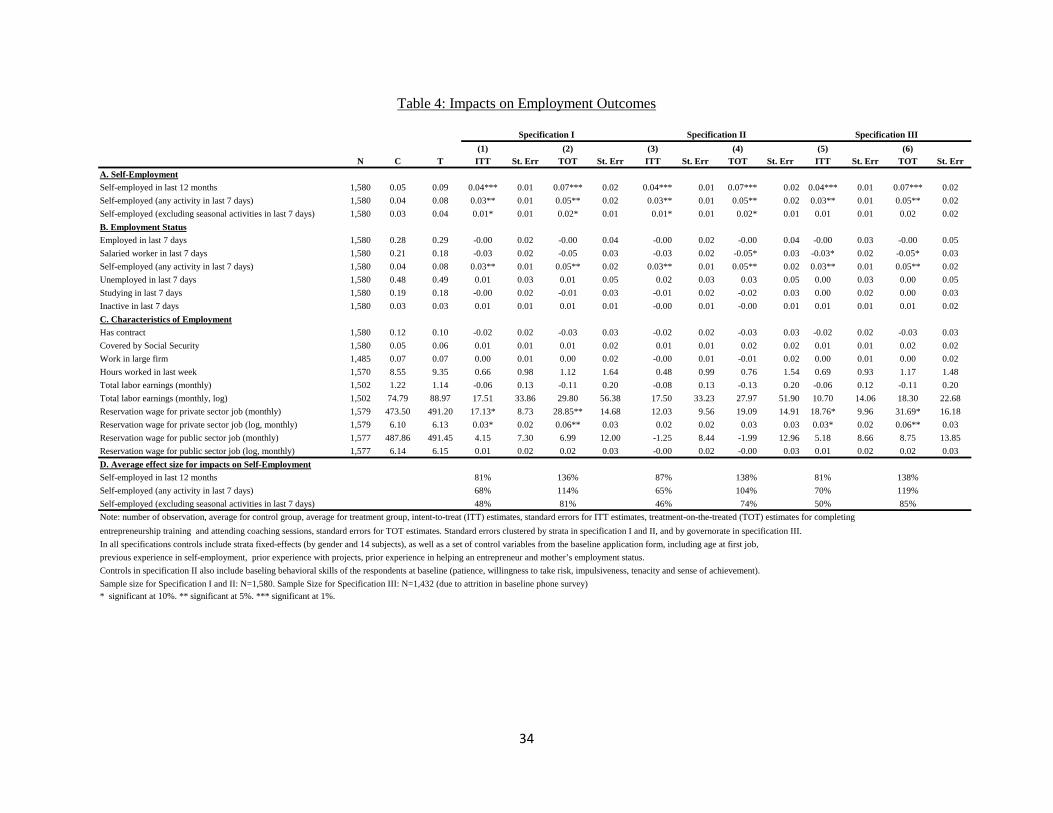
34
Table 4: Impacts on Employment Outcomes
(1) (2) (3) (4) (5) (6)N C T ITT St. Err TOT St. Err ITT St. Err TOT St. Err ITT St. Err TOT St. Err
A. Self-EmploymentSelf-employed in last 12 months 1,580 0.05 0.09 0.04*** 0.01 0.07*** 0.02 0.04*** 0.01 0.07*** 0.02 0.04*** 0.01 0.07*** 0.02Self-employed (any activity in last 7 days) 1,580 0.04 0.08 0.03** 0.01 0.05** 0.02 0.03** 0.01 0.05** 0.02 0.03** 0.01 0.05** 0.02Self-employed (excluding seasonal activities in last 7 days) 1,580 0.03 0.04 0.01* 0.01 0.02* 0.01 0.01* 0.01 0.02* 0.01 0.01 0.01 0.02 0.02B. Employment StatusEmployed in last 7 days 1,580 0.28 0.29 -0.00 0.02 -0.00 0.04 -0.00 0.02 -0.00 0.04 -0.00 0.03 -0.00 0.05Salaried worker in last 7 days 1,580 0.21 0.18 -0.03 0.02 -0.05 0.03 -0.03 0.02 -0.05* 0.03 -0.03* 0.02 -0.05* 0.03Self-employed (any activity in last 7 days) 1,580 0.04 0.08 0.03** 0.01 0.05** 0.02 0.03** 0.01 0.05** 0.02 0.03** 0.01 0.05** 0.02Unemployed in last 7 days 1,580 0.48 0.49 0.01 0.03 0.01 0.05 0.02 0.03 0.03 0.05 0.00 0.03 0.00 0.05Studying in last 7 days 1,580 0.19 0.18 -0.00 0.02 -0.01 0.03 -0.01 0.02 -0.02 0.03 0.00 0.02 0.00 0.03Inactive in last 7 days 1,580 0.03 0.03 0.01 0.01 0.01 0.01 -0.00 0.01 -0.00 0.01 0.01 0.01 0.01 0.02C. Characteristics of EmploymentHas contract 1,580 0.12 0.10 -0.02 0.02 -0.03 0.03 -0.02 0.02 -0.03 0.03 -0.02 0.02 -0.03 0.03Covered by Social Security 1,580 0.05 0.06 0.01 0.01 0.01 0.02 0.01 0.01 0.02 0.02 0.01 0.01 0.02 0.02Work in large firm 1,485 0.07 0.07 0.00 0.01 0.00 0.02 -0.00 0.01 -0.01 0.02 0.00 0.01 0.00 0.02Hours worked in last week 1,570 8.55 9.35 0.66 0.98 1.12 1.64 0.48 0.99 0.76 1.54 0.69 0.93 1.17 1.48Total labor earnings (monthly) 1,502 1.22 1.14 -0.06 0.13 -0.11 0.20 -0.08 0.13 -0.13 0.20 -0.06 0.12 -0.11 0.20Total labor earnings (monthly, log) 1,502 74.79 88.97 17.51 33.86 29.80 56.38 17.50 33.23 27.97 51.90 10.70 14.06 18.30 22.68Reservation wage for private sector job (monthly) 1,579 473.50 491.20 17.13* 8.73 28.85** 14.68 12.03 9.56 19.09 14.91 18.76* 9.96 31.69* 16.18Reservation wage for private sector job (log, monthly) 1,579 6.10 6.13 0.03* 0.02 0.06** 0.03 0.02 0.02 0.03 0.03 0.03* 0.02 0.06** 0.03Reservation wage for public sector job (monthly) 1,577 487.86 491.45 4.15 7.30 6.99 12.00 -1.25 8.44 -1.99 12.96 5.18 8.66 8.75 13.85Reservation wage for public sector job (log, monthly) 1,577 6.14 6.15 0.01 0.02 0.02 0.03 -0.00 0.02 -0.00 0.03 0.01 0.02 0.02 0.03D. Average effect size for impacts on Self-EmploymentSelf-employed in last 12 months 81% 136% 87% 138% 81% 138%Self-employed (any activity in last 7 days) 68% 114% 65% 104% 70% 119%Self-employed (excluding seasonal activities in last 7 days) 48% 81% 46% 74% 50% 85%Note: number of observation, average for control group, average for treatment group, intent-to-treat (ITT) estimates, standard errors for ITT estimates, treatment-on-the-treated (TOT) estimates for completing entrepreneurship training and attending coaching sessions, standard errors for TOT estimates. Standard errors clustered by strata in specification I and II, and by governorate in specification III.In all specifications controls include strata fixed-effects (by gender and 14 subjects), as well as a set of control variables from the baseline application form, including age at first job, previous experience in self-employment, prior experience with projects, prior experience in helping an entrepreneur and mother’s employment status.Controls in specification II also include baseling behavioral skills of the respondents at baseline (patience, willingness to take risk, impulsiveness, tenacity and sense of achievement).Sample size for Specification I and II: N=1,580. Sample Size for Specification III: N=1,432 (due to attrition in baseline phone survey)* significant at 10%. ** significant at 5%. *** significant at 1%.
Specification I Specification II Specification III

35
Table 5: Impacts on Business Skills and Networks
(1) (2) (3) (4) (5) (6)N C T ITT St. Err TOT St. Err ITT St. Err TOT St. Err ITT St. Err TOT St. Err
A. Business skillsHas practical experience in projects 1,577 0.37 0.48 0.10*** 0.02 0.17*** 0.04 0.11*** 0.02 0.17*** 0.03 0.10*** 0.02 0.17*** 0.03Knows how to produce a business plan 1,579 0.45 0.77 0.31*** 0.03 0.53*** 0.05 0.32*** 0.03 0.52*** 0.05 0.31*** 0.03 0.52*** 0.05Knows a business plan contains a commercial analysis 1,580 0.23 0.41 0.18*** 0.03 0.30*** 0.05 0.18*** 0.03 0.29*** 0.04 0.17*** 0.03 0.29*** 0.03Knows a business plan contains a demand assessment 1,579 0.30 0.55 0.24*** 0.03 0.40*** 0.04 0.25*** 0.02 0.39*** 0.04 0.23*** 0.04 0.40*** 0.05Knows a business plan contains a supply assessment 1,579 0.33 0.62 0.28*** 0.03 0.47*** 0.05 0.29*** 0.03 0.47*** 0.04 0.28*** 0.03 0.47*** 0.03Knows a business plan contains a marketing plan 1,580 0.26 0.55 0.28*** 0.04 0.48*** 0.05 0.29*** 0.04 0.45*** 0.05 0.28*** 0.02 0.47*** 0.03Knows a business plan contains a market share analysis 1,579 0.20 0.40 0.20*** 0.03 0.34*** 0.04 0.21*** 0.03 0.34*** 0.04 0.19*** 0.02 0.33*** 0.03Knows a business plan contains a technical analysis 1,580 0.24 0.57 0.32*** 0.03 0.55*** 0.04 0.34*** 0.03 0.54*** 0.04 0.32*** 0.02 0.54*** 0.04Knows a business plan contains a financial analysis 1,580 0.35 0.64 0.28*** 0.03 0.48*** 0.05 0.29*** 0.03 0.47*** 0.05 0.28*** 0.03 0.48*** 0.05Knows a business plan contains a profitability analysis 1,579 0.27 0.47 0.19*** 0.04 0.32*** 0.06 0.20*** 0.05 0.31*** 0.06 0.18*** 0.02 0.31*** 0.03B. NetworksRegistered at Employment Office 1,702 0.78 0.82 0.04 0.02 0.07* 0.04 0.04 0.02 0.06* 0.03 0.03* 0.02 0.06* 0.03Knows an employment agent 1,580 0.14 0.28 0.13*** 0.02 0.22*** 0.03 0.15*** 0.02 0.23*** 0.03 0.13*** 0.02 0.22*** 0.03Number of times spoke to employment agent in last month 329 2.26 1.83 -0.31 0.39 -0.42 0.47 -0.14 0.30 -0.18 0.36 -0.32 0.49 -0.43 0.60Knows an entrepreneur 1,580 0.44 0.49 0.05* 0.02 0.08* 0.04 0.04 0.03 0.06 0.04 0.05** 0.02 0.08*** 0.03Number of times spoke to entrepreneur in last month 726 5.05 5.11 -0.01 0.65 -0.01 0.98 0.08 0.66 0.12 0.97 0.04 0.77 0.07 1.17Knows a banker 1,580 0.25 0.31 0.06*** 0.02 0.09*** 0.03 0.06** 0.02 0.09*** 0.03 0.06** 0.03 0.10*** 0.04Number of times spoke to a banker in last month 440 2.44 3.67 1.16** 0.53 2.00** 0.88 0.77 0.56 1.25 0.83 1.29* 0.74 2.27* 1.29Would seek advice from professor on project idea 1,580 0.08 0.05 -0.03* 0.01 -0.04** 0.02 -0.03** 0.01 -0.05** 0.02 -0.03 0.02 -0.04* 0.03Would seek advice from employment agent on project idea 1,580 0.32 0.31 -0.00 0.02 -0.01 0.03 -0.01 0.02 -0.02 0.03 -0.01 0.02 -0.01 0.03Would seek advice from entrepreneur on project idea 1,580 0.48 0.51 0.03 0.02 0.05 0.04 0.04 0.03 0.07 0.04 0.03 0.02 0.05 0.03Note: number of observation, average for control group, average for treatment group, intent-to-treat (ITT) estimates, standard errors for ITT estimates, treatment-on-the-treated (TOT) estimates for completing entrepreneurship training and attending coaching sessions, standard errors for TOT estimates. Standard errors clustered by strata in specification I and II, and by governorate in specification III.In all specifications controls include strata fixed-effects (by gender and 14 subjects), as well as a set of control variables from the baseline application form, including age at first job, previous experience in self-employment, prior experience with projects, prior experience in helping an entrepreneur and mother’s employment status.Controls in specification II also include baseling behavioral skills of the respondents at baseline (patience, willingness to take risk, impulsiveness, tenacity and sense of achievement).Sample size for Specification I and II: N=1,580. Sample Size for Specification III: N=1,432 (due to attrition in baseline phone survey)* significant at 10%. ** significant at 5%. *** significant at 1%.
Specification I Specification II Specification III

36
Table 6: Impacts on Behavioral Skills and Attitudes towards the Future
(1) (2) (3) (4) (5) (6)N C T ITT St. Err TOT St. Err ITT St. Err TOT St. Err ITT St. Err TOT St. Err
A. PreferencesWillingness to take risk (0-10) 1,575 6.06 6.10 -0.02 0.14 -0.03 0.24 -0.04 0.14 -0.06 0.21 -0.02 0.10 -0.03 0.16Certainty equivalent for lottery with 50% chance of winning 0 and 50% chance of winning 2000DT 1,556 674.44 694.33 16.21 19.53 27.43 31.83 -2.89 17.97 -4.62 27.78 14.32 18.95 24.34 31.71
Risk taker 1,556 0.18 0.18 -0.01 0.02 -0.01 0.03 -0.02 0.02 -0.03 0.03 -0.01 0.02 -0.02 0.03Patience 1,577 0.27 0.29 0.02 0.02 0.03 0.04 0.00 0.02 0.00 0.03 0.02 0.02 0.03 0.03B. Behavioral SkillsBig 5: Extraversion (normalized score) 1,580 -0.00 0.11 0.10** 0.05 0.18** 0.07 0.05 0.05 0.08 0.08 0.11** 0.05 0.18** 0.08Big 5: Agreeable (normalized score) 1,578 -0.00 -0.23 -0.24*** 0.05 -0.40*** 0.08 -0.23*** 0.05 -0.37*** 0.08 -0.25*** 0.04 -0.42*** 0.06Nig 5: Conscientiousness (normalized score) 1,577 -0.00 -0.14 -0.14** 0.05 -0.24*** 0.08 -0.13** 0.06 -0.21** 0.09 -0.14*** 0.04 -0.24*** 0.06Big 5: Emotionnally Stable (normalized score) 1,579 0.00 -0.11 -0.11** 0.04 -0.18*** 0.07 -0.07* 0.04 -0.12** 0.06 -0.12** 0.05 -0.20** 0.08Big 5: Openness (normalized score) 1,577 0.00 -0.02 -0.03 0.04 -0.05 0.06 -0.03 0.04 -0.05 0.06 -0.04 0.04 -0.06 0.06Impulsiveness (normalized score) 1,573 0.00 -0.12 -0.12** 0.05 -0.21** 0.09 -0.11 0.07 -0.18* 0.11 -0.13** 0.06 -0.22** 0.09Passion for work (normalized score) 1,579 0.00 0.03 0.03 0.05 0.06 0.09 -0.01 0.06 -0.02 0.09 0.04 0.05 0.06 0.09Tenacity (normalized score) 1,576 -0.00 0.03 0.04 0.05 0.07 0.08 0.01 0.05 0.02 0.08 0.05 0.04 0.09 0.07Polychronicity (normalized score) 1,577 -0.00 -0.05 -0.05 0.05 -0.08 0.08 -0.03 0.05 -0.05 0.08 -0.04 0.06 -0.07 0.10Locus of control (normalized score) 1,579 -0.00 0.02 0.02 0.06 0.03 0.10 0.01 0.06 0.02 0.10 0.03 0.05 0.04 0.08Achievement (normalized score) 1,576 -0.00 0.02 0.04 0.06 0.06 0.10 -0.02 0.05 -0.03 0.08 0.04 0.04 0.07 0.06Power Motivation (normalized score) 1,574 0.00 -0.05 -0.04 0.05 -0.07 0.09 -0.10* 0.05 -0.15* 0.08 -0.04 0.04 -0.06 0.07Centrality of work (normalized score) 1,578 -0.00 0.09 0.10* 0.05 0.16* 0.09 0.04 0.05 0.07 0.08 0.11** 0.04 0.19*** 0.07Personal organization (normalized score) 1,580 -0.00 0.08 0.08 0.07 0.14 0.11 0.05 0.07 0.07 0.11 0.09 0.06 0.15 0.10C. Attitudes towards the futureOptimism (normalized score) 1,578 -0.00 0.12 0.13*** 0.04 0.21*** 0.07 0.12** 0.05 0.18*** 0.07 0.13*** 0.04 0.22*** 0.06Days feels moving forward 1,578 3.79 4.09 0.28** 0.11 0.47*** 0.17 0.23* 0.13 0.37* 0.19 0.25* 0.14 0.43* 0.25Days thinking about how to move forward 1,578 5.62 5.87 0.23** 0.11 0.39** 0.19 0.25** 0.12 0.39** 0.19 0.21* 0.12 0.36* 0.21Has more faith in future now than last year 1,574 0.52 0.57 0.04* 0.02 0.08* 0.04 0.05* 0.02 0.07* 0.04 0.05 0.03 0.08 0.05Note: number of observation, average for control group, average for treatment group, intent-to-treat (ITT) estimates, standard errors for ITT estimates, treatment-on-the-treated (TOT) estimates for completing entrepreneurship training and attending coaching sessions, standard errors for TOT estimates. Standard errors clustered by strata in specification I and II, and by governorate in specification III.In all specifications controls include strata fixed-effects (by gender and 14 subjects), as well as a set of control variables from the baseline application form, including age at first job, previous experience in self-employment, prior experience with projects, prior experience in helping an entrepreneur and mother’s employment status.Controls in specification II also include baseling behavioral skills of the respondents at baseline (patience, willingness to take risk, impulsiveness, tenacity and sense of achievement).Sample size for Specification I and II: N=1,580. Sample Size for Specification III: N=1,432 (due to attrition in baseline phone survey)* significant at 10%. ** significant at 5%. *** significant at 1%.
Specification I Specification II Specification III

37
Table 7: Access to credit and Robustness of Employment Results to exclusion of Prize Winners
(1) (2) (3) (4) (5) (6)N C T ITT St. Err TOT St. Err ITT St. Err TOT St. Err ITT St. Err TOT St. Err
A. Access to creditKnows how to apply for credit 1,580 0.20 0.22 0.02 0.02 0.03 0.03 0.02 0.02 0.04 0.03 0.02 0.02 0.03 0.03Expect to be able to obtain credit 1,568 0.30 0.39 0.08** 0.04 0.14** 0.06 0.09** 0.04 0.14** 0.06 0.09*** 0.02 0.15*** 0.03Has applied for credit (for individuals with project idea) 674 0.04 0.08 0.04** 0.02 0.06** 0.02 0.05*** 0.02 0.07*** 0.02 0.04* 0.02 0.06* 0.03B. Self-Employment (Excluding Prize Winners)Self-employed in last 12 months 1,530 0.05 0.09 0.04*** 0.01 0.07*** 0.02 0.04*** 0.01 0.07*** 0.02 0.04*** 0.01 0.07*** 0.02Self-employed (any activity in last 7 days) 1,530 0.04 0.08 0.03** 0.01 0.05** 0.02 0.03** 0.01 0.05** 0.02 0.03** 0.01 0.05** 0.02Self-employed (excluding seasonal activities in last 7 days) 1,530 0.03 0.04 0.01 0.01 0.02 0.01 0.01 0.01 0.02 0.01 0.01 0.01 0.02 0.02C. Employment Status (Excluding Prize Winners)Employed in last 7 days 1,530 0.28 0.28 -0.00 0.02 -0.00 0.04 0.00 0.02 0.00 0.04 -0.00 0.03 -0.00 0.06Salaried worker in last 7 days 1,530 0.21 0.17 -0.03 0.02 -0.05 0.03 -0.03 0.02 -0.05* 0.03 -0.03 0.02 -0.05 0.03Self-employed (any activity in last 7 days) 1,530 0.04 0.08 0.03** 0.01 0.05** 0.02 0.03** 0.01 0.05** 0.02 0.03** 0.01 0.05** 0.02Unemployed in last 7 days 1,530 0.48 0.50 0.01 0.03 0.02 0.05 0.02 0.03 0.04 0.05 0.00 0.03 0.00 0.05Studying in last 7 days 1,530 0.19 0.18 -0.01 0.02 -0.01 0.03 -0.01 0.02 -0.02 0.04 0.00 0.02 0.01 0.03Inactive in last 7 days 1,530 0.03 0.03 0.00 0.01 0.01 0.01 -0.01 0.01 -0.01 0.01 0.00 0.01 0.01 0.02D. Characteristics of Employment (Excluding Prize Winners)Has contract 1,530 0.12 0.10 -0.01 0.02 -0.03 0.03 -0.02 0.02 -0.03 0.03 -0.01 0.02 -0.02 0.03Covered by Social Security 1,530 0.05 0.06 0.01 0.01 0.01 0.02 0.01 0.02 0.01 0.02 0.01 0.01 0.01 0.02Work in large firm 1,439 0.07 0.08 0.01 0.01 0.01 0.02 0.00 0.01 0.00 0.02 0.01 0.01 0.01 0.03Hours worked in last week 1,520 8.56 9.30 0.69 0.91 1.22 1.58 0.57 0.91 0.93 1.47 0.63 0.97 1.11 1.63Total labor earnings (monthly) 1,456 1.22 1.13 -0.07 0.12 -0.13 0.20 -0.08 0.12 -0.14 0.19 -0.07 0.13 -0.13 0.23Total labor earnings (monthly, log) 1,456 74.89 88.97 17.69 34.29 31.39 59.44 19.13 33.85 31.76 54.84 12.53 15.99 22.47 27.03Reservation wage for private sector job (monthly) 1,529 473.7 490.0 15.35* 8.91 26.96* 15.40 10.29 9.98 16.95 16.01 16.73 10.26 29.57* 17.41Reservation wage for private sector job (log, monthly) 1,529 6.10 6.13 0.03* 0.02 0.05* 0.03 0.02 0.02 0.03 0.03 0.03* 0.02 0.06* 0.03Reservation wage for public sector job (monthly) 1,527 487.8 490.1 2.45 7.99 4.31 13.64 -3.24 9.39 -5.34 15.00 3.68 8.28 6.51 13.87Reservation wage for public sector job (log, monthly) 1,527 6.14 6.15 0.01 0.02 0.02 0.03 -0.01 0.02 -0.01 0.03 0.01 0.02 0.02 0.03Note: number of observation, average for control group, average for treatment group, intent-to-treat (ITT) estimates, standard errors for ITT estimates, treatment-on-the-treated (TOT) estimates for completing entrepreneurship training and attending coaching sessions, standard errors for TOT estimates. Standard errors clustered by strata in specification I and II, and by governorate in specification III.In all specifications controls include strata fixed-effects (by gender and 14 subjects), as well as a set of control variables from the baseline application form, including age at first job, previous experience in self-employment, prior experience with projects, prior experience in helping an entrepreneur and mother’s employment status.Controls in specification II also include baseling behavioral skills of the respondents at baseline (patience, willingness to take risk, impulsiveness, tenacity and sense of achievement).Sample size for Specification I and II: N=1,580. Sample Size for Specification III: N=1,432 (due to attrition in baseline phone survey)* significant at 10%. ** significant at 5%. *** significant at 1%.
Specification I Specification II Specification III