Entrepreneurship I Class #11 Finances: VOSG II. 11/6/022 VOSG 1 reaction 1 st person Page numbers...
24
Entrepreneurship I Class #11 Finances: VOSG II
-
date post
20-Dec-2015 -
Category
Documents
-
view
218 -
download
1
Transcript of Entrepreneurship I Class #11 Finances: VOSG II. 11/6/022 VOSG 1 reaction 1 st person Page numbers...
Entrepreneurship I
Class #11
Finances: VOSG II

11/6/02 2
VOSG 1 reaction
• 1st person• Page numbers• Executive summary• Management sectoin• Market research
– Pick your market segement(s)– Survey those not others
• Technology in search of a market• Barriers to entry

Finances – VOSG II

11/6/02 4
Finances goal
• Need to understand:– Money coming in– Money going out– Money sitting there
• How you are going to fund venture• Value creation
11/6/02 5
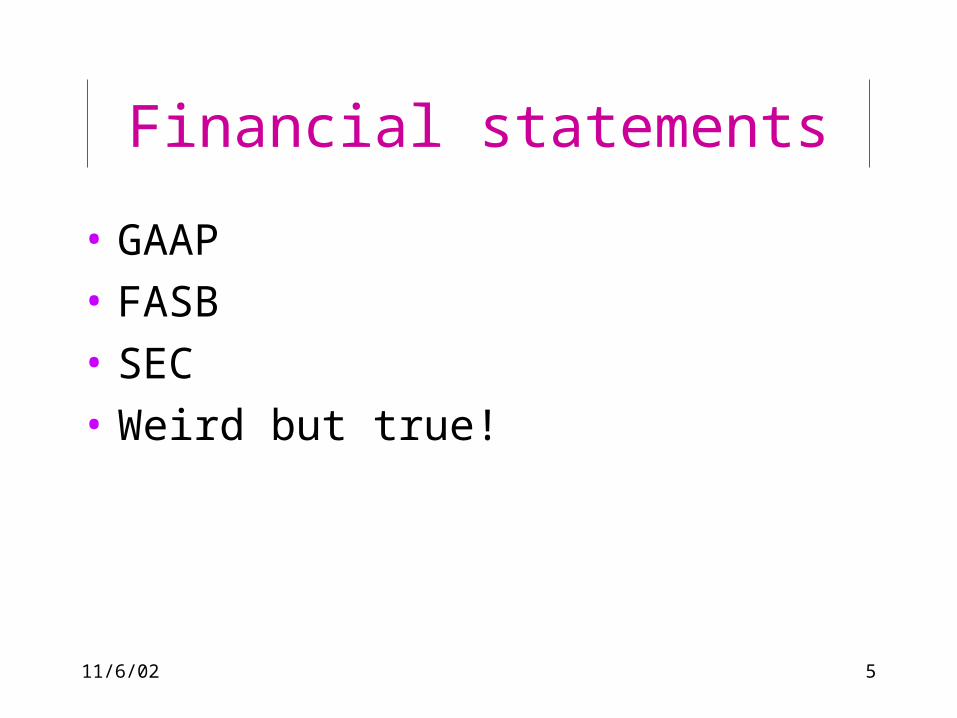
Financial statements
• GAAP• FASB• SEC• Weird but true!
11/6/02 6
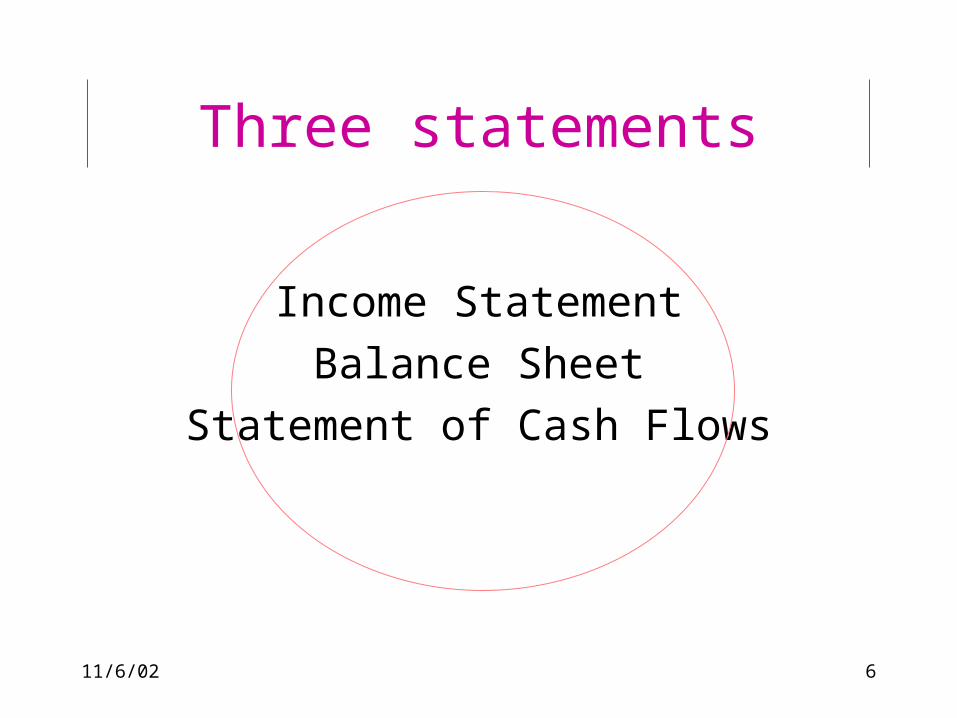
Three statements
Income StatementBalance Sheet
Statement of Cash Flows
11/6/02 7
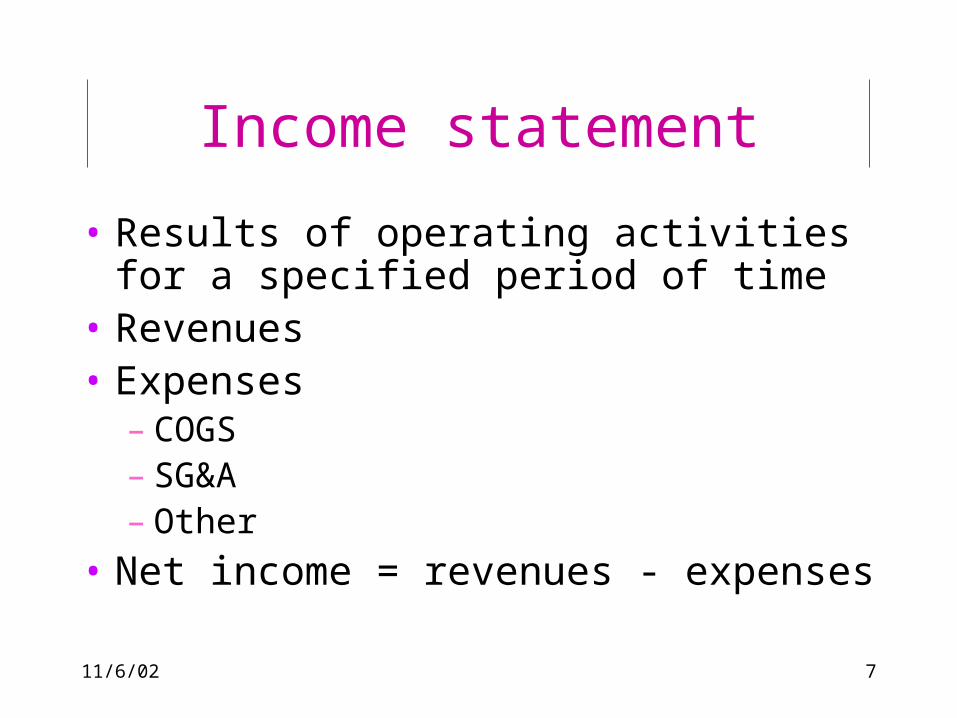
Income statement
• Results of operating activities for a specified period of time
• Revenues• Expenses
– COGS– SG&A– Other
• Net income = revenues - expenses

11/6/02 8
Blue, Inc. income statement1997 1998
Revenues Product 1 Sales 50,000 55,000 Consulting 10,000 12,000 Total Revenues 60,000 67,000
COGS 20,000 35,000
Gross Profit 40,000 32,000 Margin 67% 48%
SG&A 20,000 30,000
Net Profit/Loss 20,000 2,000 Margin 33% 3%

11/6/02 9
Income statement
• Revenues - total number of products/services you realistically expect to sell each time period, month, quarter, year.
• Cost of sales (or cost of goods sold: COGS) - direct costs of selling all products/services for that time period. Includes direct labor, materials, no SG&A (selling, general, and administrative).

11/6/02 10
• Gross profit - subtract total cost of sales from total net revenues.• Gross profit margin - percentage of total
sales. Divide gross profits by total net sales.
• SG&A - all other expenses.• Net profit (before taxes) - subtract total
expenses from gross profit• Net margin - divide net profit by total sales
11/6/02 11
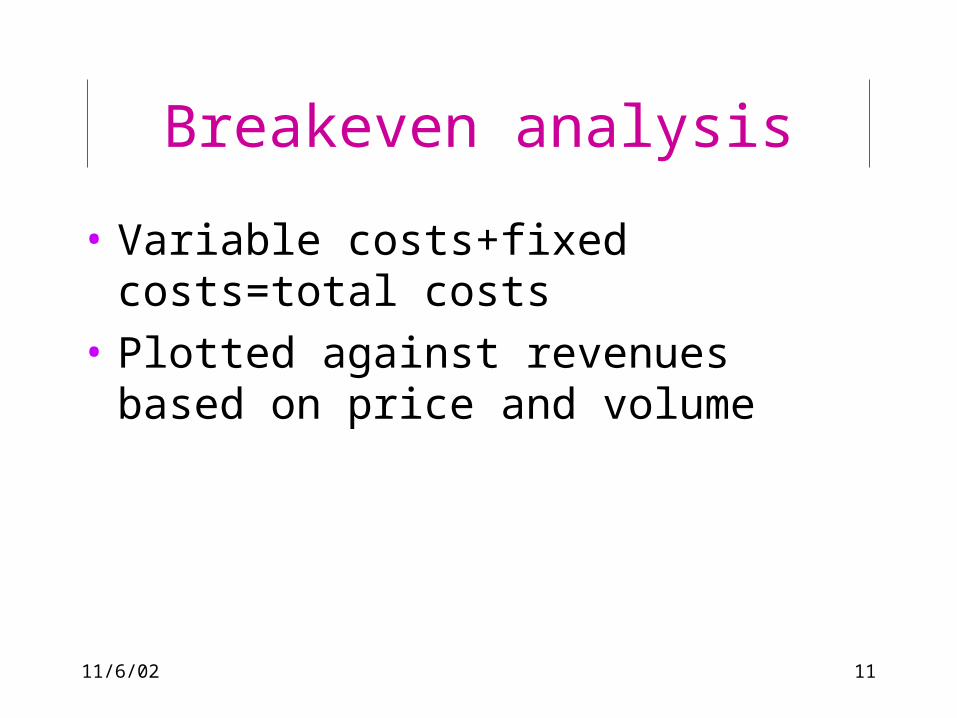
Breakeven analysis
• Variable costs+fixed costs=total costs
• Plotted against revenues based on price and volume

11/6/02 12
Breakeven at $1 per unit
0
10
20
30
40
50
60
10 20 30 40 50
Fixed Costs
Variable Costs
Total Costs
Revenues
Number of Units
11/6/02 13
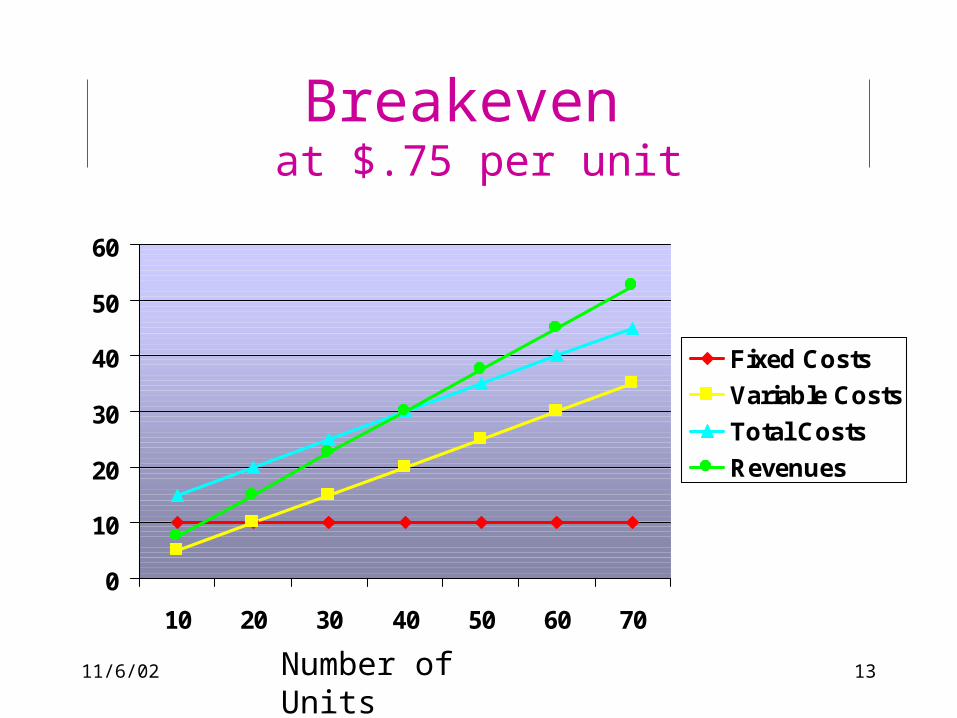
Breakeven at $.75 per unit
0
10
20
30
40
50
60
10 20 30 40 50 60 70
Fixed Costs
Variable Costs
Total Costs
Revenues
Number of Units

11/6/02 14
Total costs
• Fixed– Administrative– Most salaries for a
start up are fixed
• Variable– Directly related to
production– Can be
percentage of some fixed costs
11/6/02 15
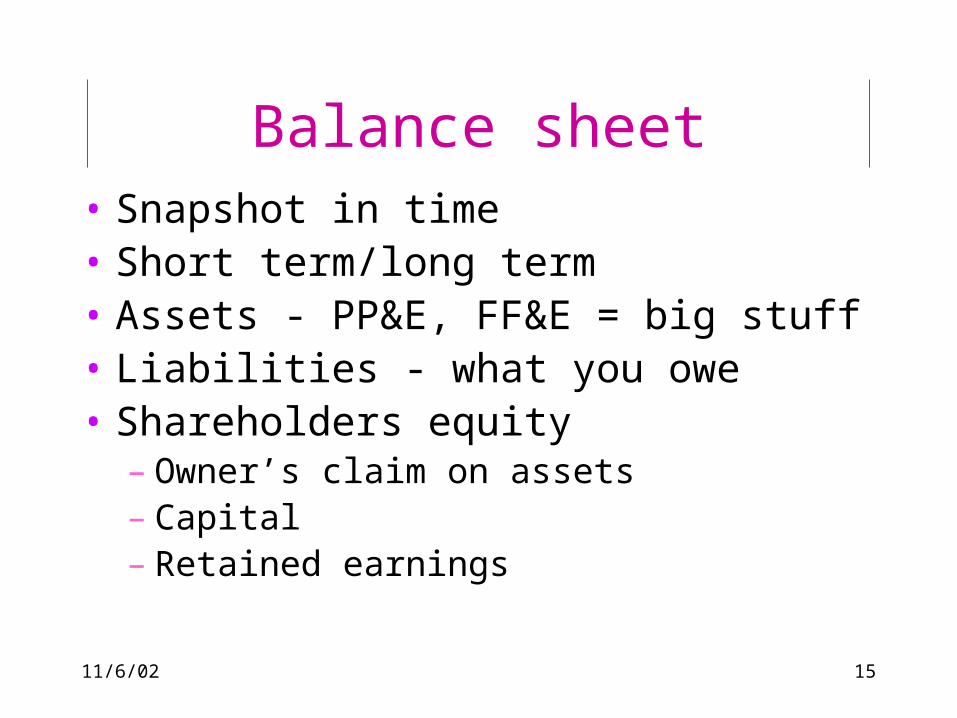
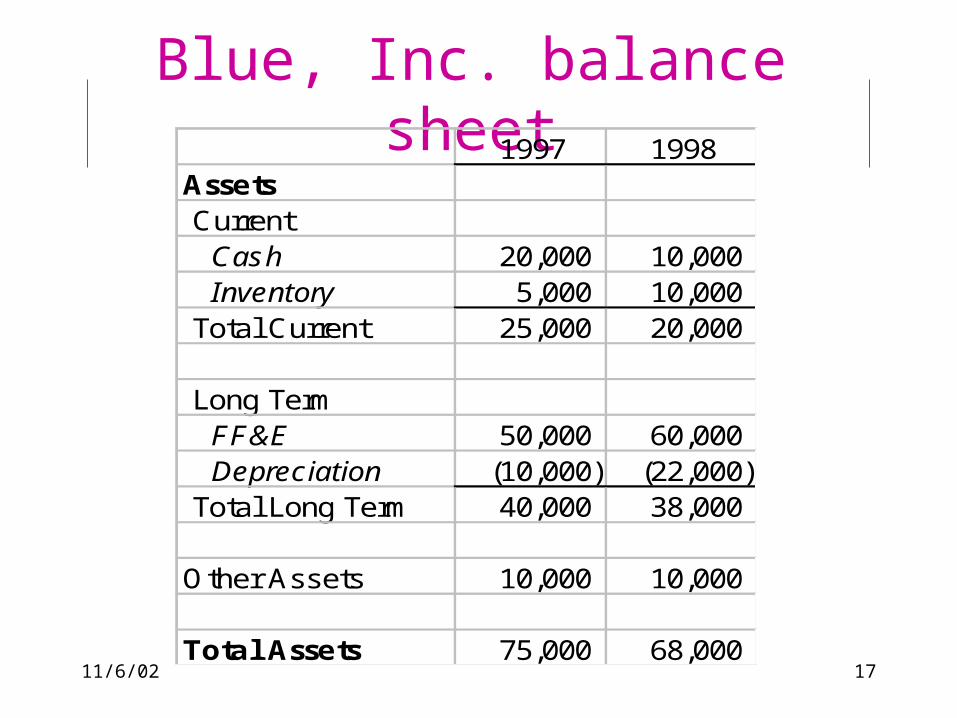
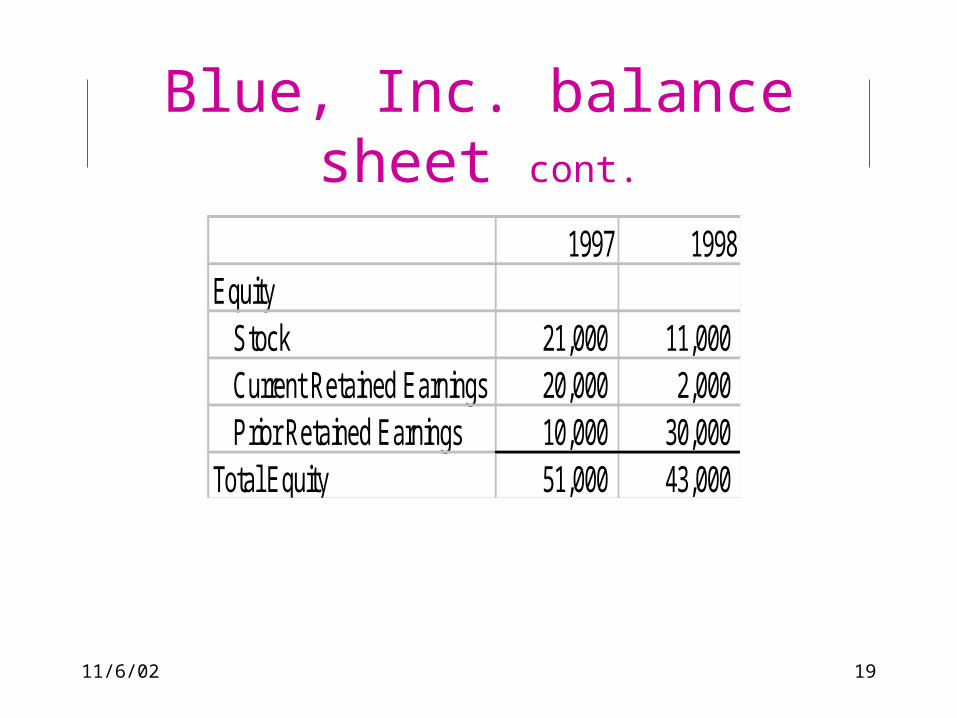
Balance sheet• Snapshot in time• Short term/long term• Assets - PP&E, FF&E = big stuff• Liabilities - what you owe• Shareholders equity
– Owner’s claim on assets– Capital– Retained earnings
11/6/02 16
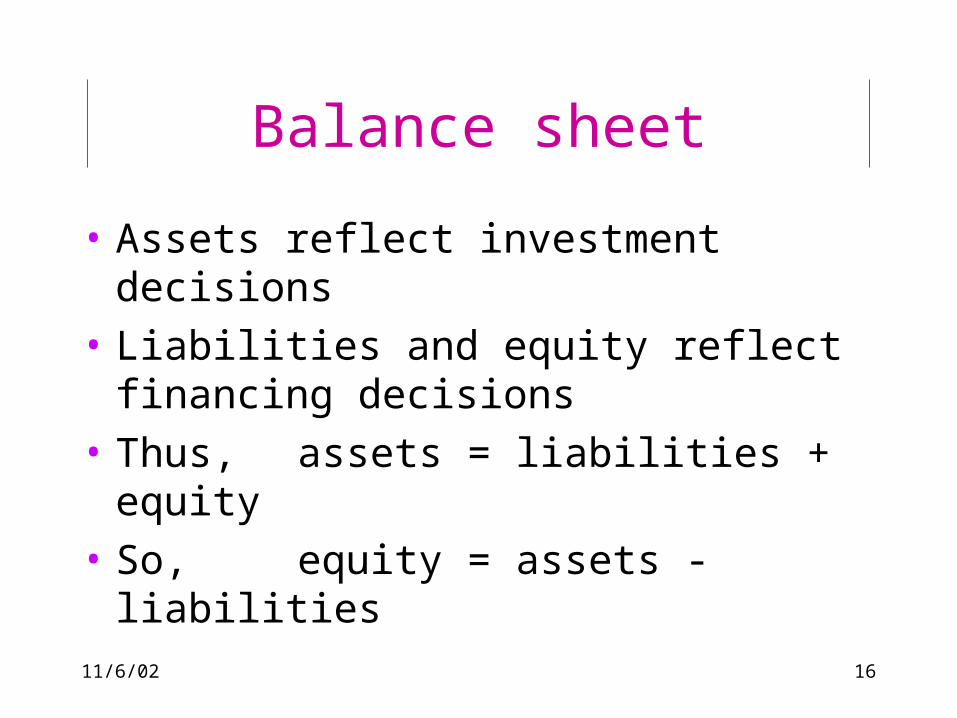
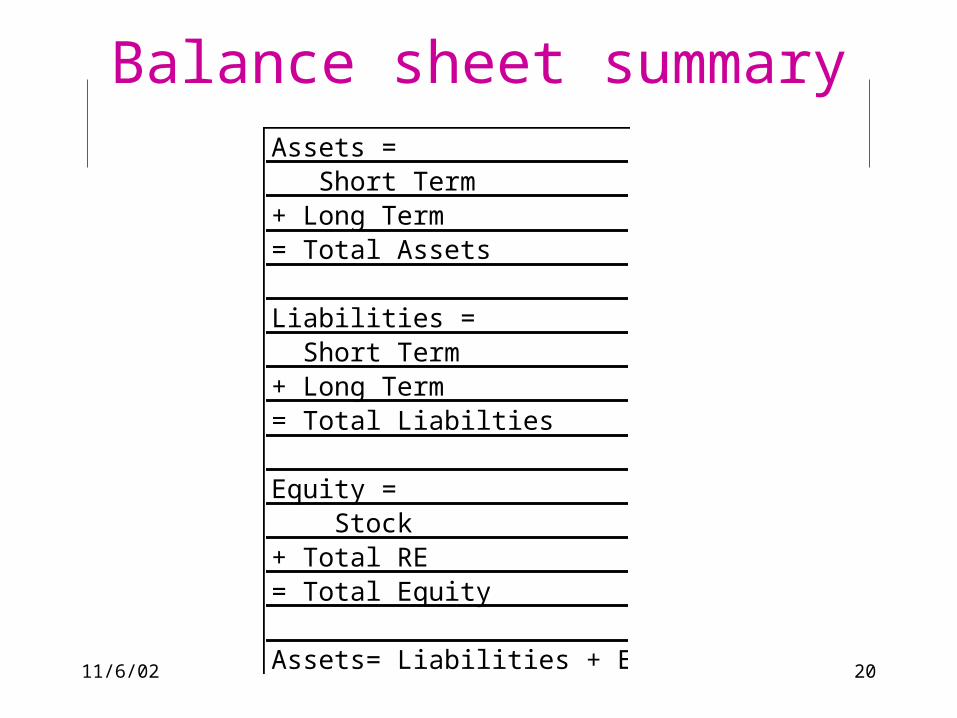
Balance sheet
• Assets reflect investment decisions• Liabilities and equity reflect
financing decisions• Thus, assets = liabilities +
equity• So, equity = assets - liabilities
11/6/02 17
Blue, Inc. balance sheet1997 1998
Assets Current Cash 20,000 10,000 Inventory 5,000 10,000 Total Current 25,000 20,000
Long Term FF&E 50,000 60,000 Depreciation (10,000) (22,000) Total Long Term 40,000 38,000
Other Assets 10,000 10,000
Total Assets 75,000 68,000

11/6/02 18
Blue, Inc. balance sheet cont.1997 1998
Liabilities Current Accounts Payable 5,000 7,500 Other Payable 2,000 3,000 Total Current 7,000 10,500
Long Term Loan 15,000 12,500 Other 2,000 2,000 Total Long Term 17,000 14,500
Total Liabilities 24,000 25,000
11/6/02 19
Blue, Inc. balance sheet cont.
1997 1998Equity Stock 21,000 11,000 Current Retained Earnings 20,000 2,000 Prior Retained Earnings 10,000 30,000 Total Equity 51,000 43,000
11/6/02 20
Balance sheet summaryAssets = Short Term + Long Term= Total Assets
Liabilities = Short Term+ Long Term= Total Liabilties
Equity = Stock+ Total RE= Total Equity
Assets= Liabilities + Equity

11/6/02 21
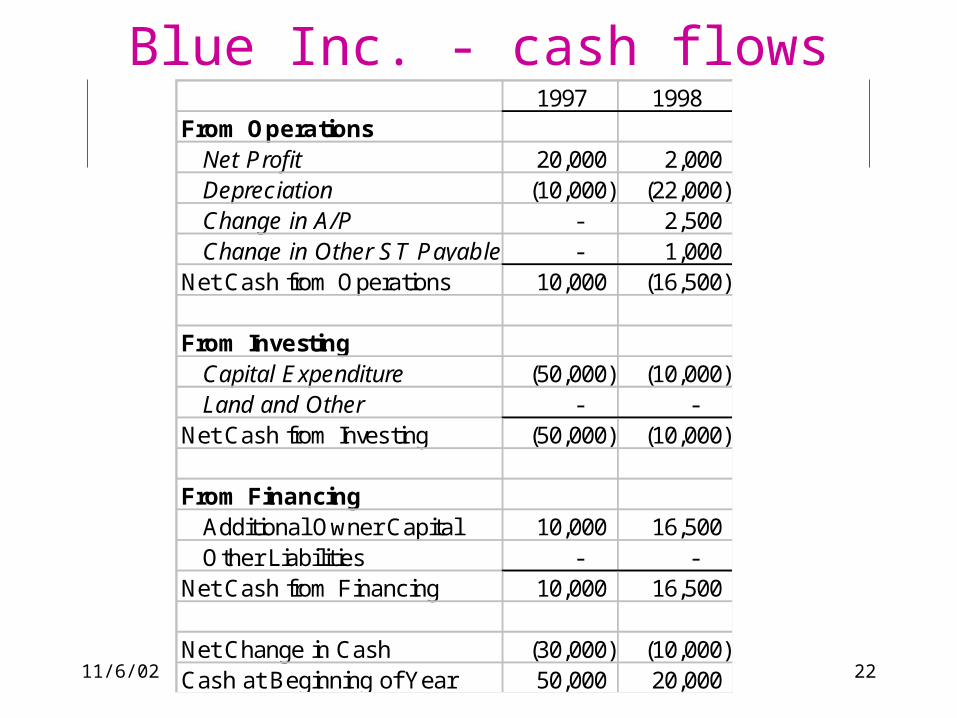
Cash flows
• Net cash flows for specific period of time.
• Operating (day to day)• Investing (for future)• Financing (how you paid)
11/6/02 22
Blue Inc. - cash flows1997 1998
From Operations Net Profit 20,000 2,000 Depreciation (10,000) (22,000) Change in A/P - 2,500 Change in Other ST Payables - 1,000 Net Cash from Operations 10,000 (16,500)
From Investing Capital Expenditure (50,000) (10,000) Land and Other - - Net Cash from Investing (50,000) (10,000)
From Financing Additional Owner Capital 10,000 16,500 Other Liabilities - - Net Cash from Financing 10,000 16,500
Net Change in Cash (30,000) (10,000) Cash at Beginning of Year 50,000 20,000

11/6/02 23
0
10,000
20,000
30,000
40,000
50,000
60,000
70,000
80,000
1997 1998
Revenues
COGS
Gross Profit
SG&A
Net Profit/Loss

11/6/02 24
(40,000)
(30,000)
(20,000)
(10,000)
-
10,000
20,000
30,000
40,000
50,000
60,000
1997 1998
Net Change in Cash
Cash at Beginning of Year
Cash at End of Period