Entrepreneurship, corruption and income inequality · Spencer 2000; Baumol 1990). We thus ask how...
26
Entrepreneurship, corruption and income inequality Name: Farzana Chowdhury Affiliation: Indiana University Email: [email protected] Phone: 812-360-9358 Name: Dr. Sameeksha Desai Affiliation: Indiana University Email: [email protected] Name: Dr. David B. Audretsch Affiliation: Indiana University E-mail: [email protected] Name: Dr. Maksim Belitski Affiliation: University of Reading E-mail: [email protected]
Transcript of Entrepreneurship, corruption and income inequality · Spencer 2000; Baumol 1990). We thus ask how...

Entrepreneurship, corruption and income inequality
Name: Farzana Chowdhury Affiliation: Indiana University Email: [email protected]
Phone: 812-360-9358
Name: Dr. Sameeksha Desai Affiliation: Indiana University
Email: [email protected]
Name: Dr. David B. Audretsch Affiliation: Indiana University E-mail: [email protected]
Name: Dr. Maksim Belitski
Affiliation: University of Reading E-mail: [email protected]

Abstract
Income distribution varies widely across countries, the exact reason of which remains unclear. This study fills an important gap in the study of income distribution by exploring relationships among, entrepreneurship, corruption, and distribution of income. Examining low and middle income countries of South and East Asia region during the period of 2004-2012, we find that while entrepreneurship reduces income inequality but types of entrepreneurship is also an important factor. Level of corruption in a country also plays an important role. Countries with low level of corruption are better able to reduce inequality through entrepreneurial activity.
JEL codes: D31, D63, O15, O53
Keywords: Entrepreneurship, Income Inequality, Corruption, South and East Asia
This work was supported by funding from Ostrom Workshop in Political Theory and Policy Analysis in Indiana University.

Introduction
Income distribution varies widely across countries, the exact reason of which remains unclear
and remains under investigation (Piketty 2014). Social factors such as demographic transition,
trade, investment pattern etc. that influence income inequality has been examined by sociologists
(Reuveney and Li 2003; Simpson 1990; Nielsen and Alderson 1995). Political sociologists have
examined the impact of political environment on income inequality (Lee 2005; Reuveney and Li
2003; Simpson 1990). Existing studies fail to establish a robust relationship to explain the
variation. In this study, we propose an alternative relationship, specifically, we propose that the
level of corruption level in a country may be useful in explaining variation in income distribution
through entrepreneurship.
Our paper builds from previous work by Gupta et. al. (2002) and Dobson and Dobson (2012)
by asking whether corruption influences income distribution generated through entrepreneurial
activity. Our analysis fills an important gap in the study of income distribution by providing a
new framework for exploring relationships between entrepreneurship, corruption, and
distribution of income.
Entrepreneurship is an important economic activity for society and is linked to economic
growth and job creation (Acs and Audretsch 2005; Wenneker et al., 2005). Wennekers et al.
(2005) argued that developing countries can benefit from growth of young businesses. Still, the
level of entrepreneurial activity varies across countries and can be affected by the state and
quality of resources related to governing institutions, financial institutions, financial systems and
human capital.

In addition to entrepreneurship, corruption may also play a role in driving income distribution.
Corruption can represent a weak institutional environment and is often prevalent in developing
countries. Institutions are a set of prescriptions and constraints that humans use to organize all
forms of repetitive and structured interactions (Ostrom 2005). North (1994) describes
institutions as “rules of game in the society” and constraints that structure human interaction…
made up of formal constraints (e.g., rules, laws, and constitutions) (p. 360). Institutions influence
individual’s economic behaviour and economic transactions. Both of these factors influence
supply and demand of entrepreneurs as well as quality of entrepreneurship (Busenitz, Gomez and
Spencer 2000; Baumol 1990). We thus ask how corruption, entrepreneurship and income
inequality are related, and we focus particularly on the developing countries of South and East
Asia where variance in all three dynamics are ripe for examination.
This study contributes to the burgeoning literature on institutions in four ways. First, our
study find that entrepreneurship helps to reduce income inequality. In addition, the type of
entrepreneurial activity is an important predictor of income inequality. In this article we consider
three types of entrepreneurial activities--- necessity entrepreneurship, opportunity
entrepreneurship, and total early stage entrepreneurial activity (TEA). Second, the level of
corruption is also an important factor for income distribution. More corruption weakens the
positive impact of entrepreneurship on income inequality. Our study also demonstrates the
importance of redistribution, “a rising tide lifts all boats”1.
The rest of the paper is structured as follows. Section 2 presents our theoretical approach and
hypotheses that corruption impacts the relationship between entrepreneurship and income
inequality. Section 3 discusses data and methodology. Section 4 reports the results and Section 5
1 Attributed to John F. Kennedy, 1963 speech

presents a discussion and conclusion. Section 6 identifies policy implications and future research
questions.
Linking income inequality and entrepreneurship in developing countries
The role of entrepreneurship in economic development is well-argued (Baumol 2002;
Wennekers and Thurik 1999; Schumpeter 1934). Still, the level of entrepreneurial activity
remains different across countries (Stenholm et. al. 2013). Different levels of economic
development, financial access, labor market opportunities, and personal wealth can contribute to
this variation (Aidis et al. 2012; Holtz-Eakin et al. 1994). Despite the variation, entrepreneurial
activity can help to reduce income inequality by creating jobs at the local level. Entrepreneurial
activity can be formal and informal. In one hand, an entrepreneur can be a ‘gap filler’ by
exploiting new opportunities, inventing and improving product or production processes
(Schumpeter 1934). In the process, this can create new markets and jobs at local level and this
increased employment level and creation of human capital can translate to a better standard of
living and lower income inequality. On the other hand, an entrepreneur can be self-employed and
trying to meet basic needs (Earle and Zakova 1999). Individuals at the bottom of income
distribution in developing countries can face limited opportunity for education or for developing
human capital2. This can translate to poor access to employment opportunities in the wage labor
market, making self-employment an option for survival and self-sufficiency. Regardless of the
types we propose that entrepreneurial activity helps to reduce income inequality.
We posit that corruption, or government officials’ use of their authority for private gain in
implementing public policies (Rose-Ackerman 1999, 2007; Rodriguez et al. 2006) affects
2 Human capital in this case we refer to as education as well as training and skills necessary for employment (Davidsson and Honig 2003).

income inequality in a country. Corruption is a common feature in many of the developing and
emerging countries and represents weak institutional environment (Montinola and Jackman,
2002). Causes behind corruption ranges from motivation and opportunities to low and underpaid
public employees (Rose-Ackerman 1978, 1999; Treisman, 2000). Existing literatures support
that corruption and income inequality are positively related (Gupta et al, 2002) find that
corruption affect income inequality, “An increase of one standard deviation in corruption
increases the Gini coefficient of income inequality by about 11 points..” (p.1).
Corruption, Entrepreneurship, and Inequality
Kuznets (1955) proposed that during the initial stages of economic growth income inequality
increases and gradually decreases as growth reaches its final stage, presenting a U-shaped
relationship. Similar to other developing countries across the world, developing countries of
South-Asia are in the initial stages of development and have large income inequality. Therefore
during this initial stage of development quality of labor force, occupational choice, and
educational choices made by individuals are important for sustainability, self-sufficiency and to
improve living standard and to reach high social status (Fershtman et al. 1999). Corruption level
of a country influences both allocation of resources and occupational choice such as undertaking
entrepreneurial activity. Corruption influences entrepreneurship by increasing transaction costs,
by violating trust in government officials to enforce contracts and regulations consistently and in
business itself to comply with the government regulation, and by reducing transparency (Coase
1960; Bowen and De Clerq 2008; Luhmann, 1988). Given entrepreneurs take on enormous risks
and uncertainty associated with entrepreneurial activity, all of the problems associated with
corruption adds to the risks and uncertainty and influences an entrepreneurs decision to pursue

entrepreneurial activity, “the portion of the value that the venture creates that the entrepreneur is
able to capture for their own purposes” (Baker et al. 2005: 497).
Government authorities can engage in corrupt behavior in various ways. For instance Glaeser
and Goldin (2006) identified that government authorities can steal public funds directly, take
bribes or other forms of payments for transferring government funds or services, for breaking
government rules and regulations, or manipulate laws directly by lobbying for certain types of
laws that benefit their financial interest directly. Corrupt bureaucrats can use the latter two
method to either be helpful or hurtful to entrepreneurs as well as distribute resources
inefficiently.
In an extensive regulatory environment entrepreneurs who are able to pay bribes bureaucrats
can be helpful and efficient by speeding up the process of getting permits and avoiding red tapes
(Dreher and Gassebner 2013; Klapper et al. 2006; Méon and Sekkat 2005). In this case
entrepreneurs’ ability to pay is a concern because entrepreneurs in general have financial
constraint and it is more problematic for entrepreneurs in developing countries because financial
sector is not well developed (Paulson and Townsend, 2004). On the other hand, entrepreneurs in
developing countries tend to be from elite in the society and well connected. It has been
established that better connected individuals and individuals who belong to high-income group in
a society are better able to benefit from corruption (Tanzi 1995). Therefore entrepreneurial
activity level increases in society.
As the entrepreneurial level increases in a country they become better connected and
increasingly have more resources to use. This increases connection also helps to divert
government resources. Government officials are responsible for implementing public policies
and corrupt officials can use this opportunity to extract bribe and allocate resources inefficiently.

Well-targeted social programs can help to lower income inequality by providing social services,
health services, and educational services to people who can benefit from these services (Gupta et
al. 2002). Gupta et al. (2002) find that corruption reduces the share of government expenditures
on education and health care. Therefore an increase in entrepreneurial activity will benefit
individuals but corruption hinders the spillover of the benefit to greater society.
DATA AND METHODOLOGY
We constructed our sample by matching data from the following sources at the country level:
World Development Indicators (2004-2012), Doing Business Database (2004-2012), Global
Entrepreneurship Monitor (GEM) (2004-2012), Polity (2004-2012), and World Governance
Indicators (2004-2012). Countries included in our sample are low and middle income countries
in the South and East Asia as classified by the World Bank. Low income countries have per
capita Gross National Income, or GNI ≤ $4,085 and middle income countries have GNI of
$4,085 - $12,615. Countries included in the article are Bangladesh, China, India, Indonesia,
Malaysia, Pakistan, Philippines, and Thailand. Due to missing data we used mean of available to
data to fill in the gap. We have 64 observations.
Our dependent variable, income inequality level in a country is measured by the Gini
coefficient (Li et al. 2013; Knight 2013; Deininger and Squire 1996). The coefficient ranges
from 0 to 100 with 100 denotes perfect income inequality and zero denotes perfect equality. The
Gini coefficient is computed based on Lorenz curve3. Data was collected from World
Development Indicator Database4. Table 1 reports detailed description, and sources of variables
included in the study.
3 For detailed computation of the data see Nafziger (1997) 4 Data is available at http://data.worldbank.org/indicator/SI.POV.GINI.

Three of our independent variables are collected from Global Entrepreneurship Monitor
(GEM)--Necessity entrepreneurship (NEC), opportunity entrepreneurship (OPP), and total early
stage entrepreneurial activity (TEA) (Ardagna and Lusardi 2008). Necessity entrepreneurship is
measured by percentage of those involved in total entrepreneurial activity who are involved in
entrepreneurship because they had no other option for work (Ardagna and Lusardi 2008;
McMullen et al. 2008). Opportunity entrepreneurship entails an individual’s decision to engage
in entrepreneurial activity is motivated by opportunity, is measured by percentage of those
involved in total entrepreneurial activity who claim to be driven by opportunity as opposed to
finding no other option for work and who indicate the main driver for being involved in this
opportunity is being independent or increasing their income, rather than just maintaining their
income (Ardagna and Lusardi 2008; McMullen et al. 2008). TEA is measured by percentage of
population (18-64) who are either a nascent entrepreneur or owner-manager of a new business
(Ardagna and Lusardi 2008). These data help us to determine types of entrepreneurial activity as
well as what phase of activity helps with reducing or not reducing income inequality.
Table 1: Variable list for analyses of entrepreneurship, corruption, and income inequality
Variables Description Source GINI Gini index measures the extent to which the distribution of
income (or, in some cases, consumption expenditure) among individuals or households within an economy deviates from a perfectly equal distribution. A Lorenz curve plots the cumulative percentages of total income received against the cumulative number of recipients, starting with the poorest individual or household. The Gini index measures the area between the Lorenz curve and a hypothetical line of absolute equality, expressed as a percentage of the maximum area under the line. Thus a Gini index of 0 represents perfect equality, while an index of 100 implies perfect inequality.
World Development Indicator Database. Data is available at http://data.worldbank.org/indicator/SI.POV.GINI
Democracy The POLITY score ranges from +10 (strongly democratic) to -10(strongly autocratic).
Polity

Openness Foreign direct investment are the net inflows of investment to acquire a lasting management interest (10 percent or more of voting stock) in an enterprise operating in an economy other than that of the investor. It is the sum of equity capital, reinvestment of earnings, other long-term capital, and short-term capital as shown in the balance of payments. This series shows net inflows (new investment inflows less disinvestment) in the reporting economy from foreign investors, and is divided by GDP (% of GDP).
International Monetary Fund, International Financial Statistics and Balance of Payments databases, World Bank, International Debt Statistics, and World Bank and OECD GDP estimates.
Economic Development
GDP per capita is gross domestic product divided by midyear population. GDP at purchaser's prices is the sum of gross value added by all resident producers in the economy plus any product taxes and minus any subsidies not included in the value of the products. It is calculated without making deductions for depreciation of fabricated assets or for depletion and degradation of natural resources. Data are in constant local currency (constant LCU).
World Bank national accounts data, and OECD National Accounts data files.
Tertiary Tertiary school gross enrollment ratio (% gross). United Nations Educational, Scientific, and Cultural Organization (UNESCO) Institute for Statistics.
Business Environment
Time required to enforce a contract is the number of calendar days from the filing of the lawsuit in court until the final determination and, in appropriate cases, payment (days)
World Bank, Doing Business project (http://www.doingbusiness.org/).
Natural Resources
Total natural resources rents are the sum of oil rents, natural gas rents, coal rents (hard and soft), mineral rents, and forest rents (% of GDP).
Estimates based on sources and methods described in "The Changing Wealth of Nations: Measuring Sustainable Development in the New Millennium" (World Bank, 2011).
Low Corruption-WGI
Perceptions of the extent to which public power is exercised for private gain, including both petty and grand forms of corruption, as well as “capture” of the state by elites and private interests. The score ranges from -2.5 to 2.5; score of greater than zero corresponds to low level of corruption.
Kauffmann et al., 2013; World Governance Indicator (WGI)
Low Corruption-IEF
Corruption data was primarily derived from Transparency International’s Corruption Perceptions Index (CPI). The index score ranges from 0 to 100 with 100 being less corruption.
Index of Economic Freedom (IEF)
NEC Those who are involved in Total entrepreneurial activity (TEA) because they had no other option for work (% of those involved in Total entrepreneurial activity)
Global Entrepreneurship Monitor (GEM)
OPP Those involved in Total Entrepreneurial Activity (TEA) who claim to be driven by opportunity as opposed to finding no other option for work and who indicate the main driver for being involved in this opportunity is being independent or increasing their income, rather than just maintaining their income (% of those involved in Total entrepreneurial activity)
Global Entrepreneurship Monitor (GEM)
TEA Individuals who are either a nascent entrepreneur or owner-manager of a new business (% of 18-64 years population)
Global Entrepreneurship Monitor (GEM)

We use two measures of corruption. One measure of Corruption was obtained from World
Governance Indicator (WGI) which captures the ‘perceptions of the extent to which public
power is exercised for private gain, including both petty and grand forms of corruption, as well
as "capture" of the state by elites and private interests’ (Kauffmann et al. 2013). The index score
ranges from -2.5 to 2.5 with higher numbers representing low level of corruption. Second
measure of corruption was collected from Index of economic freedom (IEF) (Aidis et al. 2012).
The index measure ranges from 0 to 100; 0 pertains to high corruption and 100 is low corruption.
Time required for contract enforcement is used as proxy for business environment.
Control variables included in this study are level of economic development (Economic
Development), tertiary gross enrollment (Tertiary), openness of the economy is measured by
inflow of foreign direct investment as a ratio of GDP (Openness), share of natural resources as a
ratio of GDP (Natural Resource Endowment), political environment (Democracy) measure is
taken from Polity, and business environment of a country is measured by time required for
contract enforcement from doing business (Business Environment).
Table 2 presents the correlations of all the variables included in the study. Both of corruption
measures are highly correlated (0.88). Opportunity and necessity entrepreneurship are not highly
correlated. Opportunity entrepreneurship and tertiary have correlation of (0.62) which suggest
that higher educated individuals are likely to search for entrepreneurial opportunity (Davidsson
and Honig, 2003). Level of education also has positive relationship with both measures of low
corruption IEF and WGI (0.63 and 0.61, respectively).

Table 2: Correlation
Obs Mean
Std. Dev.
1 2 3 4 5 6 7 8 9 10 11
1 Gini (ln) 64 3.71 0.15 1
2 Democracy 64 3.58 5.9 -0.27* 1
3 Foreign Direct Investment (ln)
64 0.67 0.79 0.13 -0.37* 1
4 Economic Development(ln)
64 11.61 2.21 -0.42* 0.41* -0.12 1
5 Tertiary 64 2.93 0.70 0.34* 0.18 0.26* 0.17 1
6 Business Environment
64 6.57 0.48 -0.07 0.35* -0.44* -0.29* -0.61* 1
7 Natural Resources
64 1.9 0.53 -0.08 -0.09 0.24 0.24 0.03 -0.28* 1
8 Low Corruption-IEF
64 69.61 9.71 0.28* -0.12 0.35* -0.33* 0.63* -0.43* 0.37* 1
9 Low Corruption-WGI
64 -0.34 0.46 0.31* 0.17 0.26* -0.31* 0.61* -0.17 0.29* 0.88* 1
10 NEC 64 28.83 13.37 -0.06 -0.49* -0.05 -0.42* -0.41* 0.08 -0.59* -0.31* -0.49* 1
11 OPP 64 48.85 12.21 0.34* -0.04 0.29* 0.38* 0.62* -0.64* 0.28* 0.19 0.16 -.53* 1
12 TEA 64 13 6.72 -0.39* 0.14 0.03 0.19 0.16 -0.30* 0.10 0.19 0.06 -0.003 -0.07
EMPIRICAL METHODOLOGY
We use OLS method. To assess the hypothesis of this study we use the following equation:
(1)
where yit is entrepreneurship in a given country i at time t, β and Ɵ are parameters to be
estimated, xit is a vector of independent explanatory variables and zit is a vector of strictly
exogenous control variables. Error term uit consists of unobserved country-specific effects, and
the observation-specific errors. Given endogeneity is concern for cross-section time series
analysis we lagged all the independent and control variables one year. We perform OLS
estimation with Huber/White/sandwich estimator and robust standard error.
To address the multicollinearity concern in institutional analysis, we have utilized variance
inflation factor (VIF). None of the variables included in the models have VIF score above 10
(Kutner et al. 2004). Given all VIFs are below the accepted level of 10, we conclude that
multicollinearity is not a significant factor and unlikely to have biased the results.

Results
Table 3 presents results of the OLS regression. Model 1 includes only controls of this study.
All of our control variables present expected results. Democratic political environment helps to
reduce income inequality (Reuveney and Li 2003). Foreign investment also has negative
relationship with income inequality (Reuveney and Li 2003). Economic development reduces
income inequality (Reuveney and Li 2003). Higher level of human capital increases income
inequality because individual with higher level of education tend to have better jobs and have
better occupational choice than less educated individuals. In addition, poor families have more
children and acquiring education is expensive, therefore families with less children and adequate
financial resources are better able to attain education (Gupta et. al. 2002; Heerink 1994;
Dasgupta 1993). Business friendly environment promotes business activity (Klapper et al. 2006).
Natural resource endowment increases income inequality (Gupta el al. 2002; Sachs and Warner
19997). Model 2 and 3 include corruption measures from two sources. Model 2 shows result of
corruption measure from Index of economic freedom and Model 3 presents result of World
Governance Indicators. In both models less corruption leads to less income inequality (Gupta et
al. 2002).
Models 3, 4, 5, and 6 include measures of all three types of entrepreneurial activity. All types
of entrepreneurial activities--- necessity, opportunity, and TEA, reduces income inequality
except opportunity entrepreneurship.

Table 3: Corruption, entrepreneurship and income inequality: OLS estimates (dependent variable: Gini coefficient)
(1) (2) (3) (4) (5) (6) (7) (8) (9)
Con
tro
ls
Co
rrup
tio
n
Co
rrup
tio
n
Nec
essi
ty
En
trep
rene
urs
hip
Nec
essi
ty
En
trep
rene
urs
hip
Op
port
uni
ty
En
trep
rene
urs
hip
Op
port
uni
ty
En
trep
rene
urs
hip
TE
A
TE
A
Democracy -0.01*** (0.00)
-0.01* (0.00)
-0.01** (0.00)
-0.01** (0.00)
-0.01*** (0.00)
-0.01** (0.00)
-0.01** (0.00)
-0.01 (0.00)
-0.01* (0.00)
Foreign Direct Investment (ln)
-0.02 (0.01)
-0.01 (0.02)
-0.02 (0.01)
-0.02 (0.02)
-0.02 (0.01)
-0.02 (0.01)
-0.02 (0.01)
-0.01 (0.02)
-0.02 (0.02)
Economic Development (ln)
-0.01+ (0.01)
-0.03+ (0.02)
-0.04** (0.02)
-0.04** (0.02)
-0.05** (0.02)
-0.03* (0.01)
-0.04* (0.01)
-0.03* (0.01)
-0.04** (0.02)
Human Capital 0.17*** (0.04)
0.23*** (0.05)
0.27*** (0.04)
0.18*** (0.05)
0.22*** (0.04)
0.13** (0.05)
0.17*** (0.05)
0.20*** (0.04)
0.23*** (0.04)
Business Environment
0.17** (0.05)
0.18*** (0.05)
0.13* (0.05)
0.11* (0.05)
0.08 (0.05)
0.19*** (0.04)
0.17*** (0.04)
0.10+ (0.06)
0.08 (0.05)
Natural Resources (ln)
0.02 (0.02)
0.07 (0.04)
0.11** (0.04)
-0.01 (0.05)
0.05 (0.05)
0.01 (0.04)
0.05 (0.04)
0.06+ (0.04)
0.10* (0.04)
Low Corruption- IEF
-0.12 (0.09)
-0.16+ (0.08)
-0.04 (0.07)
-0.11 (0.08)
Low Corruption-WGI
-0.01** (0.00)
-0.01** (0.00)
-0.01 (0.00)
-0.01* (0.00)
Necessity Entrepreneurship
-0.01* (0.00)
-0.004* (0.00)
Opportunity Entrepreneurship
0.01*** (0.00)
0.01** (0.00)
TEA -0.01** (0.00)
-0.01* (0.00)
Constant 2.31*** (0.50)
2.10*** (0.49)
2.79*** (0.51)
3.17*** (0.60)
3.52*** (0.58)
2.09*** (0.37)
2.41*** (0.45)
2.78*** (0.56)
3.21*** (0.53)
N 64 64 64 64 64 64 64 64 64 R-square 0.46 0.49 0.56 0.55 0.59 0.61 0.62 0.57 0.61 RMSE 0.11 0.11 0.10 0.10 0.10 0.10 0.10 0.10 0.10 F stat 12.88 10.37 9.32 11.28 9.55 14.30 13.18 11.82 12.47 loglikelihood 53.17 54.86 59.80 58.74 61.82 63.42 64.45 60.00 62.95 Numbers in parentheses are t-statistics based on Huber/Whites/sandwich estimator. Standard errors controlled for heteroskedasticity are in parenthesis.***Significant at 1 percent level; **significant at 5 percent level; and * significant at 10 percent level.
Table 4 presents results of interaction relationships. Both measures of corruption present
same result; low level of corruption reduces income inequality significantly in all the models
except 3 and 4. Model 1 and 2 present results for necessity entrepreneurship. Necessity
entrepreneurship reduces income inequality in both models. However, interaction coefficient is
positive with income inequality, which does not support our hypotheses (Figure 1). Model 3 and
4 include opportunity entrepreneurship. Opportunity entrepreneurship coefficient reflects that it

increases income inequality, but interaction with corruption reduces income inequality (β = -0.01
and β= -0.001), significant at 10 percent. We find support for our hypothesis (Figure 2).
Furthermore, the relationship between opportunity entrepreneurship with corruption and
inequality is nonlinear. Low rate of opportunity entrepreneurship in a country increases
inequality at a high level of corruption however with the level of opportunity entrepreneurship
growing even at a high corruption rates it enables decrease inequality. Therefore in a condition of
high corruption increasing opportunity entrepreneurship could be a public policy. Model 5 and 6
include ratio of include TEA. TEA has negative relationship with income inequality. We find
conflicting results with interactions. Interaction of corruption and entrepreneurship have positive
impact on income inequality in both of these models (Figure 3). The result suggests that even at a
high rates of corruption increasing TEA could help in reducing inequality while in a low level of
corruption increasing TEA could in fact increase inequality. Thus for policy makers targeting
inequality growing TEA is a public good which enables to decrease inequality in an environment
with moderate and high level of corruption.
Table 4: Results of Interaction models
(1) (2) (3) (4) (5) (6)
Nec
essi
ty
En
trep
rene
urs
hip
Nec
essi
ty
En
trep
rene
urs
hip
Op
port
uni
ty
En
trep
rene
urs
hip
Op
port
uni
ty
En
trep
rene
urs
hip
TE
A
TE
A
Democracy -0.01** (0.00)
-0.01 (0.00)
-0.01* (0.00)
-0.004+ (0.00)
-0.01* (0.00)
-0.01+ (0.00)
Foreign Direct Investment (ln) -0.02 (0.01)
-0.01 (0.01)
-0.01 (0.01)
-0.01 (0.01)
-0.001 (0.02)
-0.001 (0.02)
Economic Development(ln) -0.05** (0.02)
-0.06*** (0.01)
-0.04** (0.01)
-0.05*** (0.01)
-0.03* (0.01)
-0.02+ (0.01)
Human Capital(ln) 0.20*** (0.04)
0.13** (0.05)
0.10* (0.05)
0.10* (0.04)
0.19*** (0.05)
0.15** (0.05)
Time required for contract enforcement 0.08 (0.05)
0.05 (0.05)
0.12* (0.05)
0.09* (0.04)
0.06 (0.05)
0.09 (0.06)
Natural Resources (ln) 0.05 (0.05)
0.03 (0.04)
0.002 (0.05)
0.01 (0.03)
0.04 (0.05)
0.01 (0.04)
Low Corruption- IEF -0.01** (0.00)
0.02** (0.01)
-0.02*** (0.00)
Low Corruption-WGI -0.42*** 0.42** -0.24*

(0.09) (0.14) (0.09)
Necessity Entrepreneurship -0.01* (0.00)
-0.0001 (0.00)
Low Corruption- IEF*Necessity Entrepreneurship 0.0002 (0.00)
Low Corruption-WGI*Necessity Entrepreneurship 0.01*** (0.00)
Opportunity Entrepreneurship 0.02*** (0.00)
0.002* (0.00)
Low Corruption- IEF*Opportunity Entrepreneurship -0.001*** (0.00)
Low Corruption-WGI*Opportunity Entrepreneurship -0.01*** (0.00)
TEA -0.03** (0.01)
-0.003* (0.00)
Low Corruption- IEF*TEA 0.001** (0.00)
Low Corruption-WGI*TEA 0.01** (0.00)
Constant 3.74*** (0.64)
3.69*** (0.60)
2.17*** (0.43)
3.26*** (0.40)
3.59*** (0.54)
2.97*** (0.59)
N 64 64 64 64 64 64 R-square 0.61 0.64 0.69 0.71 0.67 0.65
Root Mean Square Error 0.10 0.09 0.09 0.08 0.09 0.09 F stat 9.97 13.81 27.25 28.94 18.55 20.74 loglikelihood 62.95 65.82 70.35 73.22 68.47 66.43 Numbers in parentheses are t-statistics based on Huber/Whites/sandwich estimator. Standard errors controlled for heteroskedasticity are in parenthesis. ***Significant at 1 percent level; **significant at 5 percent level; and * significant at 10 percent level.
Figure 1: Relationship between necessity entrepreneurship, corruption, and income inequality
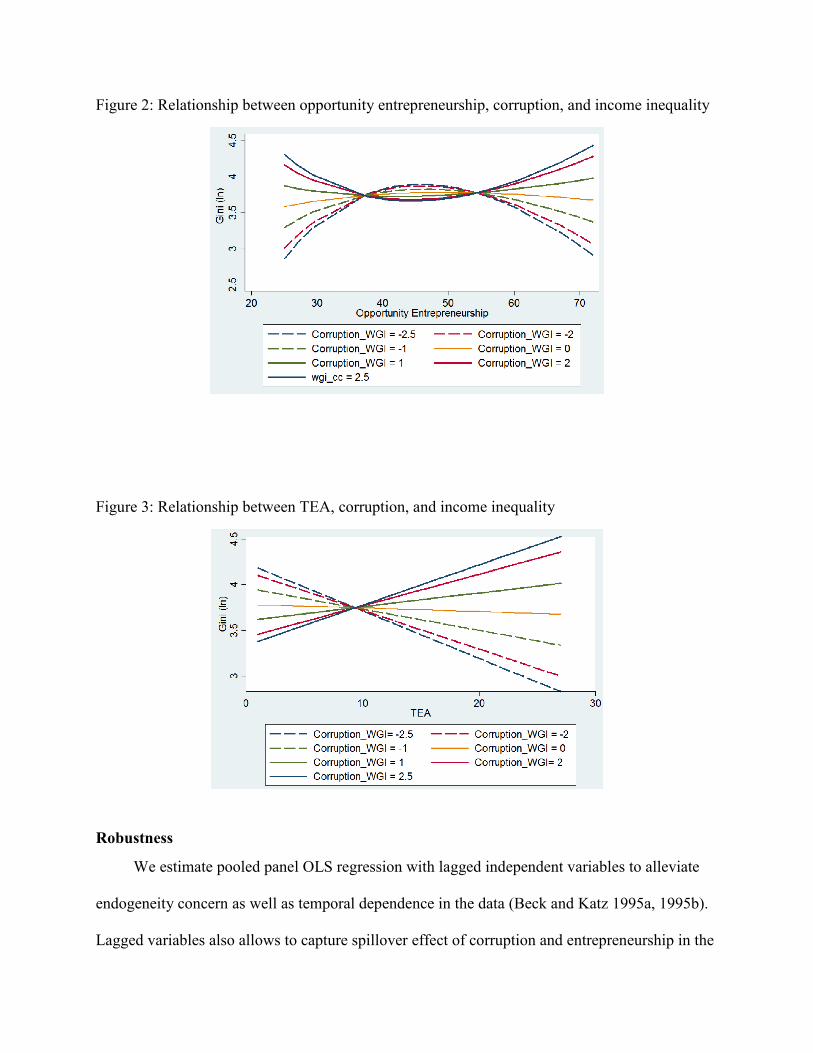
Figure 2: Relationship between opportunity entrepreneurship, corruption, and income inequality
Figure 3: Relationship between TEA, corruption, and income inequality
Robustness
We estimate pooled panel OLS regression with lagged independent variables to alleviate
endogeneity concern as well as temporal dependence in the data (Beck and Katz 1995a, 1995b).
Lagged variables also allows to capture spillover effect of corruption and entrepreneurship in the

previous years. In addition as one may notice from the table two measures of corruption are used
from World Governance Indicator (WGI) and Index of Economic Freedom to have more robust
and unbiased results. We estimate the following model:
β ) , i=1,..., N; t=1,...,T-1 (2)
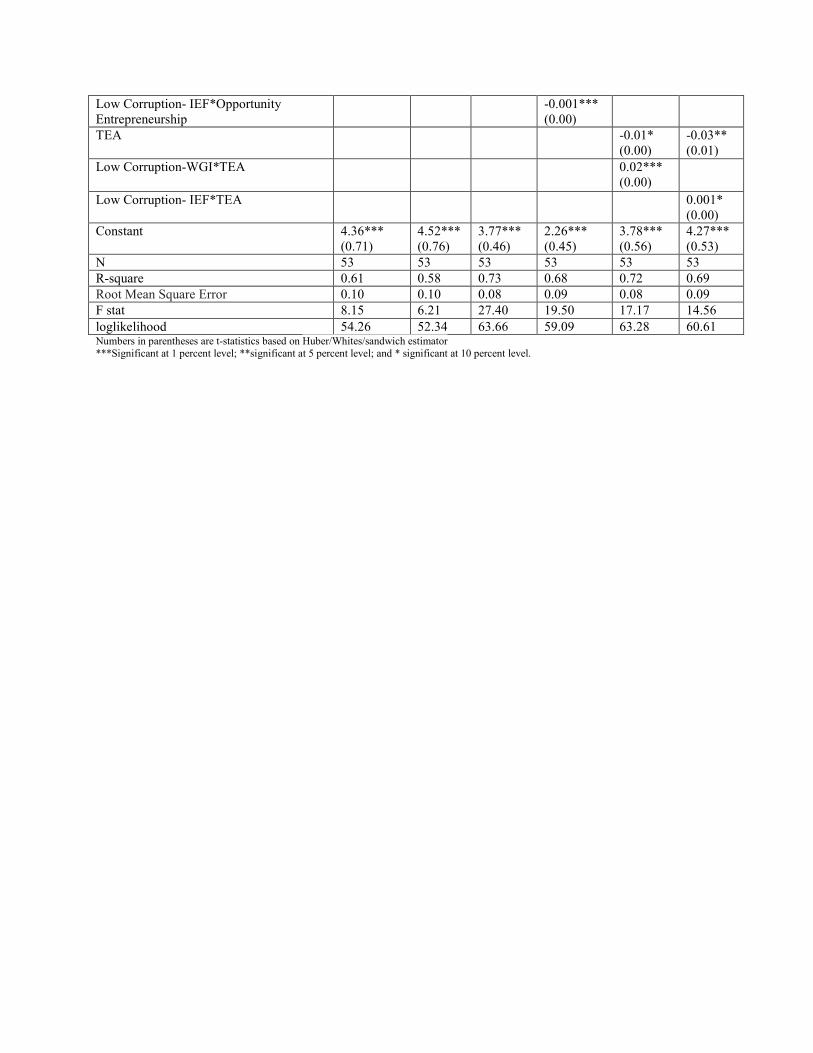
Table 5 presents the results of lagged independent variables. We also transform the Gini
coefficient into an unbounded measure (Reuveney and Li 2003; Pindyck and Rubenfeld 1991)5.
Low level of corruption continue to have negative impact on income inequality all models except
in Models 3 and 4 which include opportunity entrepreneurship variable. Interaction results
support previous results. Necessity entrepreneurship and TEA both reduce income inequality.
Table 5: Entrepreneurship, Corruption and income inequality lagged variable estimates (dependent variable: the Gini coefficient) (1) (2) (3) (4) (5) (6)
Democracy -0.01 (0.00)
-0.01* (0.00)
-0.003 (0.00)
-0.01+ (0.00)
-0.003 (0.00)
-0.01 (0.00)
Foreign Direct Investment (ln) -0.01 (0.02)
-0.02 (0.02)
-0.01 (0.02)
-0.01 (0.02)
-0.02 (0.02)
-0.01 (0.01)
Economic Development(ln) -0.07*** (0.02)
-0.06** (0.02)
-0.05*** (0.01)
-0.05** (0.02)
-0.02+ (0.01)
-0.02+ (0.01)
Human Capital(ln) 0.09+ (0.05)
0.14* (0.06)
0.09+ (0.04)
0.07 (0.06)
0.09+ (0.05)
0.12* (0.05)
Contract Enforcement (Time) -0.01 (0.06)
0.01 (0.06)
0.04 (0.04)
0.08 (0.05)
0.001 (0.06)
-0.01 (0.05)
Natural Resources (ln) 0.005 (0.05)
0.02 (0.06)
0.02 (0.03)
-0.005 (0.05)
-0.01 (0.04)
0.01 (0.05)
Low Corruption-WGI -0.41*** (0.10)
0.60*** (0.12)
-0.27*** (0.06)
Low Corruption- IEF -0.01** (0.00)
0.03** (0.01)
-0.01*** (0.00)
Necessity Entrepreneurship -0.002 (0.00)
-0.01* (0.01)
Low Corruption-WGI*Necessity Entrepreneurship
0.01** (0.00)
Low Corruption-IEF*Necessity Entrepreneurship
0.0002 (0.00)
Opportunity Entrepreneurship 0.0001 (0.00)
0.03*** (0.01)
Low Corruption-WGI*Opportunity Entrepreneurship
-0.01*** (0.00)
5 The formula log [Gini / (100 –Gini)]
Low Corruption- IEF*Opportunity Entrepreneurship
-0.001*** (0.00)
TEA -0.01* (0.00)
-0.03** (0.01)
Low Corruption-WGI*TEA 0.02*** (0.00)
Low Corruption- IEF*TEA 0.001* (0.00)
Constant 4.36*** (0.71)
4.52*** (0.76)
3.77*** (0.46)
2.26*** (0.45)
3.78*** (0.56)
4.27*** (0.53)
N 53 53 53 53 53 53 R-square 0.61 0.58 0.73 0.68 0.72 0.69 Root Mean Square Error 0.10 0.10 0.08 0.09 0.08 0.09 F stat 8.15 6.21 27.40 19.50 17.17 14.56 loglikelihood 54.26 52.34 63.66 59.09 63.28 60.61 Numbers in parentheses are t-statistics based on Huber/Whites/sandwich estimator ***Significant at 1 percent level; **significant at 5 percent level; and * significant at 10 percent level.

Table 6: Results of Regression with income held by highest 20% and unbounded Gini
(1) (2) (3) (4) (5) (6) (7) (8) (9) (10) (11) (12) (13) (14) (15) (16)
DV: Income held by highest 20% DV: unbounded Gini Democracy 0.001
0.00 0.001 (0.00)
0.001 (0.00)
-0.0003 (0.00)
0.001 (0.00)
0.001 (0.00)
0.0003 (0.00)
0.0001 (0.00)
-0.01* (0.00)
-0.01** (0.00)
-0.004 (0.00)
-0.01** (0.00)
-0.003+ (0.00)
-0.01* (0.00)
-0.01+ (0.00)
-0.01* (0.00)
Foreign Direct Investment (ln)
-0.01* (0.00)
-0.01* (0.01)
-0.01* (0.01)
-0.01* (0.01)
-0.01* (0.00)
-0.01+ (0.01)
-0.01* (0.01)
-0.01+ (0.01)
-0.01 (0.01)
-0.02 (0.01)
-0.01 (0.01)
-0.02 (0.01)
-0.01 (0.01)
-0.01 (0.01)
-0.002 (0.01)
-0.002 (0.01)
Economic Development(ln)
-0.02*** (0.00)
-0.02*** (0.00)
-0.01** (0.00)
-0.01*** (0.00)
-0.02*** (0.00)
-0.02*** (0.00)
-0.02*** (0.00)
-0.02*** (0.00)
-0.02+ (0.01)
-0.03** (0.01)
-0.05*** (0.01)
-0.04** (0.01)
-0.04*** (0.01)
-0.03** (0.01)
-0.02+ (0.01)
-0.02* (0.01)
Human Capital(ln) 0.07*** (0.01)
0.07*** (0.01)
0.10*** (0.01)
0.07*** (0.02)
0.07*** (0.02)
0.07*** (0.02)
0.07*** (0.01)
0.16*** (0.04)
0.19*** (0.03)
0.10** (0.04)
0.14*** (0.03)
0.07* (0.03)
0.07+ (0.04)
0.10** (0.04)
0.13*** (0.04)
Time required for contract enforcement
-0.07*** (0.01)
-0.07*** (0.01)
-0.05** (0.02)
-0.05** (0.02)
-0.08*** (0.01)
-0.08*** (0.01)
-0.06*** (0.02)
-0.06*** (0.01)
0.12** (0.04)
0.09* (0.04)
0.03 (0.04)
0.05 (0.04)
0.06* (0.03)
0.08* (0.03)
0.06 (0.04)
0.04 (0.04)
Natural Resources (ln) -0.002 (0.01)
0.000004 (0.01)
0.01 (0.01)
0.02 (0.01)
0.00003 (0.01)
0.0004 (0.01)
-0.003 (0.01)
0.003 (0.01)
0.05 (0.03)
0.08** (0.03)
0.03 (0.03)
0.04 (0.04)
0.01 (0.02)
0.004 (0.03)
0.01 (0.03)
0.03 (0.03)
Low Corruption-WGI -0.01 (0.02)
0.002 (0.04)
0.05 (0.04)
-0.01 (0.02)
-0.09 (0.07)
-0.31*** (0.07)
0.30** (0.10)
-0.18* (0.07)
Low Corruption- IEF -0.001 (0.00)
0.001 (0.00)
0.002 (0.00)
-0.001 (0.00)
-0.01** (0.00)
-0.01** (0.00)
0.02** (0.01)
-0.01*** (0.00)
Necessity Entrepreneurship
0.001 (0.00)
0.005* (0.00)
0.0001 (0.00)
-0.01* (0.00)
Low Corruption-WGI*Necessity Entrepreneurship
-0.0001 (0.00)
0.01*** (0.00)
Low Corruption- IEF*Necessity Entrepreneurship
-0.0001* (0.00)
0.0002 (0.00)
Opportunity Entrepreneurship
-0.001 (0.00)
0.001 (0.00)
0.001 (0.00)
0.02*** (0.00)
Low Corruption-WGI*Opportunity Entrepreneurship
-0.001 (0.00)
-0.01*** (0.00)
Low Corruption- IEF*Opportunity Entrepreneurship
-0.0001 (0.00)
-0.001*** (0.00)
TEA 0.001 (0.00)
0.001 (0.00)
-0.003+ 0.00
-0.02** (0.01)
Low Corruption-WGI*TEA
0.0004 (0.00)
0.01** (0.00)

Low Corruption- IEF*TEA
-0.0000003* (0.00)
0.001** (0.00)
Constant 4.24*** (0.12)
4.27*** (0.13)
4.05*** (0.21)
3.94*** (0.19)
4.38*** (0.14)
4.27*** (0.16)
4.17*** (0.14)
4.20*** (0.14)
-1.27*** (0.36)
-0.75* (0.37)
-0.13 (0.44)
-0.09 (0.46)
-0.42 (0.30)
-1.19*** (0.31)
-0.63 (0.43)
-0.17 (0.39)
N 64 64 64 64 64 64 64 64 64 64 64 64 64 64 64 64 R-square 0.80 0.80 0.81 0.83 0.81 0.81 0.81 0.81 0.48 0.56 0.63 0.59 0.70 0.67 0.64 0.66
Root Mean Square Error
0.03 0.03 0.03 0.03 0.03 0.03 0.03 0.03 0.08 0.07 0.07 0.07 0.06 0.06 0.07 0.07
F stat 58.01 59.99 51.72 53.71 55.26 53.85 42.27 42.24 10.55 9.29 13.60 9.78 27.92 26.48 20.02 17.97
loglikelihood 129.06 129.13 130.17 133.74 130.10 129.80 129.59 129.81 74.97 79.83 85.57 82.71 92.54 89.83 86.29 88.29
Numbers in parentheses are t-statistics based on Huber/Whites/sandwich estimator ***Significant at 1 percent level; **significant at 5 percent level; and * significant at 10 percent level.

Conclusion and Discussion
In this study we examined impact of entrepreneurship on reducing income inequality in
highly corrupt environment and developing countries of Bangladesh, China, India, Indonesia,
Malaysia, Pakistan, Philippines, and Thailand in South and East Asia. Sources of income
inequality can stem from various sources (Lynch et al. 2000), but reducing income inequality to
improve citizens’ living standard and generate economic development are important goals for
policy makers. In this study, we explored role of entrepreneurship in reducing income inequality.
Our results find that both necessity and TEA reduces income inequality and opportunity
entrepreneurship increases income inequality. Access to resources and motivation may help to
explain this contradiction. Motivation behind taking on entrepreneurial activity can range from
unemployment to searching for improving existing process, create new product or enter new
market (Verheul et al. 2002). Opportunity entrepreneurs are likely to be more motivated,
educated and have better networks than necessity entrepreneurs and TEA. Regardless of the
motivation, entrepreneurial activity helps to improve standard which helps to produce productive
economic activity.
We also explored role of corruption. Our result found that the benefit of entrepreneurial
activity is significant in low corrupt environment but the impact changes across different types of
entrepreneurial activity. Interestingly we found a non-linear relationship between the impacts of
opportunity entrepreneurship on inequality at a various levels of corruption. We also found that
even in developing countries with high level of corruption – high levels of TEA, necessity and
opportunity entrepreneurship may decrease inequality. We also found opportunity and TEA
entrepreneurship having a stronger effect in fighting inequality at a high level of corruption than
necessity entrepreneurs. This finding makes an important contribution to entrepreneurship and

institutions literature by advocating the role of an entrepreneur in reducing general inequality in a
moderate and highly corrupted environments.
To engage in entrepreneurial activity entrepreneurs need appropriate institutions as well as
resources. Country level institutions influence entrepreneurial activity. In a strong institutional
environment, entrepreneurs face less uncertainty and receive greater reward. Government
transfers and social services can constitute a major source of income in poor households. These
services also serve as a safety net for entrepreneurs. Therefore if an individual with resources to
pay bribe and well-established networks can transfer social services to high income households
who may not need these services as much as poor households do contribute to the increased
income inequality in a society.
Entrepreneurs need various resources such as financial capital, networks, and physical
capital. Weak institutional environment put pressure on an important resource that entrepreneurs
have the least, financial capital. Financial market in developing countries is not well developed.
So they have limited access to credit market. Limitation of credit is exacerbated by limitations of
personal wealth or concentration of wealth in the hands of few families in a country. Availability
of wealth and financial resources reduces an important barrier, financial constraint, for
entrepreneurs (Paulson and Townsend 2004). Personal wealth can be a significant source for
entrepreneurs (Hurst and Lusardi 2004). For entrepreneurs in developing countries don’t always
have access to large inheritance and gifts but their engagement in entrepreneurial activity can
help to build wealth and thereby reduce income inequality. An individual can recognize an
opportunity, act on it that can generate positive entrepreneurial activity that leads to financial
wealth (Cassar 2007; Evans and Jovanovic 1989).

References
Aidis, R., S., Estrin, and T. M. Mickiewicz. (2012). “Size matters: entrepreneurial entry and government”. Small Business Economics, 39(1):119-139.
Ács, Z. J., and D. B. Audretsch. (2005). “Entrepreneurship and innovation (No. 2105)”. Papers on entrepreneurship, growth and public policy.
Ardagna, S., and Lusardi, A. (2008). “Explaining international differences in entrepreneurship: The role of individual characteristics and regulatory constraints (No. w14012)”. National Bureau of Economic Research.
Baumol, W. J. (2002). “The free-market innovation machine: Analyzing the growth miracle of capitalism”. Princeton university press.
Baumol, W. J. (1990). “Entrepreneurship: Productive, Unproductive, and Destructive”. The Journal of Political Economy, 98(5 Part 1): 893-921.
Beck, N., and J. N. Katz. (1995a). “Nuisance vs. substance: Specifying and estimating time-series cross-section models”. Political Analysis 6(3): 1-34.
Beck, N., and Katz, J. N. (1995b). “What to do (and not to do) with time-series cross-section data”. American Political Science Review 89: 634-647.
Blanchflower, D.G. and A.J. Oswald. (1998). “What makes an entrepreneur?” Journal of Labor Economics 16(1): 26–60.
Bowen, H. P., and D. De Clercq, (2008). “Institutional context and the allocation of entrepreneurial effort”. Journal of International Business Studies, 39(4): 747-767.
Busenitz, L. W., C., Gomez, and J. W. Spencer, (2000). “Country institutional profiles: Unlocking entrepreneurial phenomena”. Academy of Management journal, 43(5): 994-1003.
Cagetti, M., and M. DeNardi. (2004). “Taxation, entrepreneurship, and wealth”. Federal Reserve Bank of Minneapolis Staff Report no. 340.
Cassar, G. (2007). Money, money, money? “A longitudinal investigation of entrepreneur career reasons, growth preferences and achieved growth”. Entrepreneurship and Regional Development, 19(1):89-107.
Castaneda, A., J., Díaz-Giménez, J.V. Ríos-Rull. (2003). “Accounting for the U.S. earnings and wealth inequality”. Journal of Political Economy 111(4): 818–857.
Coase, R. H. (1960). “Problem of social cost”. The Journal of Law and Economics. 3(1). Davidsson, P., and B. Honig, (2003). “The role of social and human capital among nascent
entrepreneurs”. Journal of business venturing, 18(3):301-331. Deininger, K., and Squire, L. (1996). “A new data set measuring income inequality”. World
Bank Economic Review, 10: 565-591. Dreher, A. and M. Grassebner. (2007). “Greasing the Wheels of Entrepreneurship? The Impact
of Regulations and Corruption on Firm Entry”. KOF (Swiss Economic Institute) Working Paper No. 166.
Dobson, S., and C. Ramlogan-Dobson. (2012). “Why is corruption less harmful to income inequality in Latin America?”. World Development, 40(8): 1534-1545.
Earle, J. S., and Z., Sakova. (1999). “Self-Employment in Transitional Economies: Entrepreneurship or Disguised Unemployment?”. LICOS.
Evans, D. S., and B. Jovanovic. (1989). “An estimated model of entrepreneurial choice under liquidity constraints”. The Journal of Political Economy, 808-827.
Fershtman, C., Murphy, K. M., and Weiss, Y. (1999). “Social Status, Education, and Growth”. The Journal of Political Economy, 104(1):108-132.
Glaeser E. and C. Goldin. (2006). “Corruption and Reform: An Introduction. In: Corruption and

Reform”. University of Chicago Press. 3-22. Gupta, S., H., Davoodi, and R. Alonso-Terme. (2002). “Does corruption affect income inequality
and poverty?”. Economics of Governance, 3(1):23-45. Holtz-Eakin, D., D., Joulfaian, H.S. Rosen. (1994). “Sticking it out: entrepreneurial survival and
liquidity constraints”. Journal of Political Economy 102(1):53–75. Hurst, E., and A. Lusardi, (2004). “Liquidity constraints, household wealth, and
entrepreneurship”. Journal of political Economy, 112(2): 319-347. Klapper, L., L.Laeven, and R. Raghuram. (2006). “Entry Regulation as a Barrier to
Entrepreneurship”. Journal of Financial Economics, 82 (3): 591-629. Knight, J. 2013. “Inequality in China: an overview”. The World Bank Research Observer,
lkt006. Kuznets, Simon. 1955. “Economic Growth and Income Inequality.” American Economic Review,
45:1–28. Lee, C. 2005. “Income inequality, democracy, and public sector size”. American Sociological
Review, 70: 158-181. Li, S., L. Chuliang, and T. Sicular. 2013. “Overview: Income Inequality and Poverty in China,
2002– 2007.” In L. Shi, H. Sato, and T. Sicular, eds., Rising Inequality in China: Challenge to the Harmonious Society, 24–59. Cambridge, UK, and New York: Cambridge University Press.
Luhmann, N., 1988. “Familiarity, confidence, and trust: Problems and alternatives”. In: Gametta, D. (Ed.), Trust: Making and Breaking Cooperative Relations. Basil Blackwell, Oxford.
McMullen, J.S., Bagby, D.R., and Palich, L.E. (2008). “Economic freedom and the motivation to engage in entrepreneurial action”. Entrepreneurship Theory and Practice, 32:875-895.
Méon, P. G., and K. Sekkat. (2005). “Does corruption grease or sand the wheels of growth?”. Public choice, 122(1-2): 69-97.
Montinola, G. R., and R. W. Jackman. (2002). “Sources of corruption: a cross-country study”. British Journal of Political Science, 32(01): 147-170.
Nafziger, W. (1997). “The economics of developing countries”. Englewood Cliffs, NJ: Prentice Hall.
Nielsen, François and Arthur S. Alderson. 1995. “Income Inequality, Development, and Dualism: Results from an Unbalanced Cross-National Panel”. American Sociological Review 60:674–701.
North, D. C. (1994). "Institutions matter." Economic History 9411004. Ostrom, E. (2005). “Understanding Institutional Diversity”. Princeton, NJ: Princeton
University Press. Paulson, A., and R.M. (2004). “Townsend, Entrepreneurship and financial constraints in
Thailand”. Journal of Corporate Finance, 10(2): 229–326. Piketty, T. (2014). “Capital in the Twenty-first Century”. Harvard University Press. Pindyck, R., and Rubenfeld, D. (1991). “Econometric models and economic forecasts”. New
York: McGraw-Hill. Reuveny, R., and Q. Li. (2003). “Economic Openness, Democracy, and Income Inequality: An
Empirical Analysis”. Comparative Political Studies, 36(5): 575-601. Rose-Ackerman, S. (1978). “Corruption: A study in political economy (pp. 49-71)”. New York:
Academic Press. Rose-Ackerman, S. (1999). “Corruption and government: Causes, consequences, and reform”.
Cambridge University Press.

Schumpeter, J. A. (1934). “The theory of economic development: An inquiry into profits, capital, credit, interest, and the business cycle (Vol. 55)”. Transaction Publishers.
Simpson, Miles. 1990. “Political Rights and Income Inequality: A Cross-National Test.” American Sociological Review 55:682–93.
Tanzi, V. (1995). “Corruption: arm’s-length relationships and markets”. The Economics of Organized Crime, 161-82.
Treisman, D. (2000). “The causes of corruption: a cross-national study”. Journal of public economics, 76(3), 399-457.
Wennekers, S., A., Van Wennekers, R., Thurik, and P., Reynolds. (2005). “Nascent entrepreneurship and the level of economic development”. Small Business Economics, 24(3): 293-309.
Wennekers, S., and R. Thurik. (1999). “Linking entrepreneurship and economic growth”. Small Business Economics, 13(1): 27-56.