Entrepreneurship and Human Capital: Empirical … RIETI Discussion Paper Series 13-E-049...
26
DP RIETI Discussion Paper Series 13-E-049 Entrepreneurship and Human Capital: Empirical study using a survey of entrepreneurs in Japan BABA Ryota Booz & Company (Japan) Inc. MOTOHASHI Kazuyuki RIETI The Research Institute of Economy, Trade and Industry http://www.rieti.go.jp/en/
Transcript of Entrepreneurship and Human Capital: Empirical … RIETI Discussion Paper Series 13-E-049...
DPRIETI Discussion Paper Series 13-E-049
Entrepreneurship and Human Capital:Empirical study using a survey of entrepreneurs in Japan
BABA RyotaBooz & Company (Japan) Inc.
MOTOHASHI KazuyukiRIETI
The Research Institute of Economy, Trade and Industryhttp://www.rieti.go.jp/en/

1
RIETI Discussion Paper 13-E-049 May 2013
Entrepreneurship and Human Capital: Empirical study using a survey of
entrepreneurs in Japan1
BABA Ryota (Booz & Company (Japan) Inc.) MOTOHASHI Kazuyuki (RIETI and The University of Tokyo)
Abstract
Entrepreneurship activities are low in Japan, and it is often discussed that possible reasons are the lack of venture capital and a rigid labor market. However, it is rare to find a study that analyzes the human capital aspect of entrepreneurs based on a large scale sample survey. In this study, the characteristics of the human capital of entrepreneurs, such as education and job experience, are analyzed based on a survey of entrepreneurs conducted by the Research Institute of Economy, Trade and Industry (RIETI) in 2012. The entire process of entrepreneurship is divided into three phases—(1) planning, (2) execution, and (3) achieving success in business—and the determinants of each step, not only the education and job background, but also personal relationships with the entrepreneur and his/her personality, are investigated. It is found that broad experiences while attending universities such as extra-curriculum activities are an important factor at the planning and execution stage. In contrast, broader job experiences but within a limited number of companies can explain the probability of entrepreneurship success well. Therefore, promotion of entrepreneurship activity in Japan including forming a spin-off company requires both a variety of extra-curriculum activities experienced at universities and facilitating employees to develop broad professional experiences. RIETI Discussion Papers Series aims at widely disseminating research results in the form of professional
papers, thereby stimulating lively discussion. The views expressed in the papers are solely those of the
author(s), and do not represent those of the Research Institute of Economy, Trade and Industry.
1 This paper is based on the joint research project of RIETI and STAJE (Stanford Project on Japanese Entrepreneurship) on comparative analysis of entrepreneurship activities between Japan and the United States. Authors acknowledge financial support from RIETI for the survey in Japan, as well as useful comments at RIETI discussion paper workshop. Authors would like to thank also for Prof. Eeseley and Mr. Eberhart at Stanford University, Graduate School of Engineering, for their intellectual inputs. They kindly allowed us to use their survey instrument for Stanford and MIT alumni surveys, as a basis of our survey instrument in Japan.

2
1. Introduction According to the Global Entrepreneurship Monitor (GEM), which conducts international comparative studies on entrepreneurial activities, Japan’s entrepreneurial activities ratio in 2010 was 3.3%, the second lowest among 59 countries (Kelly et. al., 2011). Entrepreneurs seeking new business opportunities and starting up new companies are said to bring about dynamism in economic activities and significantly influence their nation’s economic growth and revitalization (Isobe and Takahashi, 2007). The importance of entrepreneurial activities is thus recognized as a source of innovation. In Japan, too, policy measures have been taken including the establishment of a market for emerging companies, the easing of the listing standard, and the reduction of the minimum capitalization requirements. However, GEM’s research indicates that these measures have produced limited effects.
Furthermore, while GEM’s research covers overall entrepreneurial activities concerning starting businesses and/or conducting concrete activities, extensive research focusing on high-tech ventures points out the problems of Japan. Motohashi (2012), in a comparative analysis of Japanese and U.S. bio-ventures, indicates that, while there is no major gap in the number of venture companies, the number of listed companies in the two countries differ significantly due to Japan falling behind in fostering high-risk businesses. In the background of such contrast is a major difference in the capital environment. While total venture capital investment in Japan is estimated to have exceeded 100 billion yen as of 2011, that in the United States is said to be approximately 30 times greater. (Techno Search Research Institute 2009)
This paper focuses on human capital and analyzes the effects of education and professional experiences on entrepreneurial activities based on the results of RIETI’s survey on entrepreneurs. To conduct an analysis focused on high-risk ventures such as high-tech ventures, this research screened, by the universities from which they graduated, the respondents who are founders of companies and have received investment from venture capital. While these companies are expected to exert major economic effects after their start, significant risks are involved. This study aims to provide a perspective on Japan falling behind in its efforts to foster high-tech ventures, with a focus on human capital.
Among the analyses conducted on the relations between human capital and entrepreneurial activities is Lazear’s theory on entrepreneurship (Lazear, 2004; and

3
Lazear, 2005). This theory is based on an argument that, while employees of large corporations are required to have expertise in each of their respective divisions such as research and development, production, and marketing, founders of businesses must be generalists who concurrently possess all of these capabilities, and individuals who have diverse academic and professional experiences are more likely to be successful entrepreneurs. On the other hand, another argument states that founders are not “jacks of all trades” who possess every capability but instead are “hobos” who go through multiple jobs (Astebro and Thompson, 2011). Especially at technology-based venture companies, the business managers’ expertise is considered as a requirement for differentiating themselves from other companies with technological superiority. In other words, human capital for successful entrepreneurial activities needs both “diversity” and “depth.” The results of a quantitative analysis in relation to their balance are described in this article.
In Chapter 2, this paper develops a model for an analysis of human capital and entrepreneurial activities and a hypothesis based upon it. Then it introduces the design, contents, and implementation of the survey, and shows some descriptive statistics. Chapter 4 indicates the results of the analysis on human capital and entrepreneurial activities. Chapter 5 describes the implications obtained from the results and analysis.
2. Development of the model and hypothesis
Lazear’s theory of entrepreneurship assumes two skill sets of 𝑋1and 𝑋2 and that
wages of specialists working for corporations (𝑊𝑆) and those of entrepreneurs (𝑊𝐸) are respectively determined as follows (Lazear, 2004):
𝑊𝑆=max {𝑋1,𝑋2}
𝑊𝐸=λmin {𝑋1,𝑋2}
These formulas indicate that specialists’ wages are determined based on either 𝑋1 or
𝑋2, at whichever they are better, while entrepreneurs’ wages are the product of the smaller value and λ (>1) as they must have both skills in a balanced fashion. The value of λ is determined based on the level of the societal demand for entrepreneurs.
In this case, as Figure 1 shows, in the area between 𝑋2=λ*𝑋1 and 𝑋1=λ*𝑋2, for

4
example, a person with skill set A would choose to be an entrepreneur as his/her wage pattern is WE>WS while a person outside of the area with skill set B would choose to work for a company as his/her wage pattern is WE<WS. In other words, generalists who possess balanced multiple skill sets would choose to become entrepreneurs while specialists would choose to work for companies. Lazear (2005), based on research conducted on graduates of Stanford University with master of business administration (MBA) degrees, indicates that people who studied diverse subjects and/or have diverse job experiences tend to choose to become entrepreneurs. Similar results are demonstrated by Wagner (2006) and Silva (2007). When the demand for entrepreneurs (λ) grows, the area between 𝑋2=λ*𝑋1 and 𝑋1=λ*𝑋2 expands, with the ratio of
entrepreneurs increasing. In the case of the opposite, those who work for companies increase.
Figure 1: Skill sets and decision to become entrepreneurs
While Lazear’s theory assumes that the decision to become entrepreneurs is determined by financial incentive, other researchers argue that it is largely influenced by non-financial motivation such as freedom and enhanced passion (Hamilton, 2000). Also,

5
research results indicate that the habit to go through jobs (“hobos”) is strongly related with entrepreneurial activities (Hyytinen and Ilmakunnas, 2007).
In another study, these non-financial incentives are indicated with “V.” Given that 𝑋1
and 𝑋2 are completely interchangeable and that WE is the average of the two,
If V > (𝑋1A-𝑋2A)/2
then “A” would choose to become entrepreneurs (Astebro and Thompson, 2011). In this case, however, it should be noted that the non-financial incentives influenced the selection and that wages would decrease:
𝑋1A > (𝑋1A+𝑋2A)/2
As in the case of Lazear’s theory, this model indicates that generalists are more likely to choose to become entrepreneurs.
While Lazear’s model and the model including the non-financial incentives (hereinafter referred to as the “Hobos model”) both demonstrate that generalists with various skills tend to be entrepreneurs, they provide different implications in terms of the economic effects of entrepreneurship. Lazear’s model assumes that individuals’ different skill sets are efficiently converted to economic values. Therefore, individuals’ decisions to become (or not become) entrepreneurs are rational choices from the perspective of social welfare, too. On the other hand, the Hobos model indicates that non-financial incentives could lower the wages of entrepreneurs below those of company workers. Furthermore, based on the above-mentioned model on completely interchangeable variables, choosing to become entrepreneurs will always decrease wages. In this case, individuals’ skills are not efficiently converted to economic values, and the economy as a whole would be inefficient in terms of the utilization of human capital.
While Lazear’s model and the Hobos model focus on entrepreneurs in terms of job decision, a different perspective is needed to analyze human capital that leads venture companies into becoming successful businesses. Especially, for the success of high-tech ventures with high risk, the supply of risk money by venture capital is needed in addition to human capital. As human capital includes the capability to obtain investment from venture capital, these two elements are closely interrelated (Colombo and Grilli, 2010). From the venture capital’s perspective, venture business managers need

6
management capability (business management capability) and knowledge on particular industries and/or technologies (Kaplan and Stromberg, 2004). Management capability is defined as an expertise, not as a generalist orientation. Thus, specialist-type human capital is considered to be important for leading venture companies to become successful businesses.
Based on the above arguments, the following hypotheses can be developed:
Hypothesis 1: In planning and operating a new business, generalist human capital with diverse academic and professional backgrounds is important.
Hypothesis 2: To lead venture companies with high risks into becoming successful businesses, possessing management capability and in-depth knowledge on specific industries or technologies, especially through professional experiences, is more important than just the educational background.
Hypothesis 3: In terms of work history, the number of companies and the number of job categories experienced exert different influences on entrepreneurship. Individuals who have worked at many companies are likely to be hobos who often change jobs while the number of job categories indicates the diversity of professional experiences. While both elements contribute to increasing the probability to choose to become entrepreneurs, the probability of venture companies’ success decreases with the former and increases with the latter.
3. Overview of the survey
3-1. Contents of the survey
To examine the hypotheses described in the previous section, the survey was designed to clarify elements that relate to each stage of entrepreneurial activity, as shown by Figure 2. While many of the past studies analyzed the relations between “potential entrepreneurs” and “start-up of new business” and between “potential entrepreneurs” and “success of new business” or the relations indicated by the dashed lines in Figure 2, this research conducted a detailed analysis by phase. For this purpose, the survey sheet was designed to reveal factors in each phase described below for individuals with and without experience in starting up new businesses.

7
Phase 2: Phased approach to entrepreneurial activities
The survey sheet first provided detailed questions on education and work history in relation to human capital, the main topic of this research. Regarding experience while in school, questions included the respondent’s highest level of education, courses he/she took (whether or not such courses were outside of his/her specialization), extracurricular activities including club activities and business plan contests, and experience in overseas study. Regarding work experience, main questions included industry, the number of job categories experienced, and whether or not he/she has changed jobs.
Also, the following three factors were identified as closely related to entrepreneurial activities: (1) demographic attributes, (2) personality-related attributes, and (3) surrounding environments. The research includes these variables as survey items. For demographic attributes, gender is important, and men are more likely to become entrepreneurs than women. Women entrepreneurs tend to be concentrated in certain sectors such as personal services and retail (Bates, 2002). Also, their motivation to become entrepreneurs tends to differ from men’s. While men often start new businesses in pursuit of wealth, women tend to seek flexibility and freedom associated with entrepreneurship, such as work and family balance (DeMartino et. al., 2003). Regarding age, the aging out phenomenon—in which a person, who has not started a new business before reaching a certain age, will not do so after reaching this age—is indicated. Nonetheless, a survey on the Massachusetts Institute of Technology (MIT) graduates indicates that the aging out phenomenon is diminishing, with the ages of starting new businesses becoming diversified (Hsu et. al., 2007).
With regard to personality-related attributes, there are various studies on the relations

8
between risk-adverse or autonomy-minded stance and entrepreneurial activities. Strongly autonomy-minded persons with a moderate desire for achievement and/or power tend to become entrepreneurs (Roberts, 1991). As to the surrounding environment, if there is a parent or someone close to him/her, he/she is likely to become an entrepreneur, too (Roberts, 1991). The personality and surrounding environment attributes are considered to be interrelated. Furthermore, a person’s judgment on whether or not to start a new business is influenced by opportunity costs (Amit et. al., 2005). Besides financial cost such as the current wage, psychological cost is also important. When there is an entrepreneur close to him/her, the psychological cost is expected to decrease.
The survey screened, by universities attended, the founders of high-risk venture companies that have received investment from venture capital and collected data on a total of 7,023 respondents through the internet—of which, 1,501 experienced starting up new businesses and 5,522 did not. The detail description of the survey design and samples is provided in Appendix.
3-2. Results of the survey
First, the outline of the contents of the entrepreneurial activities conducted by the 1,501 individuals with experience in starting new businesses is shown in the following. In this research, entrepreneurial activities are defined as those shown in Figure 3. Those who have experienced at least one of these activities are referred to as individuals with experience in starting businesses. Over 80% of such individuals have started businesses as either founders of corporations or sole proprietors while a high percentage of them are founding members of venture companies or non-founding directors of or advisors to new businesses.
Figure 3: Types of entrepreneurial activities (multiple choice)
Count %
644 42.9%602 40.1%101 6.7%119 7.9%109 7.3%191 12.7%362 24.1%21 1.4%
1501
Board member or advisor to start-up firmOtherTotal
Establishment of incorporated businessEstablishment of private businessOpen franchised establishmentAcqusition of new firmEstablishment of non-private organization (NPO)Initial employees at start-up firm

9
With regard to industries, there is a high percentage of entrepreneurs in service-related (26.1%), IT and communications (17.1%), construction and real estate (10.1%), and financial industries (7.1%). In response to a question regarding innovation strategy, 52.2% of the entrepreneurs stated that intellectual properties were important in developing their companies, and 31.6% indicated they had created brand new products and/or services. Thus, the objective to select high-risk, innovative entrepreneurial activities was fulfilled to a certain extent. (For details, refer to Baba (2013))
In the following, some descriptive statistics on the relation between the phased approach to entrepreneurial activities and the human capital seen in Figure 2 are shown. Figure 4 indicates the number of samples for each phase. This internet-based survey collected data from a total of 7,023 individuals, of whom 1,501 and 5,522 are individuals with experience in starting businesses and those without, respectively. Out of those with no experience in starting businesses, 700 people indicated that they had tried to do so in the past. Therefore, in the Phase 1 planning stage, the number of those who had plans for new businesses is 2,201 in total, adding these 700 to the 1,501 (individuals with experience in starting businesses)—of these, the 1,501 individuals have implemented their plan (applicable to Phase 2).
With regard to the degree of success of new businesses in Phase 3, 10-grade evaluations were provided by the individuals with experience in starting businesses. Although these data are based on the respondents’ subjective evaluations, such responses have been demonstrated to have statistically significant correlation with (maximum) sales, the number of employees, presence or absence of profit, and the period of time until profit is generated (negative correlation). It is appropriate to use these data as criteria to measure comprehensively the degree of entrepreneurs’ success (Baba, 2013).

10
Figure 4: The numbers of samples by entrepreneurship phase
With regard to the level of education, as Figure 5 shows, in Phases 1 (presence or absence of plans) and 2 (implementation of the plan), the percentages of bachelor and doctorate degree holders are higher while it is lower for master degree holders. The level of success (Phase 3) is the highest among doctorate degree holders and followed by master and bachelor degree holders in that order, indicating a positive correlation between the level of education and the success of ventures. Nevertheless, standard deviations of each category are large, and the differences between the means are not statistically significant.
Figure 5: Entrepreneurial activities by academic degree
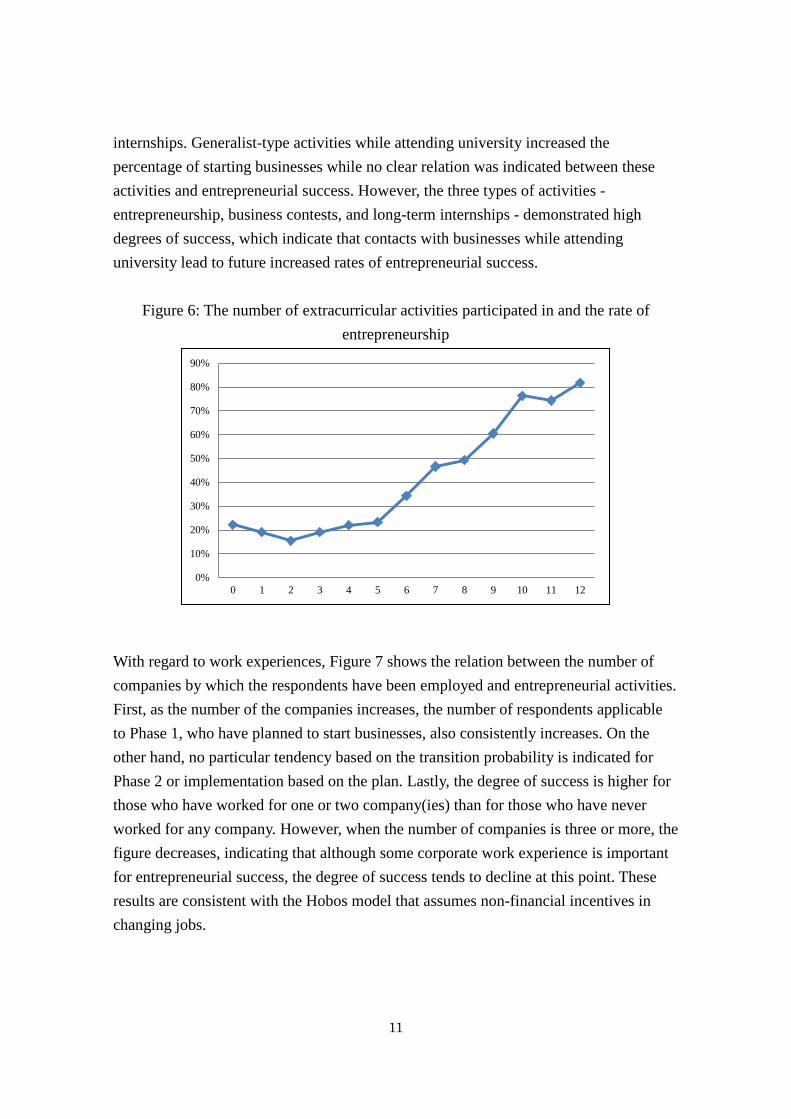
Figure 6 shows the relation between extracurricular activities and the ratios of starting businesses. The questionnaire asked about participation or non-participation in 12 types of extracurricular activities including club activities, business plan contests, and
Total[A]
count count B/A count C/A mean s.d.Bachelor 5,694 1,840 32.3% 1,268 22.3% 5.970 2.304Master 993 246 24.8% 155 15.6% 6.039 2.379Doctor 336 115 34.2% 78 23.2% 6.577 2.601Total 7,023 2,201 31.3% 1,501 21.4% 6.009 2.330
Success score(1-10)
Planned[B]
Started business[C]
11
internships. Generalist-type activities while attending university increased the percentage of starting businesses while no clear relation was indicated between these activities and entrepreneurial success. However, the three types of activities - entrepreneurship, business contests, and long-term internships - demonstrated high degrees of success, which indicate that contacts with businesses while attending university lead to future increased rates of entrepreneurial success.
Figure 6: The number of extracurricular activities participated in and the rate of
entrepreneurship
With regard to work experiences, Figure 7 shows the relation between the number of companies by which the respondents have been employed and entrepreneurial activities. First, as the number of the companies increases, the number of respondents applicable to Phase 1, who have planned to start businesses, also consistently increases. On the other hand, no particular tendency based on the transition probability is indicated for Phase 2 or implementation based on the plan. Lastly, the degree of success is higher for those who have worked for one or two company(ies) than for those who have never worked for any company. However, when the number of companies is three or more, the figure decreases, indicating that although some corporate work experience is important for entrepreneurial success, the degree of success tends to decline at this point. These results are consistent with the Hobos model that assumes non-financial incentives in changing jobs.
0%
10%
20%
30%
40%
50%
60%
70%
80%
90%
0 1 2 3 4 5 6 7 8 9 10 11 12

12
Figure 7: The number of companies by which the respondents were employed and entrepreneurial activities
4. Empirical analysis on determinative factors for entrepreneurial activities
In this section, the relationship of entrepreneurship activity and the four types of determinants, discussed in the section 2, i.e., human capital including entrepreneurs’ level of education and work experience, demographic attributes, personality-related attributes, and surrounding environments, is investigated.
First, the following variables are used for human capital:
(Education) master: Dummy for master degree holder doctor: Dummy for doctoral degree holder science: Dummy for science majors activity: The number of activities participated while attending university among 12
types of activities; total value based on the following scale—0: None; 1: Some; and 2: Extensively
univ_got: what the respondent gained from the university—multiple choice from nine alternatives—the total number of positive responses
course: Diversity of courses taken—0: Focused on specialization; 1: Some courses from other departments/faculties taken; 2: Diverse courses taken
grade: Grade—0: Low; 1: Middle; 2: High (Work) njob: The number of companies experienced njob_type: The average number of job categories per company
Total[A]
count count B/A count C/A mean s.d.0 1,409 343 24.3% 239 17.0% 5.795 2.4931 2,988 812 27.2% 552 18.5% 6.250 2.1552 1,285 488 38.0% 330 25.7% 6.212 2.273
3 + 1,341 558 41.6% 380 28.3% 5.616 2.459total 7,023 2,201 31.3% 1,501 21.4% 6.009 2.330
Planned[B]
Success score(1-10)
Started business[C]

13
Also, regarding the question asking whether the respondent considers “oneself as a generalist or a specialist,” a dummy variable “generalist” was provided for the responses, “generalist” or “relatively generalist.” Furthermore, the following variables relating to experience in residing overseas and in starting businesses were included as explanatory variables. abroad: Experience in residing overseas—0: None; 1: Less than two years; 2:
Between two and five years; 3: Five years or longer entre_num: The number of companies founded entre_age: The age at starting the business (the most successful new business) For demographic attributes, gender (male: Dummy) and age (age) were included. Moreover, for personality-related attributes, the following three data items were used out the nine data items for the survey (Likert scale data evaluating the degree of each question’s applicability in five degrees) considering the correlations between the data. optimist: Average of scores in the three questions—“Open to new experience,”
“Usually expect the best results under uncertain circumstances,” and “Generally believe that good things rather than bad things happen to oneself.”
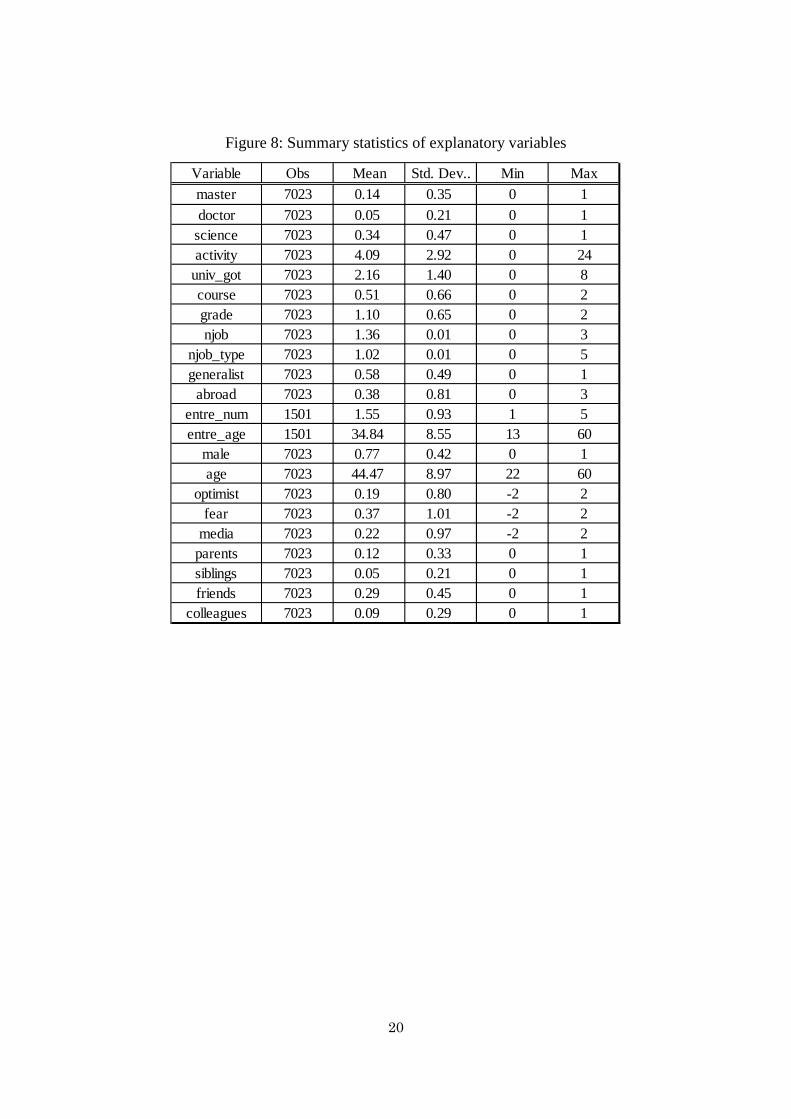
fear: “Fear of a failure.” media: “Often exposed to business success stories on media” Lastly, the following explanatory variables relating to surrounding environments were used: parents: parent(s) is(are) entrepreneur(s) siblings: brother(s)/sister(s) is(are) entrepreneur(s) friends: friend(s) is(are) entrepreneur(s) colleagues: colleague(s) is(are) entrepreneur(s) Basic statistics of these variables are shown in Figure 8:
(Figure 8)
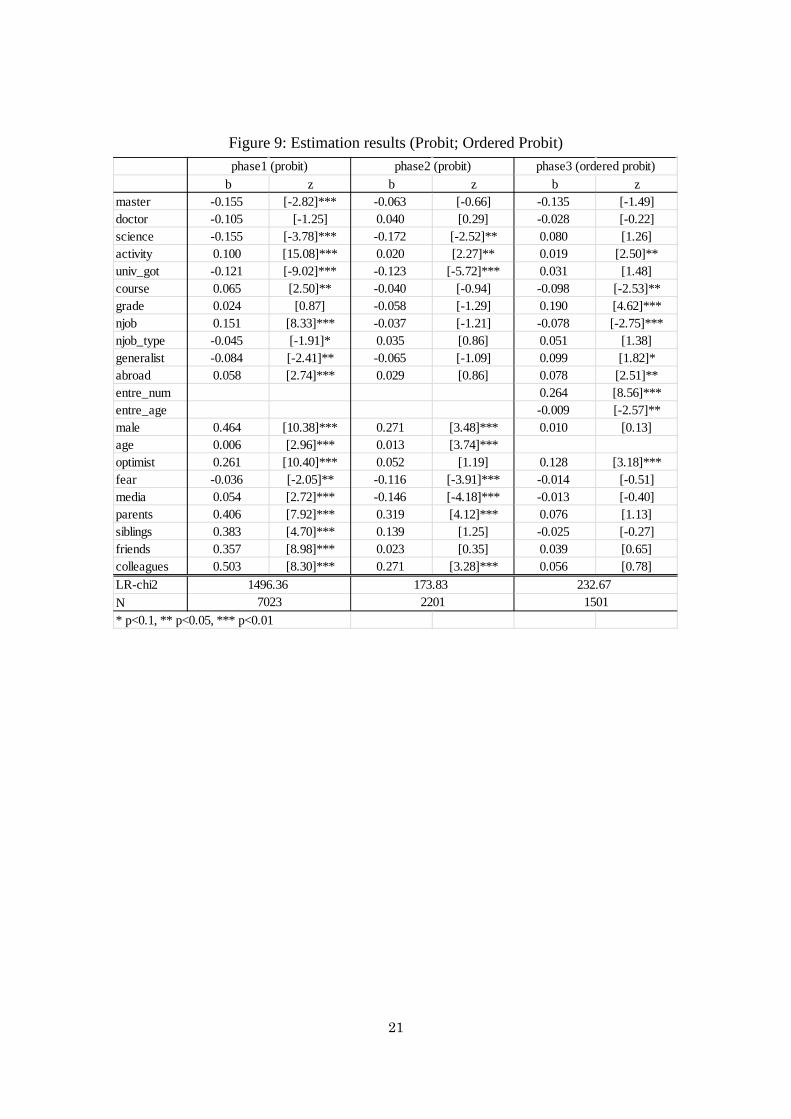
With the dummy variables relating to the transition in each of Phase 1 to Phase 3 as explained variables, a regression analysis was conducted based on the above-mentioned explanatory variables. For Phases 1 and 2, the Probit Model was used. For Phase 3, the Ordered Probit Model was used with the 10 degrees of success as explained variables. Figure 9 shows the results.

14
(Figure 9)
Among academic credentials, with regard to “master” and “doctor,” “master” had a negative correlation with plans to start businesses while no other statistically significant results were obtained. “science” (dummy for science majors) was demonstrated to have negative correlation in the planning and implementation phases while art students indicated a higher probability to start businesses. “course” had a positive correlation in the planning phase but a negative correlation with the degree of entrepreneurial success. Lastly, “activity” (activities while at university) has positive correlation in all phases. The overall results indicate that, while academic experience within universities is not suitable for entrepreneurship, extracurricular activities are positive. With regard to work experience, “njob” (the number of companies experienced) had a positive correlation with the planning of starting businesses while it had a negative correlation with the success rate. On the other hand, “njob_type” (the average number of job types per company) indicated a negative correlation with entrepreneurial planning.
Among other explanatory variables, “abroad” (experience in residing overseas) had a positive correlation with planning as well as entrepreneurial success rate, indicating that overseas experiences in different environments contribute to broadening one’s perspectives and helping gain the capabilities necessary following the start-up of businesses. Furthermore, in terms of demographic attributes, the probability of men to start businesses is higher, which is consistent with past literature. On the other hand, however, no correlation was found between gender and success rate. Age had a positive correlation with planning and implementation although “entre_age” (the age at starting the business) had a negative correlation with the degree of success, indicating that starting businesses at a certain age is important for the success of venture businesses.
With regard to personality-related attributes, “optimist” had a positive correlation with planning and the entrepreneurial success rate, indicating that optimistic thinking and positive images increase not only the rate of starting businesses but also the rate of success. On the contrary, “fear” (fear of a failure) had negative correlation with planning and the entrepreneurial implementation. “media” had a positive correlation with entrepreneurial planning but a negative correlation with the rate of implementation. The surrounding environments generally had positive correlation with the planning and the implementation phases but no correlation with the degree of success.

15
The above results are based on analysis regarding each phase as independent from each other, but it is also important to estimate correlations excluding the selection bias in the previous phases. This research, using Heckman’s two-step estimator, conducted estimations in two stages—first, based on the implementation model after the selection in the planning phase, and second, the success model after the selection up to the implementation phase. Variables relating to personality-related attributes and the surrounding environments that significantly affect the planning and the implementation phases are used for the estimation of the selection model for the first stage while only variables relating to education and work experience were used for the second stage in examining hypotheses. Figure 10 shows the results.
(Figure 10)
The results after the selection indicated that “activity” and “njob” had statistically significant negative correlations with the implementation phase. These variables, indicators of generalist orientation in education and work experience, are not necessarily linked to entrepreneurial activities. Does this mean that the relation between entrepreneurship and generalist-orientation in Hypothesis 1 was not supported? Attention should be paid to the point that these results indicate whether or not potential entrepreneurs have moved on from the planning of new businesses to actually starting them. On the other hand, Lazear’s and Boros’s models focus on the incentives to conduct entrepreneurial activities and are considered appropriate for measuring their effects in the new business planning phase. In moving on from the planning phase to actually starting the business, various factors exist such as expected financing, economic situation, and the current employer’s persuasion to stay with the company, which are not controlled in this analysis. Besides, estimation results in Phase 1 in Figure 9 indicate positive correlation with “activity” (the number of extracurricular activities participated), “course” (diversity of courses taken), and “njob” (the number of companies experienced). Thus, Hypothesis 1 is considered to be generally supported.
Hypothesis 2 refers to the correlation of education and work experience with the degree of entrepreneurial success. Heckman’s estimation shown in Figure 10 indicates negative correlation with “course” and “njob” and a positive correlation with “njob_type.” In other words, with regard to education, taking diverse courses tend to decrease the probability of success (in entrepreneurial activities). Also, “activity” did not have a statistically significant correlation. Thus, diversity in education did not contribute to increasing the probability of success. On the other hand, “njob_type” had a positive

16
correlation with the probability of success, indicating that management capability developed through experience in multiple departments in a single company could lead to entrepreneurial success. This is consistent with the positive correlation between generalist-orientation and the probability of success. On the other hand, “njob” had a negative correlation with the probability of success, which supports Hypothesis 3 that Hobos-type individuals who move through jobs have a lower probability of success.
5. Conclusion and implication
This article conducted a regression analysis for entrepreneurial activities, dividing them into the three phases of planning, implementation, and success of the business, with explanatory variables including characteristics relating to human capital, surrounding environments including relatives and friends, and personal characteristics such as personality and orientation. The results indicate consistency with Lazear’s model in the sense that extracurricular activities and overseas experience while attending university are important in the planning and the implementation of new businesses. However, it was demonstrated that diverse experiences within universities did not necessarily have a positive correlation with the success of businesses and that accumulation of management experience through job experience leads to success. Also, it was demonstrated that the number of companies experienced had a negative correlation with success and that Hobos-type individuals with strong non-financial motivation for going through multiple jobs generate low economic value through entrepreneurship.
Although Japan has announced policies to encourage entrepreneurial activities, they have been ineffective. Policy measures in the past focused on financial aspects such as seed money provided by government agencies, removal of minimum capital requirement to start companies, and an angel tax system. This article conducted an analysis focusing on the human capital of entrepreneurs, which is a more fundamental issue. Policies to support entrepreneurship for the innovation and revitalization of the economy should aim not only to increase the number of businesses started but also to improve their probability of success. It was demonstrated that different human capital is needed for the start-up phase and for the success phase. The former requires generalists who are equipped with diverse skills while the latter needs individuals with expertise including management capability developed through work experience and knowledge on particular industries and/or technology areas.
To realize the revitalization of economy with entrepreneurial activities, it is important

17
first to broaden the base for entrepreneurial endeavors. This analysis demonstrates that individuals with entrepreneurs in their immediate circles such as relatives and friends have a higher probability to plan and implement new businesses. As GEM’s research indicated, the weakness of entrepreneurial activities in Japan reflects the continuing situation that people are not surrounded by entrepreneurs, which leads to low levels of entrepreneurship. It is understood that the probabilities of planning and implementation of new businesses increase with participation in extracurricular activities, especially contacts with businesses such as long-term internships and business plan contents. Also, overseas experiences have a positive correlation with entrepreneurial activities. It is important to have students keep contact with companies and society and to enhance systems for overseas study in higher education.
On the other hand, to transform entrepreneurial activities into successful businesses, expertise in such areas as business and technology is more necessary than being generalist-orientation. Especially, it was demonstrated that entrepreneurs who frequently changed jobs had a low probability of success in business. In other words, while generalist-orientation is required to become an entrepreneur, it is important to foster specialists equipped with both “broadness” and “depth” who can lead the ventures to success. Business-related expertise is often obtained through working for companies. Therefore, it is important to promote activities for individuals who are capable of generating significant economic value for society to spin-out from companies to conduct proactively new businesses.
Some Japanese companies have recently been incorporating open innovation in full scale (Motohashi et. al., 2012). It is important to accelerate this trend for transforming Japan’s conventional innovation system centered on large companies to a network-type system with a wide variety of players including high-tech ventures.
References Astebro, T. and P. Thompson, 2011, “Entrepreneurs, Jacks of All Trades or
Hobos?”Research Policy 40: 637-649 Amit, R., Muller, E., Cockburn, I., 1995. “Opportunity Costs and Entrepreneurial
Activity,” Journal of Business Venturing 10 (2), 95-106. Baba, R., 2013, Jinteki shihon ga kigyo katsudo ni ataeru eikyo no bunseki: RIETI
kigyoka ankeeto chosa wo mochiita jissho kenkyu (An analysis of the influence

18
of human capital on entrepreneurial activities: Empirical study using RIETI’s survey on entrepreneurs in Japan), master thesis, Department of Technology Management for Innovation, Graduate School of Engineering, The University of Tokyo, March 2013. (in Japanese)
Bates, T., 2002. “Restricted Access to Markets Characterizes Women-owned Businesses,” Journal of Business Venturing, 17(4), 313-324.
Colombo, M. and L. Grilli, 2010, “On Growth Drivers of High-tech Start-ups; Exploring the role of founders` human capital and venture capital,” Journal of Business Venturing 25: 610-626
DeMartino, R., Barbato, R., 2003. “Differences between Women and Men MBA Entrepreneurs: Exploring family flexibility and wealth creation as career motivators,” Journal of Business Venturing, 18(6), 815-832.
Kaplan, D. and P. Stromberg, 2004, “Characteristics, Contracts and Actions: Evidence from venture capitalist analysis,” Journal of Finance 59: 2177-2210
Kelley, D. J., Singer, S., & Herrington, M., 2011. “Global Entrepreneurship Monitor 2011 Global Report,” Global Entrepreneurship Monitor.
Hamilton, B. 2000, “Does entrepreneurship pay? An empirical analysis of the returns of self-employment,” Journal of Political Economy, 108, 604-631
Hsu, D. H., Roberts, E. B., & Eesley, C. E., 2007. “Entrepreneurs from technology-based universities: Evidence from MIT,” Research Policy.
Hyytinen, A and P. Ilmakunnas, 2007, “Entrepreneurial Aspirations, Another Form of Job Search?” Small Business Economics 29, 63-80
Isobe, T., and Takahashi, N., 2007, “Kigyo katsudo no kokusai hikaku” (International comparison of entrepreneurial activities), Kokumin keizai zasshi (national economic journal), 196(5): 1-13. (in Japanese)
Lazear, E. P., 2004. “Balanced Skills and Entrepreneurship,” American Economics Review 94(2), 208-211.
Lazear, E. P., 2005. “Entrepreneurship,” Journal of Labor Economics, vol23, no. 4, 649-680.
Levesque, M., Minniti, M., 2006. “The Efect of Aging on Entrepreneurial Behavior,” Journal of Business Venturing 21 (2), 177-194.
Motohashi, K., 2012, “A Comparative Analysis of Biotechnology Startups between Japan and the US," Social Science Japan Journal, 15(2): 219-237
Motohashi, K., Ueda Y., Mino, M., 2012, “Nihon kigyo no open innovation ni kansuru shin-choryu: ote maker ni taisuru interview chosa no kekka to kousatsu”
19
(Interview survey results and analysis on new trends in open innovation in large Japanese corporations), RIETI Policy Discussion Paper Series 12-P-015, August 2012. (in Japanese)
Roberts, E.B., 1991. “Entrepreneurs in High Technology: Lessons from MIT and Beyond,” Oxford University Press, New York, NY.
Silva, O., 2007, “The Jack-of-all-trades Entrepreneur: Innate talent or acquired skill?” Economics Letters 97(3), 118-123
Wagner, J., 2006, “Are Nascent Entrepreneurs Jacks-of-all-trades? A test of Lazear’s theory of entrepreneurship with German microdata,” Applied Economics 38, 2415-2419
Japan Research Institute for New Systems of Society, 2012, Heise 22-nendo sogyo/kigyo sien jigyo (kigyoka seishin ni kansuru chosa) hokokusho (Report on FY2010 support activities for new businesses and companies (a research on entrepreneurship)
20
Figure 8: Summary statistics of explanatory variables
Variable Obs Mean Std. Dev.. Min Maxmaster 7023 0.14 0.35 0 1doctor 7023 0.05 0.21 0 1
science 7023 0.34 0.47 0 1activity 7023 4.09 2.92 0 24
univ_got 7023 2.16 1.40 0 8course 7023 0.51 0.66 0 2grade 7023 1.10 0.65 0 2njob 7023 1.36 0.01 0 3
njob_type 7023 1.02 0.01 0 5generalist 7023 0.58 0.49 0 1
abroad 7023 0.38 0.81 0 3entre_num 1501 1.55 0.93 1 5entre_age 1501 34.84 8.55 13 60
male 7023 0.77 0.42 0 1age 7023 44.47 8.97 22 60
optimist 7023 0.19 0.80 -2 2fear 7023 0.37 1.01 -2 2
media 7023 0.22 0.97 -2 2parents 7023 0.12 0.33 0 1siblings 7023 0.05 0.21 0 1friends 7023 0.29 0.45 0 1
colleagues 7023 0.09 0.29 0 1
21
Figure 9: Estimation results (Probit; Ordered Probit)
b z b z b zmaster -0.155 [-2.82]*** -0.063 [-0.66] -0.135 [-1.49]doctor -0.105 [-1.25] 0.040 [0.29] -0.028 [-0.22]science -0.155 [-3.78]*** -0.172 [-2.52]** 0.080 [1.26]activity 0.100 [15.08]*** 0.020 [2.27]** 0.019 [2.50]**univ_got -0.121 [-9.02]*** -0.123 [-5.72]*** 0.031 [1.48]course 0.065 [2.50]** -0.040 [-0.94] -0.098 [-2.53]**grade 0.024 [0.87] -0.058 [-1.29] 0.190 [4.62]***njob 0.151 [8.33]*** -0.037 [-1.21] -0.078 [-2.75]***njob_type -0.045 [-1.91]* 0.035 [0.86] 0.051 [1.38]generalist -0.084 [-2.41]** -0.065 [-1.09] 0.099 [1.82]*abroad 0.058 [2.74]*** 0.029 [0.86] 0.078 [2.51]**entre_num 0.264 [8.56]***entre_age -0.009 [-2.57]**male 0.464 [10.38]*** 0.271 [3.48]*** 0.010 [0.13]age 0.006 [2.96]*** 0.013 [3.74]***optimist 0.261 [10.40]*** 0.052 [1.19] 0.128 [3.18]***fear -0.036 [-2.05]** -0.116 [-3.91]*** -0.014 [-0.51]media 0.054 [2.72]*** -0.146 [-4.18]*** -0.013 [-0.40]parents 0.406 [7.92]*** 0.319 [4.12]*** 0.076 [1.13]siblings 0.383 [4.70]*** 0.139 [1.25] -0.025 [-0.27]friends 0.357 [8.98]*** 0.023 [0.35] 0.039 [0.65]colleagues 0.503 [8.30]*** 0.271 [3.28]*** 0.056 [0.78]LR-chi2N* p<0.1, ** p<0.05, *** p<0.01
phase3 (ordered probit)
232.671501
phase1 (probit) phase2 (probit)
1496.36 173.837023 2201

22
Figure 10: Estimation results (Heckman’s two-step estimator)
b z b zmaster -0.025 (0.30) 0.023 (0.12)doctor 0.068 (0.56) 0.415 (1.52)science -0.065 (1.03) 0.144 (1.01)activity -0.027 (2.94)*** 0.017 (0.88)univ_got -0.097 (4.93)*** 0.212 (4.67)***course -0.064 (1.65) -0.171 (2.00)**njob -0.066 (2.30)** -0.261 (3.98)***njob_type 0.036 (0.98) 0.174 (2.10)**generalist -0.047 (0.86) 0.321 (2.65)***_cons 1.414 (12.76)*** 6.597 (21.20)***select degree -0.129 (2.63)*** -0.109 (2.05)**science -0.162 (3.97)*** -0.194 (4.41)***activity 0.100 (15.37)*** 0.077 (11.99)***univ_got -0.116 (8.81)*** -0.152 (10.54)***course 0.070 (2.70)*** 0.039 (1.43)njob 0.150 (8.32)*** 0.104 (5.36)njob_type -0.047 (2.03)** -0.031 (1.24)generalist -0.083 (2.40)** -0.095 (2.55)**abroad 0.060 (2.91)*** 0.072 (3.29)***male 0.473 (10.85)*** 0.469 (9.54)***age 0.007 (3.70)*** 0.011 (4.93)***optimist 0.250 (10.16)*** 0.241 (9.16)***fear -0.050 (2.90)*** -0.078 (4.24)***media 0.035 (1.77)* -0.019 (0.91)parents 0.423 (8.48)*** 0.442 (8.64)***siblings 0.379 (4.75)*** 0.322 (4.07)***friends 0.344 (8.85)*** 0.289 (6.97)***colleagues 0.515 (8.68)*** 0.481 (8.10)***_cons -1.754 (16.98)*** -1.971 (17.48)***rhoWald-chi2LR-chi2NN-cens.* p<0.1, ** p<0.05, *** p<0.01
4822 5522
-0.515 -0.38259.54 68.4639.17 27.657023 7023
phase 2, selected by phase 1 phase 3, selected by phase 2

23
Appendix: Outline of the survey by RIETI on entrepreneurs
A-1.Sampling design
To conduct an analysis focused on the entrepreneurial activities of high-risk venture companies, the survey screened the respondents by the universities from which such companies’ founders graduated. To this end, using the database of entrepreneurs compiled by JVR2, universities from which founders of venture companies which received investment from venture capital were identified and those universities with a number of such graduates were selected. The database included 1,432 entrepreneurs (and angel investors) and a total of 1,535 university degree holders3. Universities with 10 or more applicable graduates were listed in the table below—of which 14 graduated “20 or more entrepreneurs,” which correspond to a majority of the database on a cumulative basis—and were designated as filtering criteria for education in this survey.
Figure A-1. The number of entrepreneurs by university
2 Japan Venture Research Co., Ltd., which supports venture companies’ growth and expansion with optimal capital policies and operates its own database 3 Data on the database show inconsistencies in terms of how degrees are indicated—multiple universities, only final degree, or university from which the entrepreneur graduated are not disclosed—and, therefore, a one-to-one relation does not necessarily exist between an entrepreneur and a university.
Ranking University Count Share Ranking University Count Share1 Tokyo 171 11.1% 15 Nihon 18 1.2%2 Keio 164 10.7% 16 Rikkyo 18 1.2%3 Waseda 146 9.5% 17 Hosei 18 1.2%4 Kyoto 68 4.4% 18 Hokkaido 16 1.0%5 Osaka 35 2.3% 19 Kyushu 15 1.0%6 Hitotsubashi 31 2.0% 20 Yokohama N. 14 0.9%7 TIT 31 2.0% 21 Kwansei Gakuin 14 0.9%8 Doshisha 30 2.0% 22 Kobe 14 0.9%9 Jochi 28 1.8% 23 Kansai 13 0.8%10 Chuo 27 1.8% 24 Ritsumeikan 12 0.8%11 Aoyama Gakuin 26 1.7% 25 Tsukuba 11 0.7%12 Tohoku 24 1.6% 26 ICU 10 0.7%13 Meiji 23 1.5% 27 Tokai 10 0.7%14 Tokyo Science 22 1.4% 28 Nagoya 8 0.5%
29 Gakushuin 8 0.5%30 Saitama 7 0.5%31 Senshu 7 0.5%
Overseas 125 8.1%Others 401 26.1%

24
A-2. Design of the survey sheet As explained in Chapter 3, to enable an analysis on the phased approach to entrepreneurial activities, a survey sheet with 152 questions was prepared in accordance with the flowchart for the survey sheet below.
Figure A-2. Flowchart for the survey sheet
S1~S5、Screening → EndOut of scope
↓No
Q1 Entrepreneurhsip activity → Q50 Planned entrepreneurshipNo
↓Yes ↓Yes
Q2~Q49 About activity Q51、Q52 About planning activity
↓
Q53~Q64 Activity at University
↓No
Q65 Employee experience
↓Yes
Q66~Q123 About employee experience
↓
Q124 Job changes
↓Yes Np
Q125~Q126 About Job changes
↓
Q127~Q134 Environment
↓
Q135~Q138 Personal characteristics
↓
Q139~Q144 Investment experience
↓No
Q145 Future plan of entrepreneurship
↓Yes
Q146~Q150 About future plan
↓
End End
25
A-3. Method of the survey The survey was conducted on the Internet according to the outline shown in Figure A-3. While the targeted numbers were 1,500 respondents with experience in starting businesses and 5,000 respondents without experience, data were collected from 1,501 entrepreneurs and 5,522 non-entrepreneurs, a total of 7,023 respondents, exceeding the target.