Entrepreneurial Teams, Optimal Team Size, and Founder Exits · Entrepreneurial Teams, Optimal Team...
34
Entrepreneurial Teams, Optimal Team Size, and Founder Exits * Mili Shrivastava † Jagannadha Pawan Tamvada ‡ Abstract The extant literature on entrepreneurial teams has rarely examined the role of team- size and team environment for entrepreneurial firm performance and exit of team mem- bers from entrepreneurial teams. We contribute to the literature by examining the role of teamsize and team environments of dissonance and synergy for exit of founding team members from entrepreneurial teams using a novel database of entrepreneurial firms. The empirical results suggest that the size of the entrepreneurial team has an inverted U shape relationship with firm performance indicating the existence of an optimal team size for entrepreneurial firms. Further, teams with size larger than the optimal team size and teams in dissonance are more likely to experience founder exits from entrepreneurial teams. Keywords: Entrepreneurial Teams, Spinoffs, Team Turnover, Team Entry and Exit, Optimal Team Size, Firm Growth * We thank the Kauffman Foundation for providing access to the KFS database. † Max Planck Institute of Economics and University of Jena. Email: [email protected] ‡ Economics and Strategy Group, Aston Business School, and Centre of India and Global Business, Uni- versity of Cambridge. Email: [email protected]
Transcript of Entrepreneurial Teams, Optimal Team Size, and Founder Exits · Entrepreneurial Teams, Optimal Team...

Entrepreneurial Teams, Optimal Team Size, andFounder Exits∗
Mili Shrivastava† Jagannadha Pawan Tamvada‡
Abstract
The extant literature on entrepreneurial teams has rarely examined the role of team-size and team environment for entrepreneurial firm performance and exit of team mem-bers from entrepreneurial teams. We contribute to the literature by examining the roleof teamsize and team environments of dissonance and synergy for exit of founding teammembers from entrepreneurial teams using a novel database of entrepreneurial firms.The empirical results suggest that the size of the entrepreneurial team has an invertedU shape relationship with firm performance indicating the existence of an optimal teamsize for entrepreneurial firms. Further, teams with size larger than the optimal team sizeand teams in dissonance are more likely to experience founder exits from entrepreneurialteams.
Keywords:Entrepreneurial Teams, Spinoffs, Team Turnover, Team Entry and Exit, Optimal Team
Size, Firm Growth
∗We thank the Kauffman Foundation for providing access to the KFS database.†Max Planck Institute of Economics and University of Jena. Email: [email protected]‡Economics and Strategy Group, Aston Business School, and Centre of India and Global Business, Uni-
versity of Cambridge. Email: [email protected]

Introduction 2
1 Introduction
Recent studies suggest that continuous innovative change leads to knowledge accumula-
tion and complexity of knowledge, and this causes individuals to opt for specialisation in
knowledge (Jones, 2009). As a result, innovation has become task of specialised individuals
(Audretsch, 1995; Jones, 2009; Wuchty et al., 2007). Team formation is desirable when team
members gain from complementarities, encourage knowledge transfer of idiosyncratic infor-
mation, and create synergy (Lazear, 1998; Hamilton et al., 2003; Rose, 2002). A vast body
of literature finds that team ownership significantly improves firm performance (Keeley and
Roure, 1990; Haleblian and Finkelstein, 1993; Finkelstein and Hambrick, 1990). The size of
top management team has a positive impact on innovation in the firm (Somech, 2006) and
large teams are more likely to radically innovate (West and Anderson, 1996; Jones, 2009).
Top management team size has a positive impact on growth of market share (Hambrick
et al., 1996).
However, the extant literature is not unequivocal on the role of teamsize for firm per-
formance. Many studies on team processes are based on an assumption that a large team
size can make coordination, communication, allocation of task and decision making more
tedious. Large teams are more likely to have disagreements over firm strategy resulting in
increased coordination costs for resolving these disagreements. Large teams exhibit greater
dependence on unspecified tasks (Hambrick et al., 1996) and are slow in competitive moves
(Hambrick et al., 1996). They require greater monitoring and coordination to maintain pro-
ductivity (Liang et al., 2008). Members of large teams form subteams and are less likely to
have agreement over firm’s strategy (Iaquinto and Fredrickson, 1998). An increase in team
size brings the possibility of free riding by individual members of the team and reduces its
efficiency (Alchian and Demsetz, 1972). Large teams may lack commitment, experience more

Introduction 3
conflicts and become ineffective (Chowdhury, 2005; Amason and Sapienza, 1997). This body
of research suggests that large team size does not foster firm performance- it may even have
a negative influence.
While the debate on the role of teamsize for firm performance remains inconclusive, the
role of teamsize for the performance of entrepreneurial firms’ and, in particular, its role in
shaping exit of team members from entrepreneurial teams has received little attention in the
extant literature.1 Entrepreneurial teams are formed on a basic premise that team members
aid firm performance by their own particular expertise, whether it is knowledge, skills or
interpersonal relationships. However, teams experience more intra-team disturbances as
their size increases. The dissonance and synergy theory of spinoffs proposed in Shrivastava
and Rao (2010) suggests that members of teams in dissonance are more likely to exit and
start spinoff firms. Thus larger entrepreneurial teams are more likely to experience founding
team members exits. This conjecture is tested empirically by examining the factors shaping
the growth of entrepreneurial firms and exit of founding team members from entrepreneurial
teams.
Unlike earlier studies, we use a large representative database of entrepreneurial firms and
examine the role of team characteristics for firm performance as well as exit of founding
team members from entrepreneurial teams. We make several important contributions to
the literature of entrepreneurial teams, spinoffs and firm growth. First, although a number
of studies have examined the role of top management team size for performance of large
established firms, the impact of team size for growth of entrepreneurial firms have received
little attention in the extant literature. Second, the emerging body of literature on spinoffs1A recent exception is Ucbasaran et al. (2003) who study factors influencing entry and exit in a small
sample of entrepreneurial teams. In contrast to their study, we use a relatively larger and more representativedatabase of entrepreneurial start-ups; and, many of the results presented here are qualitatively different fromtheir findings.

Theoretical Background and Hypothesis 4
has rarely examined spinoffs from entrepreneurial ventures, and spinoffs by founding team
members of existing entrepreneurial ventures. By examining the exit process of entrepreneurs
from the teams they have established, we take a step forward into this relatively unexplored
area of research. Further we examine the role of synergy and dissonance in team production
environments for founder exits and empirically test the theoretical predictions of Shrivastava
and Rao (2010). Shrivastava and Rao (2010) predict that while teams in synergy are less
likely to have spinoffs, teams in dissonance are more likely to have them. The empirical
results suggest that teamsize has an inverted U shaped relationship with entrepreneurial
firms’ performance indicating the existence of an optimal team size. Teams that have a size
larger than the optimal size under-perform. Teamsize has a significantly positive impact
on the exit of founding team members from entrepreneurial teams. Consistent with the
hypotheses, the empirical results suggest that team environments of dissonance and synergy
influence exits from entrepreneurial teams.
The next section presents the theoretical background and hypotheses linking teamsize and
team characteristics with firm performance and exit of team members from entrepreneurial
teams. The third section describes the database and descriptive statistics. The fourth section
discusses the empirical results. The final section presents conclusions and future research
directions.
2 Theoretical Background and Hypothesis
Individuals form teams to accomplish complex tasks. Most teams are formed under an
assumption that team environments capitalize on complimentarities leading to more efficient
economic outcomes. As a growing body of literature on scientific knowledge production
Theoretical Background and Hypothesis 5
shows, team formation has become a critical component for advancing scientific knowledge.2
There is compelling evidence that radical innovation is more likely to emerge from teams
of specialized individuals. By pooling individuals talents, teams resolve complex problems
(Hambrick and D’Aveni, 1992; Eisenhardt and Schoonhoven, 1990).3 Using information
processing and agency theories, Sanders and Carpenter (1998) show that a large team size
enables firms to manage and cope with the information processing demands and agency issues
arising from internationalization. Team size is found to have a positive association with firm
performance in a variety of settings as larger teams are likely to have more resources (Cooper
and Bruno, 1977; Eisenhardt and Schoonhoven, 1990; Feeser and Willard, 2006; Haleblian
and Finkelstein, 1993; Colombo and Grilli, 2005).
Entrepreneurs face formidable constraints in the firm start-up process. A majority of
individuals give-up on their entrepreneurial ambitions because of these constraints and never
become entrepreneurs. An alternate route to escaping these constraints is to form teams
with individuals who can provide complimentary skills for the start-up firm in its nascence.
In dynamic environments and industries with rapid technological change, firms are more
likely to be started by entrepreneurial teams (Cooper and Bruno, 1977). Entrepreneurial
teams are relatively more successful in attracting resources critical to the functioning of
start-up firms. Venture capitalists are more likely to fund teams of entrepreneurs and even
traditional financial institutions such as banks are more likely to provide support for teams
of entrepreneurs (Teece, 1982; Cooper and Daily, 2000; Beckman et al., 2007). A vast body
of literature suggests that ventures found by entrepreneurial teams are often more successful2In many disciplines it is increasingly observed that scientific articles are written by teams of authors,
and the size of such scientific teams in increasing over time.3Firms nearing bankruptcy tended to have smaller teams Hambrick and D’Aveni (1992). D’Aveni (1990)
also argue that organisations with large top management teams are less likely to be bankrupt however theydo not find a significant relationship.

Theoretical Background and Hypothesis 6
than those founded by solo entrepreneurs (Cooper and Bruno, 1977; Cooper, 1985; Chandler
and Hanks, 1998; Roberts, 1991; Finkelstein and Hambrick, 1990; Keeley and Roure, 1990;
Haleblian and Finkelstein, 1993). The size of the founding entrepreneurial team has an
influence on basic firm strategy and (Beckman, 2006) and is associated with higher firm
growth (Cooper and Bruno, 1977; Colombo and Grilli, 2005).
While team formation leads to efficient outcomes in a variety of settings, individuals work-
ing in teams face restrictions and must conform to group norms. Actions of team members
may not be outcomes of independent thinking, and team members may develop conformist
attitudes. Team organization may force individuals to accept majority decisions. Conflicts
within the team may inhibit team cohesion and exacerbate team members’ discontentment
leading to inefficient team outcomes. As Shrivastava and Rao (2010) demonstrate, while
synergetic team production environments have superior firm performance, the outcomes of
teams in dissonance are less efficient. Although firms started by entrepreneurial teams are
expected to outperform firms started by individual entrepreneurs, team production envi-
ronments of synergy and dissonance play an important role in shaping the team outcomes.
The propositions in Shrivastava and Rao (2010) suggest that entrepreneurs in teams with
dissonance prefer to exit and start their own teams independently. Furthermore, it is estab-
lished in the literature that individuals become entrepreneurs for non-pecuniary gains such
as freedom and autonomous decision making powers. In entrepreneurial teams, individual
entrepreneurs have to sacrifice this freedom to some extent.
An important insight emerging from Kremer’s "O-ring theory of development" is that
optimal output is determined by the weakest member of a team production environment
(Kremer, 1993). As the size of the team increases, arm-length co-ordination costs, informa-
tion asymmetry with in a team and shirking by individual team members increases. Free
Theoretical Background and Hypothesis 7
rider problems arise due to the inverse relationship between team size and monitoring (Liang
et al., 2008). This results in an inverted U-shaped relationship between effort and team-size
(Backes-Gellner et al., 2004). Thus, in large teams, effort exerted by individual team mem-
bers may be less than optimal team effort in large teams. The team member who exerts
the least effort serves as the weakest link in the team, and determines the team outcomes.
Following Kremer’s "O-ring theory", as large entrepreneurial teams are more likely to have
shirking team members, large teams should have lower performance.
Small teams are more aware of team goals and are better acquainted with other team
members’ personalities, work roles and communication styles (Bradner et al., 2003), larger
teams require more monitoring, and have less coordination and effectiveness in innovative
strategies (Liang et al., 2008; Chowdhury, 2005; Backes-Gellner et al., 2004; Alchian and
Demsetz, 1972).4 Further, as entrepreneurs group together to form very large teams, asym-
metric information about the capabilities of other individuals prevents them from making an
accurate assessment of the contribution of the team member. Thus, the ability to identify
individuals who contribute most to the team decreases as the size of the team increases. This
increases the likelihood that some of the team members are not the “best fit” for the team,
resulting in divergence in member entrepreneurs’ beliefs about appropriate firm strategy.
This may lead to dissonance in the team and cause founding team members to exit from the
team.
Although entry and exit of top managers is a widely observed phenomenon across firms,
very little is known about entry and exit of entrepreneurs from entrepreneurial teams. Studies
focused on large established firms have examined the role of team turnover for organizational4Hambrick et al. (1996) find that although team size is positively related to growth in market share, team
size was negatively related to response propensity and to three measures of competitive magnitude (actionsignificance, action noteworthiness, and action scope).

Theoretical Background and Hypothesis 8
strategy and performance (Hambrick and Mason, 1984; Jackson et al., 1991). In high tech-
nology firms almost half of the firms have at least one founder exit (Cooper and Bruno,
1977). The propositions in Shrivastava and Rao (2010) discussed the role of dissonance in
teams for team performance and the team member exits. As large teams are more likely to
have dissonance because of lack of coordination, free-rider problems and interdependencies,
large teams are more likely to be in dissonance. When large founder team size impedes the
work processes in the firm as founders have diverse views, less communication and obsolete
knowledge or skills, the process of churning the top management team members sets in.
This team turnover process adjusts the teams to the optimal size. Thus firms that have
large entrepreneurial teams shed team members. These arguments suggest the following
hypotheses:
Hypothesis 1a: Entrepreneurial teamsize has an inverted U shaped relationship with
firm performance. Put differently, although performance of entrepreneurial firm increases
with founding size of the entrepreneurial team, an optimal teamsize exists such that en-
trepreneurial teams larger than this optimal size under-perform.
Hypothesis 1b: Large entrepreneurial teams are more likely to experience founder exits.
Role of Team and Firm Characteristics for Founder Exits
Team characteristics such as founders’ average human capital, entrepreneurial experience,
work experience, and team heterogeneity are likely to have an impact on exit of founding team
members of entrepreneurial teams(Colombo and Grilli, 2005; Colombo et al., 2004; Gimeno
et al., 1997; Watson et al., 2003). Greater human capital stocks in the team can create
synergies and decrease the likelihood of exit of founders. Previous entrepreneurial experience
and work experience provide entrepreneurial team members with abilities to pursue a wider

Theoretical Background and Hypothesis 9
scope of entrepreneurial activities and may have a positive impact on their departure from
their current team (Gimeno et al., 1997; Stuart Pier and Robert, 1990). Racial composition,
and proportion of women may decrease team cohesion and give rise to more disagreements
within the team on the one hand, and improve teams’ ability to reconcile with opposing
viewpoints on the other hand (Smith et al., 2006).
If heterogeneity causes synergies in the team, team members are less likely to exit; how-
ever, if heterogeneity causes dissonance in the team, team members are more likely to exit.
Diversity in average effort should proxy for dissonance in the team as it indicates that some
members work less than others. When some owners exert higher effort and others exert much
lower effort, conflicts are likely to result. This may lead to disagreements over allocation
of returns. Thus, diversity in the hours worked is likely to have a positive impact on team
member exits. However, if team members exert high average effort, the team is less likely to
be in dissonance. Thus, a higher average effort by team members should make founders less
likely to exit as it proxies for synergies in the entrepreneurial team.
Entrepreneurial teams with concentrated ownership work differently than the en-
trepreneurial teams with equally distributed ownership. Firms with team members who have
a diverse ownership share will have lesser disagreements as team members have varied levels
of control on firm strategy. However, in teams with similar ownership shares across team
members, disagreements and conflicts are more likely to result as team members disagree
with one another when they have similar control on the firm. In such a setting, distribution
of tasks and delegation of decision powers to team members must be clear. These arguments
lead to the following hypotheses.
Hypothesis 2a: Entrepreneurial teams that are in dissonance are more likely to experience
founder exits.

Data 10
Hypothesis 2b: Entrepreneurial teams that are in synergy are less likely to experience
founder exits.
3 Data
The database of entrepreneurial firms examined in this study is the collected by the Kaufman
Foundation. Data on nearly 5000 entrepreneurial firms are collected beginning from 2004
using a stratified sampling methodology to ensure representativeness of the sample. The
sampling design for data collection is extensively documented (DesRoches et al., 2010).
——————————————————-
Insert Table 1 about here.
——————————————————-
Table 1 provides descriptive statistics for the variables used in the empirical analysis in
the next section. Although data is collected for almost 4900 firms, data on employment
growth is available for only 3320 firms and data on revenue growth is reported for only
1532 firms. As expected, revenue growth has a greater dispersion compared to employment
growth. 14.25% of the firms are in high-tech sector and 21% of the firms have some type of
intellectual property (intellectual property = 1 if firm has a patent, trademark or copyright).
Nearly 21.5% of firms are actively involved in R &D activities. The average age of the
entrepreneurs in the sample is 44.7 years. More than 50% of entrepreneurs in the sample have
college degrees. While average working experience of the teams is 12.35 years. Blacks and
asians are about 12.5% of the sample. The diversity measures of the team characteristics are
generated using Blau (1977) index. Blau’s diversity measure is widely used in the literature.
It is defined as Diversity(I) = 1−∑
(Pi)2 where Pi is the proportion of outcome i. While
Data 11
perfectly homogenous teams have a diversity measure of 0, perfectly heterogenous teams
have a diversity measure equal to 1. Age diversity in the team is measured by the coefficient
of variation. For all other team characteristics, diversity measures are constructed using
Blau index.
——————————————————-
Insert Figure 1 and Figure 2 about here.
——————————————————-
Figure 1 and Figure 2 show the relationship between team size and firm growth using bar
graphs. Figure 1 presents a plot for a one year period growth rate in employment and Figure 2
presents a plot for a two year period growth rate in employment. A striking observation is
that, consistent with the hypothesis 1(a), both plots show that teamsize has a non-linear
inverted U shaped relationship with the growth of entrepreneurial firms. Both plots suggest
that firm growth increases as entrepreneurs add team members until they form a team of
three entrepreneurs. However, firms with entrepreneurial teams of size four or more have
lower growth rates than firms owned by entrepreneurial teams with four entrepreneurs.
——————————————————-
Insert Figure 3 and Figure 4 about here.
——————————————————-
Figure 3 and Figure 4 present plots showing the link between teamsize and team turnover.
Team turnover is defined as the net change in the founding teamsize over the first two years
after firm founding. A positive team turnover in Figure 3 indicates that teams had net
entry over the two year period; a negative team turnover in Figure 3 indicates that team
had net exits. Consistent with hypothesis 1(b), both plot shows that while small teams had

Empirical Results 12
positive team turnover, large teams experienced more exits. As Figure 3 does not provide
information about average team turnover across teams of different sizes, we plot the average
team turnover over the two year period in Figure 4. This plot shows that teams of all sizes
experienced net exits over the two year period, and largest teams had the greatest average
number of team member exits.
In the empirical analysis presented in the following section, these descriptive relationships
are tested more formally using econometric models. The sampling design is taken into
account by estimating econometric models of survey data. 5 Survey weights provided with
the database are used in the estimations.
4 Empirical Results
The following empirical models are estimated to examine the role of team characteristics and
firm characteristics for firm growth and exit of team members from entrepreneurial teams:
growth(t+2,t) = log(size(t+ 2)) − log(size(t)) = α + β1teamsize + β2teamsize2 +
β3(firm− characteristics) + β4(team− characteristics) + ε
teamexit(t+2,t) = 1/0 = α + β1teamsize + β2(firm − characteristics) + β3(team −
characteristics) + ε
For the growth estimations, the full sample of all the firms is considered for analysis to
correctly estimate the non-linearity of the teamsize effect. However, for models estimating
team exit, a subsample of firms that are owned by entrepreneurial teams of two or more than
two entrepreneurs is considered for analysis.
5The panel version of the database was at a very early stage of development at the time of writing thisarticle; the analysis is done using the data released in the years 2006, 2007 and 2008.

Empirical Results 13
——————————————————-
Insert Table 2 about here.
——————————————————-
The estimation results for the firm growth equation are presented in Table 2. The results
provide credence to the conjecture that size of the entrepreneurial team has a non-linear
effect on firm growth. In particular, the positively significant coefficient on teamsize variable
and the negatively significant coefficient on the teamsize squared variable in different specifi-
cations estimated in columns (1)-(5) consistently predict that the optimal team size is about
three members.6 Thus, teams of size smaller than three members experience faster growth
by the addition of an entrepreneur to the team; however, teams that have more than three
members have lower growth rates. This confirms the hypothesis that large entrepreneurial
teams are more likely to under-perform.
The estimated coefficients of firm characteristics presented in columns (2) and (3) for
firm performance are as expected. While firm size has a significantly negative impact on firm
growth, firms’ in high-tech industries grow faster by 18-19%. Firms that are home based
have lower growth rates, confirming that home based entrepreneurs do not have high growth
aspirations. The coefficients of intellectual property and R&D are insignificant suggesting
that entrepreneurial firms do not benefit from these immediately in the early phases of firm
start-up.7
6Optimal team size is obtained by dividing the coefficient of the teamsize variable by two times thecoefficient of the teamsize squared variable.
7 A vast literature has examined the role of firm characteristics for firm growth (see Coad, 2009, for asurvey). Firms in high technology sectors are more likely to grow as they are in a dynamic and rapidlyevolving environment (Feeser and Willard, 1990). Intellectual property forms resource base of firms, sustainsfirm specific competitive advantage and plays an important role for firm growth (Zucker et al., 1998; Riahi-Belkaoui, 2003). Innovative effort, measured by firms’ commitment to R&D is likely to result in highergrowth rate of firms as such firms tend to succeed in the product market (Del Monte and Papagni, 2003).
Empirical Results 14
The effects of team characteristics for firm growth are estimated in the full model in
columns (4) and (5) of Table 2. The signs of the estimated coefficients are as expected.8
However, in contrast to many previous studies, for example, Stuart Pier and Robert (1990),
the estimated coefficient of average age is significantly negative. Although age is associated
with increased human capital and access to resources, age can diminish cognitive skills and
impede growth ambitions of entrepreneurs. Consistent with many prior studies, proportion
of females in an entrepreneurial team has a significantly negative impact on firm growth.
Extant literature suggests many reasons for this negative effect. Women are more risk averse
and prefer stability and they attract fewer financial and technological resources that are
critical to the firm growth(Cliff, 1998; Du Rietz and Henrekson, 2000; Verheul and Thurik,
2001).
Consistent with the existing literature, that educated entrepreneurs are capable of at-
tracting more resources for the firm (Colombo and Grilli, 2005; Beckman et al., 2007; Gormon
and Sahlman, 1989), education of team founders has a significant and positive impact on
firm growth and grow faster. Average number of hours worked proxies for synergy in team.
Teams in dissonance are less likely to have members working for longer periods of time.
The average number of hours worked by the members of an entrepreneurial team has a
significant and positive impact on firm growth. Thus, consistent with the hypothesis 2(a),
synergetic teams have higher growth rates. In contrast to earlier studies, the results suggest8Team characteristics such as founders’ age, educational background, and functional heterogeneity are
likely to influence firm performance (Colombo and Grilli, 2005). Hsu (2007) finds that founding teams witha team member who has doctoral degree are more likely to get higher valuations and funding from venturecapitalists. Beckman et al. (2007) find that firms whose top management teams have affiliation diversity aremore likely to be successful than firms whose founders have fewer company affiliations. Team composition isan important determinant of exploitative or explorative behaviour in innovation (Beckman, 2006). Individualfactors such as industry experience of founders enhance firm survival and sales (Delmar and Shane, 2006).The functional backgrounds of the founders of new ventures (Haleblian and Finkelstein, 1993; Pitcher andSmith, 2001; Somech, 2006) and the social capital of founders (Shane and Stuart, 2002) have a positiveinfluence on firm performance.

Empirical Results 15
that previous experience of team members does not have a significant effects on firm growth
in the early phases of their formation. Furthermore, the effect of race is insignificant. Team
heterogeneity measures based on these characteristics are all insignificant.9
——————————————————-
Insert Table 3 about here.
——————————————————-
In Table 3, the growth equation is re-estimated using an alternate measure of firm growth
(given by growth of revenue over a two year period). The estimated coefficients are broadly
consistent with the effects in Table 2. In particular, while team size has a significant and
positive coefficient, team size squared has a significant and negative impact on firm growth.
Thus, the results are robust to alternate specifications.10
——————————————————-
Insert Table 4 about here.
——————————————————-
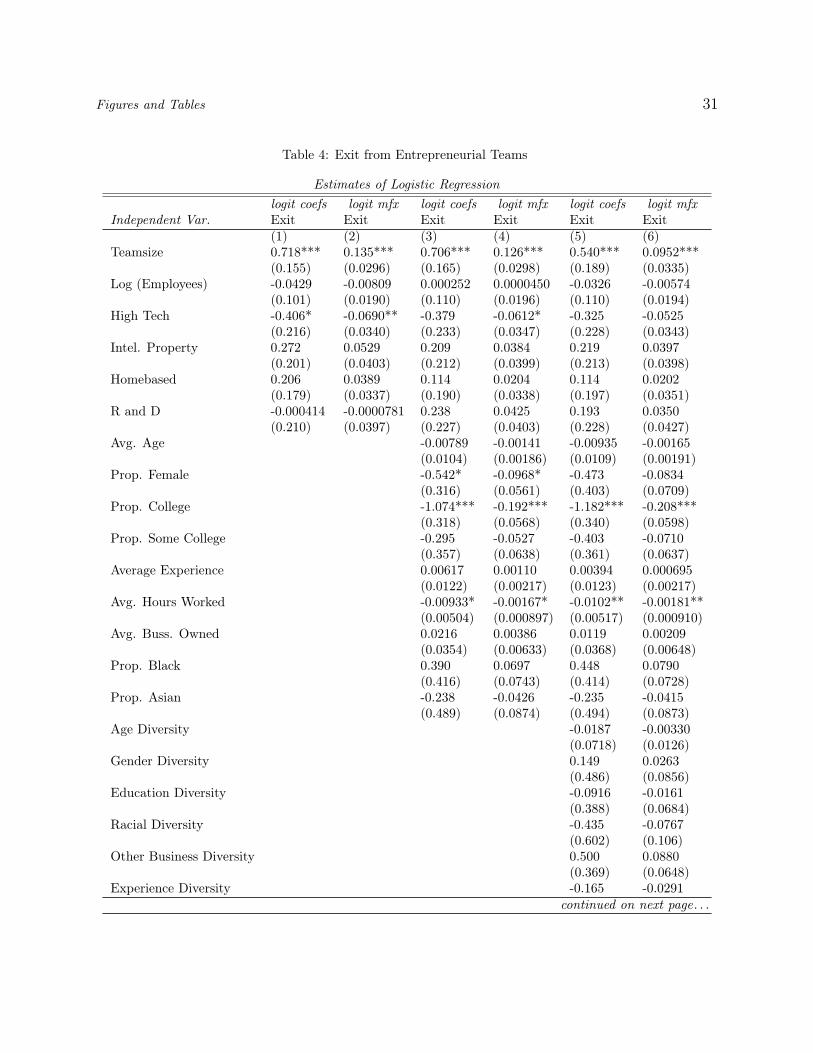
The estimated results for the team member exit equation are presented in Table 4. The
dependent variable for these estimations is binary and takes value 1 if the entrepreneurial
team had net exit of team members over a two year period after the start-up and 0 otherwise.
Columns (1), (3), and (5) present the estimated coefficients of logistic regression, and columns
(2), (4) and (6) present the marginal effects. Consistent with hypothesis 2(b), teamsize has
a positive and significant impact on exit of founding team members from entrepreneurial
teams in all the specifications suggesting that larger teams are more likely to experience net
team exits.9These are not reported here for brevity reasons.
10For the estimations in Table 5.2, many firms are excluded from the estimations, as the dependent variable,growth in revenue has only 1500 observations.

Empirical Results 16
The proxy for team synergy, average effort, measured by average hours worked by team
members, has a significantly negative effect in columns (3)- (5). This supports hypothesis
2(b) that teams in synergy are less likely to experience exits. However, consistent with hy-
pothesis 2(a), the proxy for dissonance, measured by the diversity of effort (hours worked by
team members), has a significantly positive impact on exit of founders from entrepreneurial
teams suggesting the teams in dissonance are more likely to experience founder exits. As
expected, ownership diversity has a significantly negative effect on team exits. Top man-
agement teams where ownership is concentrated have different routines compared to when
ownership equally distributed. Entrepreneurial teams with a diverse ownership share will
have lesser disagreements as team members have varied levels of control on firm strategy.
However, in teams with similar ownership shares across team members, disagreements and
conflicts are more likely to result as team members may disagree with one another when
they have equal control on the firm.
Proportion of women in the team has a significant effect in the second model presented
in columns (3) and (4) but the effect disappears when the team heterogeneity measures are
introduced in columns (5) and (6). As the negative and significant coefficient on proportion
of entrepreneurs with college degrees suggests, teams with more educated entrepreneurs are
less likely to have founder exits. This may be because educated individuals have superior
social skills that enable them to manage conflicts within the team.
The coefficient of high tech is significantly negative in the base model suggesting that
teams in high-technology sectors are less likely to experience exits. However, the significance
becomes weaker in the second model presented in columns (3) and (4), and vanishes in the
full model presented in columns (5) and (6). All firm level variables are insignificant in the
full model specified in columns (5) and (6) suggesting that for founder member exits, team

Empirical Results 17
characteristics play a more important role than firm characteristics.
——————————————————-
Insert Table 5 about here.
——————————————————-
The logistic estimations estimate the factors influencing exit of team members. However,
the logistic regressions treat teams with net team entry and zero team turnover alike (both
are coded as 0 exits). In order to disentangle the effects more precisely, a multinomial
logistic regression model is estimated in Table 5 to examine the effects of the team size,
and team characteristics of dissonance and synergy on team entry, team exit and team
neutrality. The dependent variable, “team dynamics” assumes a value equal to 1 if the team
had next exits over the two year period. If there was no change in the size of the team the
dependent variable teamdynamics is coded as 2. The results of the multinomial estimations
for team exit are broadly consistent with the logistic regression equations. The multinomial
logit estimation further provides insights into factors shaping entry of team members into
entrepreneurial teams. While teamsize does have a positive impact on team member exit, it
has no effect on team entry.11 Team dissonance, measured by the diversity in hours worked
has a significantly negative impact on team exits. Furthermore, it has a significantly negative
impact on team entry, suggesting that firms in dissonance deter both exit and entry of team
members. The measure of synergy, given by the average number of hours worked by team
members has an insignificant relationship with exit but a significantly positive relationship
with synergy. This result is consistent with the propositions in Shrivastava and Rao (2010)11This may be explained by the observation that majority of team entry occurs in solo entrepreneur firms,
and the sample for the multinomial estimation is restricted to the teams that have at least two entrepreneursat the first year of start-up. In logistic estimations of team entry on full samples (not reported here), teamsizehas a significantly negative effect on team entry.

Conclusion 18
and the hypotheses developed in this paper that teams in synergies are less likely to have
spinoffs. Positive coefficient of the synergy measure suggests that teams in synergy attract
new team members. Teams that have a higher proportion of women entrepreneurs are more
likely to have zero turnover during the early periods of firm start-up and less likely to have
entry, confirming that women prefer stability in workplace. A similar effect is observed
for entrepreneurs with college degrees–teams with a higher proportion of highly educated
entrepreneurs are less likely to have founder exits. Such teams are more likely to have a zero
turnover.
5 Conclusion
Two broad theories have emerged with regard to the role of teams for firm performance -
first, a theory of team synergy and second, a theory of team dissonance. The synergy theory
primarily focuses on the positive impact of team ownership on firm performance, and the
dissonance theory cautions about the adverse effects of a large team size for productivity.
This paper brings together these two strands of literature to examine the impact of teamsize
on firm performance and exit of founding team members from entrepreneurial teams.
While the debate on the role of teamsize for firm performance continues to be inconclu-
sive, the extant literature has rarely examined the role of teamsize and team synergy and
dissonance for exit of team members from entrepreneurial teams. This article contributes to
the extant literature by examining the role of teamsize and team characteristics of dissonance
and synergy for exits from entrepreneurial teams using a novel dataset on entrepreneurial
firms. The empirical findings presented here suggest that although team ownership has a
positive impact on a variety of firm performance measures, the size of the entrepreneurial
team has an inverted U shape relationship with these measures indicating the existence of

Conclusion 19
an optimal team size for entrepreneurial firms. The results show that teamsize has an in-
verted U shaped relationship with firm performance suggesting that teams of size larger than
optimal team size under-perform. Further, large teams and teams in dissonance shed team
members. Both dissonance and synergy have an impact on team member exits. We provide
a compelling foundation for studying spinoffs from entrepreneurial teams in future work.
Future research can extend this research to more dynamic settings.

REFERENCES 20
ReferencesAlchian, A. and Demsetz, H. (1972). Production, information costs, and economic organi-
zation. The American Economic Review, pages 777–795.
Amason, A. and Sapienza, H. (1997). The effects of top management team size and interac-tion norms on cognitive and affective conflict. Journal of management, 23(4):495.
Audretsch, D. (1995). Innovation and Industry Evolution. MIT Press.
Backes-Gellner, U., Mohnen, A., and Werner, A. (2004). Team Size and Effort in Start-Up-Teams–Another Consequence of Free-Riding and Peer Pressure in Partnerships. SocialScience Research Network.
Beckman, C. (2006). The influence of founding team company affiliations on firm behavior.Academy of Management Journal, 49(4):741–758.
Beckman, C., Burton, M., and O’Reilly, C. (2007). Early teams: The impact of teamdemography on VC financing and going public. Journal of Business Venturing, 22(2):147–173.
Blau, P. (1977). Inequality and heterogeneity. New York: Free Press.
Bradner, E., Mark, G., and Hertel, T. (2003). Effects of team size on participation, awareness,and technology choice in geographically distributed teams. Proceedings of the 36th HawaiiInternational Conference on System Sciences.
Chandler, G. and Hanks, S. (1998). An investigation of new venture teams in emergingbusinesses. Frontiers of entrepreneurship research, pages 318–330.
Chowdhury, S. (2005). Demographic diversity for building an effective entrepreneurial team:is it important? Journal of Business Venturing, 20(6):727–746.
Cliff, J. (1998). Does one size fit all? Exploring the relationship between attitudes towardsgrowth, gender, and business size. Journal of Business Venturing, 13(6):523–542.
Coad, A. (2009). The growth of firms: A survey of theories and empirical evidence. EdwardElgar Publishing.
Colombo, M., Delmastro, M., and Grilli, L. (2004). Entrepreneurs’ human capital and thestart-up size of new technology-based firms. International Journal of Industrial Organi-zation, 22(8-9):1183–1211.
Colombo, M. and Grilli, L. (2005). Founders’ human capital and the growth of newtechnology-based firms: A competence-based view. Research Policy, 34(6):795–816.

REFERENCES 21
Cooper, A. (1985). The role of incubator organizations in the founding of growth-orientedfirms. Journal of Business Venturing, 1(1):75–86.
Cooper, A. and Bruno, A. (1977). Success among high-technology firms. Business Horizons,20(2):16–22.
Cooper, A. and Daily, C. (2000). Entrepreneurial teams. Entrepreneurship, 1997:127–150.
D’Aveni, R. (1990). Top managerial prestige and organizational bankruptcy. OrganizationScience, 1(2):121–142.
Del Monte, A. and Papagni, E. (2003). R&D and the growth of firms: empirical analysis ofa panel of Italian firms* 1. Research policy, 32(6):1003–1014.
Delmar, F. and Shane, S. (2006). Does experience matter? The effect of founding teamexperience on the survival and sales of newly founded ventures. Strategic Organization,4(3):215.
DesRoches, D., Robb, A., and Mulcahy, T. M. (2010). Kauffman Firm Survey (KFS) -Baseline/First/Second/Third/Fourth Follow-Ups: Study Metadata Documentation (April12, 2010).
Du Rietz, A. and Henrekson, M. (2000). Testing the female underperformance hypothesis.Small Business Economics, 14(1):1–10.
Eisenhardt, K. and Schoonhoven, C. (1990). Organizational growth: Linking founding team,strategy, environment, and growth among US semiconductor ventures, 1978-1988. Admin-istrative Science Quarterly, 35(3):504–529.
Feeser, H. and Willard, G. (1990). Founding strategy and performance: A comparison ofhigh and low growth high tech firms. Strategic Management Journal, 11(2):87–98.
Feeser, H. and Willard, G. (2006). Founding strategy and performance: A comparison ofhigh and low growth high tech firms. Strategic Management Journal, 11(2):87–98.
Finkelstein, S. and Hambrick, D. (1990). Top-management-team tenure and organizationaloutcomes: The moderating role of managerial discretion. Administrative Science Quar-terly, 35(3):484–503.
Gimeno, J., Folta, T., Cooper, A., and Woo, C. (1997). Survival of the Fittest? En-trepreneurial Human Capital and the Persistence of Underperforming Firms. Administra-tive Science Quarterly, 42(4).
Gormon, M. and Sahlman, W. (1989). What do venture capitalists do? Journal of BusinessVenturing, pages 231–248.

REFERENCES 22
Haleblian, J. and Finkelstein, S. (1993). Top management team size, CEO dominance,and firm performance: The moderating roles of environmental turbulence and discretion.Academy of Management Journal, 36(4):844–863.
Hambrick, D., Cho, T., and Chen, M. (1996). The influence of top management teamheterogeneity on firms’ competitive moves. Administrative Science Quarterly, 41(4).
Hambrick, D. and D’Aveni, R. (1992). Top team deterioration as part of the downward spiralof large corporate bankruptcies. Management Science, 38(10):1445–1466.
Hambrick, D. and Mason, P. (1984). Upper echelons: The organization as a reflection of itstop managers. Academy of management review, 9(2):193–206.
Hamilton, B., Nickerson, J., and Owan, H. (2003). Team incentives and worker heterogeneity:An empirical analysis of the impact of teams on productivity and participation. Journalof Political Economy, 111(3).
Hsu, D. (2007). Experienced entrepreneurial founders, organizational capital, and venturecapital funding. Research Policy, 36(5):722–741.
Iaquinto, A. and Fredrickson, J. (1998). Top management team agreement about the strate-gic decision process: A test of some of its determinants and consequences. StrategicManagement Journal, 18(1):63–75.
Jackson, S., Brett, J., Sessa, V., Cooper, D., Julin, J., and Peyronnin, K. (1991). Somedifferences make a difference: Individual dissimilarity and group heterogeneity as correlatesof recruitment, promotions, and turnover. Journal of Applied Psychology, 76(5):675–689.
Jones, B. (2009). The burden of knowledge and the death of the renaissance man: Isinnovation getting harder? Review of Economic Studies, 76(1):283–317.
Keeley, R. and Roure, J. (1990). Management, strategy, and industry structure as influenceson the success of new firms: A structural model. Management Science, pages 1256–1267.
Kremer, M. (1993). The O-ring theory of economic development. The Quarterly Journal ofEconomics, 108(3):551–575.
Lazear, E. P. (1998). Personnel Economics for Managers. New York:Wiley.
Liang, P., Rajan, M., and Ray, K. (2008). Optimal team size and monitoring in organizations.Accounting Review, 83(3):789.
Pitcher, P. and Smith, A. (2001). Top management team heterogeneity: Personality, power,and proxies. Organization Science, 12(1):1–18.

REFERENCES 23
Riahi-Belkaoui, A. (2003). Intellectual capital and firm performance of US multinationalfirms. Journal of Intellectual Capital, 4(2):215–226.
Roberts, E. (1991). Entrepreneurs in high technology: Lessons from MIT and beyond. OxfordUniversity Press New York.
Rose, D. (2002). Marginal productivity analysis in teams. Journal of Economic Behaviorand Organization, 48(4):355–363.
Sanders, W. and Carpenter, M. (1998). Internationalization and firm governance: Theroles of CEO compensation, top team composition, and board structure. Academy ofManagement Journal, 41(2):158–178.
Shane, S. and Stuart, T. (2002). Organizational endowments and the performance of uni-versity start-ups. Management Science, 48(1):154–170.
Shrivastava, M. and Rao, T. (2010). Organizational Synergies, Dissonance, and Spinoffs.Available at SSRN, Social Science Research Network.
Smith, N., Smith, V., and Verner, M. (2006). Do women in top management affect firmperformance? A panel study of 2,500 Danish firms. International Journal of Productivityand Performance Management, 55(7):569–593.
Somech, A. (2006). The effects of leadership style and team process on performance andinnovation in functionally heterogeneous teams. Journal of Management, 32(1):132.
Stuart Pier, A. and Robert, W. (1990). Impact of entrepreneurial and management experi-ence on early performance. Journal of Business Venturing, 5(3):151–162.
Teece, D. (1982). Towards an economic theory of the multiproduct firm. Journal of EconomicBehavior & Organization, 3(1):39–63.
Ucbasaran, D., Lockett, A., Wright, M., and Westhead, P. (2003). Entrepreneurial founderteams: Factors associated with member entry and exit. Entrepreneurship Theory andPractice, 28(2):107–128.
Verheul, I. and Thurik, R. (2001). Start-Up Capital:" Does Gender Matter?". Small BusinessEconomics, 16(4):329–346.
Watson, W., Stewart, W., et al. (2003). The effects of human capital, organizational de-mography, and interpersonal processes on venture partner perceptions of firm profit andgrowth. Journal of Business Venturing, 18(2):145–164.
West, M. and Anderson, N. (1996). Innovation in top management teams. Journal of AppliedPsychology, 81(6):680–693.

Figures and Tables 24
Wuchty, S., Jones, B., and Uzzi, B. (2007). The increasing dominance of teams in productionof knowledge. Science, 316(5827):1036.
Zucker, L., Darby, M., and Brewer, M. (1998). Intellectual human capital and the birth ofUS biotechnology enterprises. The American Economic Review, 88(1):290–306.

Figures and Tables 25
Figure 1: Growth (t+1, t) and Teamsize

Figures and Tables 26
Figure 2: Growth (t+2, t) and Teamsize

Figures and Tables 27
Figure 3: Turnover (t+2, t) and Teamsize
Figure 4: Average Turnover (t+2, t) and Teamsize

Figures and Tables 28
Table 1: Summary Statistics
Employment Growth (t+2, t) 3320 .3720365 .765836 -2.876386 4.795791Revenue Growth (t+2, t) 1532 1.008677 1.549933 -6.907755 13.12236Teamsize (All firms) 4876 1.410582 .7266381 1 7Teamsize (Only Teams) 1524 2.313648 .7092282 2 7Log (Employment) 4782 .5542046 .810091 0 5.111988High Tech 4884 .1425061 .3496043 0 1Intel. Property 4884 .2119165 .4087078 0 1Homebased 4878 .5065601 .5000082 0 1R and D 4865 .2141829 .4102965 0 1Avg. Age 4832 44.7265 10.3657 17 87Prop. Female 4878 .2738076 .4037407 0 1Prop. College 4875 .5104249 .4769372 0 1Prop. Some College 4875 .3542271 .4499313 0 1Average Experience 4871 12.35658 10.01321 0 60Avg. Hours Worked 4798 40.63816 23.02989 0 120Avg. Buss. Owned 4871 .9351311 2.228059 0 65Prop. Black 4810 .0842238 .2738091 0 1Prop. Asian 4810 .0407138 .1904053 0 1Age Diversity 4832 .2311859 .8438673 0 12.05645Gender Diversity 4878 .0717277 .173266 0 0.5Education Diversity 4875 .0629023 .1648445 0 0.6666666Racial Diversity 4810 .021405 .100684 0 0.6666666Other Business Diversity 4871 .0652051 .1683166 0 0.6666666Experience Diversity 4871 .0784376 .181213 0 0.6666666Ownership Diversity 4850 .2244824 .3879486 0 1Hours Worked Diversity 4798 .1767544 .3381261 0 1

Figures and Tables 29
Table 2: Team Characteristics and Firm Growth (Employment)
Teamsize 0.288*** 0.285*** 0.262*** 0.317*** 0.418***(0.0589) (0.0591) (0.0592) (0.0579) (0.0968)
Teamsize Square -0.0438*** -0.0437*** -0.0430*** -0.0471*** -0.0632***(0.0113) (0.0114) (0.0117) (0.0110) (0.0150)
Log (Employees) -0.252*** -0.254*** -0.300*** -0.324*** -0.320***(0.0184) (0.0185) (0.0207) (0.0215) (0.0214)
High Tech 0.191*** 0.174*** 0.186*** 0.180***(0.0424) (0.0417) (0.0419) (0.0421)
Intel. Property 0.0345 0.0246 -0.0100 -0.0134(0.0365) (0.0361) (0.0367) (0.0372)
Homebased -0.274*** -0.226*** -0.224***(0.0330) (0.0334) (0.0335)
R and D 0.00724 -0.0305 -0.0239(0.0383) (0.0383) (0.0385)
Avg. Age -0.00953*** -0.00928***(0.00151) (0.00151)
Prop. Female -0.0986*** -0.0894**(0.0364) (0.0373)
Prop. College 0.0776* 0.0794*(0.0443) (0.0452)
Prop. Some College 0.00300 0.00530(0.0462) (0.0463)
Average Experience 0.00592*** 0.00562***(0.00151) (0.00151)
Avg. Hours Worked 0.00386*** 0.00375***(0.000718) (0.000723)
Avg. Buss. Owned 0.00956 0.00967(0.00892) (0.00902)
Prop. Black 0.0761 0.0694(0.0550) (0.0549)
Prop. Asian 0.0638 0.0640(0.0959) (0.0973)
Diversity Measures No No No No Yes(insig)
Constant 0.208*** 0.203*** 0.394*** 0.498*** 0.408***(0.0571) (0.0571) (0.0637) (0.112) (0.129)
Observations 3315 3315 3302 3198 3186R-squared 0.072 0.073 0.103 0.140 0.143F 65.71 43.45 35.39 21.08 14.54
Notes: *Signifies p< 0.05; ** Signifies p<0.01;*** Signifies p<0.001. Standard errors arereported in parentheses. Dependent variable is growth in employment in two years afterstart-up.

Figures and Tables 30
Table 3: Team Characteristics and Firm Growth (Revenue)
Teamsize 0.836*** 0.829*** 0.793*** 1.025***(0.221) (0.223) (0.224) (0.229)
Teamsize Square -0.0860* -0.0856* -0.0829 -0.111**(0.0511) (0.0511) (0.0520) (0.0527)
Log(Revenue 2004) -0.301*** -0.302*** -0.343*** -0.423***(0.0311) (0.0312) (0.0329) (0.0368)
High Tech 0.366*** 0.319*** 0.312***(0.101) (0.101) (0.101)
Intel. Property 0.0463 -0.0149 -0.145(0.111) (0.114) (0.111)
Homebased -0.558*** -0.456***(0.0948) (0.0914)
R and D 0.0341 -0.0548(0.0994) (0.102)
Avg. Age -0.0137***(0.00476)
Prop. Female -0.482***(0.115)
Prop. College 0.365***(0.131)
Prop. Some College 0.0234(0.134)
Average Experience 0.00700(0.00471)
Avg. Hours Worked 0.0148***(0.00233)
Avg. Buss. Owned 0.0136(0.0235)
Prop. Black -0.326*(0.198)
Prop. Asian -0.314(0.225)
Constant 3.190*** 3.190*** 3.940*** 4.338***(0.355) (0.355) (0.407) (0.454)
Observations 1531 1531 1525 1501R-Squared 0.161 0.162 0.187 0.257Observations 1531 1531 1525 1501R-squared 0.161 0.162 0.187 0.257F 40.91 27.34 22.94 14.39
Notes: *Signifies p< 0.05; ** Signifies p<0.01;*** Signifies p<0.001. Standard errors arereported in parentheses. Dependent variable is growth in revenue in two years after start-up.
Figures and Tables 31
Table 4: Exit from Entrepreneurial Teams
Estimates of Logistic Regressionlogit coefs logit mfx logit coefs logit mfx logit coefs logit mfx
Independent Var. Exit Exit Exit Exit Exit Exit(1) (2) (3) (4) (5) (6)
Teamsize 0.718*** 0.135*** 0.706*** 0.126*** 0.540*** 0.0952***(0.155) (0.0296) (0.165) (0.0298) (0.189) (0.0335)
Log (Employees) -0.0429 -0.00809 0.000252 0.0000450 -0.0326 -0.00574(0.101) (0.0190) (0.110) (0.0196) (0.110) (0.0194)
High Tech -0.406* -0.0690** -0.379 -0.0612* -0.325 -0.0525(0.216) (0.0340) (0.233) (0.0347) (0.228) (0.0343)
Intel. Property 0.272 0.0529 0.209 0.0384 0.219 0.0397(0.201) (0.0403) (0.212) (0.0399) (0.213) (0.0398)
Homebased 0.206 0.0389 0.114 0.0204 0.114 0.0202(0.179) (0.0337) (0.190) (0.0338) (0.197) (0.0351)
R and D -0.000414 -0.0000781 0.238 0.0425 0.193 0.0350(0.210) (0.0397) (0.227) (0.0403) (0.228) (0.0427)
Avg. Age -0.00789 -0.00141 -0.00935 -0.00165(0.0104) (0.00186) (0.0109) (0.00191)
Prop. Female -0.542* -0.0968* -0.473 -0.0834(0.316) (0.0561) (0.403) (0.0709)
Prop. College -1.074*** -0.192*** -1.182*** -0.208***(0.318) (0.0568) (0.340) (0.0598)
Prop. Some College -0.295 -0.0527 -0.403 -0.0710(0.357) (0.0638) (0.361) (0.0637)
Average Experience 0.00617 0.00110 0.00394 0.000695(0.0122) (0.00217) (0.0123) (0.00217)
Avg. Hours Worked -0.00933* -0.00167* -0.0102** -0.00181**(0.00504) (0.000897) (0.00517) (0.000910)
Avg. Buss. Owned 0.0216 0.00386 0.0119 0.00209(0.0354) (0.00633) (0.0368) (0.00648)
Prop. Black 0.390 0.0697 0.448 0.0790(0.416) (0.0743) (0.414) (0.0728)
Prop. Asian -0.238 -0.0426 -0.235 -0.0415(0.489) (0.0874) (0.494) (0.0873)
Age Diversity -0.0187 -0.00330(0.0718) (0.0126)
Gender Diversity 0.149 0.0263(0.486) (0.0856)
Education Diversity -0.0916 -0.0161(0.388) (0.0684)
Racial Diversity -0.435 -0.0767(0.602) (0.106)
Other Business Diversity 0.500 0.0880(0.369) (0.0648)
Experience Diversity -0.165 -0.0291continued on next page. . .

Figures and Tables 32
Table 4: (continued)
logit coefs logit mfx logit coefs logit mfx logit coefs logit mfxIndependent Var. Exit Exit Exit Exit Exit Exit
(0.382) (0.0675)Ownership Diversity -0.612** -0.108**
(0.266) (0.0465)Hours Worked Diversity 0.525** 0.0925**
(0.265) (0.0465)Constant -2.835*** -1.495** -0.716
(0.385) (0.660) (0.741)Observations 1047 1047 1019 1019 1008 1008
Notes: *Signifies p< 0.05; ** Signifies p<0.01;*** Signifies p<0.001. Standard errors are reported in paren-theses. Dependent variable is team exit =1 if net change in teamsize over a two year period after start-upis negative.

Figures and Tables 33
Table 5: Entry and Exit in Entrepreneurial Teams
Estimates of Multinomial Logit Regressionmlogit coefs mlogit marginal effects
Independent Var. Exit Entry Exit No Change Entry(1) (2) (3) (4) (5)
Teamsize 0.560*** 0.181 0.101*** -0.102*** 0.00101(0.199) (0.334) (0.0358) (0.0376) (0.00738)
Log (Employees) -0.0286 0.0188 -0.00530 0.00471 0.000590(0.112) (0.193) (0.0201) (0.0205) (0.00436)
High Tech -0.333 -0.177 -0.0547 0.0570 -0.00229(0.230) (0.376) (0.0355) (0.0367) (0.00776)
Intel. Property 0.262 0.491 0.0459 -0.0567 0.0108(0.216) (0.334) (0.0412) (0.0419) (0.00870)
Homebased 0.155 0.407 0.0260 -0.0348 0.00879(0.201) (0.429) (0.0366) (0.0379) (0.0103)
R and D 0.271 0.464 0.0481 -0.0582 0.0101(0.230) (0.351) (0.0445) (0.0453) (0.0102)
Avg. Age -0.00610 0.0395* -0.00133 0.000388 0.000938*(0.0110) (0.0207) (0.00198) (0.00200) (0.000478)
Prop. Female -0.584 -2.618*** -0.0914 0.148** -0.0567**(0.406) (0.998) (0.0735) (0.0750) (0.0257)
Prop. College -1.201*** -0.642 -0.214*** 0.222*** -0.00799(0.341) (0.743) (0.0613) (0.0623) (0.0172)
Prop. Some College -0.410 -0.428 -0.0720 0.0795 -0.00752(0.364) (0.820) (0.0656) (0.0673) (0.0188)
Average Experience 0.00509 -0.000274 0.000926 -0.000891 -0.0000347(0.0125) (0.0208) (0.00225) (0.00229) (0.000471)
Avg. Hours Worked -0.00768 0.0281*** -0.00155 0.000863 0.000687***(0.00530) (0.00846) (0.000955) (0.000963) (0.000215)
Avg. Buss. Owned 0.0224 0.0499 0.00379 -0.00480 0.00102(0.0440) (0.0469) (0.00787) (0.00814) (0.000994)
Prop. Black 0.563 1.621** 0.0930 -0.127 0.0340*(0.423) (0.778) (0.0761) (0.0782) (0.0191)
Prop. Asian -0.256 0.136 -0.0473 0.0427 0.00454(0.498) (0.739) (0.0901) (0.0908) (0.0167)
Age Diversity -0.0220 0.0366 -0.00420 0.00324 0.000961(0.0732) (0.109) (0.0132) (0.0134) (0.00241)
Gender Diversity 0.0707 0.194 0.0117 -0.0158 0.00405(0.491) (1.050) (0.0886) (0.0904) (0.0241)
Education Diversity -0.256 -2.294** -0.0337 0.0848 -0.0511**(0.394) (0.960) (0.0709) (0.0739) (0.0237)
Racial Diversity -0.318 1.088 -0.0638 0.0371 0.0267(0.605) (0.928) (0.109) (0.110) (0.0216)
Other Business Diversity 0.470 -0.0171 0.0854 -0.0824 -0.00302(0.374) (0.737) (0.0671) (0.0688) (0.0167)
Experience Diversity -0.212 -0.430 -0.0362 0.0448 -0.00865continued on next page. . .

Figures and Tables 34
Table 5: (continued)
mlogit coefs mlogit marginal effectsIndependent Var. Exit Entry Exit No Change Entry
(0.389) (0.774) (0.0701) (0.0720) (0.0172)Ownership Diversity -0.739*** -1.599*** -0.125*** 0.158*** -0.0325***
(0.270) (0.529) (0.0484) (0.0496) (0.0125)Hours Worked Diversity 0.528** 0.290 0.0943** -0.0980** 0.00368
(0.267) (0.544) (0.0479) (0.0494) (0.0122)Constant -0.789 -4.419***
(0.766) (1.461)Observations 1008 1008 1008 1008 1008
Notes: *Signifies p< 0.05; ** Signifies p<0.01;*** Signifies p<0.001. Standard errors are reported in paren-theses. Dependent variable is discrete and 1 if teamturnover is less than 0, 2 if teamturnover is equal to 0,and 3 if teamturnover is greater than 0.


![Entrepreneurial Exits and Innovation - INSEADfaculty.insead.edu/vikas-aggarwal/documents/[3] Aggarwal, Hsu (2014... · Entrepreneurial Exits and Innovation Vikas A. Aggarwal ... and](https://static.fdocuments.in/doc/165x107/5a9f222e7f8b9a71178c5b59/entrepreneurial-exits-and-innovation-3-aggarwal-hsu-2014entrepreneurial.jpg)