EnTrEPrEnEuriAl FAmiliES - - Alexandria paged_en_low... · 4 Entrepreneurial Families FOrEWOrD BY...
40
Philipp Sieger and Thomas Zellweger in cooperation with Credit Suisse AG From a Family Enterprise to an Entrepreneurial Family Transgenerational Value Creation in Entrepreneurial Families ENTREPRENEURIAL FAMILIES
Transcript of EnTrEPrEnEuriAl FAmiliES - - Alexandria paged_en_low... · 4 Entrepreneurial Families FOrEWOrD BY...

Philipp Sieger and Thomas Zellweger in cooperation with Credit Suisse AG
From a Family Enterprise to an Entrepreneurial FamilyTransgenerational Value Creation in Entrepreneurial Families
EnTrEPrEnEuriAl FAmiliES

2 Entrepreneurial Families

Entrepreneurial Families 3
FOrEWOrD BY THE AuTHOrS
How do family firms succeed from generation to generation? While this is likely the most important question for the members of a family business, little is known about the central success factors in creating value across the generations. For this reason, our study aims to explore the secrets of family firms with a long, successful track record and to expand the current state of knowledge. in so doing, we want to look not only at «the family firm» but also broaden our scope to the entire entrepreneurial family behind the company. This is our contribution to a greater understanding of transgenerational value creation in entrepreneurial families, which we hope will in turn benefit a range of stakeholders.
We wish to extend a special thanks to those members of entrepreneurial families who spent some of their valuable time to answer our survey and/or participate in a follow-up interview. Because these persons have made a unique contribution, we are dedicating this study to them.
We hope you will enjoy reading it.
Prof. Philipp Sieger Prof. Thomas Zellwegerr AAssistant Professor of Family Business Family Business Chair
Center for Family Business, university of St. Gallen (CFB-HSG)

4 Entrepreneurial Families
FOrEWOrD BY THE PuBliSHEr
Family firms operate under special conditions. On the one hand, they have close links to their family and social networks consisting of common roots, interdependence, and personal reputation. On the other, like all market participants, they are subject to challenging economic conditions and increasing regulation. Flexibility and strength are needed to strike the balance between tradition and current requirements.
Behind every family firm is an entrepreneurial family, devoted to common professional goals over several generations. A family business begins with a pioneering spirit and the next great idea for an innovative product.
But what makes entrepreneurial families successful in the long term? Experience tells us that entrepre-neurial families are particularly resistant during periods of economic difficulty. We feel that there are various reasons for this: First, the management of a family firm is responsible not only for the company, but for the family. Second, the employees often identify more strongly with these companies. Third, spe-cial attention is usually paid to entrepreneurial potential, financial assets, and personal values. A single family office can be an additional success factor for entrepreneurial families as it helps properly manage a generational transfer.
Credit Suisse has assisted family firms and entrepreneurial families for many generations and many years. Since our bank was founded more than 150 years ago, we have been firmly committed to the tradition of innovation. As a strategic partner, we support entrepreneurial families with all the expertise that a global bank with Swiss roots has to offer. We assist with long-term orientation and the process of creating new from old. in so doing, we ensure that change is implemented exclusively in the realm of calculable risk.
We hope you enjoy this very informative publication.
Yours sincerely
Rolf Bögli Christoph BrunnerHead of Premium Clients Switzerland Head of Private & Wealth & Global External Asset managers management Clients SwitzerlandCredit Suisse AG Credit Suisse AG

Entrepreneurial Families 5

6 Entrepreneurial Families
ExECuTiVE SummArY
This study explores how family firms can flourish from generation to generation. We have selected a new approach to investigating the success factors. First, we look not only at the family firms themselves but also at the entrepreneurial families behind them. Second, we specifically focus on the transgenerational creation of financial and non-financial assets. We examine four central, interrelated success factors in detail.
First, we will discuss the entrepreneurial orientation of the family and of the largest company. They form the basis for all business activities at a family and corporate level. Here we see that from generation to genera-tion, successful entrepreneurial families endeavor to make new from old with a long-term focus while seek-ing innovation and change with a calculable risk. At company level, we have also identified conscientious, innovative business practices with an acceptable level of risk.
From there, we look at entrepreneurship beyond “the” family firm and analyze all business activities of the entire entrepreneurial family. We have determined that these families possess a great deal of entrepreneur-ial energy. We also consider the strategic establishment of a company portfolio with a long-term focus to be a very promising success strategy. The current generation of family business owners in particular is very successful.
The family’s financial resources generated by these entrepreneurial activities are the next success factor for transgenerational value creation. managing and passing on these financial assets pose a major challenge. Our study shows that entrepreneurial families with lasting success but with little love for experimentation rely on a balanced diversification strategy – as reflected by the actions of the companies concerned.
One option for discreetly managing the financial assets generated and passing them on to the next genera-tion is a single family office (SFO). The SFO can also perform important governance functions and help create non-financial assets. We see that the selection of core activities, make-or-buy decisions, internal governance, and the inclusion of family members pose the main challenges.
Overall, this study has allowed us to create a comprehensive picture of transgenerational value creation while deriving key findings and potential actions for various stakeholders.

Entrepreneurial Families 7
ABOuT THE AuTHOrS
Prof. Philipp Sieger
Philipp Sieger is Assistant Professor of Family Business at the Center for Family Busi-ness, university of St. Gallen (CFB-HSG). He earned his doctorate in 2011 at the university of St. Gallen. His research, teaching, and executive education activities focus on long-term success, succession, and entrepreneurship within the family firm context.
Prof. Thomas Zellweger
Thomas Zellweger holds the chair for family business at the university of St. Gallen. He is also managing director of the university’s Center for Family Business (CFB-HSG). Thomas Zellweger earned his doctorate at the university of St. Gallen and was a visiting professor at Babson College in massachusetts (uS) and the university of British Colum-bia (Canada). He is also a permanent visiting professor at the university of Witten/Herdecke, Germany. His research interests include strategic entrepreneurship, succes-sion in family firms, and entrepreneurial finance.
Contact: [email protected], [email protected]
When quoting:Sieger, P. and Zellweger, T. (2012). From a Family Enterprise to an Entrepreneurial Family. Credit Suisse AG.


Entrepreneurial Families 9
COnTEnTS
1 Introduction 10
1.1 multi-Generational Value Creation 101.2 Family Firms, Entrepreneurial Families, and Central Success Factors 101.3 Aim and method of the Study 11
2 The Study 12
2.1 About the Companies 122.2 About the respondents 132.3 About the Entrepreneurial Families 14
3 Influential Factors of Transgenerational Value Creation 15
3.1 Entrepreneurial Orientation of the Family and of the Company 15 3.1.1 Entrepreneurial Orientation of the Family 15 3.1.2 Family Connection with the Company 16 3.1.3 Entrepreneurial Orientation of the Company 17 3.1.4 influence on Transgenerational Value Creation 18
3.2 Entrepreneurship beyond “the” Family Firm 19 3.2.1 Entrepreneurial Activities of the Entrepreneurial Families 19 3.2.2 The largest Company vs. the Portfolio of All Companies 20 3.2.3 Creating Value with the Current Entrepreneurial Generation 21 3.2.4 The Future Entrepreneurial Generation 22
3.3 Financial resources of the Family 22 3.3.1 Financial relationships between Family and Company 22 3.3.2 management of the Family’s Private Assets 23 3.3.3 investment Strategy and Expected returns 24 3.3.4 Geographic Allocation of Private Assets 25 3.3.5 invested Asset Classes 26
3.4 Single Family Offices 26 3.4.1 Which Companies Have a Single Family Office? 26 3.4.2 main Characteristics of a Single Family Office 27 3.4.3 Core Tasks and Partnerships in the Single Family Offices 27 3.4.4 Advantages and Disadvantages of Single Family Offices 29 3.4.5 Governance in the Single Family Office 31 3.4.6 involvement of the Family and Other Employees in the Single Family Office 32 3.4.7 Potential Founders of Single Family Offices 34 3.4.8 Excursus on the multi-Family Office (mFO) 35
4 A Model: How Do Entrepreneurial Families Create Value from Generation to Generation? 36
5 Conclusions and Recommended Courses of Action 37
6 Sources 39

10 Entrepreneurial Families
1.1 multi-Generational Value Creation
1 inTrODuCTiOn
The economic and social importance of family firms is globally recognized and is quite rightly the subject of extensive discus-sion. With this in mind, it is therefore essential for family com-panies to succeed and create value not only now, but for gen-erations to come. However, discussions on this topic tend toward oversimplification. in many cases, “the family firm” takes center stage, and as far as the long-term focus is concerned, discussion is often limited to the topic of succession planning.
As explained in more detail below, this study takes a broader view. First, we look not only at the family firms themselves but also at the entrepreneurial families behind them. Second, we focus on transgenerational value creation, i.e. the processes used by entrepreneurial families to develop a business-oriented attitude, unique resources, and skills in order to create financial and non-financial assets over the long term. This concept of family firms is based on the concept of transgenerational entre-preneurship (see Zellweger, nason, & nordqvist, 2012).
1.2 Family Firms, Entrepreneurial Families, and Central Success Factors
it is extremely fascinating to look at the unique organizational form of a family firm. However, a static picture of a family firm is much too narrow for us to understand the long-term success of its owner1. This realization is based on three observations.
First, it is well worth looking at the entire entrepreneurial fam-ily because it includes the key players (owner, supervisory board members, and/or managers), whose goals, desires, and preferences have a major influence on their company’s strat-egy and, as a result, its success.
Second, focusing on “the” company is insufficient because it implies that entrepreneurial families own only that company. it also implies that their first priority is to ensure that company’s survival. However, initial studies show that the long-term suc-cess of entrepreneurial families is based on establishing more
than one company, and requires a greater openness to change and entrepreneurial activity (Sieger, Zellweger, nason, & Clin-ton, 2011; Zellweger et al., 2012; Zellweger & Sieger, 2011).
lastly, a static view of the company can be misleading, as suc-cess generally does not follow a linear development pattern. Companies grow, consolidate, innovate, and increase their efficiency on a cyclical basis. A mere snapshot, therefore, can be erroneous, as it implies success or failure while neglecting the long-term success of these measures.
Therefore, to understand the big picture of value creation in a family firm context, analysis at the entrepreneurial family level is essential. in this study we will look at four central and related, but not yet thoroughly researched, elements of long-term success for entrepreneurial families:
1 in the absence of a gender-neutral alternative, this study will use the masculine form for purposes of simplification.

Entrepreneurial Families 11
1. The entrepreneurial orientation of the entrepreneurial family and of the largest company: Entrepreneurial skills and the family’s willingness to apply them are a general pre-requisite for entrepreneurial activities and a special prerequi-site for entrepreneurial companies.
2. Entrepreneurship beyond “the” family firm: Here we will examine the role of the entire entrepreneurial family as the driving force of entrepreneurial activities from generation to generation. How many companies are and were owned? How many were founded, bought, and sold?
3. Financial resources of the entrepreneurial family: Successful entrepreneurial activities generate not only emotional and social value, but financial value in particular. it is very important for these values to not only be created but also to be managed and passed on to the next generation.
4. Single family offices (SFO): An SFO offers successful en-trepreneurial families the opportunity to manage their assets independently and discreetly, to create additional financial value, and to pass them on to future generations. Family-related governance issues such as successorship can also be delegated to the SFO. in this way, an SFO contributes to transgenerational value creation, as well as because its busi-ness investments can indirectly influence the family’s respec-tive attitude.
We will explore these four drivers of transgenerational success among entrepreneurial families in the next chapters.
1.3 Aim and method of the Study
The study’s primary goal is to better understand transgenera-tional value creation in entrepreneurial families based on the aforementioned success factors. From there, we derive find-ings and recommended courses of action for entrepreneurial families and other stakeholders.
To this end, in the spring of 2012 we conducted an online survey of entrepreneurial families in German-speaking Europe. Then we interviewed selected persons involved in an SFO. These include, for instance, the member of an entrepreneurial family who is manager of his own SFO, a principal with no operational involvement in the SFO, and a non-family member who is a manager of an SFO. The study is based primarily on the survey results. The SFO section also includes numerous quotes from our interviews.

12 Entrepreneurial Families
2 THE STuDY
Our target group is entrepreneurial families from Switzerland, Germany, and Austria who have run successful businesses over several generations. in order to obtain information about these entrepreneurial families, we first identified companies meeting certain criteria. For instance, at least 25% of the equity had to be held by a single family and the company had to have at least Eur 80 million in revenues. This provided us with enough families who in fact have created significant value from generation to generation.
Our specially developed questionnaire was entered into a sur-vey software program; then an email invitation was sent to a total of 6,781 company owners in the three countries. in all, we received 342 completed questionnaires, giving a response rate of 5.04%. Given the unique nature of the target group, we feel this rate is satisfactory.
2.1 About the Companies
Table 1 shows the main characteristics of the companies in our sample.
By sector, 41.2% of the companies are from manufacturing or industry, followed by retail or wholesale (16.4%), general ser-vices (15.7%), and the construction/finishing and engineering trades (15.7%). Of the companies, 42.5% are between 51 and 100 years old; in all, nearly 75% of companies are more than 50 years old (see Figure 1). The average age of 86.6 years equates to transgenerational activities for three to four generations.
2 The median indicates that 50% of responses were above or below this figure.3 information from Swiss companies (in CHF) was converted to Eur.
Of the companies, 68.9% employ more than 250 people, and exactly one-third have more than 1,000 employees (see Fig-ure 2). An analysis of revenue distribution shows that 58.3% of the companies in our sample had revenues of more than Eur 100 million (see Figure 3). As shown in Table 1, the aver-age figure is Eur 515.14 million and the median is Eur 130 million.
Overall, we communicated with entrepreneurial families who own very large, old companies. Thus, our context is companies that have created on average (a very large amount of) value for more than three generations.
Figure 1: Company Age Categories
1.97.7
16.042.5
25.25.4
1.3
0 to 10 years
0 5 10 15 20 25 30 35 40 45
11 to 30 years31 to 50 years
51 to 100 years101 to 150 years151 to 250 years
Over 250 years
% of all companies
Table 1: Company Age and Size
Average Range Median 2
Age of company 86.6 years 3 to 482 years 78.5 years
Size (number of employees) 2,307 1 – 60,000 545
revenues in millions of Eur 3 515.14 0.83 – 15,000 (15 billion) 130

Entrepreneurial Families 13
Figure 2: Number of Employees by Size Figure 3: Company Revenue Categories
Of particular interest here is the extent to which the financial health of the entrepreneurs depends on the company’s perfor-mance. As shown in Figure 4, the performance-based salary component is more than 50% for 19.1% of the respondents.
Figure 4: Proportion of Variable Compensation in Groups, as % of All Owners
27.4
12.6
18.2
22.7
14.6
4.5
0 percent
1–10 percent
11–30 percent
31–50 percent
51–99 percent
100 percent
0 5 10 15 20 25 30
% of all owners
Table 2: Demographic Information and Involvement of Those Surveyed in the Company
Dimension Distribution or Average
is this person the founder? Yes for 9.8%
Age of person Between 24 and 77 years, 52 years on average
Gender 14.5% female
member of the owning family? Yes for 90.2%
level of education nearly 61% with a university education and/or doctorate
Hours worked per week 47.2 hours
Part of management? Yes for 76.9%
Supervisory function? Yes for 71.1%
Specific position 41% supervisory function, 36% CEO, 12% head of business unit, 5% CFO, 2.6% middle management,
rest = other
Performance-based compensation 31.3% of total salary
Personal equity 39.3%
2.2 About the respondents
Table 2 shows the main characteristics of the entrepreneurs in our sample along with their involvement in the company as regards ownership, management, and supervision.
<100 employees
101–250 employees
251–500 employees
501–1,000 employees
>1,000 employees
% of all responses
14.4
16.7
18.316.9
33.7
% of all responses
1–50 million
51–100 million
101–250 million
251–500 million
501–1 billion
> 1 billion
25.7
16.0
30.6
15.1
5.86.8

14 Entrepreneurial Families
Table 3: The Entrepreneurial Families behind the Firms
Area Distribution or Average
Family members employed with the company 2.75 on average, 2 as the median
Equity held by the family 87% on average, in 69% of the cases 100%, for 87.5% more than 50%
number of family shareholders Average 5.6; median 3
Generation that owns the company Average 3.02; in 75.8% of the cases 2nd to 4th generation
2.3 About the Entrepreneurial Families
next, we will look at the influence and composition of the families behind the companies described above in greater detail (see Table 3).
The family influence on the company can be divided into three main areas of ownership, supervision, and management. The figure below shows an overview of the number of companies in which the family plays a major role in these three areas. This means it holds the majority equity share or forms the majority of the supervisory or management committees.
in 25.4% of all companies for which this information is avail-able, the family has a dominant position in all three areas.
The average owning family in our sample thus represents the third generation, consists of nearly six family shareholders, holds the majority of the company’s equity and, in most cases, also dominates the company’s supervisory body. it is also usu-ally involved in the company’s operations, although manage-ment is dominated only in about one-third of the cases. As a result, this study examines the classic long-term, heavily involved entrepreneurial family.
Figure 6: Family Influence on Ownership, Supervision, and Management
Figure 5: Personal Equity Share in Company, as % of All Owners
per GroupThere is also a high dependency with regard to ownership, as the respondents in nearly 60% of all cases hold more than 25% of equity; dividends therefore have a high level of influ-ence on the entrepreneurs’ personal finances (Figure 5).
Thus, the respondents to our survey are precisely this target group: operationally active owners in management positions for large family firms. On average, these people are middle-aged, very well educated, and members of a later generation of the owning family. Thus, they can be considered credible sources of knowledge with regard to the aspects examined by this study.
up to 10%
11–25%
26–50%
51–75%
76–100%
% of all owners
19.1
21.6
33.2
11.0
15.1
33.3
54
87.5
Management dominated by family members
Supervision dominated by family members
Majority of equity held by the family
% of all companies
0 10 20 30 40 50 60 70 80 90 100

Entrepreneurial Families 15
3.1 Entrepreneurial Orientation of the Family and of the Company
3 inFluEnTiAl FACTOrS OF TrAnSGEnErATiOnAl VAluE CrEATiOn
3.1.1 Entrepreneurial Orientation of the Family
First, our sample looks at the level of entrepreneurship in the entrepreneurial families. For this purpose, we are using the newly launched “family entrepreneurial orientation (FEO)” concept. it describes the attitude and frame of mind of these families with regard to entrepreneurial activities (see also Zell-weger et al., 2012). We provided the entrepreneurs with a total of 11 pairs of opposing answers and asked them which of the two options the family preferred 4. The following figure shows the average responses to the 11 pairs of answers for the entire sample.
The families generally have a balanced position in terms of stability vs. growth, innovative focus, and the desire to expand. Therefore, they prefer a modest, calculable risk and usually take the available funds and resources into account. They do not hesitate to delegate tasks to third parties, and they take an approach characterized by an openness to change and a pio-neering spirit.
Figure 7: Average Responses to FEO Answer Pairs
Expects individuals and teams to obtain permission before pursuing projects.
Our family ... Our family ...
Allows individuals and teams to pursue projects on their own initiative.
Tends to grow using a formal strategy. Tends to grow using an informal strategy.
Values stability and continuity. Values growth and expansion.
Prefers a strong focus on existing internal processes (management, technology, production).
Prefers a strong focus on new internal processes (management, technology, production).
Is rarely a pioneer in introducing new products, services, and technologies.
Is often a pioneer in introducing new products, services, and technologies.
Always considers the currently available resources when pursuing opportunities.
Pursues opportunities without considering which resources are currently available.
Prefers low-risk projects with normal, stable returns.Prefers high-risk projects with very high potential returns.
Is very dependent on external relationships in order to advance the company.
Is not at all dependent on external relationships in order to advance the company.
Resists change. Is open to change.
Primarily has the welfare of the current generation of owners in mind when making decisions.
Primarily has the welfare of the future generation of owners in mind when making decisions.
Strives to maintain existing lines of business. Strives to tap new lines of business.
2 2.5 3 3.5 4 4.5 5 5.5 6
4.3
4.7
5.8
4.9
3.5
3.0
5.1
4.3
4.1
3.7
5.4
4 Option A has a value of 1, Option B has a value of 7.

16 Entrepreneurial Families
This reflects the efforts to develop new, innovative ideas from existing ones over the long term. in other words, innovation and change should be achieved where possible by taking risks that are calculable and using existing resources. Balancing these aspects is to be considered a central success factor. The entrepreneurial families with a long, successful track record do not consistently pick a “side” among the available options. rather, they see value in maintaining opposing aspects and seeking the middle ground (see, for instance, the aspects of stability vs. growth). To simplify the interpretation, we have consolidated the above 11 aspects into a few dimensions (see Table 4).5
Table 4: Dimensions of FEO and Aspects Thereof
Dimensions of Family
Entrepreneurial Orientation
(FEO)
Aspects
1. risk appetite and courage Focus on diversification
risk appetite
minimal resource focus
2. innovation and change Openness to change
Proactive behavior
innovative orientation
3. Entrepreneurial growth Growth orientation
informal strategy
internal autonomy
4. long-term independence Transgenerational thought
External autonomy
The entrepreneurial families therefore think in the dimensions of growth, innovation, and risk appetite. At the same time, they preserve their independence. As shown in Figure 8, the factors of “innovation and change” along with “long-term indepen-dence” are weighted the heaviest; “risk appetite and courage” are weighted the lowest, which corresponds to the above
Figure 8: Expressions of the Four FEO Factors
5 For this purpose, we have assigned a general term for each answer pair (such as “risk appetite”) and conducted a factor analysis with the data collected. We identified four primary underlying factors. Based on the respective content, we can now assign terms to them.
interpretation. The absolute values are not very high (on a scale of 1 to 7). Therefore, we can say that the focus is not on maximizing single goals, but to follow a balanced strategy in which innovation, independence, and growth are pursued at the same time.
3.1.2 Family Connection with the Company
The emotional relationship between the entrepreneurial family and the company is a critical aspect. We refer here to the concept of “socio-emotional value” (Gomez-mejia, Haynes, nunez-nickel, Jacobson, & moyano-Fuentes, 2007; Zellwe-ger et al., 2012). This denotes the non-financial aspects of corporate ownership, which satisfy the entrepreneurial family’s emotional needs. This includes exercising long-term control, social relationships with family members, image, and reputa-tion, alongside an emotional attachment to the company. These factors are decisive for long-term success.
We see that, in particular, emotional attachment and identity considerations are very important. interestingly, the direct desire for long-term control is somewhat weaker. This shows that the families are not insistent upon exercising control over the company; first and foremost, they value a strong emo-tional connection and identification with the company alongside high-quality relationships.
3.6
4.4
4.8
5.1
Risk appetite and courage
Entrepreneurial growth
Long-term independence
Innovation and change
Preference (7 = very strong)
0 1 2 3 4 5 6

Entrepreneurial Families 17
Figure 9: Emotional Dimensions of Company Ownership and Their Characteristics
4.2
5.0
6.0
6.1
Long-term control
Social relationships
Image and reputation
Emotional connection
7 = very important
0 1 2 3 4 5 6 7
3.1.3 Entrepreneurial Orientation of the Company
We expect the entrepreneurial orientation of the entrepreneur-ial family to be directly reflected in the company it controls. To investigate this issue, we analyzed the entrepreneurial orienta-tion (EO) of the main company using another set of answer pairs. The figure below shows which options the companies in our sample prefer according to their owners’ statements.
The companies maintain a well-planned balance between cau-tion and risk, while also placing a great deal of value on research and innovation. They do not necessarily pursue the goal of being proactive “first movers.” Additionally, they gener-ally avoid competitive conflicts and direct confrontation with competitors. The aforementioned identity considerations of the family may also play a role since entrepreneurial families gen-erally do not wish to be perceived as aggressive.
Figure 10: Entrepreneurial Orientation of the Companies
To carefully “wait and see”
In general, the company’s overall preference is ... In general, the company’s overall preference is ...
To be daring and aggressive
To carry out low-risk projects with guaranteed, moderate returnsTo carry out projects with uncertain, but possibly very high returns
To sell established products To do research and be a technological leader
To respond to actions taken by competitors To initiate actions that competitors respond to
To avoid competitive conflicts To have a competitive “beat the competition” attitude
To see incremental changes in products/services To see significant changes in products/services
1 2 3 4 5 6 7
4.32
3.39
4.34
5.16
4.45
4.18
As expected, this careful and conscientious innovative busi-ness style with calculable risks harmonizes with the families’ entrepreneurial orientation. Thus, the families do indeed appear to be capable of transferring their entrepreneurial ori-entation directly to the company. The relationship identified between FEO and EO is shown in Figure 11.
Figure 11: Relationship between FEO and EO
00 2 4 6 8
1
2
3
4
5
6
7
8
FEO: Entrepreneurial orientation of the family
EO: Entrepreneurial orientation of the company

18 Entrepreneurial Families
3.1.4 Influence on Transgenerational Value Creation
First, let us look at how the above-mentioned emotional dimensions of company ownership relate to the company’s performance:
6 We asked the entrepreneurs how they would rate their company’s performance over the last three years compared with the competition (from 1 = worse to 7 = better). Various performance dimensions (such as sales growth) were examined for this purpose. A separate analysis that we conducted with objective figures available for part of the sample shows that we can rely on the entrepreneurs’ subjective assessments.
7 To simplify the presentation, we did not include some of the extreme values in the charts. However, the linear trend line is identical, so the core statement remains the same.
Figure 12: Emotional Connection and Performance
of the Company
As Figure 12 shows, the strength of the entrepreneurial fam-ily’s emotional ties to the company does not contradict the subjective perception of the company’s performance.6 How-ever, we feel a restriction is appropriate as we cannot rule out a converse correlation: in other words, greater performance could result in stronger emotional ties.
next, we wish to explore whether both the family entrepre-neurial orientation (FEO) and the company entrepreneurial orientation (EO) benefit the company’s performance. However, we do not wish to look only at current performance. We are mainly interested in how companies grow older and larger simultaneously. This is a suitable measure of transgenerational value creation.
To achieve this, we multiply the figures for company age and size (measured in annual revenues). We compare this figure with the FEO and the EO. As shown in Figure 13, we can confirm a positive relationship in both cases. This reinforces our opinion that both FEO and EO are key drivers of transgen-erational value creation.7
Figure 13: FEO and EO as Drivers of Transgenerational Value Creation
2 3 4 5 6 7-1
-0.8
-0.6
-0.4
-0.2
0
0.2
0.4
0.6
0.8
1
2 3 4 5 6 7
Company entrepreneurial orientation (EO)
EO: Company’s entrepreneurial orientation
-1
-0.8
-0.6
-0.4
-0.2
0
0.2
0.4
0.6
0.8
1
Family entrepreneurial orientation (FEO)
FEO: Family’sentrepreneurial orientation (FEO)
Company age x Company size Company age x Company size
0
1
2
3
4
5
6
7
8
Emotional connection
Financial performance
0 2 4 6 8

Entrepreneurial Families 19
Successful entrepreneurial families attempt to create new ideas from existing ones over the long term. They seek innovation and change with calculable risk. Balancing the resulting opposing factors is a central success factor. We see a similar pattern at the company level: conscientious, innovative business practices with an acceptable level of risk. We have identified a positive correlation between FEO, EO, and the emotional connection of the family to the company and long-term company performance. in particular, it is clear that an emotional connection and financial success are not mutually exclusive.
iin this section, we will move our focus away from the largest company in an entrepreneurial family in favor of all of their entrepreneurial activities. in so doing, we will look not only at
To avoid different interpretations, the “entrepreneurial family” was defined in the survey as “extended family” including par-ents, siblings, aunts, and uncles. We see that the entrepre-neurial families have a strong business focus: On average, they are invested in nearly ten companies (with at least 10% of equity). These companies are active in an average of 2.67 different sectors in 2.04 countries.
the present, but also the corporate history of these entrepre-neurial families. This allows us to take a holistic view of trans-generational entrepreneurial activities.
in the history of the entrepreneurial families, more than seven companies were founded or purchased, and more than two were discontinued or sold (see Figure 14). Here it can be said that, when we look at the entrepreneurial family (and not just at the largest or best-known company), we see a great deal of entrepreneurial activity. Entrepreneurial families are generally not limited to one company, but rather have a dynamic portfo-lio of companies.
3.2.1 Entrepreneurial Activities of the Entrepreneurial Families
3.2 Entrepreneurship beyond “the” Family Firm
Figure 14: The Entrepreneurial Families and their Holdings
Figure 15: Number of Companies Owned as % of All
Entrepreneurial FamiliesTo get an even better picture of this impressive phenomenon, let us look at the number of currently held companies in detail. We see that only about one-third of the entrepreneurial fami-lies own just one company, and more than half report owning three to ten companies. This highlights the significance of entrepreneurial families as the driving force of entrepreneurial activities for over several generations.
now let us take a closer look at the number of companies that were discontinued/sold, bought and founded in the history of the entrepreneurial families.
2.2
7.4
7.6
9.8
0 2 4 6 8 10 12
Companies discontinued (historic)
Companies purchased (historic)
Companies founded (historic)
Holdings (current)
Number of companies
1 company
2 companies
3–5 companies
6–10 companies
> 10 companies
37.1
12.4
29.9
10.8
9.8
% of all entrepreneurial families

20 Entrepreneurial Families
Figure 17: Emotional Connection vs. Size of Company Portfolio
Figure 16: Detailed History of the Entrepreneurial Families As Figure 16 shows, 30% of the entrepreneurial families have purchased two to four companies over time. moreover, nearly 30% of the entrepreneurial families founded five to ten com-panies. less than one-fourth of the families have never pur-chased another company, and only around 46% of all families have never discontinued or sold a company. Here we see an impressive corporate strategy aligned to incorporation, acquisi-tion, maintenance and advancement. more companies are founded and bought than are discontinued. This indicates long-term portfolio expansion through a “buy and build” strat-egy, fostered by emotional connections to existing companies.
Although we can identify a certain amount of hesitation in dis-continuing and selling companies, it is important to note that neither discontinuing nor selling a company necessarily indi-cates a business failure. rather, a decision of this kind can be part of a very entrepreneurial and successful overall strategy with a long-term focus.
We also want to take a closer look at the relationship between the strength of the emotional connection and the size of the company portfolio (Figure 17). Here, too, there is a positive correlation.8 Thus, it is not true that a family’s emotional con-nection is limited to just one company; portfolio activities and emotional connections are not mutually exclusive.
8 To simplify the presentation, we did not include some of the extreme values in this chart. However, the linear trend line is identical, so the core statement remains the same.
Even if our entrepreneurial families conduct impressive portfo-lio activities, it is worth looking at the largest company and its significance in greater detail. For those families that own more than one company, the largest company generates an average of 64% of total revenues in the corporate portfolio. However, as Figure 18 shows more precisely, the revenue share of the largest company is less than 50% in 30% of the cases.
On the one hand, this shows the expected relatively dominant role of the largest and generally oldest company. On the other, we see once again that entrepreneurial activities must be viewed at the entrepreneurial family level.
We can identify a possible long-term strategy of success here: While there is usually a large, established company (a “super-tanker,” so to speak), this is often supplemented by a number of smaller, younger companies in the portfolio (the “speed-boats”). These often have a more dynamic and entrepreneurial orientation. This allows for diversification of overall risk while maintaining the long-standing primary company and focusing on new opportunities.
3.2.2 The Largest Company vs. the Portfolio of All Companies
Figure 18: Share of the Largest Company in the Portfolio’s Total Revenues
7.9
25.7
23.8
0 5 10 15 20 25 30 35 40 45
42.6
0–20%
21–50%
51–75%
75–100%
Number of responses in %
0
5
10
15
20
25
30
35
40
0 1 3 52 4 6 7Emotional connection with the companies (7 = very strong)
Number of companies owned by the family
0 companies
1 company
2–4 companies
5–10 companies
> 10 companies
12.4
24.3
45.7
14.7
18.5
19.1
35.0
30.0
23.6
27.2
19.7
9.3
10.7
7.5
2.3
0% 20% 40% 60% 80% 100%
Founded
Purchased
Discontinued/sold

Entrepreneurial Families 21
The impressive entrepreneurial activities of the entrepreneurial families from generation to generation lead us to ask about the contribution made by the current generation of owners to value creation. To put it in extreme terms: Are the current generation of owners “mere heirs” or an active, successful generation of entrepreneurs? To find out, we asked what proportion of liquid private assets owned by the entire owning family (as defined above) was created by the current generation. As Figure 19 shows, in more than 50% of the cases, more than half of the total assets were generated by the current generation of own-ers (the average is 59.86%). This underscores the success of this generation.
To illustrate the relationship between the current generation’s contribution and entrepreneurial activity, Figure 20 shows the share of the largest company in the total portfolio revenues versus the value generated as discussed above.
We can see that the less significant the primary company is to the overall portfolio, the more assets the current generation has created. in other words, successful generations of entre-preneurs are characterized by strong portfolio activities. This highlights the importance of establishing successful compa-nies alongside the parent company for value creation in entre-preneurial families.
Even if the average rates of value creation are very high in the current generation, there are some cases with lower values. To explore the differences between very successful companies and “mere heirs” in more detail, we distinguish among two groups: the “active entrepreneurs” (> 70% value created by the current generation) and the “mere heirs” (< 30% value created). notably, we did not see any major differences between EO and FEO (the company’s entrepreneurial orienta-tion and the family’s). However, we see that the expected returns on the capital invested in the company differ greatly – 10.88% for the active entrepreneurs and 7.36% for mere heirs. This could indicate a “retirement fund mentality” among the mere heirs, which might have a negative impact on the company’s long-term development.
3.2.3 Creating Value with the Current Entrepreneurial Generation
Figure 19: Proportion of Private Assets Created by the Current
Generation
Figure 20: The Significance of the Largest Company vs. Value
Creation by the Current Generation
0–10%
11–25%
26–50%
51–75%
76–100%
11.4
9.2
25.1
14.9
39.4
% of all entrepreneurial families
0
0 60 8020 40 100
20
40
60
80
100
Share of the largest company in total revenues (%)
Value creation by current generation (%)

22 Entrepreneurial Families
Transgenerational entrepreneurship as described above means that members of the next generation must also make a contri-bution to the company. Therefore, it is worth looking at the youngest generation of entrepreneurial families and any regu-lations regarding joining the company. The entrepreneurial families in our sample comprise an average of 10.9 members; 5.4 are from the youngest generation. Succession seems to be a critical topic, since the oldest member of the youngest generation is an average of 29 years old.
3.2.4 The Future Entrepreneurial Generation
Figure 21: Joining Requirements for the Next Generation
Observing the entire entrepreneurial family offers interesting viewpoints and shows a new, impressive picture of entrepreneurial families’ entrepreneurial energy. The long-term, strategic establishment of a portfolio of companies, possibly with different risk profiles, is a general success factor among our entrepreneurial families. We note that the current generation of entrepreneurs is characterized by successful entrepreneurial thinking and action.
The financial resources of entrepreneurial families, which are the result of an entrepreneurial mindset and activities, are a key factor in transgenerational value creation. First, we are interested in exploring the financial relationships between the family and the company. We also want to know how financial
assets in the company and the (liquid) private assets of the family are managed and passed on to the next generation. Of all responding companies, 8% stated that their private assets were more than Eur 250 million or CHF 300 million respectively.
3.3 Financial resources of the Family
As shown in Figure 21, there seem to be clearly defined rules for children potentially joining their parents’ company: in most cases, there are specific requirements in terms of training/education and job experience outside of the family business. However, the question is whether these rules are actually applied to young family members wishing to join the family firm.
First, let us look at the financial relationships between the entrepreneurial family and the largest company. We see that the family obtains resources from the company primarily via traditional instruments such as salaries for operational activities and dividend payments. loans from companies to sharehold-ers only occur in less than 8% of cases.
The question as to how entrepreneurial families supply the company with financial resources results in a very different answer. Shareholder loans play a key role, surpassed only by the general provision of equity. The provision of resources by paying a salary under market conditions applies only to just over 10% of all cases.
3.3.1 Financial Relationships between Family and Company
Yes, based on age
Yes, based on training/university studies
Yes, based on job experience outside of the family firm
No
11.7
41.933.6
12.8
% of all responses

Entrepreneurial Families 23
First it is important to know here who manages the entrepre-neurial families’ private assets, by which we primarily mean liquid private assets. Figure 24 shows that investment advisors are clearly in the lead. The company’s CFO also plays a key role.
However, who manages which proportion of the private assets? it has been shown that investment advisors are by far the most commonly listed consultants, but on average they manage “only” 63.8% of the private assets. The CFOs, the second most frequently listed group, also manage about 60% of the assets. The significance of CFOs in this regard, as revealed by our survey, is surprising given that administering the family’s private assets is normally not part of a CFO’s core
activities. Here, we see the potentially opposing aspects of trust and core competency. it appears to be very important to the entrepreneurial families to place their private assets in the hands of someone they can completely trust. They may even be willing to accept compromises in terms of core competency.
When selecting partners for asset management, we see a diversification strategy among the entrepreneurial families. interestingly enough, this also applies to single family offices (SFO). Although the main reason for setting up an institution of this kind is generally to manage assets, on average less than three-fourths of the entrepreneurial family’s assets are managed by it.
3.3.2 Management of the Family’s Private Assets
Figure 22: How the Family Obtains Resources from the Company
Figure 23: Provision of Resources by the Entrepreneurial Family
4.4
0 10 20 30 40 50 60
10.736.3
48.6
OtherSalary under market conditions
Loans from shareholdersProvision of equity
% of all responses
Figure 24: Who Manages the Private Assets?
Figure 25: Proportion of Private Assets under Management, If Applicable
3.4
0 5 10 15 20 25 30 35 40 45 50
6.97.7
38.643.4
OtherNon-monetary benefits
Loans granted to shareholdersDividends
Salary
% of all responses
9
0 20 40 60 80 100 120
1820
49102
Multi-family officeTrustee/Accountant
Own single family officeOwn CFO
Investment advisor
Number of responses
31.6
50.3
60.4
63.8
73.3
0 10 20 30 40 50 60 70 80
Multi-family office
Trustee/Accountant
Own CFO
Investment advisor
Own single family office
% of private assets, average

24 Entrepreneurial Families
now let us look at the investment strategies and expected returns. We asked how our respondents would describe their basic investment strategy. Assigning the answers a numerical value (from 1 = aggressive growth to 4 = assets held very conservatively) results in an average of 2.7; i.e., a relatively moderate rating between preserving assets and moderate growth. We see that only 2.5% pursue an aggressive growth strategy; however, this is probably due in part to the difficult market environment at the time of the survey (spring 2012).
The investment horizon of the entrepreneurial families with regard to liquid private assets is an average of ten years. As Table 5 shows, the expected returns on the capital invested in the company are much higher than the expected returns on liquid private assets.
We consider the expected returns in both cases to be rela-tively demanding. We would expect that these requirements will have an indirect impact on the company’s entrepreneurial orientation and the investment strategy for asset management.
3.3.3 Investment Strategy and Expected Returns
Table 5: Additional Information Regarding Investment Strategy and Expected Returns
Dimension Average
investment horizon 10.6 years
Expected returns on the capital invested in the company 9.6%
Expected returns on liquid private assets 4.3%
Figure 26: General Investment Strategy of the Entrepreneurial Families
Aggressive growth
2.5 39.2 44.6 13.7
0% 20% 40% 60% 80% 100%
Growth
Preserve assets
Preserve assets very conservatively
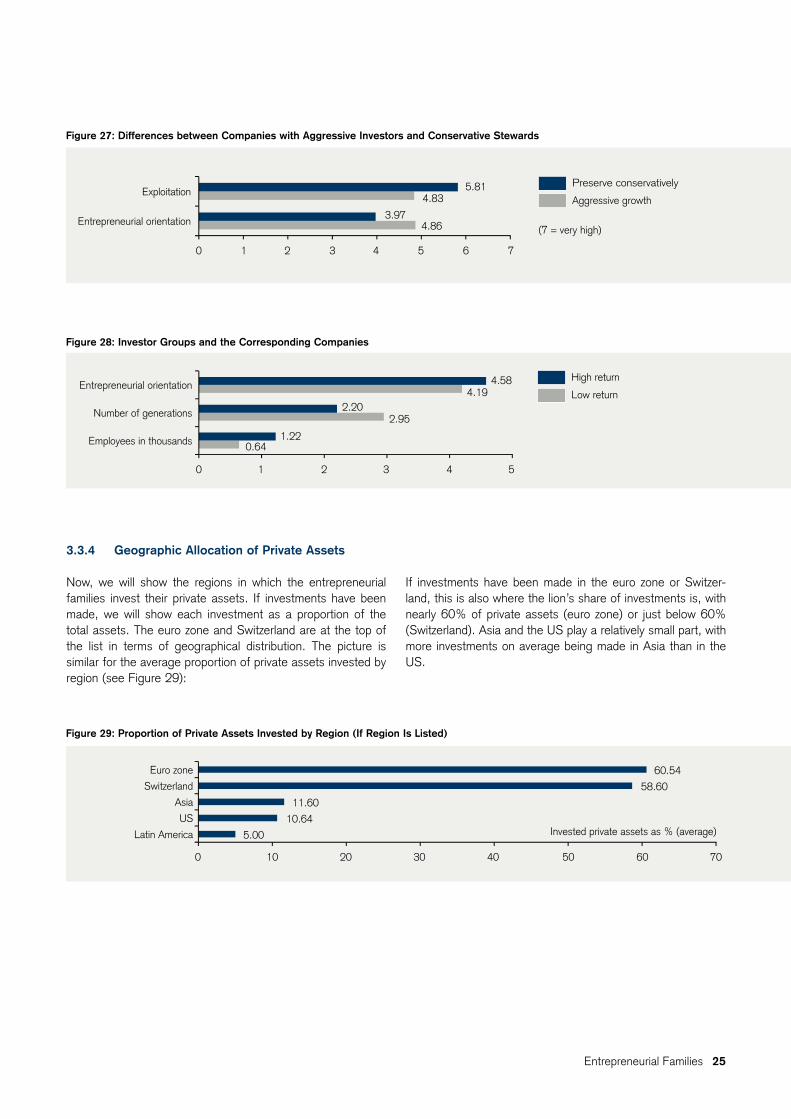
Below, we will take a look at the relationship between invest-ment strategies and expected returns on the one hand, along with the company’s behavior on the other. First, we will com-pare the “aggressive investors” shown in Figure 26 with the “very conservative stewards.” When entrepreneurs want their private assets to grow aggressively, their companies have a much higher entrepreneurial orientation (EO). if the main focus is on conservative stewardship of the private assets, the com-panies are generally oriented to low-risk refinement of existing products and technologies (exploitation). Therefore, we see that the entrepreneurs’ investment strategy is reflected direct-ly within the company.
next we group our entrepreneurs into “high return” investors (expected returns on the capital invested in the company of more than 20%) and “low return” investors (expected returns of less than 5%). The companies of the “high return” investors have a much higher level of entrepreneurial orientation (EO) and are also much larger. Thus, a high expectation for returns on the capital invested in the company seems to promote EO and growth. The companies of the “low return” investors are much older. This is a further indication of a “retirement fund mentality” that can develop over the generations. low, but stable returns are expected. However, this can have a negative impact on entrepreneurship and growth.
Entrepreneurial Families 25
Figure 27: Differences between Companies with Aggressive Investors and Conservative Stewards
Figure 28: Investor Groups and the Corresponding Companies
now, we will show the regions in which the entrepreneurial families invest their private assets. if investments have been made, we will show each investment as a proportion of the total assets. The euro zone and Switzerland are at the top of the list in terms of geographical distribution. The picture is similar for the average proportion of private assets invested by region (see Figure 29):
if investments have been made in the euro zone or Switzer-land, this is also where the lion’s share of investments is, with nearly 60% of private assets (euro zone) or just below 60% (Switzerland). Asia and the uS play a relatively small part, with more investments on average being made in Asia than in the uS.
3.3.4 Geographic Allocation of Private Assets
Figure 29: Proportion of Private Assets Invested by Region (If Region Is Listed)
Preserve conservatively
Aggressive growth
4.86
4.83
0 1 2 3 4 5 6 7
3.97
5.81
Entrepreneurial orientation
Exploitation
(7 = very high)
High return
Low return
0 1 2 3 4 5
0.64
2.95
4.19
1.22
2.20
4.58
Employees in thousands
Number of generations
Entrepreneurial orientation
5.00
0 10 20 30 40 50 60 70
10.64
11.60
58.60
60.54
Latin America
US
Asia
Switzerland
Euro zone
Invested private assets as % (average)

26 Entrepreneurial Families
3.4 Single Family Offices
3.4.1 Which Companies Have a Single Family Office?
A special option for managing an entrepreneurial family’s pri-vate assets is to set up a single family office (SFO). These institutions focus solely on the assets of one family. Our data shows 28 entrepreneurial families with their own SFO.
To estimate the critical mass for setting up an SFO, first let us look at the main companies among the entrepreneurial families with an SFO. As Figure 31 shows, the typical entrepreneurial family with an SFO manages a company with a median of more than 1,000 employees and over Eur 200 million in rev-enues.9 This is therefore much higher than the average com-pany owned by an entrepreneurial family without an SFO.
Here we asked entrepreneurs to list the asset class in which their private assets were primarily invested. Equities, real estate, and investments in companies were the most frequent responses. We identify an investment strategy that is primarily based on the tried-and-true and avoids experimentation. more
unusual asset classes such as hedge funds, art, or commodi-ties were scarcely mentioned. These may be used to supple-ment an investment portfolio, but they apparently do not play a significant role.
3.3.5 Invested Asset Classes
Figure 30: Main Asset Classes – An Overview
0.8
0 5 10 15 20 25 30 35 40
0.80.8
1.93.0
9.520.1
28.934.2
GoldInfrastructure (incl. forest)
Art BondsOthers
Cash and cash equivalentsInvestments in companies
Real estateEquities
% of responses for primary asset class
With regard to financial resources, there are close financial ties between the entrepreneurial families and their com-panies. When selecting asset managers, we see a diversification strategy among the entrepreneurial families, whereby trust seems to be at least as important as expertise. investments in the main asset classes are also geared toward diversification. in general, the strategy of the entrepreneurial families can be considered balanced, with the expected returns on the capital invested in the company being much higher when compared with the expected returns on liquid private assets. The families’ expected returns and risk preferences are directly reflected in the behavior of the respective companies.
9 Due to some extreme cases, the median is sufficiently informative

Entrepreneurial Families 27
Figure 31: Average Size of Companies Owned by Families with and without an SFO
3.4.2 Main Characteristics of a Single Family Office
The following table summarizes the size, age and other char-acteristics of the single family offices (SFO) in our sample.
On average, the SFOs in our sample are very small organiza-tions with fewer than four employees serving about ten family members. notably, SFOs seem to be a relatively new phenom-enon, at least in our sample. Apart from one SFO founded at the start of the 20th century, all others were set up in the last 30 years or so. This means an average age of just 16 years. Frequently, a larger corporate sale is the reason for setting up an SFO due to the related complexity of managing the ensuing liquid assets. One year seems to be a realistic time frame for
forming an SFO, but it can take much longer, as confirmed by our interviews. One owner of an SFO describes the setup as a “longer-term, organic process with continual professionaliza-tion of the SFO.” When establishing an SFO, there are a “series of ‘make or buy’ decisions. implementation by the SFO itself ends at a certain point and everything else is delegated to the experts from there.” With regard to forming an SFO in general, legal and tax consulting are considered particularly critical. Another owner of an SFO refers to its establishment as “a very rational process, with consultants being very heavily involved. However, it was really important to talk with other entrepreneurial families and SFOs.”
Table 6: Main Characteristics of a Single Family Office
Dimension Average Range/Comments
Total number of employees 3.7 2–15
Of which family members 1.1 0–3
Family members managed 10.1 2–45
ratio of family members to employee 2.7 family members per employee 0.27–9
Age of SFO 16 years All SFOs founded after 1980 except one
length of foundation process 11.63 months 1–72 months
3.4.3 Core Tasks and Partnerships in the Single Family Offices
The logical next question is therefore related to the SFO’s catalog of services: What can and should the SFO do itself, and where does it cooperate with third parties? Figure 32 offers a summary of the key tasks mentioned for an SFO.
As expected, asset management is generally the main task, followed by investment planning, controlling and reporting,
taxes, real estate, and succession planning. These are central tasks that can ideally be appropriately managed even by a small team. Therefore, an SFO is a small core team that works on select core tasks. nonetheless, the logical question is where third parties might be involved in order to add external expertise. As previously illustrated, “make or buy” decisions appear to be central to many SFOs.
No SFO
SFO
1865
216
6905
1150
0 1000 2000 3000 4000 5000 6000 7000 8000
Employees/revenues in EUR millions370
125
1995
500
Average revenues in EUR millions
Median revenues in EUR millions
Average no. of employees
Median no. of employees

28 Entrepreneurial Families
Figure 32: Core Tasks of the SFO
We asked the owners of the SFOs about the areas of coop-eration with third parties and which areas are completely out-sourced to external partners (see Figure 33). Our assumption was correct: Small teams need external knowledge, which means a great deal of external involvement. notably, coopera-tion is strongest in those areas counted as part of the core activities that were identified: asset management, taxes, real estate, and asset allocation. That means the core activities are generally not handled alone. Complete outsourcing is most common for taxes, legal advice, real estate, and special capital market transactions. This indicates a focus on core competen-
cies. This was confirmed by one of our interviewees, in this case an SFO manager who is not a family member: “We are generally a lean organization and focus on our core activities.”
An owner of an SFO describes the essential challenge: “You should take an objective look at what you want to, and can do, alone and what you can handle better and more affordably than a third party could.” Another interviewee cites “advising family members, free of all conflicts of interest” as the key general point.
Figure 33: Cooperation and Outsourcing in the SFO
1
0 5 10 15 20 25
34
57
89
1111
121313
22
Trade executionSpecial capital market transactions
CustodyPhilanthropy/foundations
Corporate financePrivate equity investments
Family governanceAsset allocation structuring
Succession planningReal estate managementTax optimization/planning
Investment planning/controlling/reportingAsset management
Number of responses (multiple answers possible)
Completely external
Cooperation
1
0 5 10 15 20
3
6
7
8
8
8
8
12
12
12
12
14
18
1
0
0
2
3
1
1
1
2
4
1
3
5
1
Trade execution
Philanthropy/foundations
Private equity investments
Succession planning
Special capital market transactions
Custody
Family governance
Investment planning/controlling/reporting
Corporate finance
Legal advice
Asset allocation structuring
Real estate management
Tax optimization/planning
Asset management
Number of responses (multiple answers possible)

Entrepreneurial Families 29
Figure 34: Main Decision Makers in the Selection of External Partners
4
0 2 4 6 8 10 12
55
11
Asset ownersInvestment Committee
CEOBoard of Directors
Number of responses
Given the high relevance of cooperation with external partners, it is important to know who at the SFO decides on the selec-tion of these partners. As Figure 34 shows, the Board of Directors/Supervisory Board is the central decision maker. This underscores the family’s high level of influence. The CEO
of the SFO seems to have fewer decision-making powers than a company CEO, for example. This is likely to be a particular challenge for the CEO, especially if he/she is not a family member. The risk here is that the CEO may be regularly out-voted on key issues.
3.4.4 Advantages and Disadvantages of Single Family Offices
From the owners’ standpoint, independence and decision-making authority, control over assets, confidentiality, and sus-tainable asset management are definitely among the main advantages (Figure 35). Governance topics such as succes-sion planning are not cited often. The SFO’s special advan-tages, therefore, lie in independent, discreet, and long-term asset management.
The role of the SFO as a “central hub for all of the family’s investment and administrative matters” provides a further advantage because it consolidates competencies and lends a professional quality to decision-making topics, as one of our interviewees explained. According to another interviewee, “the SFO has helped the family members achieve a much higher level of professionalization in their asset management — a real quantum leap.” The SFO is also in charge of “educating and
informing family members and imparting knowledge because knowledge means peace of mind and serenity.” Thus, the SFO is the basis for “composed partners and decisions.” A non-family member manager adds: “The SFO provides a profes-sional organizational structure that can manage and control the dynamics of the assets in-house. All in all, it has proven to be a very good system.” A further advantage of the SFO as seen in our interviews is the possibility to “protect principals from themselves.” This is done by “giving them an organizational structure that allows them to avoid significant loss. After all, the wrong marriage contract or will can ruin everything; the wrong risk assessment for a large investment by one person can harm the entire shareholder group. Entrepreneurs read about this all the time, but they often fail to realize it could happen to their company.”
Figure 35: Advantages of an SFO from the Owners’ Standpoint
1
1
4
0 5 10 15 20 25
9
9
10
11
16
17
19
20
Separation between family and company
Own business model
Separate legal entity
Governance function
Investment controlling
Cost benefits
Own choice of managers
Sustainable asset management
Greater level of confidentiality
Control/overview of assets
Independence from third parties/influential powers
Number of responses (multiple answers possible)

30 Entrepreneurial Families
Figure 36: Disadvantages of an SFO from the Owners’ Standpoint
The two largest disadvantages are the expense for ongoing management and control along with the time and expense incurred in founding and establishing the SFO (Figure 36). The first point listed seems to refer to governance problems spe-cifically between entrepreneurial families and SFOs run by non-family members. Some owners have apparently realized that the advantages of an SFO cannot be fully realized for “lower” asset levels.
in our sample there are 35 entrepreneurial families considering founding an SFO. Thus, we can examine whether SFOs are as worthwhile as one might believe. Our approach is as follows: We compare the advantages and disadvantages listed by potential founders of SFOs with the advantages and disadvan-tages listed by owners of established SFOs. The differences indicate where the advantages and disadvantages of SFOs are overestimated or underestimated (Figure 37).
Cost benefits, the governance function, and the existence of a separate legal entity are the most underestimated factors. SFOs are shown to have greater advantages in these areas than anticipated when founding an SFO. Conversely, SFOs do not appear to meet all expectations in terms of controlling and monitoring assets, investment controlling or sustainable asset management. These areas are still listed as advantages, but not to the same extent that they were before foundation. This is of particular concern, given that these areas are among the SFO’s core activities.
Our main finding is that SFOs do not always fully meet the expectations placed on them with regard to their core activities. One might ask whether the model with very small teams and a large number of external partnerships has some limitations.
Figure 37: Overestimated and Underestimated Advantages of the SFO
0 2 4 6 8 10 12
Number of responses (multiple answers possible)4
7
10
10
Finding professional staff
Advantages seen only with larger assets
Expense for foundation and establishment
Expense for management and control
-5.3
-6 -4 -2 0 2 4 6 8
-3.1
-3.0
-0.2
0.4
0.6
1.5
1.8
5.6
Control/overview of assets
Investment controlling
Sustainable asset management
Greater level of confidentiality
Independence from third parties/influential powers
Own choice of managers
Separate legal entity
Governance function
Cost benefits Advantages UNDERestimated: Responses from owners more frequent than from potential founders (%)
Advantages OVERestimated: Responses from potential founders more frequent than from owners (%)

Entrepreneurial Families 31
Figure 38: Overestimated and Underestimated Disadvantages of the SFO
With regard to the expected and actual disadvantages, we find that potential SFO founders apparently underestimate the expense and time incurred in founding an SFO and in its sub-sequent management and control. The search for professional staff and concerns about the benefits for smaller assets remain disadvantages for established SFOs. However, these are not as significant as they were before foundation (see Figure 38).
Whether an SFO lives up to expectations depends on the indi-vidual case, as one of our interviewees explains: “Satisfaction with the SFO has a great deal to do with expectations. Anyone expecting to make a lot more money with an SFO is very likely to be disappointed. rather, it’s about institutionalizing and professionalizing asset management.”
3.4.5 Governance in the Single Family Office
Below we will take a detailed look at the interface between the entrepreneurial family and the SFO. The corresponding gover-nance measures are critical success factors for the long-term functioning of an SFO.
Because asset management is ultimately the core task of an SFO, it is still important to know who the main decision-maker is in determining the investment strategy. As Figure 39 shows, the asset owner and Board of Directors or Supervisory Board are the decision makers, similar to the selection of external partners. Therefore, the family/owner has a very high level of influence in this area too. The manager of the SFO was named as the main decision maker in just three cases.
There is great potential for conflict due to the family’s high level of influence. Particularly if the CEO of the SFO is not a family member (as in 40% of the cases) or is a family member but not primary owner, there is the question of the CEO’s actual powers for making decisions and implementing them. Particularly in times of crisis, it is possible that the primary owner will disre-gard the investment guidelines and requirements of the SFO’s CEO. This could lead to significant frustration of the CEO and, over the long term, put the SFO model at risk.
Figure 39: Primary Decision Makers for the Investment Strategy
1
0 2 4 6 8 10 12
1
1
2
3
6
11
Family committee
BoD Chairman, BoD, CEO, and external experts
Every investor personally
Investment Committee
CEO single family office
Board of Directors/Supervisory Board
Asset owners
Number of responses
-6.9
-10 -5 0 5 10 15 20
-5.4
7.5
14.5
Advantages seen only with larger assets
Finding professional staff
Expense for management and control
Expense for foundation and establishmentDisadvantages UNDERestimated: Responses from owners more frequent than from potential founders (%)
Disadvantages OVERestimated: Responses from potential founders more frequent than from owners (%)

32 Entrepreneurial Families
3.4.6 Involvement of the Family and Other Employees in the Single Family Office
As noted several times, the involvement of family members in the SFO and the role of non-family employees are central suc-cess factors within the SFO. These aspects therefore require special attention.
On average, 1.1 of 3.7 employees are part of the owning fam-ily. Sixty percent of all SFOs are managed by a family member. in the primary companies described above, management is dominated by family members in just 33.3% of all cases. Thus, operational control by the family is more frequently found in an SFO.
regarding internal or external family management, the owner of a family-run SFO explains: “internal family management should ultimately be considered a good thing. in particular, the fact that there is no principal-agent problem is a relief, and a key advantage.” However, there is a central success factor: “it is important for you to have expertise yourself and enjoy the subject of investing. it’s no use to ‘fool around’ in unknown territory in a semi-professional manner and risk losing money.”
However, one member of an entrepreneurial family that owns a non-family managed SFO says: “it would be unthinkable to us for a family member to run the SFO. if something went horribly wrong, you’d still have to spend Christmas with the person who caused it.” Here too, competencies and skills are at the forefront, because “an SFO is not a playground for bored, wannabe entrepreneurs, and there is no automatic relationship between the size of the inheritance and the ability to manage assets.”
So in general, having a family member manage the SFO can have advantages and disadvantages. The potential advantages include more control, influence, ideally mutual interests and efficient decision-making processes. The possible disadvan-tages are finding a suitable manager with the right skills and experience within the family, along with potential conflicts between family members especially in times of crisis. There-fore, “internal or external” is a very fundamental decision.
Figure 40: Frequency of Financial Reporting to the Owning Family
reporting is another key aspect for the entrepreneurial family-SFO interface. How often does the SFO report to the asset owners, and on which topics? in nine of 22 SFOs that answered this question, there is no consolidated performance reporting. more than 40% of the SFOs have no consolidated overview of their investment performance, which is very sur-prising given that asset management is a core task and sig-nificant advantage of an SFO. A non-family member SFO
manager explains in detail: “Day in, day out, you have to know what you own, where it is, and how much it’s worth. This is the foundation of asset management and the main role of the CFO.”
The situation is better in terms of a general financial report: Two-thirds of all SFOs perform at least quarterly reporting as Figure 40 shows.
0 1 2 3 4 5 6 7 8 9
Number of responses5
3
8
8
Yearly
Twice yearly
Quarterly
Monthly

Entrepreneurial Families 33
Figure 41: Professional Background of Family Member CEOs
Consulting
Legal advice
Tax consulting
Asset management
Banking/private banking
Other
7.17.1
7.1
14.3
21.5
42.9
Figure 42: Professional Background of Non-Family Member CEOs
Banking/private banking
Consulting
Other
Asset management
14.3
14.3
28.6
42.8
in 43.8% of all SFOs surveyed, non-family member employ-ees do not receive performance-based compensation. This contrasts with many other asset managers. For performance-based pay, the average variable salary component is a rela-tively low 12.81%.
One aspect that we pay special attention to is the professional background of the CEOs in our SFOs. Figures 41 and 42 show the findings for the family member and non-family mem-ber CEOs.
Given the core tasks of the SFO, the professional background of the CEOs would be expected as follows: asset manage-ment, banking/private banking, legal and tax advice, or con-sulting. However, a little more than 40% of family member CEOs have an educational and professional background in other fields. For this reason, they may be missing the skills and experience needed to manage an SFO. For non-family CEOs, only about 25% come from fields other than the ones expect-ed as stated above. more than 42% of these CEOs previously worked in asset management. This figure is only 14.3% for family member CEOs. Therefore, different hiring criteria are evidently applied to family members. Here we see the same conflicting factors of “trust versus core competency” that apply to the frequent selection of the CFO as asset manager (see Section 3.3.2). Trust in a person and the confidence that he/she would ordinarily represent only the interests of the asset owners frequently seems to be more important than core com-petencies and experiences. However, we wish to note that this can pose a challenge to the SFO in terms of managing the core tasks.
Of particular interest here is how an SFO can recruit non-family member “top shots.” According to one interviewee, “the budget for asset management and the assets to be managed themselves must be very large in order to recruit bona fide professionals on the market. A small SFO usually cannot offer these people an appealing environment.” Another SFO owner adds: “recruiting ‘top shots’ is difficult, especially at the begin-ning when you’re building a team from scratch. it’s nearly impossible to recruit people who have a great need or desire for measurable, tangible success. Those people tend to still seek challenges in investment banking.”

34 Entrepreneurial Families
Figure 43: Contact Persons for Founding a Potential SFO
11
3
0 5 10 15 20 25 30
39
1010
1426
BoD membersBoard of Trustees from the company foundation
House bankTrustee/Accountant
Asset manager/investment advisorOwn CFO
Own attorneyExternal advisors
Other entrepreneurial families
Number of responses (multiple answers possible)
3.4.7 Potential Founders of Single Family Offices
To better evaluate the relevance of an SFO, let us look at those 35 entrepreneurial families who are thinking about start-ing an SFO.
Their companies have a median of 1,400 employees and of Eur 258 million in revenues. Therefore, they are larger than the companies of families who already have an SFO. This tells us: First, there is a large degree of interest in the topic of an SFO. One interview partner explains: “There is a clear trend toward more SFOs. The reputation that goes with having your own SFO plays a role.” Second, the estimate of the critical size of a company for setting up an SFO seems realistic. As regards critical asset size, one interviewee says: “This can’t be measured in terms of an exact number. rather, it depends on
how active the principal wishes to manage his/her assets and on the complexity of the structure. nonetheless, 300 to 400 million Swiss francs and up serves as a general yardstick.”
The question is whom the potential SFO founders would con-sult regarding the foundation. it is clear that, normally, other entrepreneurial families are asked first. Following external consultants, they consult with their own attorney, the CFO, and other persons they know well within their own network. This highlights the importance of a private domain and personal relationships when founding an SFO. House banks are men-tioned with surprising infrequency. it is surprising given the numerous services that are offered for SFOs.

Entrepreneurial Families 35
3.4.8 Excursus on the Multi-Family Office (MFO)
Finally, let us look at the topic of multi-family offices (mFOs). This refers to a service provider that performs family office services for multiple entrepreneurial families at the same time and is thus not obligated to just one family. Our sample includes a total of 12 entrepreneurial families that use mFO services. However, there are only two entrepreneurial families who have an SFO and work with an mFO at the same time. So usually the rule is either/or. Figure 44 shows how frequently the various areas of responsibility are listed as core tasks of an mFO10, and compares these with the responses related to SFOs.
We see that taxes, special capital market transactions, and legal advice are more frequently listed among the core tasks of an mFO. Thus, these activities are performed more often by an mFO than by an SFO. SFOs tend to be active in asset man-agement, real estate management, and investments. Thus, there is a fairly clear distinction between an mFO and an SFO with regard to the key activities.
10 Only those entrepreneurial families who work with an mFO and do not have their own SFO were examined.
Figure 44: Comparison of the Primary Tasks of the MFO and SFO
SFOs can definitely be a suitable tool for creating (financial) value over the long term. There is clearly a minimum asset level needed to profit from an SFO. Because our sample includes relatively small SFOs, the selection of core tasks, cooperation (make-or-buy decisions) and the SFO’s internal governance plays a significant role. in terms of the latter, internal decision-making processes, selecting non-family employees and involving family members are particularly impor-tant (with the resulting opposing factors of “trust vs. core competency”). it is also clear that SFOs cannot always fully meet the expectations placed on them. However, in some areas, expectations are also exceeded.
SFO
MFO
% of all responses1.5
3.1
3.1
3.1
6.2
6.2
6.2
6.2
7.7
9.2
9.2
9.2
13.8
15.4
4.2
0.8
3.4
7.6
5.9
10.1
9.2
6.7
0.0
0 2 4 6 8 10 12 14 16 18 20
2.5
9.2
10.9
18.5
10.9
Philanthropy/foundations
Trade execution
Custody
Family governance
Corporate finance
Real estate management
Succession planning
Private equity investments
Legal advice
Special capital market transactions
Asset allocation structuring
Investment planning/controlling/reporting
Asset management
Tax optimization/planning

36 Entrepreneurial Families
4 A mODEl: HOW DO EnTrEPrEnEuriAl FAmiliES CrEATE VAluE FrOm GEnErATiOn TO GEnErATiOn?
Our study includes some interesting approaches to explaining transgenerational value creation in entrepreneurial families. in particular, we have been able to identify four central and related drivers that we have obtained detailed knowledge of.
This has allowed us to paint a holistic picture of transgenera-tional value creation. The entire family’s EO is the starting point. This is reflected not only in strong entrepreneurial activ-ity on the part of the company, but particularly at family level beyond the largest or most renowned company. These numer-ous activities generate a high degree of emotional and par-ticularly financial value if the company is a success. manag-ing, enhancing, and passing on these assets are the next steps toward success. For very large assets, setting up an SFO can be beneficial, but the process definitely does not
Figure 45: Ideal Picture of Transgenerational Value Creation
Transgenerational value creation
Entre
pren
euria
l orien
tation of the family
and
of
the co
mpany Entrepreneurship beyond
the family firm
financia
l reso
urce
s
Management o
f
Establishment of an SFO
stop here. The SFO is also responsible for ensuring that no “retirement fund mentality” arises among the owners. This could be handled, for instance, by agreeing with the owners on conscious and systematic entrepreneurial direct invest-ments. A course of action such as this corresponds not only to the entrepreneurial tradition of the owning families and offers emotional benefits (Zellweger & Sieger, 2009), but may also result in higher returns than traditional investment instru-ments. This, in turn, shows the benefit of entrepreneurial activities, which could serve the entrepreneurial mindset of entrepreneurial families.
in all, this results in the ideal picture of transgenerational value creation as shown below.

Entrepreneurial Families 37
Based on our findings, we conclude our study with specific recommendations for courses of action for entrepreneurial families, SFOs, and consultants.
Recommended Courses of Action for Entrepreneurial Families
5 COnCluSiOnS AnD rECOmmEnDED COurSES OF ACTiOn
ȩ Entrepreneurial families should ensure that their entrepre-neurial orientation has the potential to succeed and avoid a “retirement fund mentality.” Entrepreneurial families who succeed in the long term are notable for combining careful, conscientious business practices with a focus on innovation and change with acceptable risk.
ȩ These opposing factors must be carefully and actively ma-naged and directly applied to the company or to the compa-nies in the portfolio.
ȩ The emotional connection between families and companies should be intentionally fostered. There is a positive corre-lation between the emotional connection to a company’s activities and their success. They are not mutually exclusive.
ȩ Entrepreneurial families should be aware that the focus is not on a single company. Successful entrepreneurial fami-lies develop an entire portfolio of companies dynamically and over time in order to create transgenerational value.
ȩ A broad perspective is needed: buying, founding, and even discontinuing single companies are part of a long-term suc-cess strategy.
ȩ Thus, discontinuing a company is not a sign of failure but rather of good business acumen.
ȩ A portfolio of companies opens a wealth of possibilities. For instance, a “supertanker versus speedboat” strategy can be implemented in order to combine entrepreneurial risk (speedboats) with stability and durability (supertankers) for the good of all.
ȩ involving the next generation should be clearly regulated par-ticularly with regard to entry opportunities and qualifications.
ȩ Managing private assets seems to benefit most from a diver-sification strategy “without experiments.”
ȩ A long-term investment horizon combined with investments in known asset classes is a promising recipe for success with regard to transgenerational value creation.
ȩ With regard to asset management, entrepreneurial families should consider whether the competent CFO of the pri-mary company would automatically be a competent asset manager.
ȩ The opposing factors of “trust versus core competency” require special attention here.

38 Entrepreneurial Families
Recommended Courses of Action for Service Providers
ȩ in general, entrepreneurial families have very special needs and preferences in terms of strategic questions or invest-ment strategies/expected returns.
ȩ The expected returns on the private assets are relatively high and difficult to achieve. This is especially true because entrepreneurial families are fairly risk-adverse and generally wish to avoid experimenting with asset classes and coun-tries.
ȩ Thus, how can relatively high returns be generated without much risk and using standard instruments? Extensive dis-cussions must be held with the owners.
ȩ At the same time, trust in general is a very central factor and it frequently takes a long time to establish this trust.
ȩ Families require a great deal of support in setting up an SFO, especially in terms of later controls.
ȩ Entrepreneurial families with an SFO do not ordinarily enter into partnerships with an mFO but they do cooperate with other partners.
ȩ This applies in particular to asset management, taxes, asset allocation, and legal advice.
ȩ Because the SFO often consists of a small team with dif-ferent backgrounds among the team members, there is the chance to form partnerships based on special skills.
ȩ House banks are rarely mentioned as a point of contact for founding an SFO, although the largest banks do offer a great deal of assistance in this specific area. Thus, there is a great deal of potential for cooperation that is yet untapped.
Recommended Courses of Action for Single Family Offices/Single Family Officers
ȩ For entrepreneurial families, there is a critical mass with re-gard to the company or the assets in order for an SFO to make sense.
ȩ Founding an SFO must be carefully considered. The range of services, “make-or-buy” decisions, and governance are very central topics.
ȩ The question is: in which areas can an SFO offer added value compared with an mFO or other service provider?
ȩ SFOs are generally very small measured in terms of head-count. This makes the question of what services are offered even more important.
ȩ Partnerships are generally a useful tool, as this allows for a focus on the core activities.
ȩ Entrepreneurial families should be aware of the advantages and disadvantages of direct family influence, especially if the SFO is managed by a non-family member.
ȩ in general, SFOs can be managed either by a family mem-ber or a non-family member, but there are some very impor-tant success factors.
ȩ When involving family members, it should be remembered that skill and motivation are required to complete core tasks in a professional manner.
ȩ Although it may seem like a good idea to weigh trust against core competency, it is still recommended that the family members involved have a certain amount of skills and ex-perience.
ȩ in the case of non-family management, it should be deter-mined what types of supervisory and control systems would make sense.
ȩ “internal or external management” seems to be a matter of faith that depends on the particular case. Therefore, entre-preneurial families should take a very close look at this issue and make a well-informed decision.
ȩ in some areas, SFOs do not fully live up to the expectations. Therefore, it is important to conduct an objective evaluation of this institution; speaking with other entrepreneurial fami-lies is absolutely recommended.

Entrepreneurial Families 39
Gomez-mejia, l. r., Haynes, K. T., nunez-nickel, m., Jacobson, K. J. l., & moyano-Fuentes, J. 2007. Socioemotional Wealth and Business risks in Family-controlled Firms: Evidence from Spanish Olive Oil mills. Administrative Science Quarterly, 52(1): 106–137.
Sieger, P., Zellweger, T., nason, r. S., & Clinton, E. 2011. Portfolio Entrepreneurship in Family Firms: A resource-based Perspective. Strategic Entrepreneurship Journal, 5(4): 327–351.
Zellweger, T. & Sieger, P. 2011. Entrepreneurial orientation in long-lived family firms. Small Business Economics, 38(1): 67–84.
Zellweger, T., nason, r. S., & nordqvist, m. 2012. From longevity of Firms to Transgenerational Entrepreneurship of Families: introducing Family Entrepreneurial Orientation. Family Business Review, in press.
Zellweger, T. m. & Sieger, P. 2009. Emotional Value – über den emotionalen Wert, ein unternehmen zu besitzen (Emotional value: On the emotional value of owning a company). Ernst & Young.
The Center for Family Business at the University of St. Gallen (CFB-HSG) offers long-term support for family firms. It has esta-blished itself as a leading, international and national family business expert in the fields of research, education, and executive education/transfer. The activities of the CFB-HSG include initiation, management, marketing and organizing executive education and transfer programs, research projects and courses. This also includes the St. Gallen Family Office Forum (SFOF), focused exclusively on single family offices.
www.cfb.unisg.ch
6 SOurCES
BriEF POrTrAiT OF THE CEnTEr FOr FAmilY BuSinESS (CFB-HSG)

Important Information
This document has been produced for informational purposes only and is for the sole use of the recipient. The information contained herein is indicative and subject to change at any time. no guarantee can be given as to the reliability or completeness of this docu-ment, and no liability can be accepted for any losses incurred as a result of its use. This document does not constitute an offer, a recommendation, or an invitation to purchase or sell investment instruments or to execute transactions of any kind. This document may not be distributed in the united States or passed on to any uS persons (as defined by the current version of regulation S of the uS Securities Act of 1933). The same applies in any other jurisdiction except where compliant with the applicable laws. Copyright © 2012 Credit Suisse Group AG and/or its affiliates. All rights reserved.
SO
lS 4
9 25
0034
4 12
.201
2
CREDIT SUISSE AGParadeplatz 88070 ZurichSwitzerland
www.credit-suisse.com