EntErPrisEs in thE - Asian Development Bank · 2014-09-22 · ASIAN DEVELOPMENT BANK AsiAn...
48
ASIAN DEVELOPMENT BANK ENTERPRISES IN THE PHILIPPINES: DYNAMISM AND CONSTRAINTS TO EMPLOYMENT GROWTH Niny Khor, Iva Sebastian, and Rafaelita Aldaba ADB ECONOMICS WORKING PAPER SERIES NO. 334 February 2013
Transcript of EntErPrisEs in thE - Asian Development Bank · 2014-09-22 · ASIAN DEVELOPMENT BANK AsiAn...

ASIAN DEVELOPMENT BANK
AsiAn Development BAnk6 ADB Avenue, Mandaluyong City1550 Metro Manila, Philippineswww.adb.org
Enterprises in the PhilippinesDynamism and Constraints to Employment Growth
Niny Khor, Iva Sebastian, and Rafaelita Aldaba analyze factors that affect the growth of enterprises in the Philippines. The authors attempt to provide a comprehensive background on the various policies and legislation that affect firms. They investigate which of the reported constraints in the business environments, within which these firms operate, are binding. The significant binding constraints across various specifications include customs and trade regulations, labor regulations, access to finance, and practices of competitors in the informal sector.
About the Asian Development Bank
ADB’s vision is an Asia and Pacific region free of poverty. Its mission is to help its developing member countries reduce poverty and improve the quality of life of their people. Despite the region’s many successes, it remains home to approximately two-thirds of the world’s poor: 1.6 billion people who live on less than $2 a day, with 733 million struggling on less than $1.25 a day. ADB is committed to reducing poverty through inclusive economic growth, environmentally sustainable growth, and regional integration.
Based in Manila, ADB is owned by 67 members, including 48 from the region. Its main instruments for helping its developing member countries are policy dialogue, loans, equity investments, guarantees, grants, and technical assistance.
EntErPrisEs in thE PhiliPPinEs: DynAmism AnD ConstrAints to EmPloymEnt GrowthNiny Khor, Iva Sebastian, and Rafaelita Aldaba
adb economicsworking paper series
no. 334
February 2013

ADB Ec
EnterDynam Niny KhoRafaelita
No. 334
ASIAN
conomics W
prises inmism an
or, Iva SebastiAldaba
| 2013
N DEVELO
Working P
n the Phnd Cons
ian, and
OPMENT B
Paper Serie
ilippinestraints t
BANK
es
s: to Emplo
Niny KhoChina ReBank (ADAnalyst aADB, RafPhilippine
oyment
or is Economist aesident Mission oDB), Iva Sebastiaat the Economicfaelita Aldaba ise Institute for D
Growth
at the People’s Rof the Asian Dean is Economics
cs and Research s Vice President
Development Stu
h
Republic of evelopment s and Statistics Department ofat the
udies.
f

Asian Deve6 ADB Ave1550 Metrowww.adb.or © 2013 by AFebruary 20ISSN 2313-Publication The views eDevelopme ADB does consequenc By making adocument, Note: In thi The ADB Eon ongoingDevelopmand develoconceptuastatistical dand policyand its suband develo
The ADB Ecould subsThe series
Printed on
elopment Bank nue, Mandaluyo
o Manila, Philipprg
Asian Developm013 6537 (Print), 23 Stock No. WPS
expressed in thient Bank (ADB)
not guarantee ce of their use.
any designationADB does not i
s publication, “$
Economics Wog and recently
ment Bank (ADopment probleal, analytical, odata and meas
y challenges; stbregional and copment indica
Economics Wosequently be re is maintained
n recycled paper
ong City pines
ment Bank
313-6545 (e-ISSS135362
s paper are thosor its Board of G
the accuracy
n of or referencentend to make a
$” refers to US d
orking Paper Sy completed re
DB) staff, consuems, particularr methodologi
surement. Therengthen anal
country operatators for monit
orking Paper Sevised for pub by the Econo
SN)
se of the authoGovernors or th
of the data inc
e to a particularany judgments a
dollars.
Series is a forumsearch and po
ultants, or resorly those facingical issues rela
e series aims toytical rigor andtions; and imporing develop
Series is a quickblication as arti
mics and Rese
r and do not nee governments
cluded in this p
territory or geoas to the legal or
m for stimulatiolicy studies unource persons.g the Asia and
ating to projecto enhance the d quality of ADrove the qualitment effective
k-disseminatinicles in professearch Departm
ecessarily reflectthey represent.
publication and
ographic area, or other status of
ing discussionndertaken by t. The series de Pacific regiont/program ecoknowledge on
DB’s country pty and availabeness.
ng, informal pusional journals
ment.
t the views and
d accepts no re
or by using the tf any territory or
and eliciting fthe Asian eals with key ecn; as well as onomic analysin Asia’s developartnership straility of statistic
ublication whos or chapters in
policies of the
esponsibility fo
erm “country” ir area.
feedback
conomic
s, and opment ategies, cal data
ose titles n books.
Asian
or any
n this

CONTENTS
ABSTRACT iv I. INTRODUCTION 1 II. GROWTH OF INDUSTRIES AND EMPLOYMENT IN THE PHILIPPINES 1
A. The Economy and Employment in the Philippines 4 B. Firms in the Philippines 7 C. Trade and Industrial Policy Environment 9 D. Investment Policy 11 E. SME Policies 13
III. ANALYTICAL FRAMEWORK 14
A. Literature Survey 14 B. Constraints to Firms’ Growth in the Philippines 15
IV. DATA AND EMPIRICAL RESULTS 17
A. Measuring Constraints to Growth 17 B. Data 18 C. Self-reported Constraint to Firms: Descriptive Statistics and Correlations 24 D. Maximum Likelihood Estimations 28 E. Heterogeneity of Firms 32 F. Access to Finance 33
V. POLICY IMPLICATIONS AND CONCLUSION 39
REFERENCES 41

ABSTRACT
This paper seeks to analyze the factors affecting the growth of enterprises in the Philippines, as measured from the expansion of employment. The paper contributes to the literature in two ways. First, it attempts to provide a comprehensive background of the various policies and legislations that affect firms in the country. Second, using micro-level data of the firms in 2009, we correlate the observed growth of these firms with reported constraints in the business environment within which these firms operate, to investigate which ones are binding constraints. We find significant correlations between a subset of these indicators of business climates and the issues raised in previous literature, and the effects vary across firms of different sizes. Given the challenging global climate in the aftermath of the global financial crisis of 2008 and 2009, more than a third of these firms expanded their payroll and majority saw growth in real sales. Amidst a sea of subjective self-reported responses, we manage to find certain empirical regularities that withstand a battery of robustness checks. These correlations between a subset of indicators for business climates and the growth or expansion of firms may shed some light on future potential policies to assist these firms, as well as provide directions for further research. Keywords: SMEs, enterprise, employment, constraints, growth JEL Classification: D20, D24, L25

I. INTRODUCTION
The dynamism of enterprises in an economy is vital to the well-being of the population. In a market-based system, enterprises not only form the basis of the economy and contribute to the majority of value-added in production, but also provide the main sources of employment for workers. Yet, despite the voluminous literature on labor markets and employment, relatively little is known on the factors that contribute to the dynamism of enterprises. This is especially true in developing countries where micro-level data on firms are scant, although in the recent years there has been a resurgence of interest on this issue due to the recognition of the importance of having a dynamic private sector and the increasing efforts to make such data available.
In this paper, we seek to analyze the factors that affect the growth of enterprises in the
Philippines, as measured from the expansion of employment. We contribute to the literature in two ways. First, this paper attempts to provide a comprehensive background on the various policies and legislations that affect firms in the country. Second, using micro-level data on the firms in 2009, we correlate the observed growth of these firms with reported constraints in the business environments within which these firms operate, to investigate which ones are observably binding constraints. This has not been done before due to a lack of publicly available panel data on firms in the Philippines.
Perhaps not surprisingly, we find significant correlations between a subset of these indicators
of business climates and the issues raised in previous literature, and that the effects vary across firms of different sizes. More surprisingly, given the challenging global climate in the aftermath of the global financial crisis of 2008 and 2009, more than a third of these firms expanded their payroll and the majority saw growth in real sales. Most surprisingly, amidst a sea of subjective self-reported responses, we manage to find certain empirical regularities that withstand a battery of robustness checks. These correlations between a subset of indicators for business climates and the growth or expansion of firms may shed some light on future potential policies to assist these firms, as well as provide directions for further research.
Nonetheless, the evidence on developing countries is still not well documented, partially due
to data constraints. This is also the case with the Philippines. This paper aims to bridge this gap in knowledge by examining the impact of various constraints to firms using detailed firm-level data in the Philippines. The paper will proceed as follows: in Section II, we provide background details for the Philippine economy and various policies that affect its firms. In Section III, we summarize the literature on constraints to enterprises in the Philippines and relevant analytical framework. Section IV presents the description of the data, variables, model, and empirical results. The last section discusses subsequent policy implications.
II. GROWTH OF INDUSTRIES AND EMPLOYMENT IN THE PHILIPPINES The size of enterprises ultimately varies across industries, industrial organizations, and economies.1 Even within similar sectors, firms vary on the types of production technology they choose and wages 1 While the terms enterprise (or firms) and establishment are two distinct concepts, in this paper these are often used
interchangeably. The survey data we use are based on establishment level data. “An establishment is a single physical location at which business is conducted or where services or industrial operations are performed. An enterprise or firm is a business organization consisting of one or more establishments under common ownership or control (ADB 2009).” For most of the small firms in the Philippines, the terms would be interchangeable since there is only one establishment in consideration.

2 | ADB Economics Working Paper Series No. 334
they pay. However, firms’ size matters if one is concerned about both the quantity and the quality of employment generated by the economy. There is empirical evidence that larger firms are correlated with not just higher number of jobs generated, but also higher wages paid to those workers (Oi and Idson 1999). Thus, constraints to the growth of enterprises will have adverse impacts on the growth of productivity and wages received by workers.
In an earlier report on enterprises in the Asian region, the Asian Development Bank (2009)
found that most firms in the region’s developing economies are still very small. In most of the economies surveyed, the majority of firms is small and employs less than fifty people. In some countries, such as India, Indonesia, and the Philippines, small establishments accounted for more than 90% of all firms (Figure 1). The prevalence of small firms can be attributed to two main reasons. First, in economies where structural change is just beginning to shift workers away from agriculture, firms in both manufacturing and services are naturally younger, and hence typically smaller. In other cases, endemic institutional features might favor large state-owned enterprises or other large domestic private interests, thereby constructing real constraints to the entries of new firms and to the expansion of existing small firms, and keeping the average size of firms within the economy small. This latter artificial smallness of firms may be alleviated, should the right policies be introduced to address the binding constraints.
Figure 1: Share of Total Establishments by Enterprise Size-Groups (%)
Source: ADB (2009). Figure 3.4, p. 28.
The other finding is that the patterns of employment across size distribution vary across
economies (Figure 2). Here, the report described three patterns: (i) the missing middle, characterized by pronouncedly low levels of employment in middle-sized firms, (ii) the increase-with-scale, where
020
4060
8010
0
Shar
e o
f to
tal e
stab
lish
men
ts b
y en
terp
rise
siz
e
9–49 50–199 200+
Shar
e o
f to
tal e
stab
lish
men
ts b
y en
terp
rise
siz
e
5–49 50–199 200+
Shar
e o
f to
tal e
stab
lish
men
ts b
y en
terp
rise
siz
e
5–49 50–199 200+
Shar
e o
f to
tal e
stab
lish
men
ts b
y en
terp
rise
siz
e
5–49 50–199 200+
020
4060
8010
0
020
4060
8010
00
2040
6080
100
020
4060
8010
00
2040
6080
100
020
4060
8010
00
2040
6080
100
Shar
e o
f to
tal e
stab
lish
men
ts b
y en
terp
rise
siz
e
5–49 50–199 200+
Shar
e o
f to
tal e
stab
lish
men
ts b
y en
terp
rise
siz
e
5–49 50–199 200+
Shar
e o
f to
tal e
stab
lish
men
ts b
y en
terp
rise
siz
e
5–49 50–199 200+
Shar
e o
f to
tal e
stab
lish
men
ts b
y en
terp
rise
siz
e
16–50 51–200 >200
China, People’s Republic of India Indonesia Korea, Republic of
Malaysia Philippines Taipei,China Thailand
Enterprises in the Philippines: Dynamism and Constraints to Employment Growth | 3
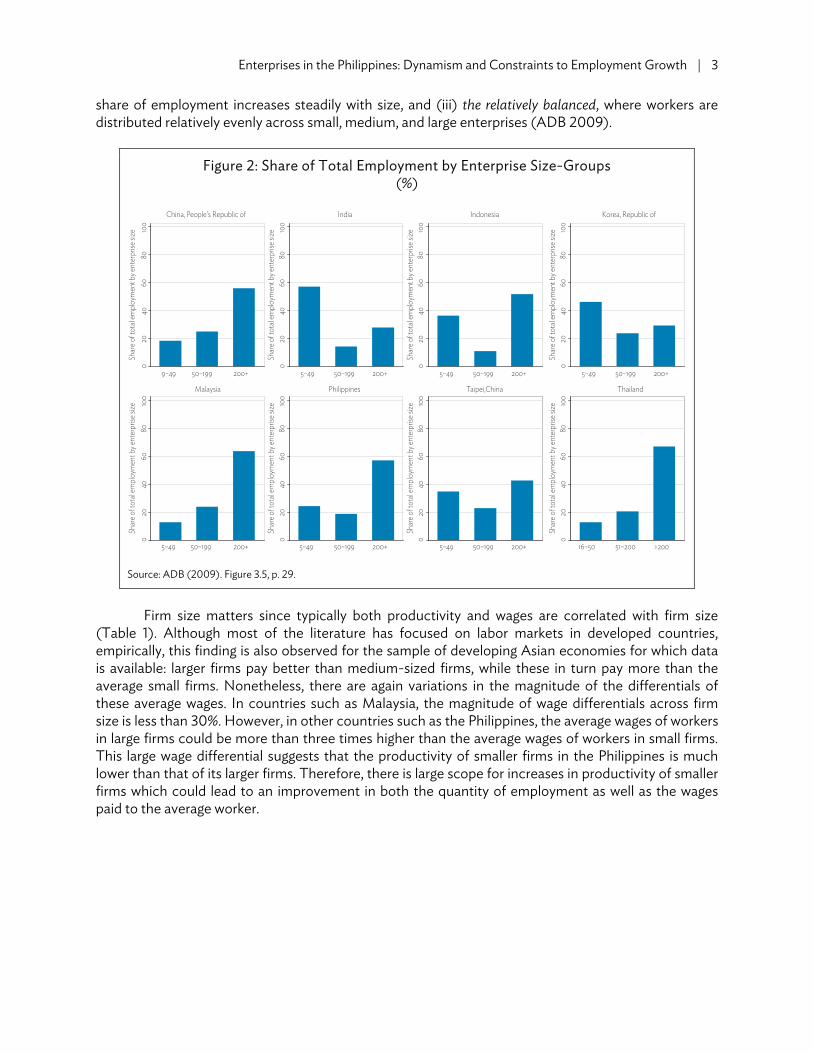
share of employment increases steadily with size, and (iii) the relatively balanced, where workers are distributed relatively evenly across small, medium, and large enterprises (ADB 2009).
Figure 2: Share of Total Employment by Enterprise Size-Groups (%)
Source: ADB (2009). Figure 3.5, p. 29.
Firm size matters since typically both productivity and wages are correlated with firm size
(Table 1). Although most of the literature has focused on labor markets in developed countries, empirically, this finding is also observed for the sample of developing Asian economies for which data is available: larger firms pay better than medium-sized firms, while these in turn pay more than the average small firms. Nonetheless, there are again variations in the magnitude of the differentials of these average wages. In countries such as Malaysia, the magnitude of wage differentials across firm size is less than 30%. However, in other countries such as the Philippines, the average wages of workers in large firms could be more than three times higher than the average wages of workers in small firms. This large wage differential suggests that the productivity of smaller firms in the Philippines is much lower than that of its larger firms. Therefore, there is large scope for increases in productivity of smaller firms which could lead to an improvement in both the quantity of employment as well as the wages paid to the average worker.
020
4060
8010
0
Shar
e o
f to
tal e
mp
loym
ent b
y en
terp
rise
siz
e
9–49 50–199 200+
Shar
e o
f to
tal e
mp
loym
ent b
y en
terp
rise
siz
e
5–49 50–199 200+
Shar
e o
f to
tal e
mp
loym
ent b
y en
terp
rise
siz
e
5–49 50–199 200+
Shar
e o
f to
tal e
mp
loym
ent b
y en
terp
rise
siz
e
5–49 50–199 200+
020
4060
8010
0
020
4060
8010
00
2040
6080
100
020
4060
8010
00
2040
6080
100
020
4060
8010
00
2040
6080
100
Shar
e o
f to
tal e
mp
loym
ent b
y en
terp
rise
siz
e
5–49 50–199 200+
Shar
e o
f to
tal e
mp
loym
ent b
y en
terp
rise
siz
e
5–49 50–199 200+
Shar
e o
f to
tal e
mp
loym
ent b
y en
terp
rise
siz
e
5–49 50–199 200+Sh
are
of t
ota
l em
plo
ymen
t by
ente
rpri
se s
ize
16–50 51–200 >200
China, People’s Republic of India Indonesia Korea, Republic of
Malaysia Philippines Taipei,China Thailand

4 | ADB Economics Working Paper Series No. 334
Table 1: Average Annual Wages in 2005 dollars, by Enterprise Size2
Developing Member Economies Small Medium Large Korea, Rep. of 17,230 22,272 34,560Taipei,China 12,629 15,506 22,576Malaysia 4,134 4,844 5,574Thailand 1,159 1,452 1,629China, People’s Rep. of 1,144 1,315 1,898Philippines 1,074 2,325 3,163India 587 1,361 2,699Indonesia 557 1,413 1,714
Source: ADB (2009). Table 3.2, p. 29.
A. The Economy and Employment in the Philippines
Two of the notable features of economic growth in the Philippines in the past 3 decades are the slow growth in the 1980s and the increasing dominance of the service sector. Unlike most other developing economies in Southeast Asia, the service sector in the Philippines accounted for almost half of total value added produced in the country since the 1990s. In contrast, the manufacturing sector accounted for only approximately a quarter of total value added in 1980s, and its relative share shrank to about 24% in the 2000s (Table 2).
As the country emerged from the transitional post-Marcos years, the aggregate economy
began to grow again. From the lackluster decade of the 1980s, with an average 1.66% annual growth rate, the average annual growth rate increased to 2.78% and then 4.56% each in the subsequent decade. Although the primary, secondary, and tertiary sectors all grew throughout these years, the service sector posted the highest growth rates, reaching 5.5% annual growth from 2000 to 2009. In contrast, there seems to be very little movement of resources in the shrinking manufacturing industry. The average annual growth rate for the manufacturing sector was 3.46%, which is lower even than that posted in the agricultural sector.
2 Small: 5–49 workers for all countries except the PRC (9–49 workers) and Thailand (16–50 workers). Medium: 50–199
workers except Thailand (51–200 workers). Large: 200 or more workers for all countries except Thailand (more than 200).

Enterprises in the Philippines: Dynamism and Constraints to Employment Growth | 5
Table 2: Average Value Added Growth Rates
Average Annual Growth Rates Average Shares 1981–1989 1990–1999 2000–2009 1980–1989 1990–1999 2000–2009
Agriculture, Fishery, and Forestry 1.26 1.49 3.48 23.49 21.59 19.21
Industry Sector 0.43 2.48 3.86 37.63 35.02 33.25 Mining and quarrying 3.03 –1.45 12.78 1.66 1.35 1.55 Manufacturing 0.88 2.33 3.46 25.92 25.07 23.83 Construction –1.42 2.91 4.39 7.47 5.56 4.66 Electricity, gas, and water 5.32 5.34 3.65 2.58 3.05 3.21
Service Sector 3.26 3.71 5.52 38.88 43.39 47.54 Transport, storage and
communication 3.69 4.40 7.48 5.29 6.04 8.28 Trade 3.02 3.55 5.12 13.88 15.32 16.61 Finance 2.35 5.57 6.77 3.47 4.43 5.30 Real estate 2.45 2.16 3.31 5.40 5.48 4.73 Private services 5.48 3.60 6.77 6.28 6.97 8.10 Government services 3.18 3.63 2.66 4.57 5.16 4.53
Total GDP 1.66 2.78 4.56 100.00 100.00 100.00
Source: National Statistical Coordination Board. http://www.nscb.gov.ph The pattern of employment growth also mirrors that of the structure of production: by the
recent decade, service has replaced agriculture as the main source of employment for Filipino workers. The manufacturing industry has not been a dynamic source of employment to absorb new entrants to the labor force and those moving away from agriculture. Table 3 indicates that its share to total employment remained stagnant at 10% in the 1980s till the 1990s and this dropped to 9.4% in the 2000–2009 period. Meanwhile, the services sector is the most important provider of employment in the recent period with its average share increasing from 36% in the 1980s to 41% in the 1990s. Currently it accounts for an average share of almost 48.4%. Agriculture’s share in total employment dropped continuously from almost 50% in the 1980s to 43% in the 1990s and to 36% in the current period. While the share of agriculture has been declining, the sector has remained an important source of employment. The growth rate of employment is highest for services. At an annual average of 3.7%, the service sector is growing more than twice as rapidly as agricultural employment, and more than three times the industrial sector, which posted an anemic annual growth of 1.24%.

6 | ADB Economics Working Paper Series No. 334
Table 3: Employment Growth Rate and Structure
Economic Sector Average Growth Rate (%) Average Share (%)
1981–1989 1990–1999 2000–2009 1980–1989 1990–1999 2000–2009Agriculture, Fishery, and
Forestry 1.20 0.95 1.16 49.6 43.0 36.0 Industry 3.11 2.87 1.24 14.5 16.0 15.5Mining and quarrying 5.26 -3.63 5.75 0.7 0.5 0.4Manufacturing 2.53 1.95 0.52 9.9 10.1 9.4Electricity, gas, and water 5.71 5.71 0.38 0.4 0.4 0.4Construction 4.94 5.59 2.26 3.5 5.0 5.3 Services 4.78 3.88 3.72 35.9 41.0 48.4Wholesale and retail trade 6.19 3.57 6.25 12.5 14.5 20.8Transport, storage, and
communication 4.94 5.76 3.48 4.4 5.8 7.5 Finance, insurance, real
estate, and business services 3.20 6.25 7.29 1.8 2.2 3.3
Community, social, and personal services 4.05 3.33 1.23 17.1 18.4 16.8
Total Employment 2.74 2.44 2.38 100.0 100.0 100.0
Source: National Statistics Office. http://www.census.gov.ph Why should we be concerned that the service sector is providing the bulk of new employment
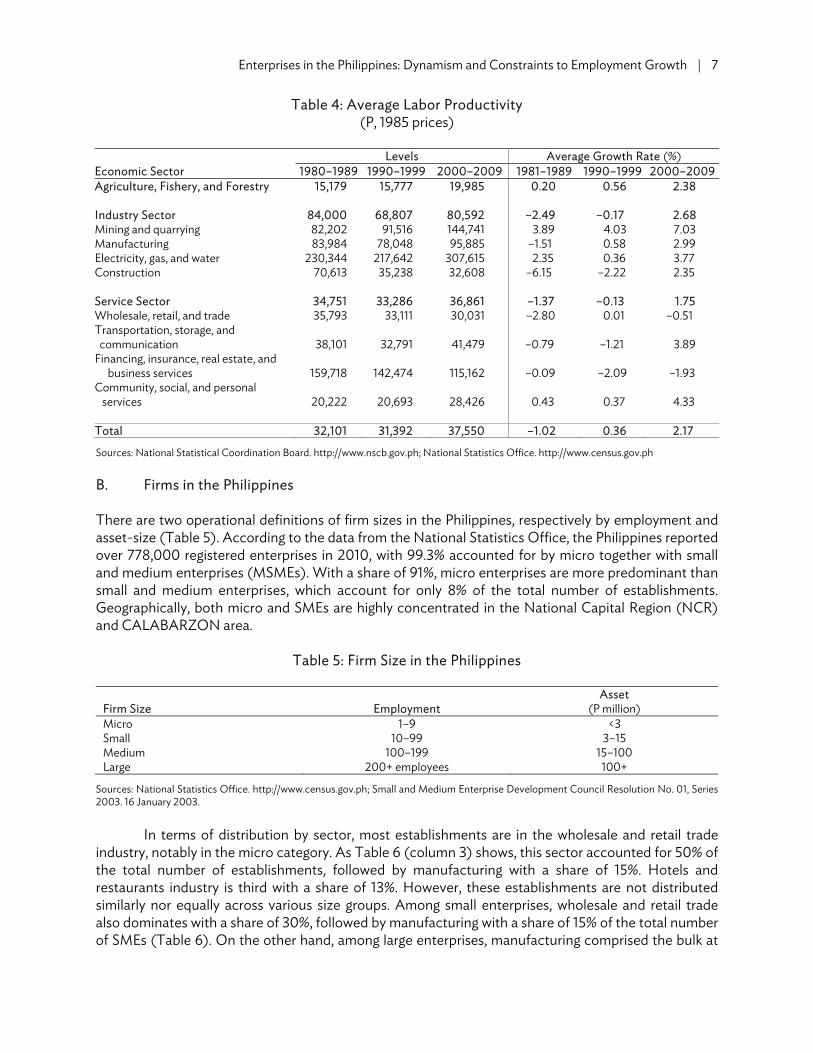
in the Philippines? A simple answer lies in the differences in the levels and trends in the productivity of labor across the different economic sectors from the 1980s to the current period. Table 4 shows that despite some hiccups in the 1980s, the average labor productivity in the Philippines is still highest in the industrial sector. Despite the decline from the 1980s to the 1990s, labor productivity improved in real terms throughout the 2000s as the sector registered an average labor productivity level of P80,592.
The results also indicate that these labor productivity disparities across the three main sectors
are wide and might remain so in the recent future. Labor productivity in the industrial sector is approximately two times that of the service sector, and four times that of agriculture. This differential persisted over the past three decades. In the past decade, the growth rate in the industrial sector is also the highest (at 2.68% per year), almost twice that of services (1.75%) and agriculture (2.38%).
In other words, the new jobs created in the Philippines in the recent decades has been
concentrated in the sector that has lower levels of labor productivity, and in which productivity growth is also unfortunately lower. As we shall see in the following discussion, data of firm sizes would also indicate that the service sector is dominated by much smaller firms.
Enterprises in the Philippines: Dynamism and Constraints to Employment Growth | 7
Table 4: Average Labor Productivity (P, 1985 prices)
Economic Sector Levels Average Growth Rate (%)
1980–1989 1990–1999 2000–2009 1981–1989 1990–1999 2000–2009Agriculture, Fishery, and Forestry 15,179 15,777 19,985 0.20 0.56 2.38 Industry Sector 84,000 68,807 80,592 –2.49 –0.17 2.68Mining and quarrying 82,202 91,516 144,741 3.89 4.03 7.03Manufacturing 83,984 78,048 95,885 –1.51 0.58 2.99Electricity, gas, and water 230,344 217,642 307,615 2.35 0.36 3.77Construction 70,613 35,238 32,608 –6.15 –2.22 2.35 Service Sector 34,751 33,286 36,861 –1.37 –0.13 1.75Wholesale, retail, and trade 35,793 33,111 30,031 –2.80 0.01 –0.51Transportation, storage, and communication 38,101 32,791 41,479 –0.79 –1.21 3.89 Financing, insurance, real estate, and
business services 159,718 142,474 115,162 –0.09 –2.09 –1.93 Community, social, and personal services 20,222 20,693 28,426 0.43 0.37 4.33 Total 32,101 31,392 37,550 –1.02 0.36 2.17
Sources: National Statistical Coordination Board. http://www.nscb.gov.ph; National Statistics Office. http://www.census.gov.ph
B. Firms in the Philippines
There are two operational definitions of firm sizes in the Philippines, respectively by employment and asset-size (Table 5). According to the data from the National Statistics Office, the Philippines reported over 778,000 registered enterprises in 2010, with 99.3% accounted for by micro together with small and medium enterprises (MSMEs). With a share of 91%, micro enterprises are more predominant than small and medium enterprises, which account for only 8% of the total number of establishments. Geographically, both micro and SMEs are highly concentrated in the National Capital Region (NCR) and CALABARZON area.
Table 5: Firm Size in the Philippines
Firm Size Employment Asset
(P million) Micro 1–9 <3 Small 10–99 3–15 Medium 100–199 15–100 Large 200+ employees 100+
Sources: National Statistics Office. http://www.census.gov.ph; Small and Medium Enterprise Development Council Resolution No. 01, Series 2003. 16 January 2003.
In terms of distribution by sector, most establishments are in the wholesale and retail trade
industry, notably in the micro category. As Table 6 (column 3) shows, this sector accounted for 50% of the total number of establishments, followed by manufacturing with a share of 15%. Hotels and restaurants industry is third with a share of 13%. However, these establishments are not distributed similarly nor equally across various size groups. Among small enterprises, wholesale and retail trade also dominates with a share of 30%, followed by manufacturing with a share of 15% of the total number of SMEs (Table 6). On the other hand, among large enterprises, manufacturing comprised the bulk at

8 | ADB Economics Working Paper Series No. 334
41% of the total number of large enterprises. The number of medium-sized enterprises is lowest among the four size groups.
Table 6: Number of Establishments, by Size and Industry, 2010
No. of Establishments
Total Micro Small Medium LargeNo. % No. % No. % No. % No. %
Agriculture, hunting, and forestry 3,954 0.5 2,622 0.4 1,092 1.76 115
4.1 125 4.1
Fishery 1,157 0.1 883 0.1 213 0.34 30 1.1 31 1.0 Mining and quarrying 420 0.1 233 0.0 146 0.24 15 0.5 26 0.9 Manufacturing 112,304 14.4 101,072 14.2 9,471 15.28 823 29.5 938 31.0 Electricity, gas, and water 1,416 0.2 504 0.1 685 1.11 118 4.2 109 3.6 Construction 2,416 0.3 1,284 0.2 883 1.42 125 4.5 124 4.1 Wholesale and retail trade 385,063 49.5 365,802 51.5 18,522 29.88 422 15.1 317 10.5 Hotels and restaurants 97,053 12.5 87,632 12.3 9,197 14.84 160 5.7 64 2.1 Transport, storage, and
communication 9,144 1.2 6,898 1.0 1,989 3.21 123
4.4 134 4.4 Financial intermediation 26,485 3.4 21,491 3.0 4,766 7.69 93 3.3 135 4.5 Real estate, renting, and
business activities 48,203 6.2 42,349 6.0 4,889 7.89 331
11.9 634 21.0 Education 14,144 1.8 7,583 1.1 6,079 9.81 268 9.6 214 7.1 Health and social work 31,667 4.1 30,030 4.2 1,407 2.27 110 3.9 120 4.0
Other community, social and personal service activities 44,261 5.7 41,516 5.8 2,640 4.26 53
1.9 52
1.7 Philippines 777,687 100.0 709,899 100.0 61,979 100.00 2,786 4.1 3,023 4.1 % of total 100.0 91.3 8.0 0.4 0.4
Source: National Statistics Office. http://www.census.gov.ph In terms of employment, large and micro establishments are the largest employers, followed by
small establishments. Here we clearly see the missing middle problem since the medium-sized enterprise fails to employ a significant share of the total workforce. Manufacturing and wholesale and retail trade are by far the largest employers, each accounting for almost a quarter of all workers. Next is the real estate, renting, and business activities sectors, which employs approximately 10% of all workers.
The earlier pattern of asymmetry in the distribution of establishments is also reflected in the
distribution of employment across establishment size: wholesale and retail would employ the most workers for MSMEs, while for large firms, the number of workers employed in the manufacturing far outstrips that of the other sectors (Table 7). In fact, a worker employed in manufacturing is almost three times more likely to work for large establishments than a micro one. In contrast, the opposite is true for wholesale and retail: workers are almost eight times more likely to work in a micro establishment than in large establishments.
One of the important implications of this relates to the average firm size across sectors. Even
though the majority of establishments in each sector are micro-sized, the average firm size varies across sectors, ranging from the smallest with 3.58 workers in wholesale and retail trade, to 11.7 in manufacturing, to the largest with 68.59 workers in electricity, gas, and water sectors. Overall, in the Philippines, the average establishment in 2010 employed 7.29 workers. In the next section, we examine the economic context and policy environment that could affect growth of these firms.

Enterprises in the Philippines: Dynamism and Constraints to Employment Growth | 9
Table 7: Employment Distribution by Size and Industry, 2010
Total EmploymentTotal Micro Small Medium Large
No. % No. % No. % No. % No. %Agriculture, hunting
and forestry 139,177 2.5 9,855 0.6 31,213 2.2 16,515 4.3 81,594 3.8 Fishery 27,717 0.5 3,408 0.2 5,705 0.4 4,377 1.1 14,227 0.7 Mining and quarrying 27,969 0.5 930 0.1 3,878 0.3 1,960 0.5 21,201 1.0 Manufacturing 1,303,044 23.0 259,204 15.0 244,156 17.2 114,274 29.6 685,410 32.1 Electricity, gas, and
water 97,015 1.7 2,608 0.2 20,924 1.5 17,086 4.4 56,397 2.6 Construction 143,296 2.5 5,305 0.3 27,781 2.0 17,391 4.5 92,819 4.3 Wholesale and retail
trade 1,376,949 24.3 816,095 47.2 364,164 25.7 57,658 14.9 139,032 6.5 Hotels and restaurants 502,551 8.9 233,525 13.5 224,963 15.9 21,180 5.5 22,883 1.1 Transport, storage, and
communications 198,562 3.5 26,161 1.5 49,399 3.5 16,671 4.3 106,331 5.0 Financial
intermediation 331,448 5.8 80,706 4.7 85,395 6.0 12,377 3.2 152,970 7.2 Real estate, renting, and
business activities 857,665 15.1 109,214 6.3 122,428 8.6 46,104 11.9 579,919 27.1 Education 322,496 5.7 31,516 1.8 154,515 10.9 37,695 9.8 98,770 4.6 Health and social work 158,861 2.8 51,006 2.9 35,240 2.5 15,615 4.0 57,000 2.7 Other community,
social and personal service activities 184,227 3.2 99,567 5.8 47,911 3.4 7,260 1.9 29,489 1.4
Philippines 5,670,977 100.0 1,729,100 100.0 1,417,672 100.0 386,163 100.0 2,138,042 100.0% of total employment 100.0 30.5 25.0 6.8 37.7
Source: National Statistics Office. http://www.census.gov.ph C. Trade and Industrial Policy Environment
The role of trade in generating economic growth in the region is very important and trade policy clearly has an impact on the dynamism of firms. Trade reforms in the Philippines started late, only in the early 1980s. Before then, the country’s trade structure was highly protective and restrictive, as well as counter-productive. From 1950s to the 1970s, protection was in the form of import substitution policies, e.g., import and foreign exchange controls, over-valued currency backed by protective tariffs, and quantitative restrictions. The government also introduced a number of fiscal, administrative, and regulatory policies that were intended to promote domestic industries. Among the fiscal incentives given included: accelerated depreciation, net operating loss carryover, tax exemption on imported capital equipment, tax credit on domestic capital equipment, tax credit for withholding tax on interest, and exemption from all revenue taxes except income tax. The Development Bank of the Philippines also introduced targeted lending together with entry restrictions on “crowded industries”. In the early stages, these instruments encouraged investments. However, Medalla (2002) argued that these only resulted to unintended negative results such as penalizing exports, restricting resource mobility, and encouraging rent-seeking behavior in the long run. Artificially cheap inputs and capital due to an import-dependent and import-substituting policy also hindered backward linkages and encouraged greater capital intensity among domestic industries (Aldaba et al. 2010).
Trade reforms undertaken between 1980s and the 1990s began to reduce tariff and remove
import quantitative restrictions. Since the first tariff reform program (TRP-I) initiated in 1981, three succeeding tariff reform programs were undertaken. TRP-I was put in place mainly to remove

10 | ADB Economics Working Paper Series No. 334
inefficient, excessive, and/or obsolete protection rates. The 5-year implementation of TRP-I significantly reduced the average nominal tariff and the high rate of effective protection. The number of regulated products decreased after the removal of import restrictions on 1,332 lines between 1986 and 1989 (Aldaba et al. 2010).
The second tariff reform program (TRP-II) launched in 1991 further trimmed down the overall
protection with the introduction of the new tariff code. Average nominal tariff further declined (from 28% to 20%), however, tariffs on sensitive agricultural products were retained at 50%.3
In 1994, the government initiated the third tariff reform program (TRP-III) through the
issuance of Executive Order (EO) 189. This marked the initial step of the government towards reducing the tariff spread and adopting a uniform protection across all sectors. Following this, the government issued a series of EOs during TRP-III implementation.4 During the TRP-III, average nominal tariff was reduced from 19.72% in 1994 to 13.43% in 1997. However, tariff protection for the agriculture sector was still higher than the overall tariff as a result of the protection given to sensitive agricultural products. The government also conducted a review to assess the impact of the pace of tariff reductions on the competitiveness of local industries, even out the pace of the tariff reduction schedule for deserving industries and fix the remaining tariff structure distortions, if any. TRP-IV or the fourth tariff reform program was initiated through this review. A tariff recalibration scheme was adopted which put in place a more flexible 8-tier tariff structure of 3%–5%–7%–10%–15%–20%–25%–30% instead of the 4-tier structure implemented under TRP-II and TRP-III.5
However, the huge budget deficit recorded in 2002 prompted the government to re-consider
the tariff liberalization policies and programs in place in order to help critical industries. As a result, the government slowed down the tariff reduction schedules in 2003. 6
Nonetheless, all these reforms have lowered tariffs significantly from their levels 2 decades
ago. The Tariff Commission (2010) reported that the overall average nominal tariff further dropped to 7.02% in 2010. Agriculture still has the highest average nominal tariff with 11.94%, manufacturing with 6.18%, and mining with 2.28%. About 60% of the total tariff lines are clustered around the 0%–3% tariff level while 34% are at the 7%–15% level.
3 Under the TRP-II, quantitative restrictions for 153 agricultural products were converted into tariffs and tariffs for 48
commodities were re-aligned (http://www.tariffcommission.gov.ph/tariff1.html). 4 EO 264 outlined the tariff modifications of industrial products. The tariff reductions on non-sensitive agricultural
products not previously covered by quantitative restrictions were covered by EO 288. Sensitive agricultural products were given temporary protection under EO 313, following the removal of import restrictions as part of the country’s commitment under the WTO (http://www.tariffcommission.gov.ph/tariff1.html).
5 EO 465 enacted in January 1998 outlined the modified tariff schedules for 22 industries identified based on the actual and potential global competitiveness, employment, and inter-industry linkages of these industries. These 22 industries dubbed as “Philippine Winners” include: copper products, fertilizer, motor vehicle parts and components, iron and steel products, jewelry, electronics, ceramics, marble products, marine products, processed foods, petrochemical and oleochemical products, leather goods, footwear, lumber, particle board, fiberboard, veneer and plywood, textiles and garments, basketwork, seaweeds and carageenan, holiday décor, furniture, and fresh fruits. EO 486 issued after EO 465 in July 1998 contained the re-calibrated tariff schedules for the residual items and reduced the tariff lines subject to tariff quotas to 144. EO 334 issued on January 2001 presented the implementation of a tariff band of 0%–5% by 2004, excluding a limited range of sensitive agricultural products with a 30% tariff rate in 2004 (http://www.tariffcommission .gov.ph/tariff1.html).
6 A series of EOs were also issued to either maintain the existing tariff rates of those which were scheduled for reduction or increase the protection on selected products, mainly in agriculture. In 2007, pursuant to EO 574, the overall average nominal tariff was 7.82%, with agriculture at 11.82%, mining at 2.47%, and manufacturing at 7.32% (http://www.tariffcommission.gov.ph/tariff1.html).

Enterprises in the Philippines: Dynamism and Constraints to Employment Growth | 11
The Philippines participated in several initiatives, including signing free trade agreements, in an
effort to further promote trade and investment in the country and to facilitate integration with the global economy. To date, the Philippines has signed seven FTAs which were mostly through the ASEAN channel. These include: ASEAN Free Trade Area (AFTA), ASEAN-Australia and New Zealand Free Trade Agreement, ASEAN-India Comprehensive Economic Cooperation Agreement, ASEAN-Japan Comprehensive Economic Partnership, ASEAN-Republic of Korea Comprehensive Economic Cooperation Agreement, ASEAN-People's Republic of China Comprehensive Economic Cooperation Agreement, and the Japan-Philippines Economic Partnership Agreement. Negotiations were already launched for two FTAs namely the Regional Comprehensive Economic Partnership and the ASEAN-EU Free Trade Agreement, while an additional seven FTAs are being proposed and studied: Pakistan-Philippines Free Trade Agreement; Philippines-Taipei,China Economic Cooperation Agreement; United States-Philippines Free Trade Agreement; ASEAN-Hong Kong, China Free Trade Agreement; ASEAN-Pakistan Free Trade Agreement; Comprehensive Economic Partnership for East Asia (CEPEA/ASEAN+6); and East Asia Free Trade Area (ASEAN+3).7
In recent years, trade reforms were driven mostly by the country’s FTA commitments,
particularly the AFTA. The Philippines reduced all tariffs to 0%–10% with the exception of highly sensitive agriculture products like rice under the ASEAN Trade in Goods Agreement. Under the PRC–ASEAN FTA (CAFTA): (1) tariffs on 90% of the products ranging from textiles to rubber, vegetable oil, and steel will be eliminated between the PRC and ASEAN 6; (2) import duties on 6682 Chinese products will be removed; and (3) average tariffs will be reduced from 9.8% in ASEAN and 12.8% in the PRC to 0.6%. 8
D. Investment Policy
Fully aware that the country needed to compete strongly against its regional neighbors in order to attract much needed foreign direct investments (FDI), the authorities gradually loosened the country’s foreign investment policies and crafted a less cumbersome regulatory system. Some of the key measures are as follows:
• Republic Act (RA) 7042 or the Foreign Investment Act (FIA) was passed in June 1991. The Law, which laid out the new FDI governing rules, was essentially directed to jumpstart government’s liberalization efforts. It allowed foreign participation of up to 100% in economic segments not included in the Foreign Investment Negative List (FINL) without having to go through a bureaucratic approval process, which was previously carried out by the Board of Investments (BOI) (whenever foreign equity in a company exceeds 40%).
• RA 7721, otherwise known as the 1994 Foreign Bank Liberalization passed in May 1994, permitted the entry of 10 new foreign banks in the Philippine market. This served as a lead-up to the passage of the General Banking Law (GBL) in April 2000 (RA 8791). The GBL was the first major legislation that altered the structure and regulation of the Philippine banking system since the signing of The Central Bank Act (RA 265) in June 1948. Upon the effectivity of GBL,
7 See http://aric.adb.org/fta-country 8 Highly sensitive (e.g., hams, onions, garlic, cauliflowers, broccoli, carrots, turnips, cassava, sweet potatoes, rice, cane sugar,
shutters, blinds, petrochemicals, hygienic, medical and surgical articles, motorcycles, motor vehicles and parts) and sensitive products (e.g., pepper, ginger, cornstarch, carpets, stockings, hosiery, girdles, blankets, table linen, footwear, buses, sound signaling equipment, ignition wiring sets, and other car parts) are still temporarily shielded from Chinese competition.
12 | ADB Economics Working Paper Series No. 334
foreign banks were given the privilege to own 100% of one locally-incorporated commercial or thrift bank with no strict divestiture clause.
• RA 7042 was amended in March 1996 through the legislation of RA 8179. Basically, the amendment trimmed down the FINL. It had 3 tiers prior to the enactment of this new Law namely, list A, B, and C. What the Law abolished was list C, which is characterized as the “adequately served” sectors.
• Retail Trade Liberalization Law (RA 8762) was passed in March 2000. RA 8762 fully opened the doors of the retail business segment for foreign investors to enter. Full ownership of an establishment was mainly anchored on the condition that foreign parties place a minimum of $250,000 in high-end or luxury products and $7.5 million minimum equity in other industries. Rice and corn trade were included in the list of new enterprises that foreign investors can enter.
On top of these, the government maintained some salient features of the Omnibus
Investments Code (OIC) of 1987 that gave BOI as well as the economic zone regulatory authorities, such as the Philippine Economic Zone Authority (PEZA), Subic Bay Metropolitan Authority (SBMA), Clark Development Authority (CDA), and other similar agencies, the leeway to grant fiscal and non-fiscal incentives.
Legal provisions governing ownership of a large chunk of vital industries nevertheless remained
untouched, thus, keeping the cap on foreign interests. Mass media, for instance, was kept a purely Filipino enterprise whereas land ownership, natural resources, firms that supply to government-owned corporations or agencies, public utilities, and Build-Operate-Transfer (BOT) projects all had a ceiling of 40% foreign equity. The 8th Foreign Investment Negative List released in February 2010 did not differ substantially from the previous List (7th issued in December 2006).
Currently, according to the Basic Facts for Investors note of the BOI, the most common fiscal
incentive given is the provision of income tax holidays ranging from 4 years to 6 years.9 Other fiscal incentives include: tax credit for taxes and duties on raw materials, deduction of labor expenses from taxable income; exemption from taxes and duties on imported supplies and spare parts for consigned equipment; and exemption from wharfage dues and any export tax, duty free and impost. Non-fiscal incentives being offered include: access to bonded manufacturing/trading warehouse schemes; simplification of customs procedures (both import and export), importation of consigned equipment, and employment of foreign nationals (including visa assistance).
While these incentives help in attracting foreign investments, a study by Reside (2006) found
that many of the fiscal incentives were redundant. Even without many them, investors would still have invested in the Philippines. The cost associated with these redundant incentives amounted to P43.2 billion in 2004, and this was only for those investments handled by the BOI alone.
However, even with the FIA, foreigners are still not allowed to own land in the Philippines and
under the constitution, companies must be at least 60% Filipino owned. According to Sicat (2005),
9 Promotion of investments and administration of incentives under the OIC are being led by the Board of Investments
(BOI). Each year, the Investment Priorities Plan (IPP) of BOI identifies the preferred investment areas. Filipino-owned enterprises can still avail of the incentives even if their investment areas are not listed in the IPP if at least 50% of production is for exports. For majority foreign-owned enterprises, or those with more than 40% foreign equity, at least 70% of production should be for exports to avail of the incentives. The previous investment laws were simplified and consolidated, following the enactment of the new Omnibus Investment Code in 1987 (http://www.boi.gov.ph).

Enterprises in the Philippines: Dynamism and Constraints to Employment Growth | 13
these constitutional provisions greatly hinder the productivity and the economic development of the country.
E. SME Policies
RA 6977 of the Magna Carta for Small Enterprises in 1991 was considered as one of the most important legislation enacted by Congress for SMEs. This landmark legislation enabled the establishment of the Small and Medium Enterprise Development (SMED) Council whose main functions were to oversee and coordinate all efforts to promote SMEs. By law, all government programs for the promotion and development of SMEs shall be consolidated under a unified institutional framework.
Access to finance was one, if not the most pressing problem faced by SMEs. To address this problem, the Magna Carta mandated all lending institutions to set aside a portion of their total loan portfolio for SMEs: 5% by the end of the year of effectivity, 10% by the end of the second and fifth year, 5% by the end of the sixth year, and possibly zero by the end of the seventh year. The Magna Carta was later amended in 1997. Under the amendment , all lending institutions shall set aside at least 6% for small enterprises and at least 2% for medium enterprises.
The Magna Carta enabled the creation of the Small Business Guarantee and Finance Corporation (SBGFC), to tackle the finance-related needs of SMEs by offering alternative modes of financing such as direct and indirect project lending, venture capital, financial leasing, secondary mortgage and/or rediscounting of loan papers to small businesses, and secondary/regional stock markets. Under EO 28, the SBGFC was later merged with the Guarantee Fund for Small and Medium Enterprises (GFSME) in 2001 to create the Small Business Corporation (SBC). This move aimed at establishing a more effective financial institution that caters to SMEs. By 2009, SBC has a total lending portfolio of over 3 billion and over 10,000 clients and 125 partner financial institutions in 65 provinces in the country.10
Assistance to micro-enterprises and the informal sector was made possible through the amendment of RA 6977 or Barangay Micro Business Enterprises or BMBE Act in 2002. Support was in the form of incentives to local government registered barangay microenterprises, exemption from income tax and minimum wage payments, reduction in local taxes, and financial support and technological assistance from relevant government agencies (Aldaba, 2012).
In 2004, the 2004–2010 SME Development Plan was launched. Three strategies were laid out
in order to create globally competitive SMEs: (i) improving the operations of individual SMEs through the enhancement of managerial and technological capabilities and the identification and development of business opportunities; (ii) assisting priority industries, such as those active in the international markets, by enhancing their competitiveness and improving their domestic market access; and (iii) improving the SME operational environment.11
In 2008, RA 9501 or the Magna Carta for MSMEs was passed. The more important features of
this bill include the expansion of MSME definition to include micro-enterprises and the increase of the mandatory allocation of credit resources to MSMEs from 8% to 10% for the next 10 years.
10 Small Business Corporation. http://www.sbgfc.org.ph/index.php?option=com_content&view=article&id=2&Itemid=4 11 Department of Trade and Industry. http://www.dti.gov.ph/dti/index.php?p=51
14 | ADB Economics Working Paper Series No. 334
Recently, the Department of Trade and Industry launched the 2011–2016 MSME Development Plan, which aims to address the critical constraints and challenges in the development of the MSMEs. The plan outlines four outcome portfolios: Business Environment (BE); Access to Finance (A2F), Access to Markets (A2M), and Productivity and Efficiency (P&E). Through these, by 2016, the MSME sector would have contributed 40% of total value added and have generated around 2 million jobs (DTI 2011).
III. ANALYTICAL FRAMEWORK
A. Literature Survey
The literature on the distribution of firm size stretched back to almost 80 years back to the famous Gibrat’s Law, which predicted that the distribution of log of firm size in a country would follow a normal distribution.12 Obviously, empirical investigations of the distribution of firm size would be shaped by both theory and data availability. The results of earlier research in 1950s and 1960s based on country or industry-specific cross-sectional data seemed to suggest the validity of Gibrat’s Law, however, more recent works based on micro-level data suggested a more nuanced view of the predetermination of optimal firm size (see Sutton 1997 for a summary of the debate).
In particular, studies have found that both industrial and institutional characteristics and their
relevant distortions all influence market structure, and hence firm size. Kumar, Rajan, and Zingales (1999) investigate these various hypotheses using data on firm size-distribution for all economic sectors in the European Union and the European Free Trade Agreement countries. They examined the impact of judicial efficiency with three models: cross-industry, cross-country, and that of industry-country interaction terms. At the industry level, their findings suggest that market size, capital intensity, high sectoral wages, and research and development (R&D) intensity are all positively correlated with firm size. In Sweden, as Henrekson and Johansson (1999) found out, institutional factors affect the size distribution of firms. The Swedish tax system, credit market regulations, national pension system, employment security laws, wage setting institutions, and public sector monopolization all hindered the growth of small firms resulting to very few medium-sized (10–99) firms.
In another rigorous study, Cabral and Mata (2003) used a panel data set of Portuguese
manufacturing firms, to derive some stylized facts concerning the evolution of firm-size distribution and to propose a theoretical explanation concerning financing constraints. Their novel contribution is to focus on longitudinal data and the cohort patterns of firm-size distribution. Their two main empirical findings are: (i) distribution of the logarithms of firm size of a given cohort is rather skewed to the right and gradually evolves towards a more symmetric distribution consistent with a log normal
12 Gibrat (1931) argues that, not unlike many skewed distributions found in biology, evolution of firm size follows a
mathematical formula. More specifically, the logarithm of firm size is distributed normally as a result of a large number of small independent additive influences. Letting xt be firm size at time t, and εt a random variable, the evolution of firm size could be described thus: xt - xt-1 = εtxt-1
if we assume that εt is small enough, taking the logarithm and approximating the above equation gives the following: log xt ≈ log x0 + ε1 + ε2 +….+εt
if the incremental coefficients εt are independent over time and distributed N(m, σ2), then over t time periods, the log of firm size is distributed normally as well, following N(mt, σ2t). As described by the comprehensive literature survey by Sutton (1997) on Gibrat's legacy, this "Law of Proportional Effect" captivated many researchers in its simplicity and ease of testability. The first hypothesis simply asks whether the growth of firm is related to firm size. The second testable hypothesis investigates whether the log of firm size does follow a normal distribution.
Enterprises in the Philippines: Dynamism and Constraints to Employment Growth | 15
distribution; while (ii) total firm size distribution, is fairly stable over time, and not log normal. They also predicted that the size distribution changes to a more symmetric one for the reason that the extent of financing constraints should be eased as firms get older.
Size also matters when it comes to legal, corruption, and financial constraints. Beck, Demirgüç-
Kunt, and Maksimovic (2005) used firm-level data to assess how financial, legal, and corruption obstacles affect the growth of firms, and whether the effect differs between size groups. Results show that all the three obstacles have a negative effect on firm growth and that small firms are constrained the most.
The work closest in spirit to our paper is that by Ayyagari, Demirgüç-Kunt, and Maksimovic
(2008). Using the full set of World Bank Enterprise Survey (WBES) data, they seek to disentangle the various types of constraints. A huge issue with self-reported subjected data is exactly the subjective nature of the answers. They point out that what are reported as severe constraints might turn out to be non-binding constraints, and vice versa. Yet, there is not much theoretical ground on which one can proceed to disentangle the various types of constraints. As a result, most studies typically discuss various constraints (such as inefficient financial markets, inadequate protection of property rights, poor infrastructure, inefficient regulation and taxation, and broader governance issues) without any comparative evidence on their ordering. To remedy this, they use Directed Acyclic Graph (DAG) Methodology to complement regression methods, and find that only obstacles related to finance, crime, and political stability directly affect the growth rate of firms.
Rajan and Zingales (1998) investigate the relationship between financial development and the
cost of external finance to firms. They find that as financial markets develop, firms requiring more external financing benefit more. Firms in industries that are relatively more dependent on external financing grow faster in countries that are better developed financially.
B. Constraints to Firms’ Growth in the Philippines
What constrains growth of firms in the Philippines? As often reported by studies on SMEs in the Philippines (FINEX and ACERD 2006, Tecson 2004, Fukumoto 2004, Hapitan 2005), access to financing is perhaps the most challenging constraint being faced by SMEs. Availability of funds per se seemed to be not a problem as the law provides sufficient funds for SMEs, and there are government agencies offering loans, at least in theory. The greater problem lies in the capacity of SMEs to access the available funds. Banks are reluctant to give out loans to SMEs for a number of reasons as pointed out by Aldaba et al. (2010): SMEs lack track record, financial statements and business plans needed for loan assessment; SMEs have very limited collateral; and a larger number of smaller accounts prove to be burdensome to some private banks.
Employment of poor or low-level technology remains rampant among SMEs and this leads to
inconsistent product quality, low productivity, and lack of competitiveness. High costs prevent SMEs from investing in business standards like the ISO series. In addition, there are very few, if at all, common support facilities (i.e., testing centers and standardization agencies) for SME products. Supply chain management is also a constraint, starting from accessing raw materials to processing, packaging, and finally to distribution. There are also limited backward linkages between SMEs and large domestic and multinational corporations (Aldaba et al. 2010).

16 | ADB Economics Working Paper Series No. 334
Turning to firm-level data, each of the two rounds of the WBES asks the firms the degree of obstacle they encounter given a particular investment constraint. Figure 3 shows the list of constraints in the 2003 and the 2009 surveys.
In 2003, according to firms’ average responses, the top five constraints are macroeconomic
instability, corruption, tax rates, electricity, and economic and regulatory policy uncertainty. Surprisingly, access to financing ranked very low, with only 57% of the sample firms reporting they are constrained. The top responses also did not vary significantly when one analyzed the firm responses by size-groups. The top five constraints in 2009 based on firms average responses are: tax rates, anti-competitive or informal practices, corruption, tax administration, and political instability.13
Figure 3 also shows how the firms’ responses have changed over 6 years, from 2003 to 2009.
One obvious finding is that generally, the sample firms are complaining less or the degree of obstacle on average has declined. Most notable declines in average response were seen with crime, theft, and disorder; labor regulations; and electricity. However, the average degree of obstacle for access to financing did not improve significantly. In fact, the decline in average response was lowest for access to financing.
Figure 3: Investment Climate Constraints and Firms’ Average Responses (2003 versus 2009)
* = not available, 0 = no obstacle, 1 = minor obstacle, 2 = moderate obstacle, 3 = major obstacle, 4 = very severe obstacle. Source: Authors’ tabulation based on WBES.
It is interesting to note that the top responses change when the firms were asked to choose the
top business environment constraint. Informal sector practices are the top constraint for 26.4% of the
13 For the 2009 survey, 3 obstacles were dropped while 2 new obstacles were added (political instability and courts). Two of
the obstacles that were dropped, macroeconomic instability and economic and regulatory policy uncertainty, were included in the top 5 obstacles in 2003 in terms of average responses. Had these two been included, then the top 5 obstacles in 2009 might have been a little different. Although, it is obvious that corruption and tax rates remain as two of the top 5 constraints perceived by the sample firms. In addition, any type of instability, whether political or macroeconomic, is viewed as a greater obstacle than others.
0 .5 1 1.5 2
2003
TelecommunicationsAccess to land
Access to financingSkills and education of available workers
Business licensing and permitsTransportation
Customs and trade regulationsCost of financingLabor regulations
Anti-competitive or informal practicesTax administration
Crime, theft, and disorderEconomic and regulatory policy uncertainty
ElectricityTax rates
CorruptionMacroeconomic instability
Courts*Political instability*
0 .5 1 1.5 2
2009
Telecommunications*Access to land
Access to financingSkills and education of available workers
Business licensing and permitsTransportation
Customs and trade regulationsCost of financing*Labor regulations
Anti-competitive or informal practicesTax administration
Crime, theft, and disorderEconomic and regulatory policy uncertainty*
ElectricityTax rates
CorruptionMacroeconomic instability*
CourtsPolitical instability

Enterprises in the Philippines: Dynamism and Constraints to Employment Growth | 17
sample firms, while 14% responded access to finance as the top constraint. Tax rates remain one of the top constraints as well as political instability. Electricity seemed to be a major constraint also, with more than 11% of the sample reporting this as their biggest constraint (Figure 4).
Figure 4: Top 10 Business Environment Constraints
Source: Authors’ tabulation based on WBES.
IV. DATA AND EMPIRICAL RESULTS A. Measuring Constraints to Growth Given our interest in the function of firms in generating employment, we define growth rates as the changes in the level of employment in firm i between two time periods, s and t: = ,, (4.1)
As discussed in Ayyagari, Demirgüç-Kunt, and Maksimovic (2008), there is no clear theoretical framework in the literature to differentiate the ordering of these various constraints. Thus, to proceed with this empirical exercise, we begin with a parsimonious model to investigate factors that materially affect the growth of firms. We model the probability of firm i's expansion using a univariate binary model: Pr( > 0| ) = ( ) (4.2) where we assume that takes the values 0 or 1 depending on whether the firm has expanded, is a known distribution function, is a known non-stochastic vector, and is a vector of unknown parameters. Assuming that is the standard normal distribution function, then the likelihood function of the model is given by:
0 5 10 15 20 25 30
Inadequately educated workforceCustoms and trade regulation
Crime, theft, and disorderCorruption
Licenses and permitsPolitical instability
ElectricityTax rates
Access to financePractices of informal sector
% of sample firms
18 | ADB Economics Working Paper Series No. 334
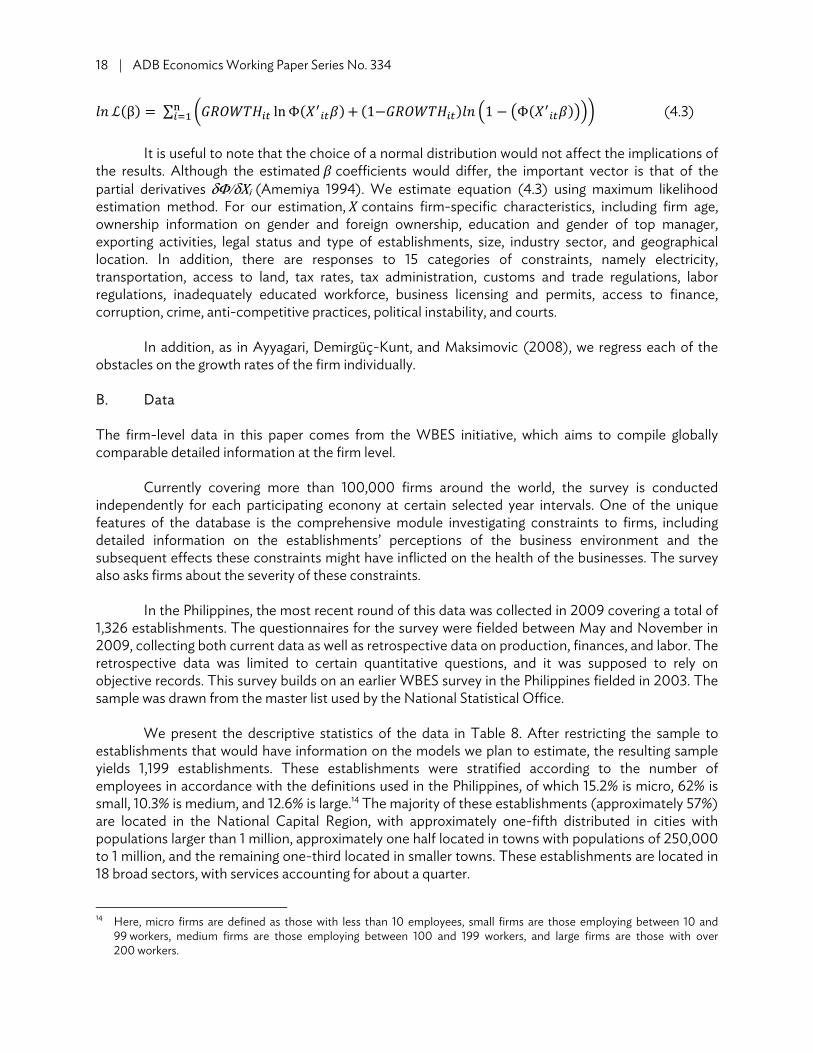
ℒ(β) = ∑ ln Φ( ) + (1− ) 1 − Φ( ) (4.3)
It is useful to note that the choice of a normal distribution would not affect the implications of the results. Although the estimated coefficients would differ, the important vector is that of the partial derivatives δΦ/δXi (Amemiya 1994). We estimate equation (4.3) using maximum likelihood estimation method. For our estimation, contains firm-specific characteristics, including firm age, ownership information on gender and foreign ownership, education and gender of top manager, exporting activities, legal status and type of establishments, size, industry sector, and geographical location. In addition, there are responses to 15 categories of constraints, namely electricity, transportation, access to land, tax rates, tax administration, customs and trade regulations, labor regulations, inadequately educated workforce, business licensing and permits, access to finance, corruption, crime, anti-competitive practices, political instability, and courts.
In addition, as in Ayyagari, Demirgüç-Kunt, and Maksimovic (2008), we regress each of the obstacles on the growth rates of the firm individually. B. Data The firm-level data in this paper comes from the WBES initiative, which aims to compile globally comparable detailed information at the firm level.
Currently covering more than 100,000 firms around the world, the survey is conducted
independently for each participating econony at certain selected year intervals. One of the unique features of the database is the comprehensive module investigating constraints to firms, including detailed information on the establishments’ perceptions of the business environment and the subsequent effects these constraints might have inflicted on the health of the businesses. The survey also asks firms about the severity of these constraints.
In the Philippines, the most recent round of this data was collected in 2009 covering a total of
1,326 establishments. The questionnaires for the survey were fielded between May and November in 2009, collecting both current data as well as retrospective data on production, finances, and labor. The retrospective data was limited to certain quantitative questions, and it was supposed to rely on objective records. This survey builds on an earlier WBES survey in the Philippines fielded in 2003. The sample was drawn from the master list used by the National Statistical Office.
We present the descriptive statistics of the data in Table 8. After restricting the sample to
establishments that would have information on the models we plan to estimate, the resulting sample yields 1,199 establishments. These establishments were stratified according to the number of employees in accordance with the definitions used in the Philippines, of which 15.2% is micro, 62% is small, 10.3% is medium, and 12.6% is large.14 The majority of these establishments (approximately 57%) are located in the National Capital Region, with approximately one-fifth distributed in cities with populations larger than 1 million, approximately one half located in towns with populations of 250,000 to 1 million, and the remaining one-third located in smaller towns. These establishments are located in 18 broad sectors, with services accounting for about a quarter.
14 Here, micro firms are defined as those with less than 10 employees, small firms are those employing between 10 and
99 workers, medium firms are those employing between 100 and 199 workers, and large firms are those with over 200 workers.

Enterprises in the Philippines: Dynamism and Constraints to Employment Growth | 19
Interestingly, women own 65.6% of these establishments, and almost a third of the
establishments reported having a woman as their top manager. There is, however, a high correlation between female ownership and female management, with almost 85% of all female managers working in female-owned establishments. While the percentage of female ownership remained roughly constant across size groups, the prevalence of female managers is more pronounced in micro-firms, where about 40% of the establishments are managed by women in contrast to only 16% in large establishments. In addition, most of the top managers are very well educated: more than 90% have a college degree or more.
The firms in the WBES sample are not young, especially compared to developed countries
where average life expectancy of new firms hovers around 5 years. The average age of these establishments is almost 20 years old, with the oldest firm reported beginning its operation more than a century ago in 1890. The majority of these establishments are domestically focused, with almost three quarters reporting that 100% of their sales happen domestically. However, about 21% are exporters, and 13% are jointly owned with a foreign company, and another 10.4% wholly foreign-owned. Not surprisingly, there is a high correlation between foreign ownership and exporting—almost two thirds of all joint ventures reported positive exports, and three quarters of wholly foreign-owned ventures are exporters.
Table 8: Descriptive Statistics for WBES 2009 Final Sample
Variables N Mean Standard Deviation Median Minimum Maximum
Employment growth = 1 1,199 0.302 0.459 0 0 1Age 1,199 19.753 13.848 16 2 119Age squared 1,199 581.797 915.283 256 4 14,161Female owner = 1 1,199 0.656 0.475 1 0 1Female manager = 1 1,199 0.296 0.457 0 0 1Exporter = 1 1,199 0.209 0.406 0 0 1Jointly owned by foreign company = 1 1,199 0.134 0.341 0 0 1Wholly owned by foreign company = 1 1,199 0.104 0.306 0 0 1 Top Manager’s Education
Primary school 1,199 0.014 0.118 0 0 1Secondary school 1,199 0.048 0.213 0 0 1Vocational training 1,199 0.028 0.164 0 0 1University degree 1,199 0.737 0.440 1 0 1Graduate degree from a university in Philippines 1,199 0.108 0.310 0 0 1Graduate degree from a university abroad 1,199 0.054 0.227 0 0 1Type of Establishment HQ without production and/or sales in this
location 1,199 0.011 0.104 0 0 1 HQ with production and/or sales in this location 1,199 0.038 0.192 0 0 1Establishment physically separated from HQ and
other establishments of the same firm 1,199 0.047 0.211 0 0 1 Establishment physically separated from HQ but
with other establishments of the same firm 1,199 0.003 0.050 0 0 1 continued on next page

20 | ADB Economics Working Paper Series No. 334
Table 8 continued
Variables N Mean Standard Deviation Median Minimum Maximum
Legal Status Shareholding company with shares traded in the
stock market 1,199 0.093 0.291 0 0 1 Shareholding company with non-traded shares or
shares traded privately 1,199 0.562 0.496 1 0 1 Sole proprietorship 1,199 0.236 0.425 0 0 1Limited partnership 1,199 0.054 0.227 0 0 1Others 1,199 0.027 0.161 0 0 1 Constraints I (0 = no obstacle, 1 = minor, 2 = moderate,
3 = major, 4 = severe) Electricity 1,199 1.111 1.252 1 0 4Transport 1,199 0.927 1.119 1 0 4Access to land 1,199 0.372 0.847 0 0 4Tax rates 1,199 1.379 1.161 1 0 4Tax administration 1,199 1.147 1.120 1 0 4Customs and trade regulations 1,199 0.627 1.008 0 0 4Labor regulations 1,199 0.651 0.956 0 0 4Inadequately educated workforce 1,199 0.657 0.911 0 0 4Business licensing and permits 1,199 0.858 0.975 1 0 4Access to finance 1,199 0.875 1.097 0 0 4Corruption 1,199 1.333 1.353 1 0 4Crime, theft and disorder 1,199 0.702 1.003 0 0 4Practices of competitors in informal sector 1,199 1.254 1.219 1 0 4Political instability 1,199 1.033 1.167 1 0 4Courts 1,199 0.738 1.024 0 0 4 Constraints II (Major to severe obstacle = 1, else 0)
Electricity 1,199 0.222 0.416 0 0 1Transport 1,199 0.128 0.334 0 0 1Access to land 1,199 0.053 0.223 0 0 1Tax rates 1,199 0.214 0.410 0 0 1Tax administration 1,199 0.149 0.357 0 0 1Customs and trade regulations 1,199 0.083 0.277 0 0 1Labor regulations 1,199 0.072 0.258 0 0 1Inadequately educated workforce 1,199 0.060 0.238 0 0 1Business licensing and permits 1,199 0.084 0.278 0 0 1Access to finance 1,199 0.113 0.317 0 0 1Corruption 1,199 0.270 0.444 0 0 1Crime, theft, and disorder 1,199 0.089 0.285 0 0 1Practices of competitors in informal sector 1,199 0.199 0.400 0 0 1Political instability 1,199 0.159 0.366 0 0 1Courts 1,199 0.089 0.285 0 0 1 Employment Size Group
Micro 1,199 0.152 0.359 0 0 1Small 1,199 0.620 0.486 1 0 1Medium 1,199 0.103 0.304 0 0 1Large 1,199 0.126 0.332 0 0 1
continued on next page
Enterprises in the Philippines: Dynamism and Constraints to Employment Growth | 21
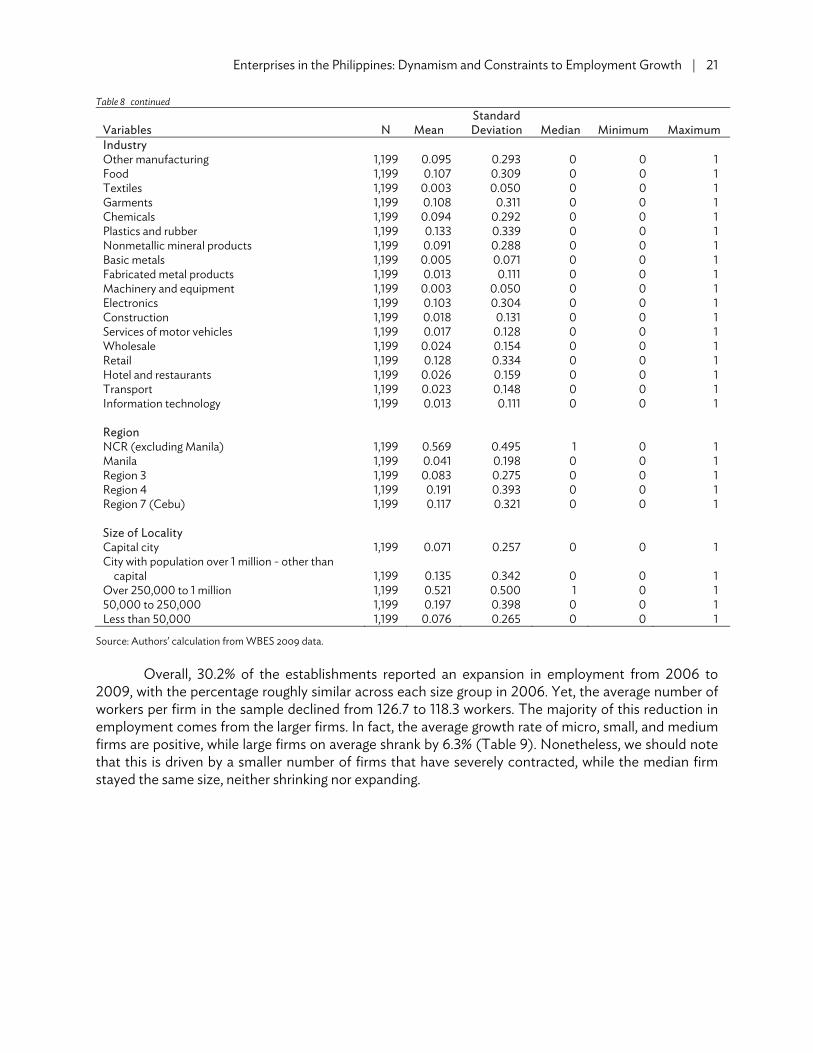
Table 8 continued
Variables N Mean Standard Deviation Median Minimum Maximum
Industry Other manufacturing 1,199 0.095 0.293 0 0 1Food 1,199 0.107 0.309 0 0 1Textiles 1,199 0.003 0.050 0 0 1Garments 1,199 0.108 0.311 0 0 1Chemicals 1,199 0.094 0.292 0 0 1Plastics and rubber 1,199 0.133 0.339 0 0 1Nonmetallic mineral products 1,199 0.091 0.288 0 0 1Basic metals 1,199 0.005 0.071 0 0 1Fabricated metal products 1,199 0.013 0.111 0 0 1Machinery and equipment 1,199 0.003 0.050 0 0 1Electronics 1,199 0.103 0.304 0 0 1Construction 1,199 0.018 0.131 0 0 1Services of motor vehicles 1,199 0.017 0.128 0 0 1Wholesale 1,199 0.024 0.154 0 0 1Retail 1,199 0.128 0.334 0 0 1Hotel and restaurants 1,199 0.026 0.159 0 0 1Transport 1,199 0.023 0.148 0 0 1Information technology 1,199 0.013 0.111 0 0 1 Region
NCR (excluding Manila) 1,199 0.569 0.495 1 0 1Manila 1,199 0.041 0.198 0 0 1Region 3 1,199 0.083 0.275 0 0 1Region 4 1,199 0.191 0.393 0 0 1Region 7 (Cebu) 1,199 0.117 0.321 0 0 1 Size of Locality
Capital city 1,199 0.071 0.257 0 0 1City with population over 1 million - other than
capital 1,199 0.135 0.342 0 0 1 Over 250,000 to 1 million 1,199 0.521 0.500 1 0 150,000 to 250,000 1,199 0.197 0.398 0 0 1Less than 50,000 1,199 0.076 0.265 0 0 1
Source: Authors’ calculation from WBES 2009 data. Overall, 30.2% of the establishments reported an expansion in employment from 2006 to
2009, with the percentage roughly similar across each size group in 2006. Yet, the average number of workers per firm in the sample declined from 126.7 to 118.3 workers. The majority of this reduction in employment comes from the larger firms. In fact, the average growth rate of micro, small, and medium firms are positive, while large firms on average shrank by 6.3% (Table 9). Nonetheless, we should note that this is driven by a smaller number of firms that have severely contracted, while the median firm stayed the same size, neither shrinking nor expanding.

22 | ADB Economics Working Paper Series No. 334
Table 9: Growth Rate of Firms, 2006–2009
Firm Size in 2006
Growth Rate (%) Actual Change in Employment N Average Median Average Median
Micro 190 38.7 0 2.0 0Small 760 8.6 0 2.2 0Medium 127 3.6 0 5.01 0Large 161 –6.3 0 –78.1 0Average 1,238 10.8 0 –8.0 0
Source: Authors’ calculation from WBES 2009 data. The lack of dynamism in firms is even more evident from the transition matrix of firm size
between 2006 and 2009. Almost all the firms stayed at their initial size: 85.4% of micro establishments remained micro, and almost 93.3% of small ones remained small. The small firms seem to be the ones that are least dynamic. Only 2.4% of these small firms managed to grow into medium and large firms by 2009, although at least, the average growth rate of these firms (8.6%) is above that of larger firms (Table 10). Out of all categories, the largest movements are observed for medium firms—70.1% remained medium-sized, but approximately the same percentage (15%) grew to large firms or became small firms. On the other hand, about a quarter of large firms shrank, with about 16% contracting enough to no longer qualify as large firms in 2009 (Table 10).
Table 10: Transition Matrix for Philippine Firms, 2006–2009
Firm Size in 2006 Firm Size in 2009 (%)
Micro Small Medium LargeMicro 85.4 14.6 0.0 0.0Small 4.3 93.3 2.0 0.4Medium 0.0 15.7 70.1 14.2Large 0.0 3.1 13.0 83.9
Source: Authors’ calculation from WBES 2009 data. We present firm size distribution in the Philippines in Figure 5. Not surprisingly, the kernel
density departs slightly from a normal distribution. However, what is notable is that the firm size distribution becomes more log normal for older cohort of firms (Figure 6). This is in line with the findings of studies on firm size distribution in other countries (Cabral and Mata 2003), suggesting that firms that survive are more likely to have found ways to adapt and thrive than exiting firms.

Enterprises in the Philippines: Dynamism and Constraints to Employment Growth | 23
Figure 5: Firm Size Distribution in the Philippines
kernel = epanechnikov, bandwidth = 0.2898 Source: Authors’ calculation from WBES 2009 data.
Figure 6: Firm Size Distribution, 2009
kernel = epanechnikov, bandwidth = 0.3146 Source: Authors’ calculation from WBES 2009 data.
0
.1
.2
.3D
en
sity
0 2 4 6 8 10ln size
Kernel density estimate Normal density
0
.1
.2
.3
De
nsi
ty
0 2 4 6 8 10ln size
Firms < 10 years old kdensity ln size
24 | ADB Economics Working Paper Series No. 334
C. Self-reported Constraint to Firms: Descriptive Statistics and Correlations
What ails the businesses in the Philippines? We could begin by examining the constraints self-reported by these establishments, covering 15 broad areas of potential obstacles.15 Firms were asked to rank the seriousness of each constraint from 0 to 4 according to five different levels of obstacles: no obstacle (0), minor obstacle (1), moderate obstacle (2), major obstacle (3), and severe obstacle (4). Given the inherent challenges in creating an objective measure out of subjective inputs, here we rank the various constraints focusing on the two most serious degrees of complaints. In other words, we consider an area to be a constraint if and only if firms reported them to be major or severe obstacles to doing business.
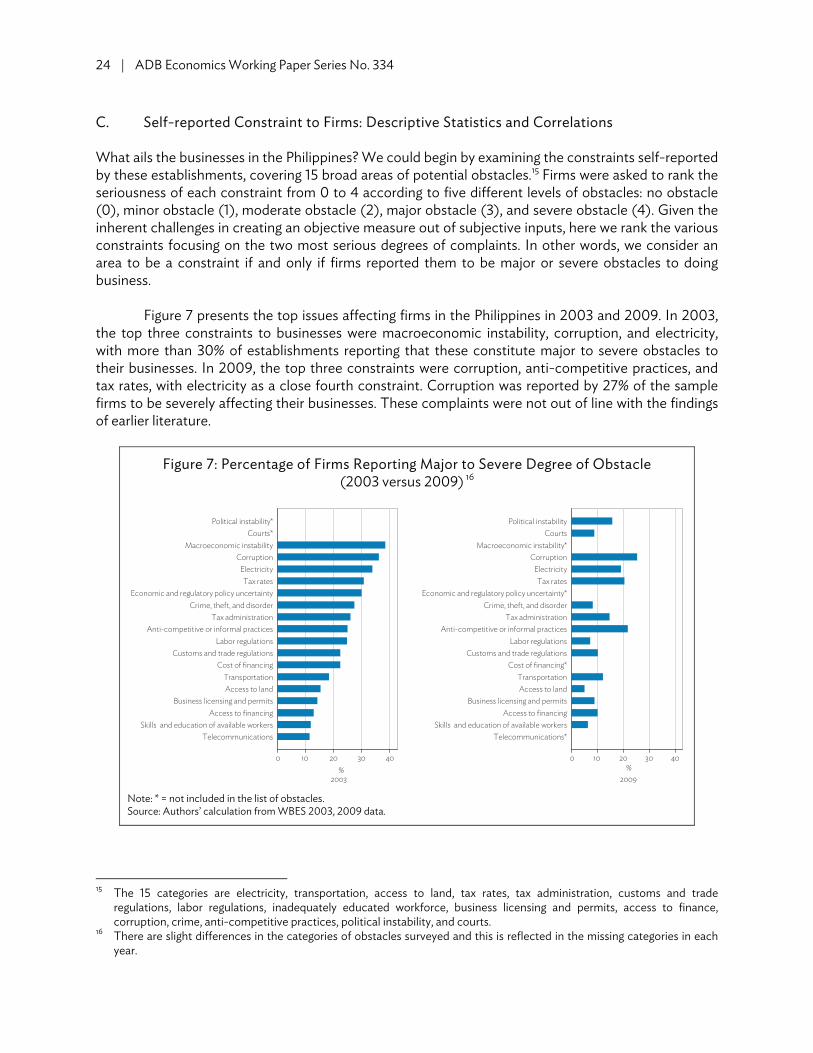
Figure 7 presents the top issues affecting firms in the Philippines in 2003 and 2009. In 2003,
the top three constraints to businesses were macroeconomic instability, corruption, and electricity, with more than 30% of establishments reporting that these constitute major to severe obstacles to their businesses. In 2009, the top three constraints were corruption, anti-competitive practices, and tax rates, with electricity as a close fourth constraint. Corruption was reported by 27% of the sample firms to be severely affecting their businesses. These complaints were not out of line with the findings of earlier literature.
Figure 7: Percentage of Firms Reporting Major to Severe Degree of Obstacle (2003 versus 2009) 16
Note: * = not included in the list of obstacles. Source: Authors’ calculation from WBES 2003, 2009 data.
15 The 15 categories are electricity, transportation, access to land, tax rates, tax administration, customs and trade
regulations, labor regulations, inadequately educated workforce, business licensing and permits, access to finance, corruption, crime, anti-competitive practices, political instability, and courts.
16 There are slight differences in the categories of obstacles surveyed and this is reflected in the missing categories in each year.
0 10 20 30 40
2003
Telecommunications
Skills and education of available workers
Access to financing
Business licensing and permits
Access to land
Transportation
Cost of financing
Customs and trade regulations
Labor regulations
Anti-competitive or informal practices
Tax administration
Crime, theft, and disorder
Economic and regulatory policy uncertainty
Tax rates
Electricity
Corruption
Macroeconomic instability
Courts*
Political instability*
%
0 10 20 4030
2009
Telecommunications*
Skills and education of available workers
Access to financing
Business licensing and permits
Access to land
Transportation
Cost of financing*
Customs and trade regulations
Labor regulations
Anti-competitive or informal practices
Tax administration
Crime, theft, and disorder
Economic and regulatory policy uncertainty*
Tax rates
Electricity
Corruption
Macroeconomic instability*
Courts
Political instability
%
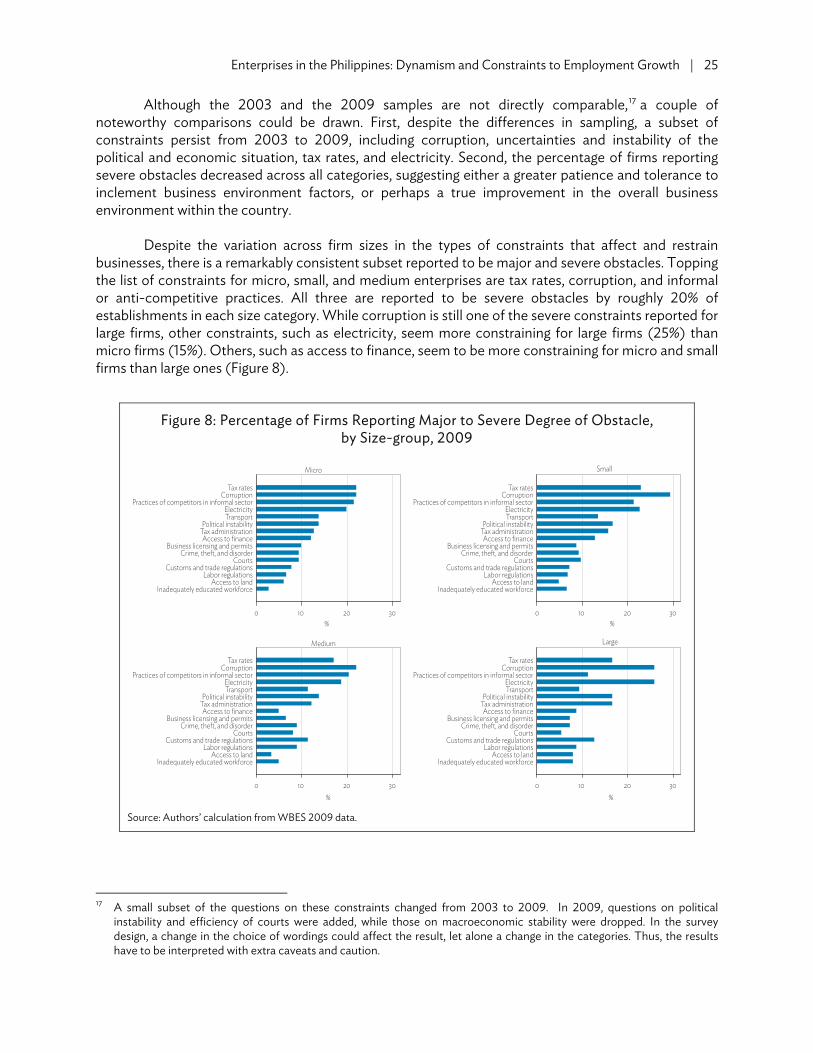
Enterprises in the Philippines: Dynamism and Constraints to Employment Growth | 25
Although the 2003 and the 2009 samples are not directly comparable,17 a couple of noteworthy comparisons could be drawn. First, despite the differences in sampling, a subset of constraints persist from 2003 to 2009, including corruption, uncertainties and instability of the political and economic situation, tax rates, and electricity. Second, the percentage of firms reporting severe obstacles decreased across all categories, suggesting either a greater patience and tolerance to inclement business environment factors, or perhaps a true improvement in the overall business environment within the country.
Despite the variation across firm sizes in the types of constraints that affect and restrain
businesses, there is a remarkably consistent subset reported to be major and severe obstacles. Topping the list of constraints for micro, small, and medium enterprises are tax rates, corruption, and informal or anti-competitive practices. All three are reported to be severe obstacles by roughly 20% of establishments in each size category. While corruption is still one of the severe constraints reported for large firms, other constraints, such as electricity, seem more constraining for large firms (25%) than micro firms (15%). Others, such as access to finance, seem to be more constraining for micro and small firms than large ones (Figure 8).
Figure 8: Percentage of Firms Reporting Major to Severe Degree of Obstacle, by Size-group, 2009
Source: Authors’ calculation from WBES 2009 data.
17 A small subset of the questions on these constraints changed from 2003 to 2009. In 2009, questions on political
instability and efficiency of courts were added, while those on macroeconomic stability were dropped. In the survey design, a change in the choice of wordings could affect the result, let alone a change in the categories. Thus, the results have to be interpreted with extra caveats and caution.
0 10 20 30
Micro
Inadequately educated workforceAccess to land
Labor regulationsCustoms and trade regulations
CourtsCrime, theft, and disorder
Business licensing and permitsAccess to finance
Tax administrationPolitical instability
TransportElectricity
Practices of competitors in informal sectorCorruption
Tax rates
%
0 10 20 30
Small
Inadequately educated workforceAccess to land
Labor regulationsCustoms and trade regulations
CourtsCrime, theft, and disorder
Business licensing and permitsAccess to finance
Tax administrationPolitical instability
TransportElectricity
Practices of competitors in informal sectorCorruption
Tax rates
%
0 10 20 30
Medium
Inadequately educated workforceAccess to land
Labor regulationsCustoms and trade regulations
CourtsCrime, theft, and disorder
Business licensing and permitsAccess to finance
Tax administrationPolitical instability
TransportElectricity
Practices of competitors in informal sectorCorruption
Tax rates
%
0 10 20 30
Large
Inadequately educated workforceAccess to land
Labor regulationsCustoms and trade regulations
CourtsCrime, theft, and disorder
Business licensing and permitsAccess to finance
Tax administrationPolitical instability
TransportElectricity
Practices of competitors in informal sectorCorruption
Tax rates
%

26 | ADB Economics Working Paper Series No. 334
The matrix of pair-wise correlation coefficients between these various constraints is presented in Table 11.18 One of the issues we face is that the various types of obstacles could be highly correlated with each other. Fortunately, although the correlations among the various obstacles are significant, they are also fairly low, with most pairs well below 0.5. This is similar to the findings of Ayyagari et al. (2008). Out of all potential pair-wise correlations, the highest one is that between tax rates and tax administration (0.638), which indicates that problems with tax rates are highly likely to be compounded with poor tax administration. The next three highly correlated pairs are corruption and political instability (0.567), corruption and courts (0.455) and political instability and courts (0.455). Again, these correlations are not surprising.
Where these results depart from others is that the correlation between obstacles and growth
of firms are neither always significant nor negative. In fact, only four obstacles are statistically significant in the unconditional pair-wise correlation matrix. One of them actually shows positive correlation—the presence of severe obstacles in customs and trade regulations is positively correlated (0.104) with growth. This is a case where correlations and causality have to be carefully distinguished. It could very well be that severe obstacles in customs and trade regulations increase business costs by forcing firms to hire extra manpower to deal with various red tapes. The other three obstacles significantly correlated with firm growth actually exhibit negative and low correlations: anti-competitive practices (–0.078), labor regulations (–0.077), and access to finance (–0.063).
18 Here the pair-wise correlation coefficients are defined as = ( ) = [( )( )] .

Enterprises in the Philippines: Dynamism and Constraints to Employment Growth | 27
Table 11: Correlation Matrix
Employment Growth
(Dummy) Electricity Transport Access to
Land Tax
Rates Tax
Administration
Customs and Trade
Regulations Labor
Regulations Employment growth (dummy) 1 Electricity 0.0118 1 Transport 0.0480 0.3373* 1 Access to land 0.0243 0.0812* 0.1340* 1 Tax rates 0.0164 0.2312* 0.2155* 0.1601* 1 Tax administration -0.0104 0.1875* 0.1905* 0.1531* 0.6384* 1 Customs and trade regulations 0.1039* 0.1656* 0.2915* 0.1047* 0.2182* 0.2461* 1 Labor regulations -0.0772* 0.1550* 0.2134* 0.2532* 0.2495* 0.3008* 0.2435* 1 Inadequately educated workforce -0.0133 0.1270* 0.1348* 0.1607* 0.1681* 0.2093* 0.1650* 0.3787* Business licensing and permits 0.0229 0.1344* 0.2620* 0.1574* 0.3403* 0.3869* 0.2452* 0.2532* Access to finance -0.0634* 0.1951* 0.1470* 0.1633* 0.1795* 0.1749* 0.1204* 0.2064* Corruption 0.0130 0.1633* 0.1838* 0.1429* 0.3246* 0.3564* 0.2036* 0.2312* Crime, theft, and disorder 0.0427 0.1990* 0.2398* 0.1492* 0.1296* 0.1644* 0.1489* 0.2304* Practices of competitors in informal sector -0.0780* 0.0351 0.0720* 0.0977* 0.0916* 0.0956* 0.0005 0.0959* Political instability 0.0066 0.1625* 0.1477* 0.1835* 0.3182* 0.3420* 0.1077* 0.2058* Courts -0.0147 0.1286* 0.1521* 0.1361* 0.2510* 0.2957* 0.2018* 0.2304*
Inadequately
Educated Workforce
Business Licensing and
Permits Access to Finance Corruption
Crime, Theft, and Disorder
Practices of Competitors in
Informal Sector
Political Instability Courts
Employment growth (dummy) Electricity Transport Access to land Tax rates Tax administration Customs and trade regulations Labor regulations Inadequately educated workforce 1 Business licensing and permits 0.2014* 1 Access to finance 0.1642* 0.1661* 1 Corruption 0.1782* 0.3361* 0.1318* 1 Crime, theft, and disorder 0.1795* 0.1579* 0.2017* 0.2509* 1 Practices of competitors in informal sector 0.0848* 0.0516 0.0980* 0.0631* 0.0708* 1 Political instability 0.2065* 0.3193* 0.1030* 0.5665* 0.1915* 0.0966* 1 Courts 0.2287* 0.2737* 0.0910* 0.4551* 0.1893* 0.0928* 0.4553* 1
Note: * = significant at 5%. Source: Authors’ calculation from WBES 2009 data.

28 | ADB Economics Working Paper Series No. 334
D. Maximum Likelihood Estimations
Nonetheless, unconditional binary correlations do not take into account other factors that influence firm growth. To explore this, we fit various regression models onto the firm data. In the first set of estimations, we use maximum likelihood methods to estimate the likelihood function outlined in equation (4.3) on each obstacle individually, using the following reduced form: Pr ( ) = + ∑ ′ + γ + (4.4) where Z is a subset of n variables of firm-level characteristics X, and k referring to each of the 15 individual constraints observed. For the most parsimonious specification, Z contains firm age, gender of the owner, gender and education of top manager, whether the firm is an exporter, whether firm is foreign-owned (jointly or wholly), type of establishment, and the legal status of the firm. Excluded are industry and geographical fixed effects. Given our choice of a binary probit model, the interpretation of the coefficients is straightforward—a statistical significant estimate of k means that the presence of the reported severe constraint affected the probability of the firm’s growth by %.
Table 12 reports the marginal effects of the maximum likelihood estimations for the pooled
sample of all size groups.19 The results show that the two consistent firm characteristics significantly correlated with firm growth are the firm’s age and the education of its top manager. Each year in firm age reduces the probability of its growth by 0.6%, while the possession of university degrees increases the probability of firm expansion by roughly 15%, while that of a graduate degree is even higher at around 23%. Similar to the patterns displayed by the correlation matrix, not all obstacles are significantly binding to firm growth. Again, there are positive estimated coefficients, just as we see earlier, the presence of severe obstacles in customs and trade regulations again increases the probability of firm employment growth by 16.8%. Severe obstacles in transport are also associated with an increase in probability of growth of 7.2%, but it is only statistically significant at the 10% confidence level. This could reflect an increase in business costs that could only be allayed by expanding more workers. The other three obstacles with significant estimated k (all negative) are also identical to that found in the correlation matrix and reduce the probability of firm growth, although in different order of severity. Severe obstacle regarding labor regulations (–13.9%) is the most binding, followed by practices of competitors in the informal sector (–8.3%), and access to finance (–8.1%). However, these regressions explain only a small portion of the variations in firm growth, with the pseudo R-square approximately 2%.
Next, we test whether these constraints jointly affect the growth of firms, and whether jointly
these constraints would have an effect on firm growth: Pr ( ) = + ∑ ( ) + ∑ γ ∗ + (4.5)
19 Another way to understand this estimated k coefficient is as the partial derivative of equation (4.4):
δΦ/δX = δ(Pr ( )/δCONSTRAINTk = k A reported constraint is considered binding if the estimated k is significantly different than zero.

Enterprises in the Philippines: Dynamism and Constraints to Employment Growth | 29
Table 12: Marginal Effects of Individual Constraints (All Firms), 2009
Employment Growth 1 2 3 4 5 6 7 8 9 10 11 12 13 14 15 Age –0.006 –0.006 –0.006 –0.006 –0.006 –0.006 –0.006 –0.006 –0.006 –0.005 –0.006 –0.006 –0.005 –0.006 –0.006 [0.003]** [0.003]** [0.003]** [0.003]** [0.003]** [0.003]** [0.003]** [0.003]** [0.003]** [0.003]** [0.003]** [0.003]** [0.003]** [0.003]** [0.003]** Age squared 0 0 0 0 0 0 0 0 0 0 0 0 0 0 0 [0.000] [0.000] [0.000] [0.000] [0.000] [0.000] [0.000] [0.000] [0.000] [0.000] [0.000] [0.000] [0.000] [0.000] [0.000] Female owner = 1 –0.051 –0.052 –0.053 –0.051 –0.051 –0.052 –0.048 –0.050 –0.053 –0.053 –0.053 –0.053 –0.045 –0.051 –0.051 [0.032] [0.032] [0.032]* [0.032] [0.032] [0.032]* [0.032] [0.032] [0.032]* [0.032]* [0.032]* [0.032]* [0.032] [0.032] [0.032] Female manager = 1 –0.023 –0.022 –0.023 –0.024 –0.024 –0.024 –0.024 –0.025 –0.023 –0.023 –0.022 –0.026 –0.021 –0.023 –0.024 [0.031] [0.031] [0.031] [0.031] [0.031] [0.031] [0.031] [0.031] [0.031] [0.031] [0.031] [0.031] [0.031] [0.031] [0.031] Exporter = 1 0.030 0.033 0.030 0.031 0.031 0.026 0.031 0.030 0.031 0.032 0.030 0.032 0.033 0.030 0.030 [0.037] [0.037] [0.037] [0.037] [0.037] [0.037] [0.037] [0.037] [0.037] [0.037] [0.037] [0.037] [0.037] [0.037] [0.037] Foreign-owned (jointly) = 1 –0.001 –0.002 –0.001 –0.001 –0.001 –0.013 –0.002 0 0 –0.005 –0.001 –0.002 –0.008 0 0 [0.043] [0.043] [0.043] [0.043] [0.043] [0.043] [0.043] [0.043] [0.043] [0.043] [0.043] [0.043] [0.043] [0.043] [0.043] Foreign-owned (wholly) = 1 –0.037 –0.037 –0.037 –0.036 –0.037 –0.049 –0.039 –0.037 –0.038 –0.041 –0.036 –0.039 –0.048 –0.037 –0.037 [0.049] [0.049] [0.049] [0.049] [0.049] [0.048] [0.048] [0.049] [0.049] [0.048] [0.049] [0.048] [0.048] [0.049] [0.049] Education of Top Manager Secondary School = 1 0.114 0.114 0.110 0.111 0.115 0.100 0.112 0.113 0.109 0.099 0.108 0.117 0.118 0.112 0.114 [0.127] [0.127] [0.126] [0.127] [0.127] [0.126] [0.127] [0.127] [0.126] [0.127] [0.126] [0.127] [0.128] [0.127] [0.127] Vocational Training = 1 0.028 0.030 0.022 0.028 0.029 0.016 0.028 0.027 0.026 0.026 0.030 0.032 0.031 0.028 0.028 [0.135] [0.136] [0.134] [0.135] [0.135] [0.133] [0.135] [0.135] [0.135] [0.135] [0.135] [0.136] [0.136] [0.135] [0.135] University Degree = 1 0.151 0.150 0.150 0.150 0.151 0.140 0.153 0.150 0.148 0.142 0.150 0.153 0.151 0.150 0.151 [0.082]* [0.082]* [0.082]* [0.082]* [0.082]* [0.083]* [0.082]* [0.082]* [0.082]* [0.083]* [0.082]* [0.082]* [0.082]* [0.082]* [0.082]* Graduate degree (Philippines) = 1 0.227 0.227 0.225 0.226 0.229 0.206 0.237 0.226 0.222 0.217 0.225 0.228 0.226 0.225 0.227 [0.116]* [0.116]* [0.116]* [0.116]* [0.116]** [0.116]* [0.117]** [0.116]* [0.116]* [0.117]* [0.116]* [0.116]* [0.117]* [0.116]* [0.116]* Graduate degree (abroad) = 1 0.202 0.202 0.201 0.201 0.200 0.191 0.204 0.199 0.196 0.190 0.201 0.205 0.211 0.200 0.201 [0.127] [0.127] [0.126] [0.126] [0.126] [0.127] [0.127] [0.126] [0.126] [0.127] [0.126] [0.127] [0.127]* [0.126] [0.126] Major to Severe Constraint Electricity = 1 0.009 [0.033] Transport = 1 0.072 [0.042]* Access to land = 1 0.060 [0.063]Tax rates = 1 0.014 [0.033]Tax administration = 1 –0.015 [0.038]Customs and trade regulations = 1
0.168[0.053]***
Labor regulations = 1 –0.139 [0.043]***Inadequately educated workforce = 1 –0.025
[0.056] Business licensing and permits = 1
0.043[0.050]
continued on next page

30 | ADB Economics Working Paper Series No. 334
Table 12 continued Access to finance = 1 –0.081 [0.040]**Corruption = 1 0.023 [0.031]Crime, theft and disorder = 1 0.073 [0.049]Practices of competitors in informal
sector = 1 –0.083
[0.032]*** Political instability = 1 0.012 [0.037]Courts = 1 –0.014 [0.047] Establishment type dummies yes Yes yes yes yes yes yes yes yes yes yes yes yes yes yes Legal status dummies yes yes yes yes yes yes yes yes yes yes yes yes yes yes yes Pseudo R-squared 0.0191 0.0211 0.0197 0.0193 0.0191 0.0264 0.0243 0.0191 0.0196 0.0217 0.0194 0.0206 0.0225 0.0191 0.0191 Observations 1,199 1,199 1,199 1,199 1,199 1,199 1,199 1,199 1,199 1,199 1,199 1,199 1,199 1,199 1,199
Notes: Standard errors in brackets; * = significant at 10%; ** = significant at 5%; *** = significant at 1%. Source: Authors’ calculation from WBES 2009 data.
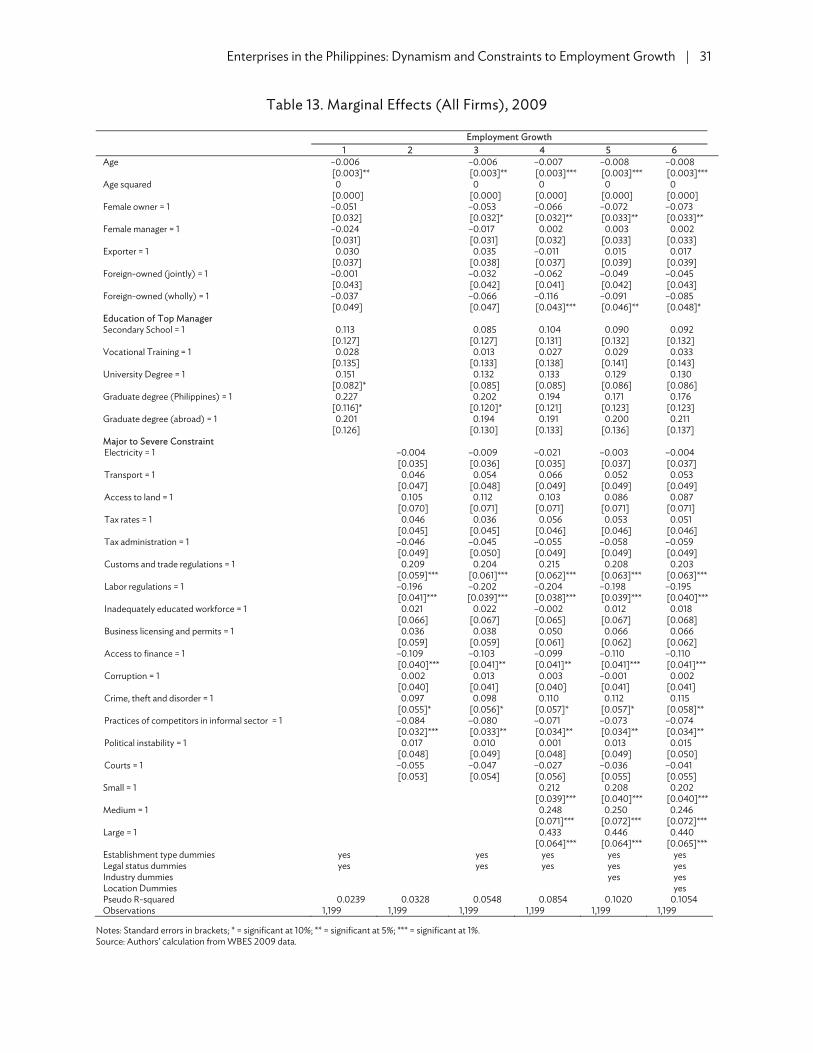
Enterprises in the Philippines: Dynamism and Constraints to Employment Growth | 31
Table 13. Marginal Effects (All Firms), 2009
Employment Growth 1 2 3 4 5 6Age –0.006 –0.006 –0.007 –0.008 –0.008 [0.003]** [0.003]** [0.003]*** [0.003]*** [0.003]***Age squared 0 0 0 0 0 [0.000] [0.000] [0.000] [0.000] [0.000]Female owner = 1 –0.051 –0.053 –0.066 –0.072 –0.073 [0.032] [0.032]* [0.032]** [0.033]** [0.033]**Female manager = 1 –0.024 –0.017 0.002 0.003 0.002 [0.031] [0.031] [0.032] [0.033] [0.033]Exporter = 1 0.030 0.035 –0.011 0.015 0.017 [0.037] [0.038] [0.037] [0.039] [0.039]Foreign-owned (jointly) = 1 –0.001 –0.032 –0.062 –0.049 –0.045 [0.043] [0.042] [0.041] [0.042] [0.043]Foreign-owned (wholly) = 1 –0.037 –0.066 –0.116 –0.091 –0.085 [0.049] [0.047] [0.043]*** [0.046]** [0.048]*Education of Top Manager Secondary School = 1 0.113 0.085 0.104 0.090 0.092 [0.127] [0.127] [0.131] [0.132] [0.132]Vocational Training = 1 0.028 0.013 0.027 0.029 0.033 [0.135] [0.133] [0.138] [0.141] [0.143]University Degree = 1 0.151 0.132 0.133 0.129 0.130 [0.082]* [0.085] [0.085] [0.086] [0.086]Graduate degree (Philippines) = 1 0.227 0.202 0.194 0.171 0.176 [0.116]* [0.120]* [0.121] [0.123] [0.123]Graduate degree (abroad) = 1 0.201 0.194 0.191 0.200 0.211 [0.126] [0.130] [0.133] [0.136] [0.137]Major to Severe Constraint Electricity = 1 –0.004 –0.009 –0.021 –0.003 –0.004 [0.035] [0.036] [0.035] [0.037] [0.037]Transport = 1 0.046 0.054 0.066 0.052 0.053 [0.047] [0.048] [0.049] [0.049] [0.049]Access to land = 1 0.105 0.112 0.103 0.086 0.087 [0.070] [0.071] [0.071] [0.071] [0.071]Tax rates = 1 0.046 0.036 0.056 0.053 0.051 [0.045] [0.045] [0.046] [0.046] [0.046]Tax administration = 1 –0.046 –0.045 –0.055 –0.058 –0.059 [0.049] [0.050] [0.049] [0.049] [0.049]Customs and trade regulations = 1 0.209 0.204 0.215 0.208 0.203 [0.059]*** [0.061]*** [0.062]*** [0.063]*** [0.063]***Labor regulations = 1 –0.196 –0.202 –0.204 –0.198 –0.195 [0.041]*** [0.039]*** [0.038]*** [0.039]*** [0.040]***Inadequately educated workforce = 1 0.021 0.022 –0.002 0.012 0.018 [0.066] [0.067] [0.065] [0.067] [0.068]Business licensing and permits = 1 0.036 0.038 0.050 0.066 0.066 [0.059] [0.059] [0.061] [0.062] [0.062]Access to finance = 1 –0.109 –0.103 –0.099 –0.110 –0.110 [0.040]*** [0.041]** [0.041]** [0.041]*** [0.041]***Corruption = 1 0.002 0.013 0.003 –0.001 0.002 [0.040] [0.041] [0.040] [0.041] [0.041]Crime, theft and disorder = 1 0.097 0.098 0.110 0.112 0.115 [0.055]* [0.056]* [0.057]* [0.057]* [0.058]**Practices of competitors in informal sector = 1 –0.084 –0.080 –0.071 –0.073 –0.074 [0.032]*** [0.033]** [0.034]** [0.034]** [0.034]**Political instability = 1 0.017 0.010 0.001 0.013 0.015 [0.048] [0.049] [0.048] [0.049] [0.050]Courts = 1 –0.055 –0.047 –0.027 –0.036 –0.041
[0.053] [0.054] [0.056] [0.055] [0.055]Small = 1 0.212 0.208 0.202 [0.039]*** [0.040]*** [0.040]***Medium = 1 0.248 0.250 0.246 [0.071]*** [0.072]*** [0.072]***Large = 1 0.433 0.446 0.440 [0.064]*** [0.064]*** [0.065]***Establishment type dummies yes yes yes yes yesLegal status dummies yes yes yes yes yesIndustry dummies yes yesLocation Dummies yesPseudo R-squared 0.0239 0.0328 0.0548 0.0854 0.1020 0.1054Observations 1,199 1,199 1,199 1,199 1,199 1,199
Notes: Standard errors in brackets; * = significant at 10%; ** = significant at 5%; *** = significant at 1%. Source: Authors’ calculation from WBES 2009 data.

32 | ADB Economics Working Paper Series No. 334
Table 13 presents the results for the pooled sample. The set of constraints that are directly
binding on firm growth remains similar to the list we have seen thus far, with surprisingly stable estimated coefficients across various specifications accounting for industry and location fixed effects. The approximate range of these estimated coefficients k are: customs and trade regulations (20%), labor regulations (–20%), access to finance (–11%), and practices of competitors in the informal sector (–8%). Altogether, these variables explain roughly 10% of the variation in firms’ growth rates. In addition, each year in the firm’s age reduces the probability of expansion by roughly 6%–8%, having a female owner is associated with another 5%–7% reduction in the probability of growth, and somewhat surprisingly, complete foreign-ownership also reduces the probability of expansion by 6%–11%. We would, nonetheless, exhort caution in assigning causality to these results as there could very well be potentially missing variables associated with these variables and constraints. Unfortunately, at this moment, we are unable to address these issues of self-selection and its resulting bias.
E. Heterogeneity of Firms
In this section, we check whether reported constraints differently affect firms of various sizes. Table 14 presents the marginal effects of the maximum likelihood estimations for the micro enterprises. The results show that for this group of firms, while certain aspects of the firms’ individual characteristics are significantly correlated with firm growth, the reported constraints bear no relationship to the growth of very small firms. In the parsimonious specification (column 1, Table 14), female ownership reduces the probability of growth by almost 10%. In the full specification (column 5), joint foreign ownership reduces the probability of expansion by around 2%. Education of the top manager is highly significant throughout. The probability of growing is up to 10% higher for firms with top managers with higher levels of educational attainment compared to those with less than secondary schooling. On the other hand, electricity is the only reported constraint that turned out to be highly significant. Micro enterprises who reported electricity as a major to severe constraint is less likely to grow by 3% compared to other firms.
For small firms, contrary to the findings on microenterprises, most firm-level characteristics
aside from age and education are not significant determinants of firms’ growth.20 For the self-reported constraints, the probability of expansion is reduced by labor regulations (–16%), access to finance (–13%), and practices of competitors in the informal sector (–11%). Severe obstacles encountered with customs and trade regulations increase the probability of employment expansion for small firms by 22% and 13% with crime, theft, and disorder (column 5, Table 15).
For medium enterprises, similar to micro firms, education is highly significant and increases the
probability of expanding. For the constraints, the probability of expansion is lower for firms facing major to severe obstacles associated with access to finance (–16%), practices of competitors in the informal sector (–15%), political instability (–13%), and transport (–10%). On the other hand, the presence of major to severe constraints in some areas actually increases the probability of expanding employment, for example, with issues regarding access to land (90%) and tax administration (88%), which could be a second-best response to increases transaction costs (Table 16).
For large enterprises, both firm characteristics and business environment constraints are found
to be strong determinants of firm growth, with effects stronger than those seen in smaller firms. Firm age (–2.2%), female ownership (–31.5%), and joint foreign ownership (–25%) reduce the probability of 20 Each additional firm age reduces the probability of growth by 1% across all five specifications (columns 1–5 in Table 15).

Enterprises in the Philippines: Dynamism and Constraints to Employment Growth | 33
growth. Being an exporter, however, increases the probability of expansion by 39%. The education of the top manager is also highly significant, and the probability of expansion increases as the level of educational attainment increases. The presence of major to severe constraints decreases the possibility of growth significantly in the following areas: labor regulations (–54.0%), access to finance (–41.2%), and courts (–41.4%) (column 5, Table 17). The reverse is true for the presence of severe and major obstacles in customs and trade regulations, and business licensing and permits wherein the probability of growth increases by 51% and 70%, respectively (Table 17).
These results point to the fact that business environment constraints affect firms differently
according to firm size. Specifically, the findings also suggest that those most affected are also the largest of the firms.
F. Access to Finance
Our findings of the real impacts of lack of access to finance also confirmed other studies asserting that access to finance has remained one of the most critical factors affecting the competitiveness of MSMES and the continual difficulties of Filipino MSMEs in accessing finance. Nangia and Vaillancourt (2006) indicated that funds obtained from the banking sector accounted for only 11%–21% of capital raised by SMEs. This is lower than the 30% international benchmark seen in other developing countries like India and Thailand.
In a recent access to finance survey among MSMEs, Aldaba (2011) showed the continued
dependence of SMEs on internal sources of financing not only during the start-up phase but also to finance the current operations of the business. To keep their business operations running, firms have continued to rely on personal savings of business owners (29%), retained earnings (22%), and loans from individuals (11%). Finance sources for start-up operations consisted mainly of personal savings of owners (37%), loans from friends or relatives of business owners (20%), retained earnings (9%), and loans from unrelated individuals (8%). Commercial or personal loans and lines of credit from financial institutions, including credit cards, accounted for 12% of the total.
Lack of credit information is one of the top reasons why banks are reluctant to provide credit to MSMEs. Without credit information and track record, coupled with limited management and financial capability, lending to MSMEs is extremely risky from the point of view of banks. Thus, the banks imposed collateral requirements and stringent conditions, such as minimum loan requirements, in order to address the lack of credit information. However, these only hurt the MSMEs further since they also have limited capacity to put up the necessary collateral requirements. In addition, MSMEs are also faced with other constraints in terms of access to finance: slow loan processing, short repayment period, difficulties in loan restructuring, high interest rates, and lack of start-up funds for SMEs. In 2008, the government enacted RA 9510 or the Credit Information System Act (CISA). This law aims to establish, as a centralized credit bureau, the Central Credit Information Corporation (CICC), that would provide information to banks as well as other financial institutions. With this central credit bureau, credit worthiness of borrowers, including MSMEs, can be determined with more efficiency. With more information, providing credit would be more cost-effective and would reduce the need for excessive collateral to secure credit facilities. Thus, improving access to and availability of credit, particularly to MSMEs (Aldaba 2012).
It is also important to change the traditional mindset of banks and encourage the adoption of
non-traditional approach to SME lending. Traditionally, lending to SMEs is seen to entail higher risks and higher costs and the tendency of policy response is to over guarantee the loan. Yet, the case of

34 | ADB Economics Working Paper Series No. 334
Plantersbank has proven that SME lending can be profitable and rewarding, suggesting that other banks have room to learn to improve their risk assessment methods for SMEs. There is also an initiative in the country by the International Finance Corporation to create an SME banking model focusing on not only SME banking but also stressing the importance for banks to offer and cross-sell multiple products, focus on strong marketing, and adopt segmentation and product development capacity. The German government in cooperation with the Small and Medium Enterprise Development for Sustainable Employment Program (SMEDSEP) introduced a new lending technology on providing credit to SMEs by rural banks and thrift banks. . The new technology promotes lending based on business viability in order to boost SME lending by banks. With this, collateral requirement is not the main determinant in providing loans. Another worthy initiative is the partnership between SMEDSEP and the University of the Philippines through the Institute of Small Scale Industries (UP-ISSI). Through this partnership, SME finance trainings for rural banks and thrift banks will be institutionalized (Aldaba 2012). 21
21 Technologies on the provision of credit to SMEs by rural banks and thrift banks will be passed on by SMEDSEP to UP ISSI
under this partnership.
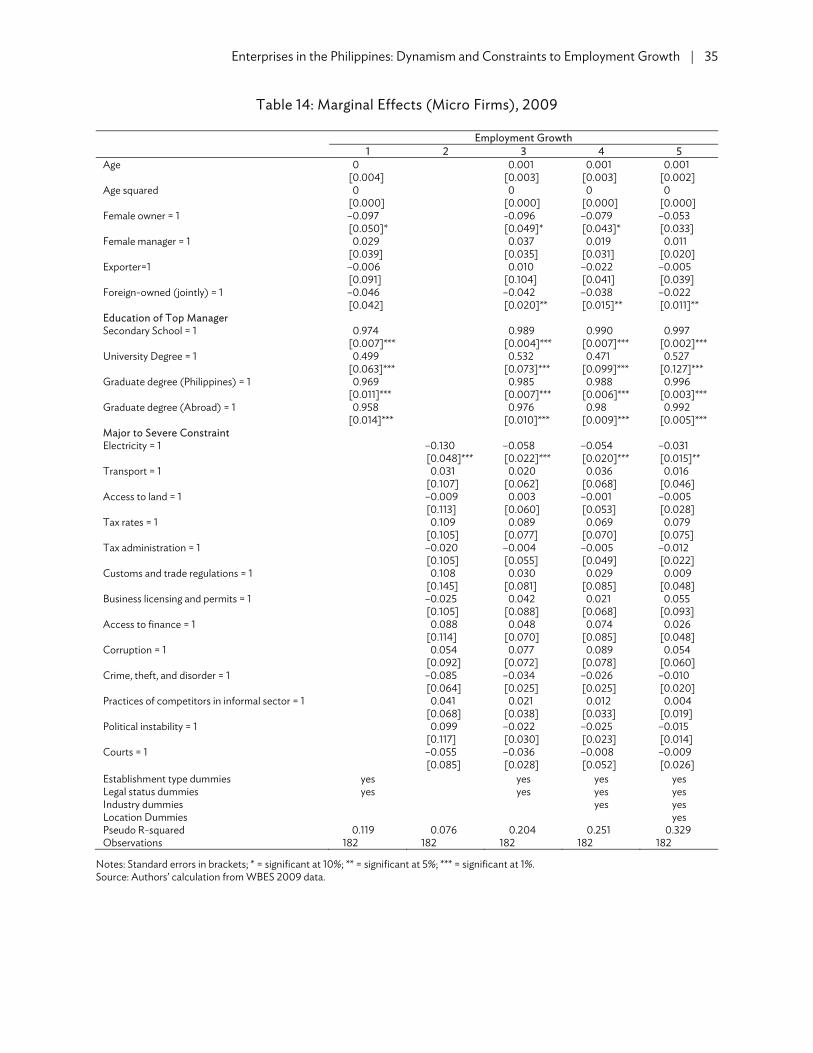
Enterprises in the Philippines: Dynamism and Constraints to Employment Growth | 35
Table 14: Marginal Effects (Micro Firms), 2009
Employment Growth 1 2 3 4 5
Age 0 0.001 0.001 0.001 [0.004] [0.003] [0.003] [0.002]Age squared 0 0 0 0 [0.000] [0.000] [0.000] [0.000]Female owner = 1 –0.097 -0.096 –0.079 –0.053 [0.050]* [0.049]* [0.043]* [0.033]Female manager = 1 0.029 0.037 0.019 0.011 [0.039] [0.035] [0.031] [0.020]Exporter=1 –0.006 0.010 –0.022 –0.005 [0.091] [0.104] [0.041] [0.039]Foreign-owned (jointly) = 1 –0.046 –0.042 –0.038 –0.022 [0.042] [0.020]** [0.015]** [0.011]**Education of Top Manager Secondary School = 1 0.974 0.989 0.990 0.997 [0.007]*** [0.004]*** [0.007]*** [0.002]***University Degree = 1 0.499 0.532 0.471 0.527 [0.063]*** [0.073]*** [0.099]*** [0.127]***Graduate degree (Philippines) = 1 0.969 0.985 0.988 0.996 [0.011]*** [0.007]*** [0.006]*** [0.003]***Graduate degree (Abroad) = 1 0.958 0.976 0.98 0.992 [0.014]*** [0.010]*** [0.009]*** [0.005]***Major to Severe Constraint Electricity = 1 –0.130 –0.058 –0.054 –0.031 [0.048]*** [0.022]*** [0.020]*** [0.015]**Transport = 1 0.031 0.020 0.036 0.016 [0.107] [0.062] [0.068] [0.046]Access to land = 1 –0.009 0.003 –0.001 –0.005 [0.113] [0.060] [0.053] [0.028]Tax rates = 1 0.109 0.089 0.069 0.079 [0.105] [0.077] [0.070] [0.075]Tax administration = 1 –0.020 –0.004 –0.005 –0.012 [0.105] [0.055] [0.049] [0.022]Customs and trade regulations = 1 0.108 0.030 0.029 0.009 [0.145] [0.081] [0.085] [0.048]Business licensing and permits = 1 –0.025 0.042 0.021 0.055 [0.105] [0.088] [0.068] [0.093]Access to finance = 1 0.088 0.048 0.074 0.026 [0.114] [0.070] [0.085] [0.048]Corruption = 1 0.054 0.077 0.089 0.054 [0.092] [0.072] [0.078] [0.060]Crime, theft, and disorder = 1 –0.085 –0.034 –0.026 –0.010 [0.064] [0.025] [0.025] [0.020]Practices of competitors in informal sector = 1 0.041 0.021 0.012 0.004 [0.068] [0.038] [0.033] [0.019]Political instability = 1 0.099 –0.022 –0.025 –0.015 [0.117] [0.030] [0.023] [0.014]Courts = 1 –0.055 –0.036 –0.008 –0.009 [0.085] [0.028] [0.052] [0.026]Establishment type dummies yes yes yes yesLegal status dummies yes yes yes yesIndustry dummies yes yesLocation Dummies yesPseudo R-squared 0.119 0.076 0.204 0.251 0.329Observations 182 182 182 182 182
Notes: Standard errors in brackets; * = significant at 10%; ** = significant at 5%; *** = significant at 1%. Source: Authors’ calculation from WBES 2009 data.

36 | ADB Economics Working Paper Series No. 334
Table 15: Marginal Effects (Small Firms), 2009
Employment Growth 1 2 3 4 5 Age –0.009 –0.009 –0.010 –0.011 [0.004]** [0.004]** [0.004]*** [0.004]*** Age squared 0 0 0 0 [0.000]* [0.000] [0.000]* [0.000]* Female owner = 1 –0.064 –0.066 –0.064 –0.071 [0.041] [0.042] [0.042] [0.043] Female manager = 1 –0.002 0.002 0.012 0.015 [0.039] [0.040] [0.042] [0.042] Exporter = 1 –0.040 –0.037 –0.019 –0.016 [0.047] [0.048] [0.050] [0.051] Foreign-owned (jointly) = 1 –0.011 –0.051 –0.057 –0.062 [0.057] [0.055] [0.055] [0.055] Foreign-owned (wholly) = 1 –0.019 –0.041 –0.001 0.002 [0.070] [0.069] [0.075] [0.076] Education of Top Manager Secondary School = 1 0.139 0.119 0.132 0.122 [0.144] [0.148] [0.153] [0.154] Vocational Training = 1 0.118 0.128 0.183 0.188 [0.163] [0.167] [0.177] [0.180] University Degree = 1 0.131 0.112 0.122 0.113 [0.089] [0.094] [0.094] [0.095] Graduate degree (Philippines) = 1 0.180 0.149 0.140 0.121 [0.127] [0.131] [0.134] [0.134] Graduate degree (abroad) = 1 0.216 0.222 0.253 0.277 [0.150] [0.157] [0.162] [0.162]* Major to Severe Constraint Electricity = 1 –0.018 –0.025 –0.011 –0.002 [0.045] [0.046] [0.048] [0.048] Transport = 1 0.096 0.100 0.076 0.074 [0.061] [0.062] [0.062] [0.062] Access to land = 1 0.060 0.047 0.036 0.052 [0.092] [0.091] [0.092] [0.095] Tax rates = 1 0.066 0.057 0.060 0.059 [0.058] [0.058] [0.060] [0.060] Tax administration = 1 –0.063 –0.048 –0.068 –0.060 [0.060] [0.063] [0.063] [0.064] Customs and trade regulations = 1 0.208 0.242 0.235 0.223 [0.083]** [0.086]*** [0.088]*** [0.088]** Labor regulations = 1 –0.158 –0.165 –0.159 –0.161 [0.062]** [0.062]*** [0.064]** [0.063]** Inadequately educated workforce = 1 0.002 0.013 0.013 0.038 [0.079] [0.082] [0.083] [0.087] Business licensing and permits = 1 –0.024 –0.035 –0.005 –0.012 [0.071] [0.071] [0.075] [0.075] Access to finance = 1 –0.110 –0.101 –0.126 –0.125 [0.049]** [0.052]* [0.050]** [0.050]** Corruption = 1 –0.030 –0.016 –0.013 –0.015 [0.048] [0.050] [0.051] [0.051] Crime, theft, and disorder = 1 0.118 0.103 0.120 0.133 [0.069]* [0.070] [0.072]* [0.074]* Practices of competitorsin informal sector = 1 –0.103 –0.099 –0.101 –0.108 [0.040]*** [0.041]** [0.041]** [0.041]*** Political instability = 1 0.019 0.010 0.023 0.024 [0.062] [0.062] [0.064] [0.064] Courts = 1 0.022 0.027 0.001 –0.006
[0.072] [0.074] [0.072] [0.072] Establishment type dummies yes yes yes yes Legal status dummies yes yes yes yes Industry dummies yes yes Location Dummies yes Pseudo R-squared 0.022 0.036 0.056 0.083 0.094 Observations 743 743 743 743 743
Notes: Standard errors in brackets; * = significant at 10%; ** = significant at 5%; *** = significant at 1%. Source: Authors’ calculation from WBES 2009 data.

Enterprises in the Philippines: Dynamism and Constraints to Employment Growth | 37
Table 16: Marginal Effects (Medium Firms), 2009
Employment Growth 1 2 3 4 5 Age –0.003 0.002 0.001 –0.004 [0.015] [0.016] [0.016] [0.014] Age squared 0 0 0 0 [0.000] [0.000] [0.000] [0.000] Female owner = 1 0.038 0.026 –0.012 –0.036 [0.082] [0.077] [0.083] [0.086] Female manager = 1 –0.046 –0.070 –0.093 –0.069 [0.083] [0.074] [0.074] [0.066] Exporter = 1 0.057 0.033 0.069 0.046 [0.091] [0.090] [0.104] [0.097] Foreign-owned (jointly) = 1 –0.135 –0.088 –0.072 –0.106 [0.084] [0.082] [0.094] [0.075] Foreign-owned (wholly) = 1 –0.167 –0.128 –0.151 –0.130 [0.086]* [0.087] [0.083]* [0.076]* Education of Top Manager Secondary School = 1 0.837 0.891 0.896 0.932 [0.046]*** [0.055]*** [0.048]*** [0.042]*** University Degree = 1 0.722 0.787 0.758 0.759 [0.093]*** [0.117]*** [0.127]*** [0.135]*** Graduate degree (Philippines) = 1 0.930 0.973 0.978 0.990 [0.028]*** [0.019]*** [0.016]*** [0.010]*** Graduate degree (abroad) = 1 0.891 0.942 0.949 0.975
[0.036]*** [0.033]*** [0.029]*** [0.021]*** Major to Severe Constraint Electricity = 1 0.110 0.070 0.100 0.099 [0.123] [0.111] [0.133] [0.136] Transport = 1 –0.049 –0.070 –0.089 –0.101 [0.154] [0.106] [0.102] [0.060]* Access to land = 1 0.531 0.822 0.793 0.895 [0.271]** [0.160]*** [0.241]*** [0.128]*** Tax rates = 1 –0.067 –0.062 –0.049 –0.032 [0.146] [0.104] [0.114] [0.097] Tax administration = 1 0.396 0.550 0.765 0.875 [0.255] [0.331]* [0.274]*** [0.195]*** Customs and trade regulations = 1 –0.045 0.082 –0.013 –0.017 [0.147] [0.163] [0.130] [0.102] Labor regulations = 1 0.029 –0.002 –0.033 –0.035 [0.185] [0.155] [0.154] [0.117] Inadequately educated workforce = 1 0.069 0.066 0.130 0.396 [0.232] [0.208] [0.308] [0.417] Business licensing and permits = 1 0.454 0.302 0.468 0.669 [0.257]* [0.339] [0.407] [0.375]* Access to finance = 1 –0.176 –0.151 –0.138 –0.159 [0.143] [0.100] [0.113] [0.087]* Corruption = 1 0.109 0.118 0.145 0.247 [0.175] [0.181] [0.221] [0.276] Crime, theft, and disorder = 1 –0.007 –0.098 0.035 –0.021 [0.117] [0.086] [0.163] [0.116] Practices of competitors in informal sector = 1 –0.190 –0.149 –0.178 –0.151 [0.147] [0.101] [0.083]** [0.077]* Political instability = 1 –0.262 –0.134 –0.176 –0.125 [0.105]** [0.115] [0.075]** [0.067]* Courts = 1 –0.003 0.002 0.001 –0.004 [0.015] [0.016] [0.016] [0.014] Establishment type dummies yes yes yes yes Legal status dummies yes yes yes yes Industry dummies yes yes Location Dummies Yes Pseudo R-squared 0.174 0.091 0.260 0.344 0.403 Observations 123 123 123 123 123
Notes: Standard errors in brackets; * = significant at 10%; ** = significant at 5%; *** = significant at 1%. Source: Authors’ calculation from WBES 2009 data.
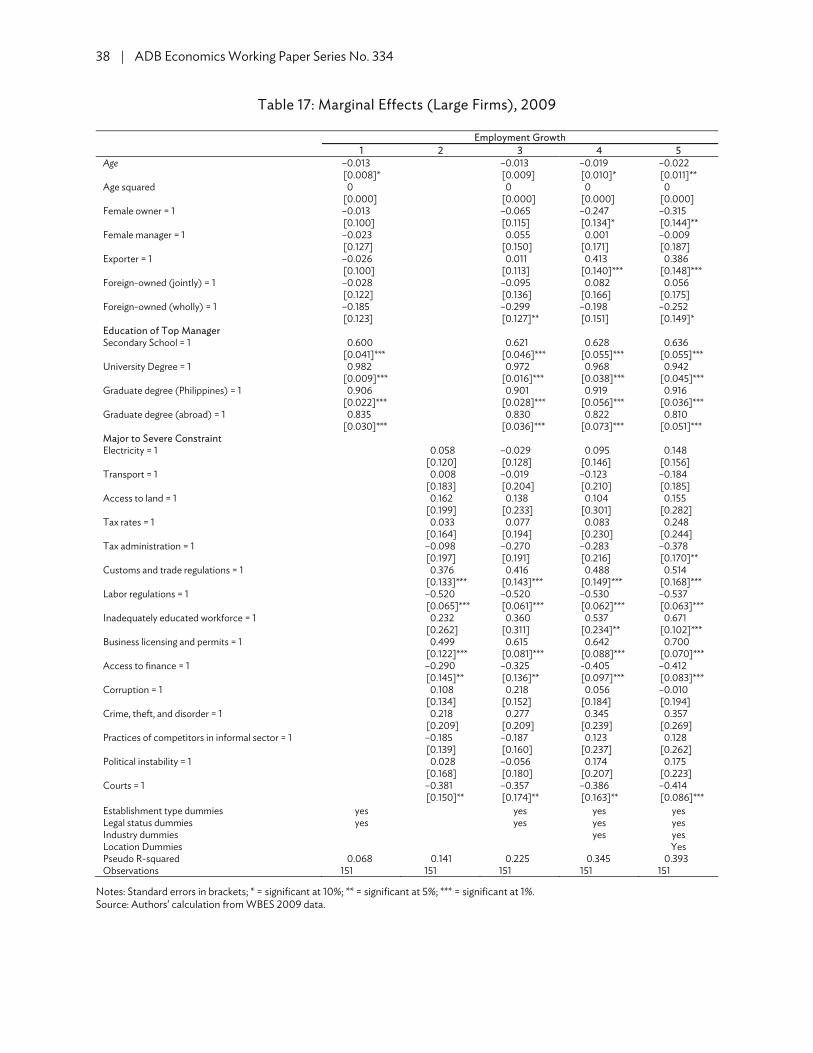
38 | ADB Economics Working Paper Series No. 334
Table 17: Marginal Effects (Large Firms), 2009
Employment Growth 1 2 3 4 5 Age –0.013 –0.013 –0.019 –0.022 [0.008]* [0.009] [0.010]* [0.011]** Age squared 0 0 0 0 [0.000] [0.000] [0.000] [0.000] Female owner = 1 –0.013 –0.065 –0.247 –0.315 [0.100] [0.115] [0.134]* [0.144]** Female manager = 1 –0.023 0.055 0.001 –0.009 [0.127] [0.150] [0.171] [0.187] Exporter = 1 –0.026 0.011 0.413 0.386 [0.100] [0.113] [0.140]*** [0.148]*** Foreign-owned (jointly) = 1 –0.028 –0.095 0.082 0.056 [0.122] [0.136] [0.166] [0.175] Foreign-owned (wholly) = 1 –0.185 –0.299 –0.198 –0.252 [0.123] [0.127]** [0.151] [0.149]* Education of Top Manager Secondary School = 1 0.600 0.621 0.628 0.636 [0.041]*** [0.046]*** [0.055]*** [0.055]*** University Degree = 1 0.982 0.972 0.968 0.942 [0.009]*** [0.016]*** [0.038]*** [0.045]*** Graduate degree (Philippines) = 1 0.906 0.901 0.919 0.916 [0.022]*** [0.028]*** [0.056]*** [0.036]*** Graduate degree (abroad) = 1 0.835 0.830 0.822 0.810
[0.030]*** [0.036]*** [0.073]*** [0.051]*** Major to Severe Constraint Electricity = 1 0.058 –0.029 0.095 0.148 [0.120] [0.128] [0.146] [0.156] Transport = 1 0.008 –0.019 –0.123 –0.184 [0.183] [0.204] [0.210] [0.185] Access to land = 1 0.162 0.138 0.104 0.155 [0.199] [0.233] [0.301] [0.282] Tax rates = 1 0.033 0.077 0.083 0.248 [0.164] [0.194] [0.230] [0.244] Tax administration = 1 –0.098 –0.270 –0.283 –0.378 [0.197] [0.191] [0.216] [0.170]** Customs and trade regulations = 1 0.376 0.416 0.488 0.514 [0.133]*** [0.143]*** [0.149]*** [0.168]*** Labor regulations = 1 –0.520 –0.520 –0.530 –0.537 [0.065]*** [0.061]*** [0.062]*** [0.063]*** Inadequately educated workforce = 1 0.232 0.360 0.537 0.671 [0.262] [0.311] [0.234]** [0.102]*** Business licensing and permits = 1 0.499 0.615 0.642 0.700 [0.122]*** [0.081]*** [0.088]*** [0.070]*** Access to finance = 1 –0.290 –0.325 -0.405 –0.412 [0.145]** [0.136]** [0.097]*** [0.083]*** Corruption = 1 0.108 0.218 0.056 –0.010 [0.134] [0.152] [0.184] [0.194] Crime, theft, and disorder = 1 0.218 0.277 0.345 0.357 [0.209] [0.209] [0.239] [0.269] Practices of competitors in informal sector = 1 –0.185 –0.187 0.123 0.128 [0.139] [0.160] [0.237] [0.262] Political instability = 1 0.028 –0.056 0.174 0.175 [0.168] [0.180] [0.207] [0.223] Courts = 1 –0.381 –0.357 –0.386 –0.414
[0.150]** [0.174]** [0.163]** [0.086]*** Establishment type dummies yes yes yes yes Legal status dummies yes yes yes yes Industry dummies yes yes Location Dummies Yes Pseudo R-squared 0.068 0.141 0.225 0.345 0.393 Observations 151 151 151 151 151
Notes: Standard errors in brackets; * = significant at 10%; ** = significant at 5%; *** = significant at 1%. Source: Authors’ calculation from WBES 2009 data.

Enterprises in the Philippines: Dynamism and Constraints to Employment Growth | 39
V. POLICY IMPLICATIONS AND CONCLUSION To conclude, this research on constraints to enterprises in the Philippines yields several implications. First, our empirical results suggest that rankings from self-reported constraints should be treated with appropriate caution. While these serve as good starting points in designing policies for a better business environment, which have become very popular in recent years, our research shows that the unconditional rankings are not identical to the list of constraints that are found to be actually and significantly correlated with the expansion of firms.
Second, we find correlations between various aspects of economic climate on the growth of
firms. This suggests that policy improvements might increase the dynamism of enterprises in the Philippines. For one, improving access to finance is likely to improve firms’ growth, and not just for small firms. Although the Philippines has already promulgated regulations such as the Magna Carta to ensure access to finance for SMEs, obstacles in obtaining financing turned out to be a serious binding constraint not only for small firms, but for large firms as well.
In addition, further improvements in labor regulations might yield efficiency gains and generate
employment. Due to the intense competition that firms and industries have faced in more recent years, outsourcing and subcontracting laws were revised to allow firms to have more flexibility. In fact, trade unions and collective bargaining are already declining. Still, complaints have been raised about the difficulties posed by the changing and increasing number of holidays in the country, along with regulations concerning termination of workers and employment contracts. While there is a need to ensure workers’ security and welfare protection, it is important to review labor regulations and assess the extent to which they negatively affect growth. At the same time, technical assistance should be provided to micro, small, and medium enterprises to enable them to gradually comply with labor standards. Note that micro enterprises in the Philippines are exempted from the minimum wage law as well as from paying income taxes.
Further, institutional barriers in terms of investing in the Philippines still remain. In addition to
the serious problems of issuance and protection of property rights, as discussed above, practices of competitors and the informal sector continue to be a major concern among firms. While there are some laws for the protection of property rights, implementation of such remain weak in the country. Given weak enforcement of rules and porous borders, smuggling has been a huge problem in the Philippines and has undermined the growth of domestic industries. It is extremely important to adopt measures to strengthen the legal and regulatory framework combined with effective and enhanced enforcement to address smuggling of goods and counterfeits into the country and prevent unfair competition.
Third, the previous sections also highlight the fact that size matters in terms of how the
perceived obstacles affect the firms. Depending on which size-group, policies should be tailor-fitted to each group to be more effective. For example, to improve access to finance for SMEs, the implementation of the Central Credit Information Corporation would be most beneficial and must therefore be expedited. Training and capacity building programs for SMEs to improve their financial literacy and management capacity would also be necessary. Equally important is the need for the government to review the impact of its SME lending activities, along with its other SME programs, on training and marketing, and identify whether these are the correct interventions and responses to the current financing issues faced by MSMEs.

40 | ADB Economics Working Paper Series No. 334
Finally, there is a dearth of data that would be necessary for rigorous empirical-based policy making. Although there were a number of laws and policies that were enacted specifically to address the needs of SMEs, there have been very little rigorous analysis and studies on how effective these have been. Proper monitoring and evaluation should be conducted to see what works and what does not to avoid inefficiencies and redundancies. Lack of a panel data on firms and constraints pose a challenge for more rigorous analysis. These data need to be collected and built to come up with a more meaningful and more accurate analysis, which will provide a rich source of information for policy makers.

REFERENCES Aldaba, R., Erlinda Medalla, Fatima del Prado, and Donald Yasay. 2010. Integrating SMEs into the East
Asian Region: The Philippines. PIDS Discussion Paper Series No. 2010-31. Manila: PIDS. Aldaba, R. 2011. SMEs Access to Finance: Philippines. Chapter 10 in Harvie. In Charles et al. eds. SMEs
Access to Finance in Selected East Asian Economies. ERIA Research Project Report 2010. No. 14. ERIA. Jakarta, Indonesia.
______. 2012. Small and Medium Enterprises' (SMEs) Access to Finance: Philippines. PIDS Discussion
Paper Series No. 2012-05. Manila: PIDS. Amemiya, Takeshi. 1994. Introduction to Statistics and Econometrics. Cambridge, MA: Harvard
University Press. Asian Development Bank (ADB). 2009. Enterprises in Asia: Fostering Dynamism in SMEs. Special
Chapter of Key Indicators for Asia and the Pacific 2009. Manila. Ayyagari, Meghana, Asli Demirgüç-Kunt, and Vojislav Maksimovic. 2008. How Important Are
Financing Constraints? The Role of Finance in The Business Environment. World Bank Economic Review. 22 (3). pp. 483–516.
Beck, T., A. Demirgüç-Kunt, and V. Maksimovic. 2005. Financial and Legal Constraints to Growth:
Does Firm Size Matter? The Journal of Finance. 60 (1). pp. 137–177. Board of Investments. Basic Facts for Investors. http://www.boi.gov.ph/pdf/basicfacts.pdf Cabral, L. and J. Mata, 2003. On the Evolution of the Firm Size Distribution: Facts and Theory.
American Economic Review. 93 (4). pp. 1075–1090. Department of Trade and Industry. http://www.dti.gov.ph FINEX and ACERD. 2006. Making SMEs Work, Making SMEs Create Work: Job Creation Through
Small and Medium Enterprise Development. A joint paper by the Ateneo Center for Research and Development (ACERD) and the Financial Executives Institute of the Philippines (FINEX).
Fukumoto, M. 2004. Development Policies for Small and Medium Enterprises in APEC In the case of
the Philippines. APEC Study Center Institute of Developing Economies. Gibrat, R. 1931. Les Inegalites Economiques. Librairie du Recueil Sirey. Paris. Hapitan, R. 2005. Competition Policy and Access of Small and Medium Enterprises (SMEs) to
Financial Services: A Review of Selected SMEs. Makati: Philippine Institute for Development Studies.
Henrekson, M. and D. Johansson. 1999. Institutional Effects on the Evolution of the Size Distribution of
Firms. Small Business Economics. 12. pp. 11–23.

Kumar, K.B., R.G. Rajan, and L. Zingales. 1999. What Determines Firm Size? CEPR Discussion Papers 2211.
Medalla, E. 2002. Trade and Industrial Policy Beyond 2000: An Assessment of the Philippine
Economy. Chapter 5. In J. Yap ed. The Philippines Beyond 2000: An Economic Assessment. Makati City: Philippine Institute for Development Studies.
Micro, Small and Medium Enterprise Council. 2003. Small and Medium Enterprise Development
Council Resolution No. 01. Series of 2003. 16 January. Nangia, R. and L. Vaillancourt. 2006. Small and Medium Enterprise Financing in the Philippines.
International Finance Corporation. National Statistical Coordination Board (NSCB). http://www.nscb.gov.ph National Statistics Office (NSO). http://www.census.gov.ph Oi, W. and T.L. Idson. 1999. Firm Size and Wages. In Orley C. Ashenfelter and David Card, eds.
Handbook of Labor Economics. Volume 3B. Amsterdam, The Netherlands: Elsevier B.V. Rajan, R. and L. Zingales. 1998. Financial Dependence and Growth. The American Economic Review. 88.
pp. 559–586. Reside, R. 2006. Towards Rational Fiscal Incentives. UPSE Discussion Paper. http://www.econ.upd
.edu.ph/respub/dp/pdf/DP2006-01.pdf Small Business Corporation. http://www.sbgfc.org.ph accessed May 2011). Sicat, G. 2005. Reform of the Economic Provisions of the Constitution: Why National Progress Is at
Stake. UPSE Discussion Paper No. 0510. http://www.econ.upd.edu.ph/respub/dp/pdf/DP2005 -10.pdf
Sutton, J. 1997. Gibrat's Legacy. Journal of Economic Literature. 35 (1). pp. 40–59. Tariff Commission. http://www.tariffcommission.gov.ph/tariff1.html (accessed May 2011). Tecson, G. 2004. Review of Existing Policies Affecting Micro, Small and Medium Enterprises (MSMEs)
In the Philippines. Makati, Philippines: Small and Medium Enterprises and Development for Sustainable Employment Program.
World Bank. World Bank Enterprise Surveys (WBES). http://www.enterprisesurveys.org (accessed
January 2011).

ASIAN DEVELOPMENT BANK
AsiAn Development BAnk6 ADB Avenue, Mandaluyong City1550 Metro Manila, Philippineswww.adb.org
Enterprises in the PhilippinesDynamism and Constraints to Employment Growth
Niny Khor, Iva Sebastian, and Rafaelita Aldaba analyze factors that affect the growth of enterprises in the Philippines. The authors attempt to provide a comprehensive background on the various policies and legislation that affect firms. They investigate which of the reported constraints in the business environments, within which these firms operate, are binding. The significant binding constraints across various specifications include customs and trade regulations, labor regulations, access to finance, and practices of competitors in the informal sector.
About the Asian Development Bank
ADB’s vision is an Asia and Pacific region free of poverty. Its mission is to help its developing member countries reduce poverty and improve the quality of life of their people. Despite the region’s many successes, it remains home to approximately two-thirds of the world’s poor: 1.6 billion people who live on less than $2 a day, with 733 million struggling on less than $1.25 a day. ADB is committed to reducing poverty through inclusive economic growth, environmentally sustainable growth, and regional integration.
Based in Manila, ADB is owned by 67 members, including 48 from the region. Its main instruments for helping its developing member countries are policy dialogue, loans, equity investments, guarantees, grants, and technical assistance.
EntErPrisEs in thE PhiliPPinEs: DynAmism AnD ConstrAints to EmPloymEnt GrowthNiny Khor, Iva Sebastian, and Rafaelita Aldaba
adb economicsworking paper series
no. 334
February 2013