Enterprise Products Partners L.P. - Latest Oil, Energy ... · PDF fileCrude Oil Gas Gas EPD...
27
All rights reserved. Enterprise Products Partners L.P. Enterprise Products Partners L.P. Platts NGLs Conference September 23, 2013 Lynn Bourdon Group SVP www.enterpriseproducts.com
-
Upload
truongdang -
Category
Documents
-
view
217 -
download
2
Transcript of Enterprise Products Partners L.P. - Latest Oil, Energy ... · PDF fileCrude Oil Gas Gas EPD...

All rights reserved. Enterprise Products Partners L.P.
Enterprise Products Partners L.P.Platts NGLs Conference
September 23, 2013
Lynn BourdonGroup SVPwww.enterpriseproducts.com
All rights reserved. Enterprise Products Partners L.P. 2
Forward–Looking Statements
This presentation contains forward-looking statements based on the beliefs of the company,as well as assumptions made by, and information currently available to our managementteam. When used in this presentation, words such as “anticipate,” “project,” “expect,” “plan,”“seek,” “goal,” “estimate,” “forecast,” “intend,” “could,” “should,” “will,” “believe,” “may,”“potential” and similar expressions and statements regarding our plans and objectives forfuture operations, are intended to identify forward-looking statements.Although management believes that the expectations reflected in such forward-lookingstatements are reasonable, it can give no assurance that such expectations will prove to becorrect. You should not put undue reliance on any forward-looking statements, which speakonly as of their dates. Forward-looking statements are subject to risks and uncertainties thatmay cause actual results to differ materially from those expected, including insufficient cashfrom operations, adverse market conditions, governmental regulations, the possibility that taxor other costs or difficulties related thereto will be greater than expected, the impact ofcompetition and other risk factors discussed in our latest filings with the Securities andExchange Commission.All forward-looking statements attributable to Enterprise or any person acting on our behalfare expressly qualified in their entirety by the cautionary statements contained herein, in suchfilings and in our future periodic reports filed with the Securities and Exchange Commission.Except as required by law, we do not intend to update or revise our forward-lookingstatements, whether as a result of new information, future events or otherwise.

All rights reserved. Enterprise Products Partners L.P. 3
Topics
Shale Fundamentals
NGL Supply Potential
U.S. LPG Export Update
Ethane Fundamentals and A New Market?
On Purpose Polymer Production
Questions

All rights reserved. Enterprise Products Partners L.P. 4
Key Investment Considerations
One of the largest U.S. publicly traded energy partnerships with an enterprise value of more than $70 billion 64th on Fortune 500
Integrated midstream energy system serving producers and consumers of natural gas, natural gas liquids (NGLs), crude oil, petrochemicals and refined productsDiversified sources of cash flowVisibility to growth with approximately $8.0 billion of capital projects currently under constructionInvestor-friendly structure and history of successful execution
• No General Partner incentive distribution rights (IDRs) – lower cost of capital
• Top credit rated MLP – Baa1 / BBB+ • Raised distribution in each of the last 36 consecutive quarters• 7.1% distribution growth for 2Q13 vs. 2Q12• Significant insider ownership with management and affiliates
owning ≈38% of EPD units outstanding

All rights reserved. Enterprise Products Partners L.P. 5
EPD Portfolio of Integrated Assets
50,000 miles of natural gas, NGL, crude oil, refined products and petrochemical pipelines200 MMBbls of NGL, refined products and crude oil, and 14 Bcf of natural gas storage capacity24 natural gas processing plants
22 NGL & Propylene fractionators6 offshore hub platformsNGL import / export terminals (including LPG)Butane isomerization complex; octane enhancement facility; high-purity isobutylene facility
Major Asset Overview

All rights reserved. Enterprise Products Partners L.P. 6
0 500250Miles
Source: EPD Fundamentals; USGS Production 2008
Crude OilGas
Gas
EPD Pipelines
Existing North American Production
Shale Plays
Oil
Liquids (NGL & Products)
Existing Wells and Shale PlaysShales: Source Rock of Conventional Oil and Gas
Marcellus – 100 years
Utica – 80 years
Bakken / Williston – 35 years
Eagle Ford – 45 years
Mississippian – 40 years
Barnett – 30 yearsHaynesville / Bossier – 80 years
POTENTIAL YEARS OF DRILLING
All rights reserved. Enterprise Products Partners L.P. 7
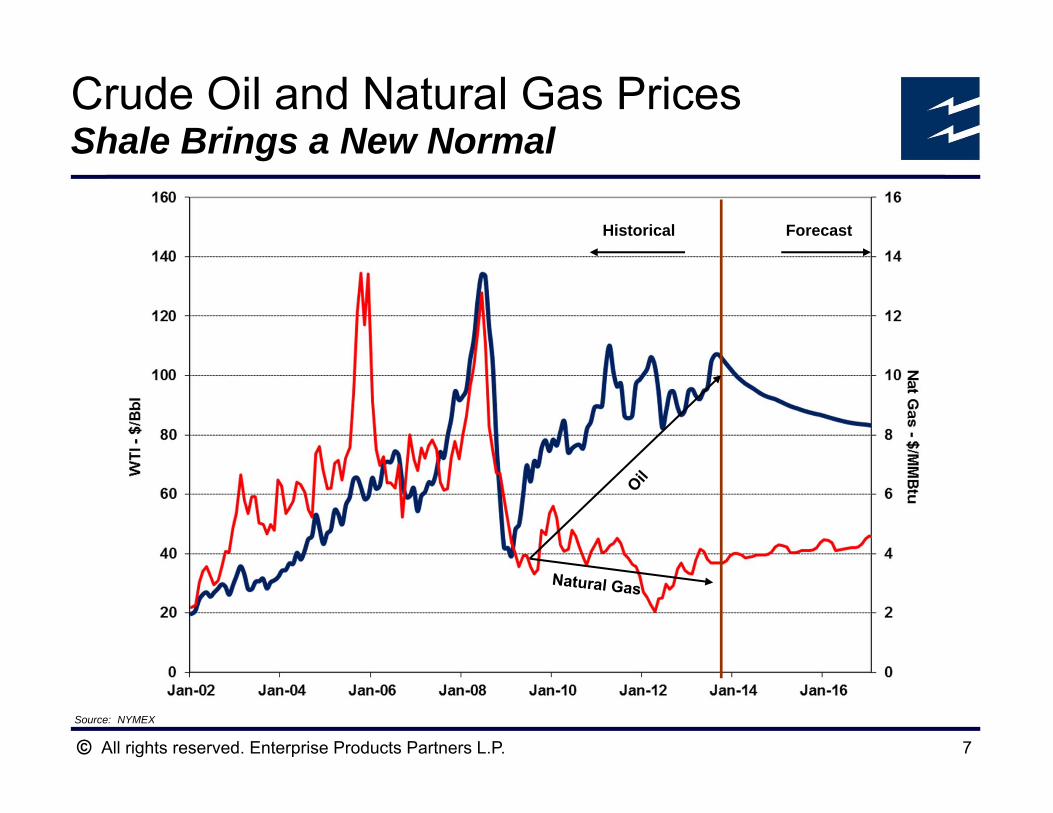
Crude Oil and Natural Gas Prices Shale Brings a New Normal
Source: NYMEX
Historical Forecast

All rights reserved. Enterprise Products Partners L.P. 8
Plentiful Supply Available Below $5
Potential gas additions 2012 to 2025 (Bcfd)
Gas Price Required for 20% Before Income Tax (BFIT) ReturnsIncludes NGL Upgrade (if any)
2 to 4Bcf/d
2 to 5Bcf/d
1 to 3Bcf/d
2 to 5Bcf/d
1 to 2Bcf/d
4 to 5Bcf/d
1 to 3Bcf/d
2 to 3Bcf/d
5 to 11Bcf/d
1 to 2Bcf/d
2 to 3Bcf/d
1 to 4Bcf/d
Source: EPD Fundamentals
Potential Gas Additions – 25 to 50 Bcf/d by 2025

All rights reserved. Enterprise Products Partners L.P. 9
Rich Gas Dominates
Source: EPD Fundamentals

All rights reserved. Enterprise Products Partners L.P. 10
Producer NGL UpliftUsing 12 Month Strip
Source: EPD Fundamentals and NYMEX; as of September 2013

All rights reserved. Enterprise Products Partners L.P. 11
NG Demand Growth Next 5–7 YearsPower Generation, Industrial and Exports
GulfEG1.0
SEEG1.0
NEEG1.0MW
EG2.0
WestEG1.0
INDUST.2.0–4.0
Export6.0
RC0.7–1.5
Oil Sands(Demand)
1.0–1.5
Power Generation* 4.0–7.0
Industrial / Chems 2.0–4.0
NGVs 0.5–1.5
LNG Exports 4.0–6.0
R/C Conversion 0.5–1.5
Potential (Bcf/d) 11–20* Depends on emission and CO2 rulesSources: EIA and EPD Fundamentals

All rights reserved. Enterprise Products Partners L.P. 12
ROCKIES
PERMIAN
MID-CONTINENT
APPALACHIAN
GULF COAST
OTHER
131
902
694
975
8394966
Total Mbd 1425
2013-2015 Growth
2015-2020 Growth
April 2013 Actual
U.S. NGL Supply PotentialAssuming Sufficient Markets
MBbls/d
MBD
Source: EPD Fundamentals

All rights reserved. Enterprise Products Partners L.P. 13
NGLs – U.S. Demand Matrix
NGL Ethane PropaneNormal Butane Iso-Butane
Natural Gasoline
Percent of NGL BBL 40% 30% 8% 10% 12%
Petrochemicals
Heating, Crop Drying, Fuels
Motor Fuels
Export
Source: EPD Fundamentals
All rights reserved. Enterprise Products Partners L.P. 14
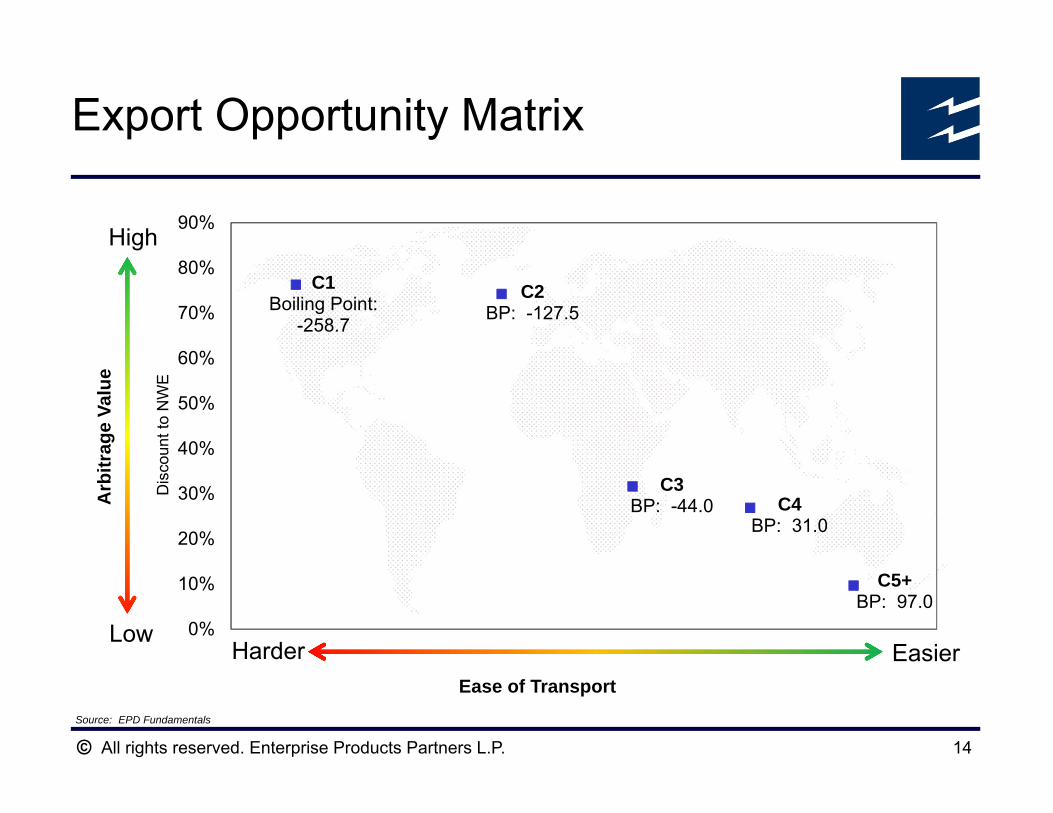
Export Opportunity Matrix
C1Boiling Point:
-258.7
C2BP: -127.5
C3BP: -44.0 C4
BP: 31.0
C5+BP: 97.0
0%
10%
20%
30%
40%
50%
60%
70%
80%
90%
Dis
coun
t to
NW
E
Ease of Transport
Harder EasierLow
High
Arb
itrag
e Va
lue
Source: EPD Fundamentals

All rights reserved. Enterprise Products Partners L.P. 15
Propane and Butane Daily Balances
Exports will continue to be the balancing factor for LPGsSource: EPD Fundamentals
Demand Low CasePropane Butanes
Incremental Supply Potential 573 354 Less: PDH 60
Incremental Exports 375 50 Incremental Cracker / Refining Demand 100
Add: Cracker Conversion To Ethane 100
Excess Supply Potential MBbl/d 238 204
Demand High CasePropane Butanes
Incremental Supply Potential 573 354 Less: PDH 120
Incremental Exports 450 150 Incremental Cracker / Refining Demand 150
Add: Cracker Conversion To Ethane 100
Excess Supply Potential MBbl/d 103 54
(MBbls/d)
(MBbls/d)

All rights reserved. Enterprise Products Partners L.P. 16
Propane: Growing Supply Keeps Prices Low
Sources: Argus and OPIS
The U.S. has become more favorably priced and competitive in the worldwide market due to the impact of shale production on Natural Gas and LPG supply volumes.
Incentive For Exports
Global Propane Prices

All rights reserved. Enterprise Products Partners L.P. 17
0
10
20
30
40
50
60
70
80
Qatar U.S.A. Saudi Arabia U.A.E. Norway Algeria Kuwait Venezuela Nigeria
Milli
on B
arre
ls
EPD Others
Led by Enterprise’s Loadings, the U.S. is Now the Top Propane Exporter…
Top Propane Exporters 2013 YTD
Source: Waterborne
20132012 2013201220132012

All rights reserved. Enterprise Products Partners L.P. 18
-
10
20
30
40
50
60
70
80
90
100
110
120
130
Qatar U.S.A. Saudi Arabia U.A.E. Norway Algeria Kuwait Venezuela Nigeria
Mill
ion
Bar
rels
Butane Propane
…However U.S. Butane Exports Have Lagged Behind, But Not For Long
Top LPG Exporters 2013 YTD
Source: Waterborne
20132012 20132012

All rights reserved. Enterprise Products Partners L.P. 19
EPD’s LPG Export SystemThe World Class Facility Continues to Grow
EPD has 655 MBPD of fractionation capacity that can produce LE propane
Pipeline interconnectivity provides access to additional supply
Multiple high rate propane wells that can deliver at 10,000 BPH each
Integrated pipeline system that is dedicated to the delivery of propane and butane to docks for export
Export capacity expansion is completePropane: 13,500 BPH
Butane: 12,000 BPH
EPD has the ability to load LPG vessels at multiple docks
EPD terminal has been in this business for 30 years and has unloaded / loaded over 397 MMBbls of LPG (over 3,000 Loads)
Evaluating further enhancements

All rights reserved. Enterprise Products Partners L.P. 20
The Importance of ExportsCritical in Maintaining NGL Production
20
40
60
80
100
120
140
Jan Feb Mar Apr May Jun Jul Aug Sept Oct Nov Dec
MMBPropane Inventory Forecast
(excludes Propylene)
Min 2000-11 2012 2012 Inventory if Exports excludedRange 2005–2011
Without exports, inventory overhang likely devastating to rig counts
Normal Range2012 Inventories
2012 Inventories without Exports!
Sources: EPD Fundamentals and EIA

All rights reserved. Enterprise Products Partners L.P. 21
1,000
1,200
1,400
1,600
1,800
2,000
2,200
2,400
2013 2014 2015 2016 2017 2018 2019 2020
MB
PD
Supply Forcast Cracker Demand Non Waterborne Export Demand
Ethane Supply / Demand PictureLooking for a New Market
Available for Export
Source: EPD Fundamentals

All rights reserved. Enterprise Products Partners L.P. 22
0
10
20
30
40
50
60
70
U.S. (Ethane) U.S. (Naphtha) W. Europe(Naphtha)
Far East Asia(Naphtha)
Oct-2005 Current
U.S. Ethylene Crackers: Significant Global Cost Advantage
Using an average ethylene plant (≈1.5 billion lbs. per year), a 40 cent per lb. margin advantage is
≈$700MM per year incremental margin for a single plant!
Sources: IHS and EPD Fundamentals
U.S
. Cen
ts P
er P
ound

All rights reserved. Enterprise Products Partners L.P. 23
Ethane (MTBV)
Naphtha (NWE)
cpg 25 250
Ethylene Costs (Dollars per pound) $.08 $.48
Savings of $700 Million per YearTotal NWE Ethylene Capacity:
23.7 MM mt/year
Converting 1/3 of NWE operating capacity to ethane feed equals 415 MBPD of ethane demandSource: EPD Fundamentals
NWE is a Prime Opportunity for a New Ethane Outlet

All rights reserved. Enterprise Products Partners L.P. 24
Changing to an Ethane Feedstock Has a Dramatic Impact on Co-Product Supply
0
0.1
0.2
0.3
0.4
0.5
0.6
0.7
Propylene Crude C4s Pyrolysis Gas
Poun
d Yi
eld
per P
ound
Eth
ylen
e
Naphtha Ethane
Converting a 1.5 Billion Lb/year naphtha cracker to ethane reduces propylene production by 740 Million Lbs/year and butane production by 390 Million Lbs/year
Source: IHS CMAI

All rights reserved. Enterprise Products Partners L.P. 25
On Purpose Propylene Production is Expected to Fill the Gap
Source: IHS CMAI
0
5
10
15
20
25
30
35
40
2007 2008 2009 2010 2011 2012 2013 2014 2015 2016 2017 2018 2019 2020
Million Po
unds
Stm. Cracker Production FCC Splitters Imports Total Demand
PDH GapEconomic Recession
All rights reserved. Enterprise Products Partners L.P. 26
Summary
Shale resources are significant and long termEven with projected robust gas demand growth there is still 25 Bcf/d of gas supply “on the shelf” at low prices U.S. LPG exports will continue to serve as a viable balancing mechanism for U.S. supply and demandEurope and Asia appear to be new markets for U.S. Ethane Global naphtha crackers cannot ignore the U.S. ethane cost advantage

All rights reserved. Enterprise Products Partners L.P. 27
Thank you!
Questions?