
Enterprise Horizons
19
Geo-Optimizing Geo-Optimizing Supply Supply Chains using SOA Chains using SOA - - Business Case for SKF Business Case for SKF
-
Upload
thesupplychainniche -
Category
Documents
-
view
251 -
download
0
Transcript of Enterprise Horizons
Geo-OptimizingGeo-Optimizing Supply Supply Chains using SOAChains using SOA- - Business Case for SKFBusiness Case for SKF
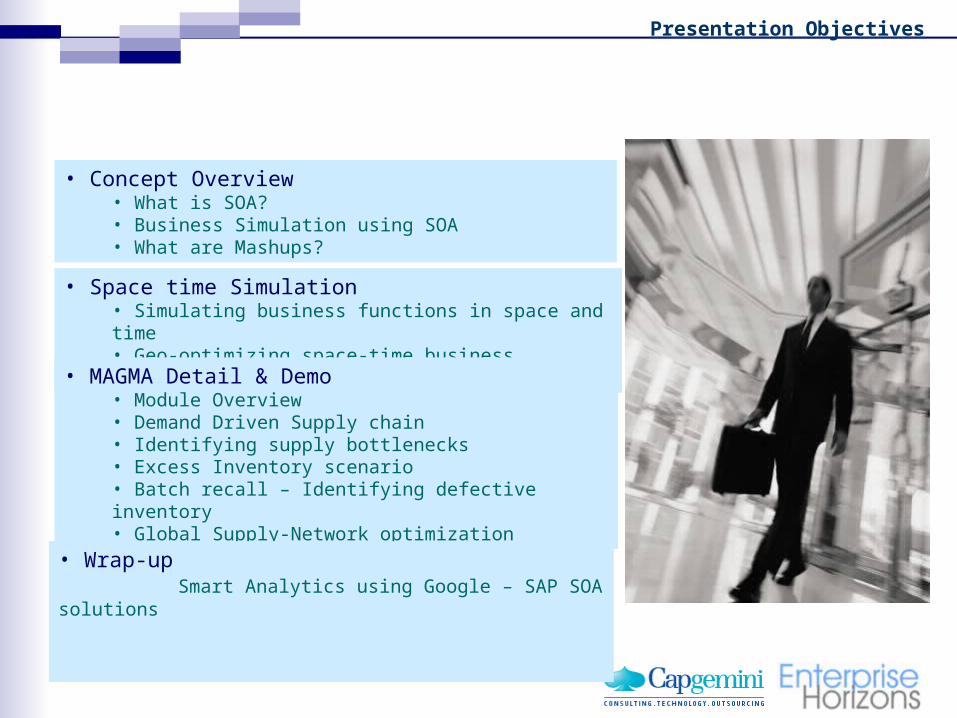
• Concept Overview• What is SOA?• Business Simulation using SOA• What are Mashups?
• Space time Simulation• Simulating business functions in space and time• Geo-optimizing space-time business functions
Presentation Objectives
• MAGMA Detail & Demo• Module Overview• Demand Driven Supply chain• Identifying supply bottlenecks• Excess Inventory scenario• Batch recall – Identifying defective inventory• Global Supply-Network optimization
• Wrap-up Smart Analytics using Google – SAP SOA solutions
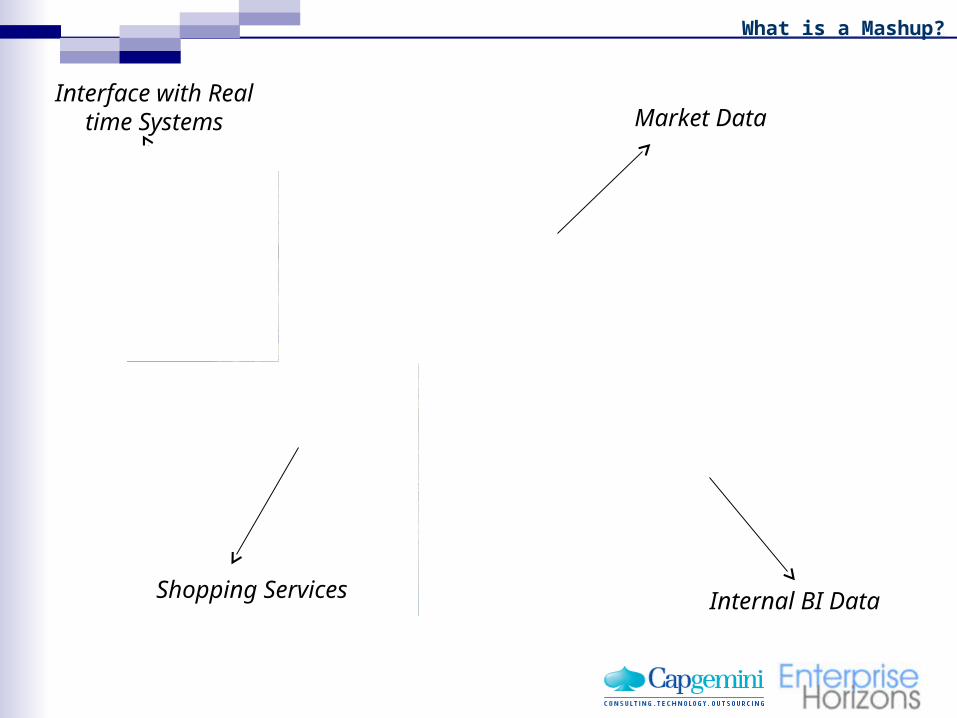
What is a Mashup?
Interface with Real time Systems
Internal BI DataShopping Services
Market Data
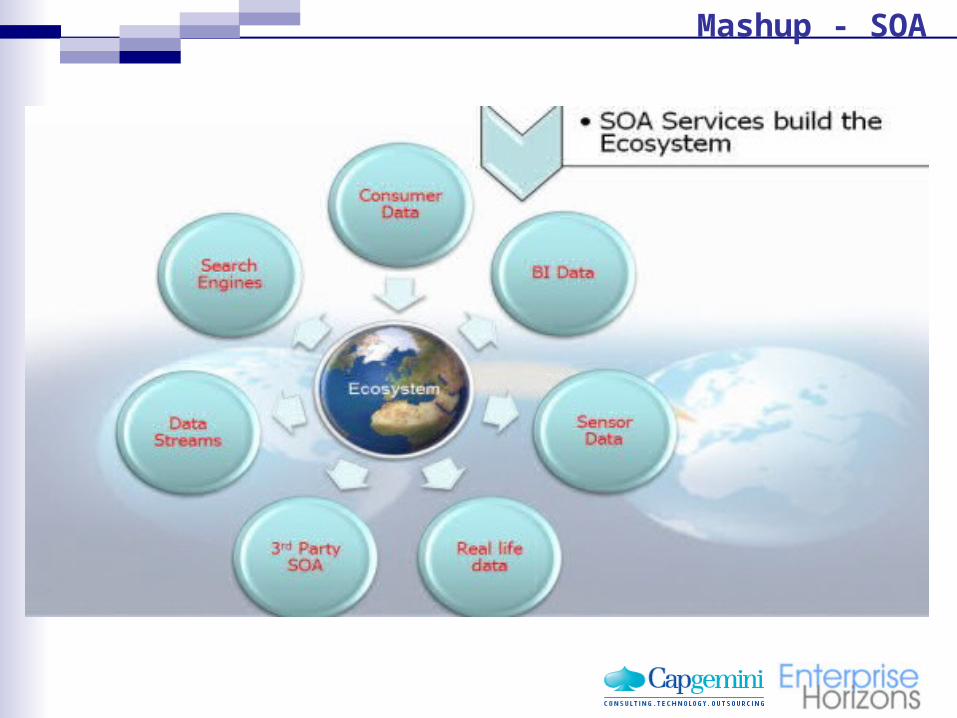
Mashup - SOA
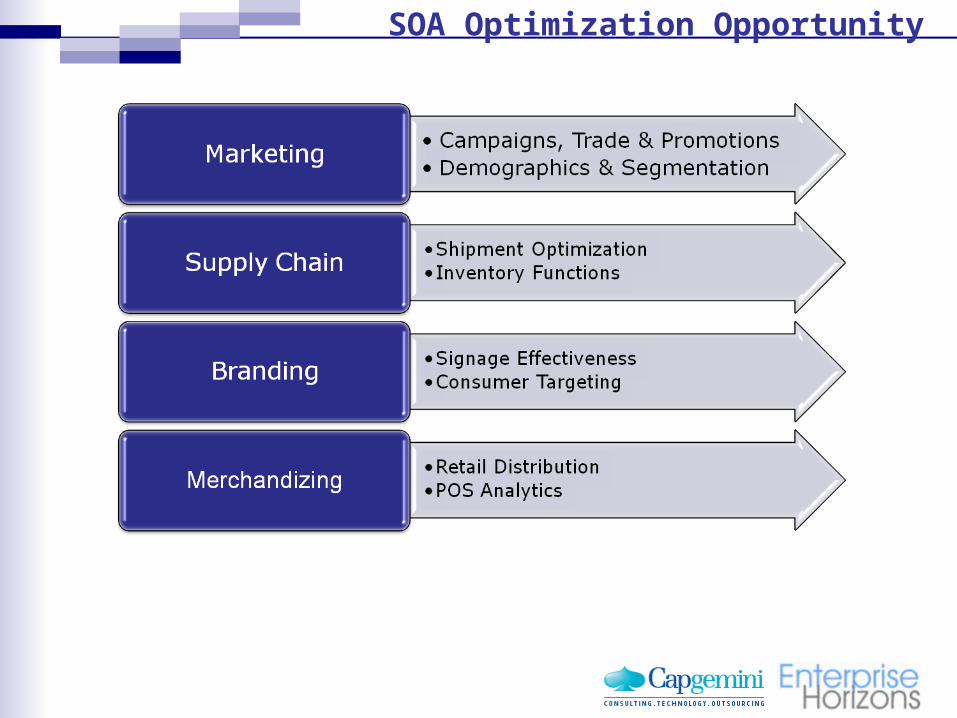
SOA Optimization Opportunity
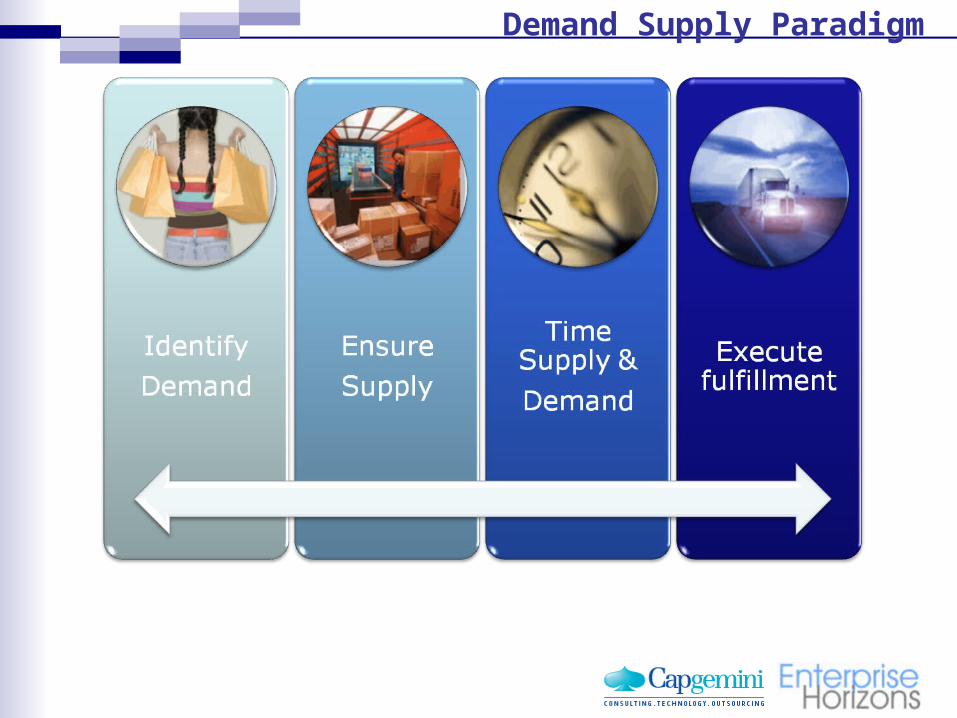
Demand Supply Paradigm
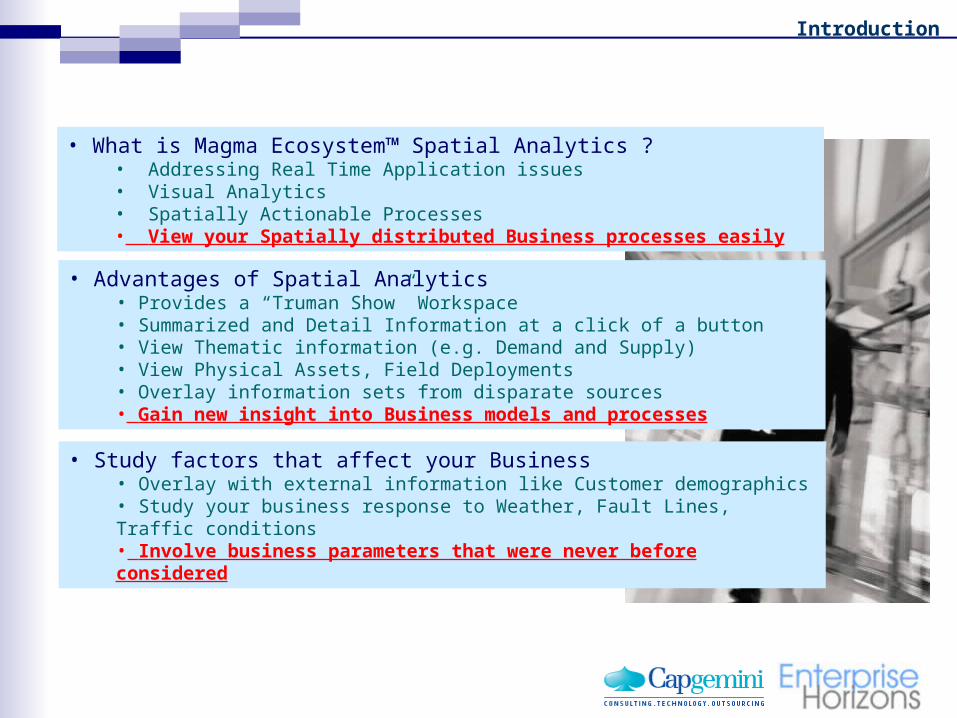
• What is Magma Ecosystem™ Spatial Analytics ?• Addressing Real Time Application issues• Visual Analytics• Spatially Actionable Processes• View your Spatially distributed Business processes easily
• Advantages of Spatial Analytics• Provides a “Truman Show” Workspace• Summarized and Detail Information at a click of a button • View Thematic information (e.g. Demand and Supply)• View Physical Assets, Field Deployments• Overlay information sets from disparate sources• Gain new insight into Business models and processes
• Study factors that affect your Business• Overlay with external information like Customer demographics• Study your business response to Weather, Fault Lines, Traffic conditions• Involve business parameters that were never before considered
Introduction
Demographics
Yield Optimizatio
n
Customer Distribution
WeatherBillboard
Visualizations
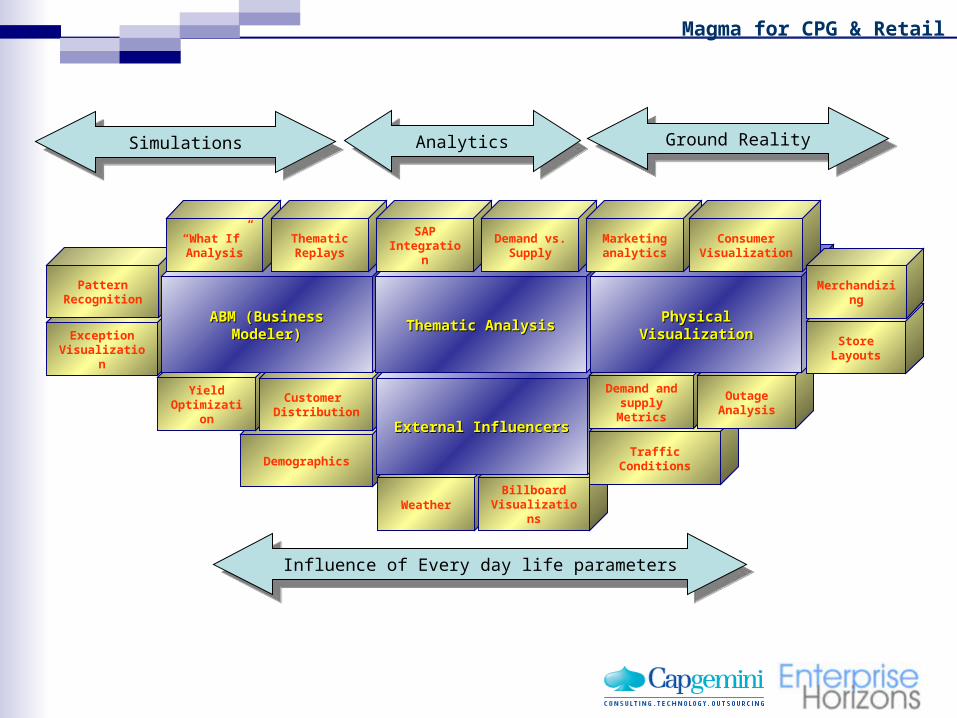
External InfluencersExternal Influencers
Traffic Conditions
Exception Visualization
Pattern Recognition
ABM (Business ABM (Business Modeler)Modeler)
“What If” Analysis
Thematic Replays
Magma for CPG & Retail
Thematic AnalysisThematic Analysis
SAP Integration
Demand vs. Supply
Demand and supply
Metrics
Outage Analysis
Physical VisualizationPhysical VisualizationStore
Layouts
Marketing analytics
Consumer Visualization
Merchandizing
SimulationsSimulations AnalyticsAnalytics Ground RealityGround Reality
Influence of Every day life parametersInfluence of Every day life parameters
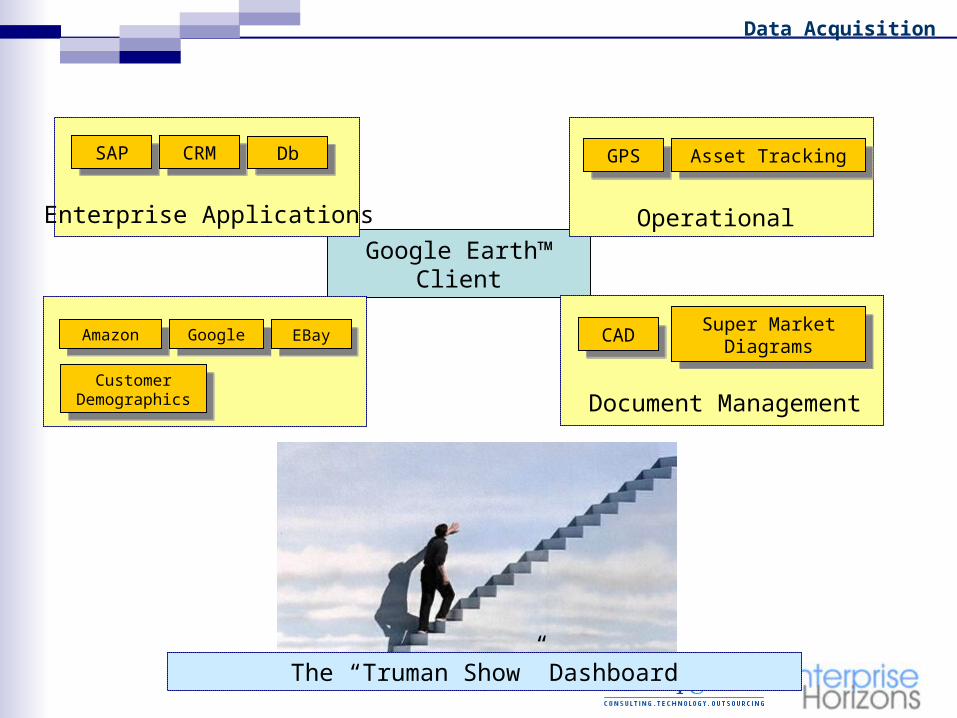
Google Earth™Client
Data Acquisition
The “Truman Show” Dashboard
SAPSAP CRMCRM DbDb
Enterprise Applications
GPSGPS Asset TrackingAsset Tracking
Operational
CADCAD Super Market Diagrams
Super Market Diagrams
Document Management
AmazonAmazon GoogleGoogle EBayEBay
Customer Demographics
Customer Demographics
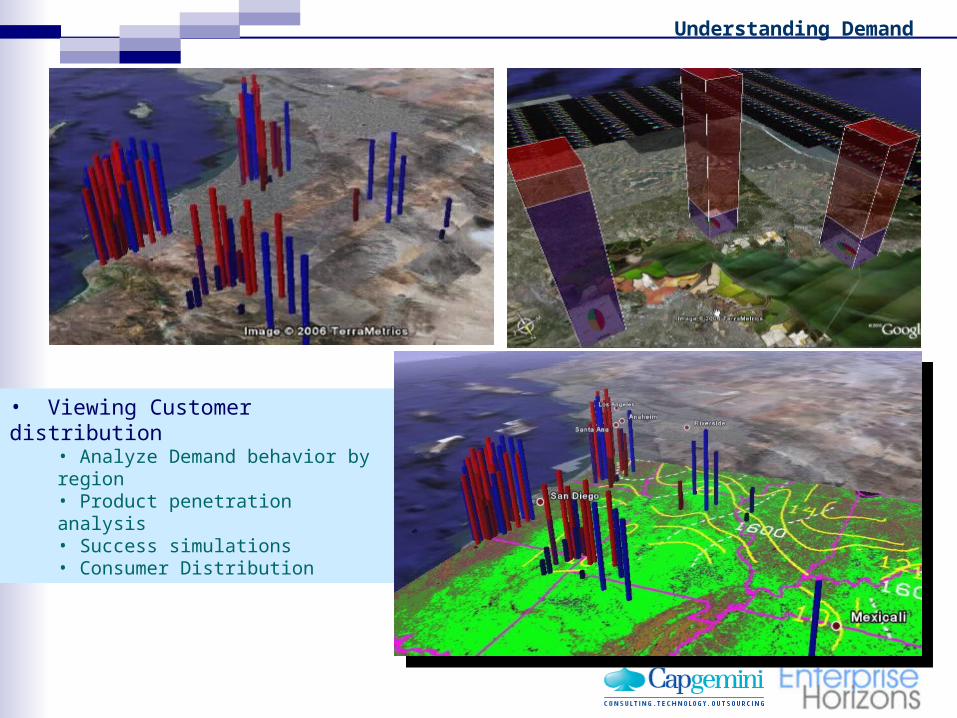
• Viewing Customer distribution• Analyze Demand behavior by region• Product penetration analysis• Success simulations• Consumer Distribution
Understanding Demand
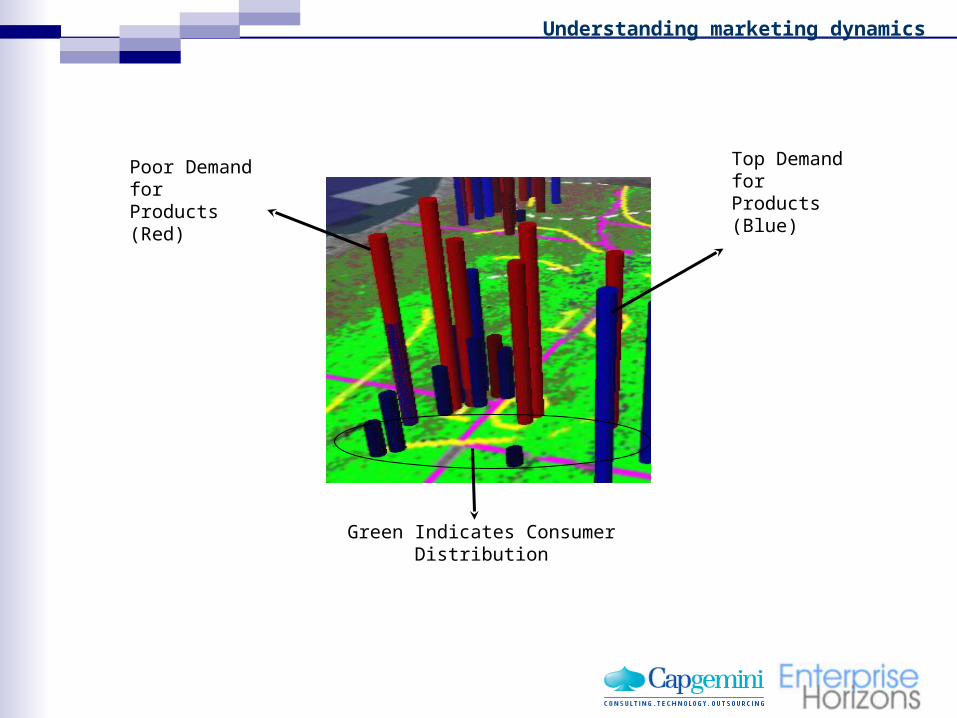
Understanding marketing dynamics
Poor Demand for Products (Red)
Top Demand for Products (Blue)
Green Indicates Consumer Distribution
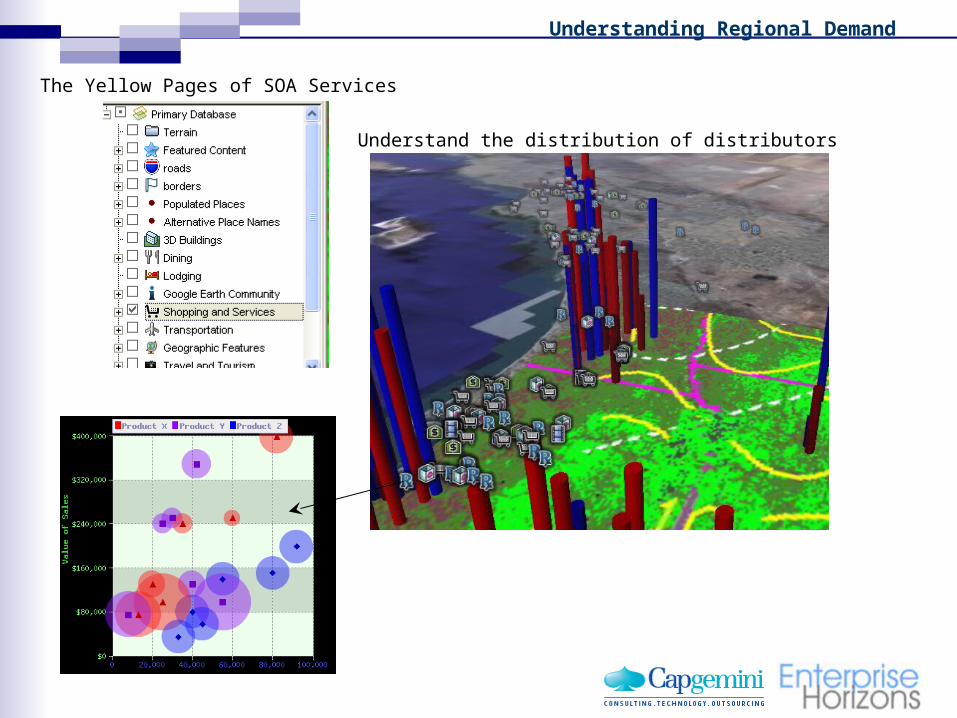
The Yellow Pages of SOA Services
Understand the distribution of distributors
Understanding Regional Demand
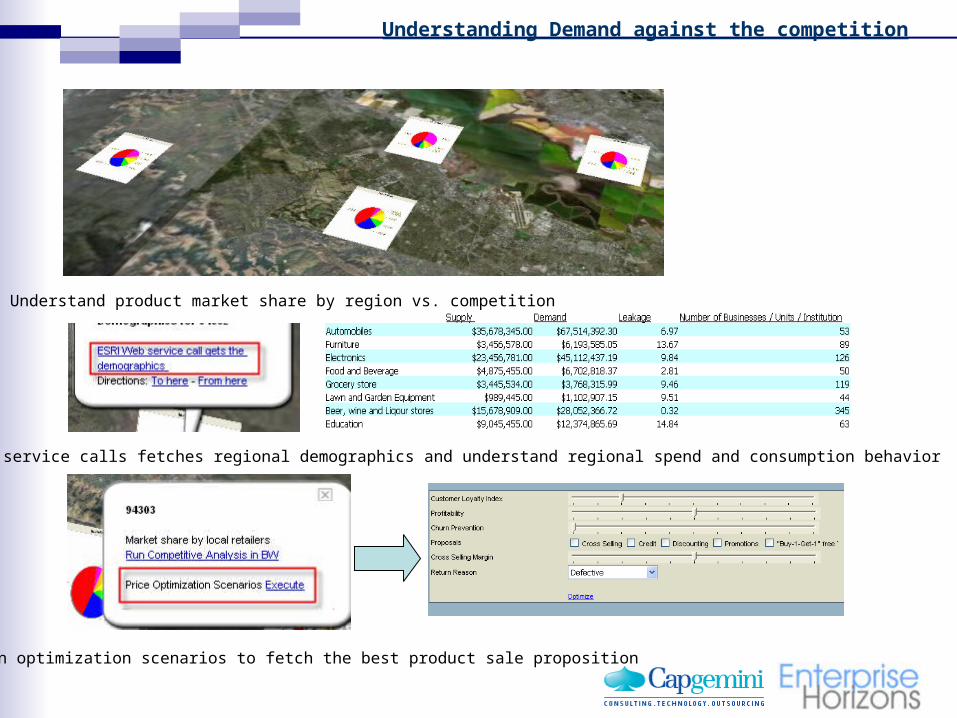
Understanding Demand against the competition
Understand product market share by region vs. competition
Web service calls fetches regional demographics and understand regional spend and consumption behavior
Run optimization scenarios to fetch the best product sale proposition
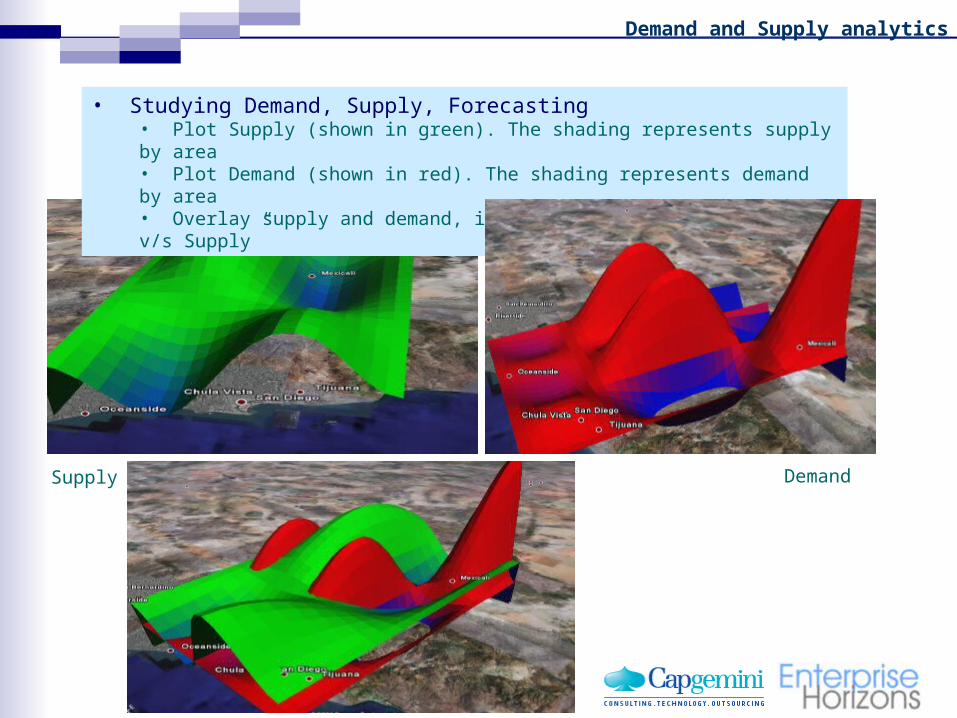
Demand and Supply analytics
• Studying Demand, Supply, Forecasting• Plot Supply (shown in green). The shading represents supply by area• Plot Demand (shown in red). The shading represents demand by area• Overlay supply and demand, intersection represents “Demand v/s Supply”
Supply Demand
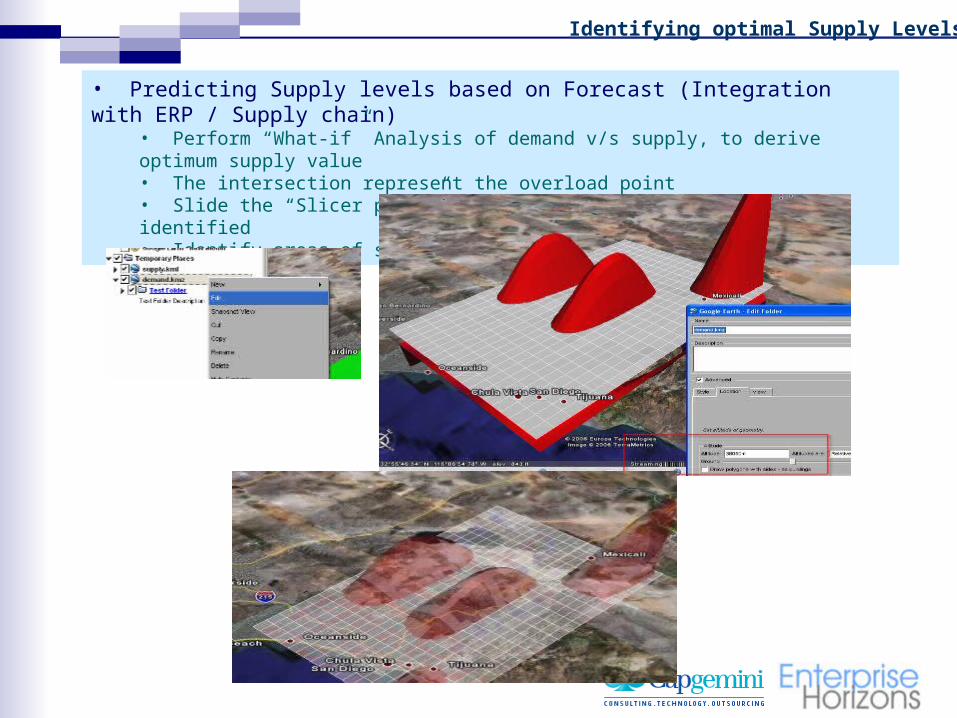
Identifying optimal Supply Levels
• Predicting Supply levels based on Forecast (Integration with ERP / Supply chain)
• Perform “What-if” Analysis of demand v/s supply, to derive optimum supply value• The intersection represent the overload point• Slide the “Slicer plane”, till the optimum tip-over is identified• Identify areas of supply outage
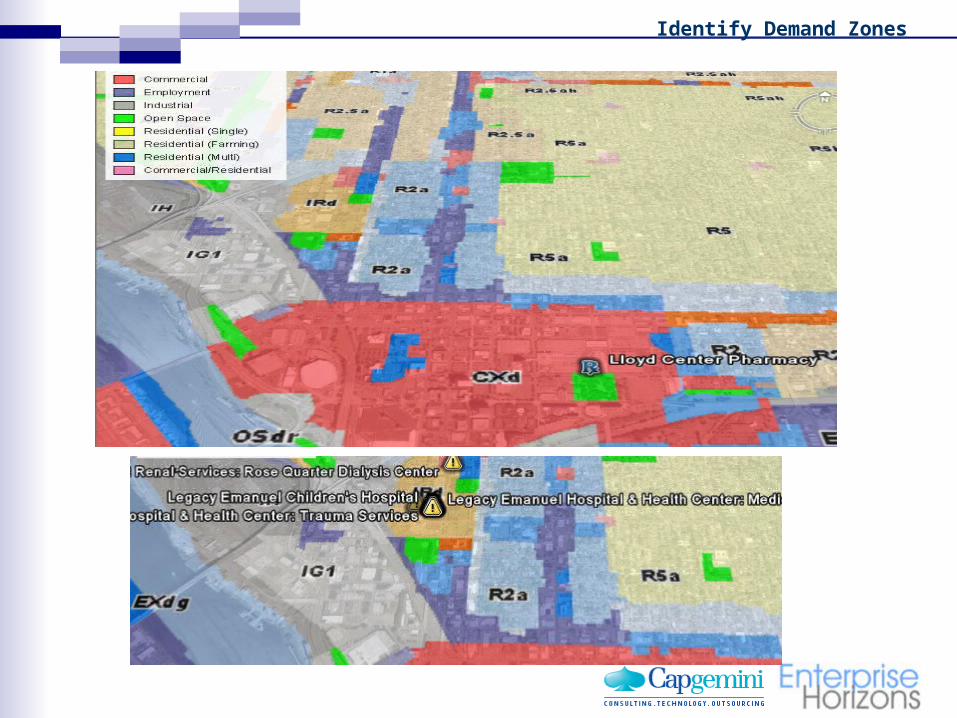
Identify Demand Zones
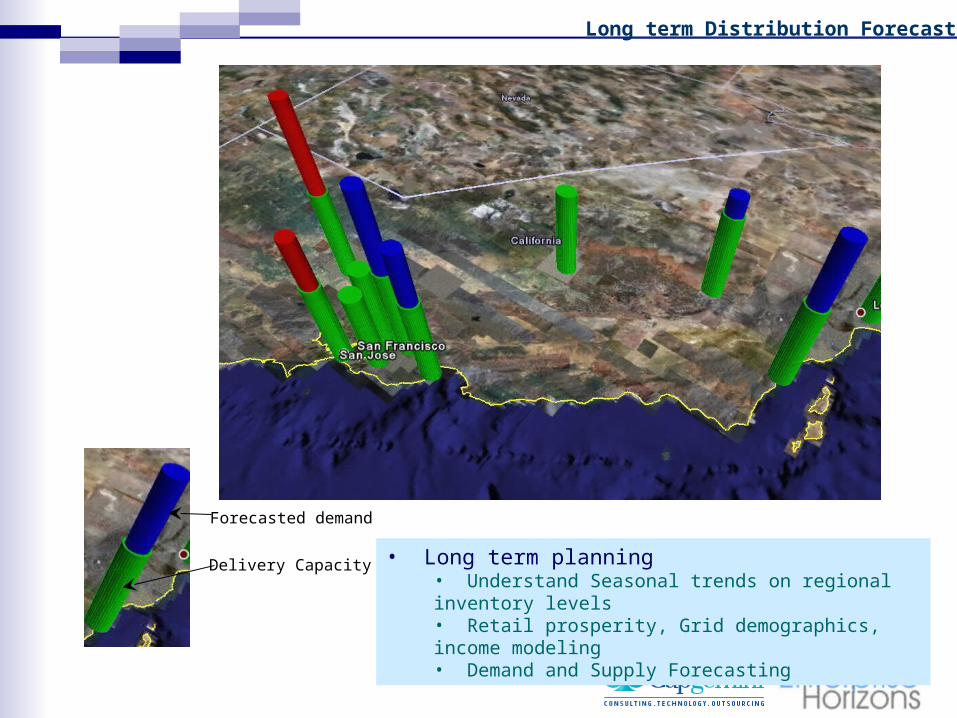
Long term Distribution Forecast
Delivery Capacity
Forecasted demand
• Long term planning• Understand Seasonal trends on regional inventory levels• Retail prosperity, Grid demographics, income modeling• Demand and Supply Forecasting
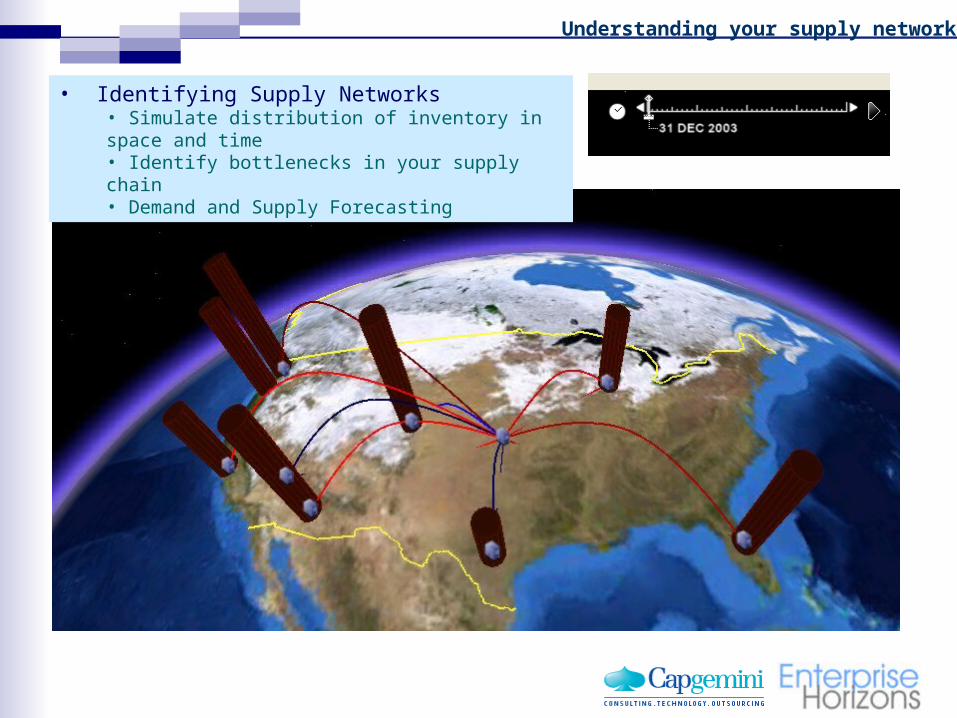
Understanding your supply network
• Identifying Supply Networks• Simulate distribution of inventory in space and time• Identify bottlenecks in your supply chain• Demand and Supply Forecasting