Enterprise Business Intelligence Platforms vs. Self-Service Analytics Tools: Which is The Right Tool...
48
Which is the Right Tool for the Job? ENTERPRISE BUSINESS INTELLIGENCE PLATFORMS VS. SELF-SERVICE ANALYTICS TOOLS
-
Upload
senturus -
Category
Data & Analytics
-
view
451 -
download
0
Transcript of Enterprise Business Intelligence Platforms vs. Self-Service Analytics Tools: Which is The Right Tool...

Which is the Right Tool for the Job?
ENTERPRISE BUSINESS INTELLIGENCE PLATFORMSVS. SELF-SERVICE ANALYTICS TOOLS

• INTRODUCTION
• STATE OF THE MARKET
• DEFINITIONS & EXAMPLES
• MAJOR FEATURE COMPARISONS
• FOUR CASE STUDIES
• ADDITIONAL RESOURCES
AGENDA
2Copyright 2016 Senturus, Inc. All Rights Reserved.

PRESENTERS
Copyright 2016 Senturus, Inc. All Rights Reserved.
Albert ValdezVice President of Learning Solutions
Senturus, Inc.
John PetersonCEO and Co-Founder
Senturus, Inc.
3

MORE FREE RESOURCES: WWW.SENTURUS.COM
Copyright 2016 Senturus, Inc. All Rights Reserved. 4

To hear the recording from this webinar: Enterprise BI Platforms vs Self-Service Analytics Tools website at:
http://www.senturus.com/events/enterprise-bi-platforms-vs-self-service-analytics-tools/
While you are there, you can also view and download this deck.
Hear the Recording
Copyright 2016 Senturus, Inc. All Rights Reserved.

BUSINESS ANALYTICS:ARCHITECTED TO SCALE
SENTURUS OVERVIEW

Copyright 2016 Senturus, Inc. All Rights Reserved. 7
• Dashboards, Reporting & Visualizations
• Data Preparation & Data Warehouses
• Self-Service Business Intelligence (BI)
• Big Data & Advanced Analytics
• Enterprise Planning Systems
Focused on Business Analytics

Business Requirements
Analysis Ready
Data
DASHBOARDS VISUALIZATIONS AND REPORTING
DECISIONS &ACTIONS
We Bridge the Gap Between Data and Decision Making

900+ Clients, 2000+ Projects, 16+ Years
Copyright 2016 Senturus, Inc. All Rights Reserved. 9

STATE OF THE MARKETENTERPRISE BUSINESS INTELLIGENCE VS. SELF-SERVICE ANALYTICS

STATE OF THE MARKET
11Copyright 2016 Senturus, Inc. All Rights Reserved.
• According to Gartner (February 2016):– “The business intelligence (BI) and analytics market has passed
a tipping point as it shifts away from IT-centric, reporting-based platforms and toward modern BI and analytics platforms that enable smarter analytics and greater agility.”
• What This Really Means:– Analysts are further subdividing the estimated $16.9 billion
market in order to provide “Apples to Apples” comparisons– You will see platforms scored against these different groups of
criteria in places like the Gartner Magic Quadrant– Watch out for the loaded terms like “modern” and “agility”
and use your best judgement to determine:– Which is the RIGHT tool for the job

NUMBER OF TOOLS USED
12Copyright 2016 Senturus, Inc. All Rights Reserved.
• Your Responses (at registration):– 234 unique companies responded– 35% using more than one solution– 10% using more than two solutions– Average is 1.5
• Industry Survey (from https://www.trustradius.com/articles/business-intelligence-survey-results):

OUR DEFINITIONS
13Copyright 2016 Senturus, Inc. All Rights Reserved.
• Enterprise Business Intelligence:– Sometimes referred to as the “traditional” approach,
Enterprise BI is centrally managed, typically by a shared-services IT department
– Infrastructure and data models are centralized, end-user access is typically via zero-footprint, browser-based tools
– Data sources are enterprise-class and monolithic, such as data warehouses and data marts which require long lead times and IT engagement to adjust to changes in business requirements
– Data is governed, secured, and tested for accuracy
– Supports large-scale deployments to 1,000s of users, high-volume, automated delivery of reports and dashboards, and auditable, trusted, and consistent definitions of data

OUR DEFINITIONS (CONTINUED)
14Copyright 2016 Senturus, Inc. All Rights Reserved.
• Self-Service Analytics:– Sometimes referred to as “modern,” Self-Service Analytics
solutions are typically managed at the department level, and are considered to be more “agile”
– Agility comes from proximity to, or ownership by, the business
– Tools can be deployed on individual desktops and don’t require engagement with shared services or IT
– Data sources are more varied, including desktop-based files such as spreadsheets, enterprise source as well as cloud-based and semi-structured sources
– Data acquisition and blending are managed by the business users, resulting in quicker time to decision, but potentially sacrificing data governance, lineage, and security

• First of all, the software world, as always, is in flux –vendors are often playing across multiple segments – we are not trying to nail down any one platform or vendor and “put them in a box”
• We want to highlight the fact that certain tools are stronger in certain areas– Most tools are “purpose-built” for certain benefits– Once you understand your business use case, you can
prioritize those benefits that matter to you and determine the right approach
• There will always be experts who can make any tool do anything, for this presentation, we are speaking about typical mainstream users
A FEW CAVEATS
15Copyright 2016 Senturus, Inc. All Rights Reserved.

• Most organizations have one or more tools from each of these broad categories available to them, so the question:
– Which tool is right, and why?
• There are many different types of reporting and analytics in all organizations, examples include:– Standardized reports (incl. operational)– Dashboards & scorecards (incl. KPI’s)– Components of other docs (ex. MS PowerPoint graphics)– Ad-hoc analyses & queries (often one-off)– Advanced visualizations– Predictive analytics
• No one tool fits all uses perfectly
IN OUR EXPERIENCE (ASSUMPTIONS)
16Copyright 2016 Senturus, Inc. All Rights Reserved.

• Typical business user– We know that expert users can make any tool do what
they want, but at what cost?– Educating the user base is crucial
• There is value in each approach, bottom line, a more analytical (data-driven) approach to decision-making is always better!– 10:1 ROI is a no-brainer, so congratulations, having more
tools at your fingertips is a GOOD thing– Identify which of the following key factors matter in your
analysis, pick up your tool, and get to work
• Investigate whether or not a given tool can do the job—you might be surprised
OUR PERSPECTIVE
17Copyright 2016 Senturus, Inc. All Rights Reserved.
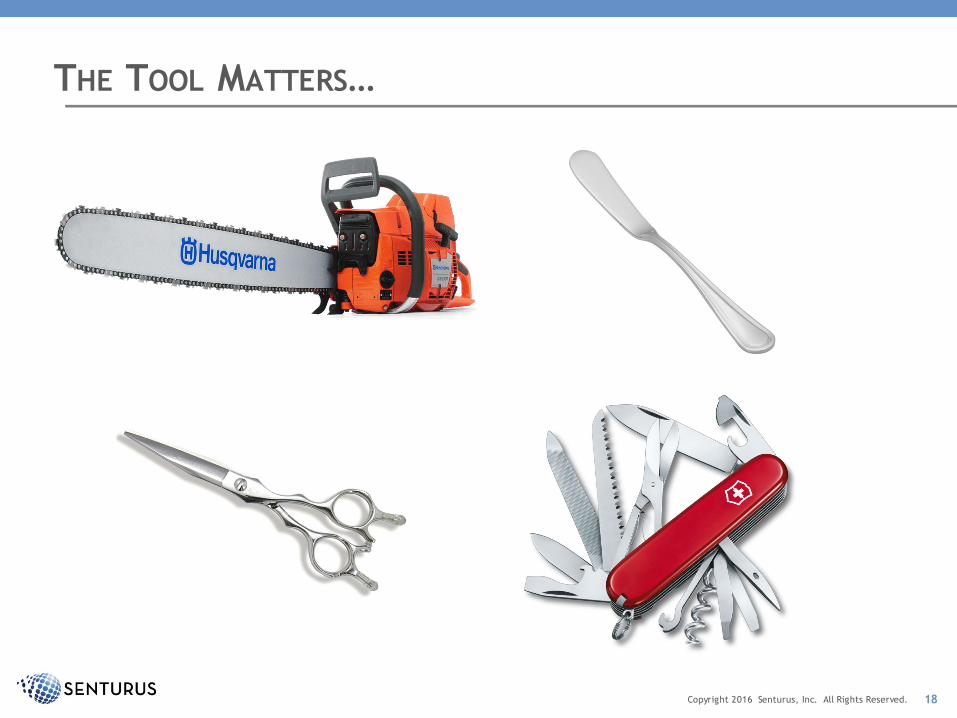
THE TOOL MATTERS…
18Copyright 2016 Senturus, Inc. All Rights Reserved.

BUT THE JOB MATTERS MORE
19Copyright 2016 Senturus, Inc. All Rights Reserved.

To hear the recording from this webinar, visit our website. While you are there, you can also view and download this deck at:
http://www.senturus.com/events/enterprise-bi-platforms-vs-self-service-analytics-tools/
The Senturus comprehensive library of recorded webinars, demos, white papers, presentations, and case studies is available on our website at:
http://www.senturus.com/resources/
Hear the Recording
Copyright 2016 Senturus, Inc. All Rights Reserved.

ENTERPRISE BUSINESS INTELLIGENCE PLATFORMSVS SELF-SERVICE ANALYTICS TOOLS
DEFINITIONS, EXAMPLES, SIMILARITIESAND DIFFERENCES

ENTERPRISE BUSINESS INTELLIGENCE ARCHITECTURE
22Copyright 2016 Senturus, Inc. All Rights Reserved.

ENTERPRISE BUSINESS INTELLIGENCE EXAMPLES
23Copyright 2016 Senturus, Inc. All Rights Reserved.

SELF-SERVICE ARCHITECTURE
24Copyright 2016 Senturus, Inc. All Rights Reserved.
BYOS
IAAS

SELF-SERVICE ANALYTICS EXAMPLES
25Copyright 2016 Senturus, Inc. All Rights Reserved.

FEATURE COMPARISONS
26Copyright 2016 Senturus, Inc. All Rights Reserved.
Enterprise BI Self-Service Analytics
Supports enterprise-scale data sources including OLAP/MDX sources
Supports most relational sources, but is optimized for local, flat-file data sources such as Excel or CSV files
Based on validated models of the business May require data modeling, data preparation
Models are rigid, take long time to change Rapid prototyping, effective for limited number of data objects (sources or tables)
Very strong with operational or transactional reporting such as detailed lists with complex calculations (Tabular Reporting)
Ideal for dashboard-style reports with high interactivity (inline filtering/prompts) and highly visual/graphical
Based on widely-accepted SQL or MDX Standards Limited to vendor-specific query model
Enterprise-scale automation (scheduling) and delivery in any format (.XLS, .CSV, .PDF, .HTML) and report bursting
Requires scripting to automate updates to server-based content
Data-driven delivery and alerting and Event Lifecycle Management
Limited automation/delivery features

FEATURE COMPARISONS PART2
27Copyright 2016 Senturus, Inc. All Rights Reserved.
Enterprise BI Self-Service Analytics
Billion-row, multi-terabyte database support May require data extraction to scale back sources to support desktop processing
Complex user interfaces Intuitive user experience for first-time business users
Dashboarding approach is based on existing report artifacts (reliant upon professional authors)
Analysts create dashboards on the fly, unconstrained by the data models or other authors to create content
MS Office integration points can be strong, direct Not as well-integrated, stand-alone solutions
Wide data sets (100s of columns) supported Local (desktop) processing may limit ability to handle wide or long data sets
Geospatial (mapping) capabilities may be limited Strong with geospatial visualizations
Access to database functions for complex calculations
Limited to vendor-supplied functions

FEATURE COMPARISONS PART3
28Copyright 2016 Senturus, Inc. All Rights Reserved.
Enterprise BI Self-Service Analytics
Mobile delivery of stand-alone reports Mobile access requires connectivity to server-based content
Designed to leverage existing enterprise architecture such as data warehouse, authentication providers, and web servers
Designed for desktop-based analysis, may or may not integrate smoothly with existing infrastructure or other IT assets
Flexibility to define various relative time periods in the same report/query (may require complex calculations)
Lack of query model control limits ability to report on multiple time grains
Robust metadata layer can support unlimited number of data sources
Designed for small number of data sources (remember each database TABLE is treated as a data source)
Central metadata can store business logic which can be leveraged consistently across all reports
Each individual user is responsible for managing business logic, potentially resulting in inconsistent definitions across users
Purpose-built for operational, pixel-perfect reporting, data discovery features typically an add-on or afterthought and may not be well integrated
Purpose-built for data visualization and data discovery, encouraging users to ask questions

• The traditional model is based on highly-governed, centralized data sources, models are rigid and not designed to be changed in real-time
• There always have been, and always will be, significant benefits of this model:
– “Single version of the truth” – Data governance– Crucial business rules and logic are centrally managed,
providing a single version of the truth– Enterprise-scale, central administration for security– Strengths in operational (managed) reporting
• But what happens when…
PROS & CONS
29Copyright 2016 Senturus, Inc. All Rights Reserved.

• You need to analyze data that is not available in the centralized data source?
• You need to perform self-service analytics in real-time, without assistance from IT?
• Self-Service analytics tools complement the enterprise model with one that delivers information to decision makers much more quickly
PROS & CONS (CONTINUED)
30Copyright 2016 Senturus, Inc. All Rights Reserved.

To hear the recording from this webinar, visit our website. While you are there, you can also view and download this deck at:
http://www.senturus.com/events/enterprise-bi-platforms-vs-self-service-analytics-tools/
The Senturus comprehensive library of recorded webinars, demos, white papers, presentations, and case studies is available on our website at:
http://www.senturus.com/resources/
Hear the Recording
Copyright 2016 Senturus, Inc. All Rights Reserved.

ENTERPRISE BI PLATFORMS VSSELF-SERVICE ANALYTICS TOOLS
THE RIGHT TOOL FOR THE JOB USE CASES*
*Use cases are generic, but are based on real-life projects. No client-specific references should be implied.

USE CASE #1 - LARGE HEALTHCARE ORGANIZATION
33Copyright 2016 Senturus, Inc. All Rights Reserved.

Factors• “Single source of the truth” (for all departments and all
levels of the org) is most important factor
• Data sources are centralized, highly structured and governed
• Business requirements and definitions well defined and locked by 3-5 year plan
• Metrics and data is broadly applicable across the entire organization (crosses the departmental boundary)
• Group wishes to leverage existing enterprise tool
• Security, controlled distribution, and reusable report widgets are critical
USE CASE #1– TRADITIONAL BI
34Copyright 2016 Senturus, Inc. All Rights Reserved.

USE CASE #2 – ONLINE E-TAILER
35Copyright 2016 Senturus, Inc. All Rights Reserved.

USE CASE #2– SELF-SERVICE ANALYTICS
36Copyright 2016 Senturus, Inc. All Rights Reserved.

Factors• Data sources are varied; not all sources in scope
necessarily relevant outside of this particular group
• Time to decision is critical
• Business requirements are fluid
• Group doesn’t have access to enterprise tool
• Modern visualizations showing performance across sets of data
USE CASE #2– SELF-SERVICE ANALYTICS
37Copyright 2016 Senturus, Inc. All Rights Reserved.

USE CASE #3 – CAPITAL EQUIPMENT MANUFACTURER
38Copyright 2016 Senturus, Inc. All Rights Reserved.

USE CASE #3 – HYBRID SOLUTION USINGSENTURUS ENTERPRISE BI CONNECTOR
39Copyright 2016 Senturus, Inc. All Rights Reserved.
Tableau users can connect directly to the BI modeling layer, giving them instant access to high quality data

Factors
• Highly-governed and trusted data is crucial
• Flexibility to blend enterprise data with additional data that is only specific to certain requirements
• Existing enterprise BI implementation with rich metadata
• But there is a need for more advanced visualization, end-user customization, and ad-hoc analyses than available in the current tool
• User base and presentation requirements well-suited for purpose-built, self-service visualization tools
USE CASE #3 – HYBRID SOLUTION USINGSENTURUS ENTERPRISE BI CONNECTOR
40Copyright 2016 Senturus, Inc. All Rights Reserved.
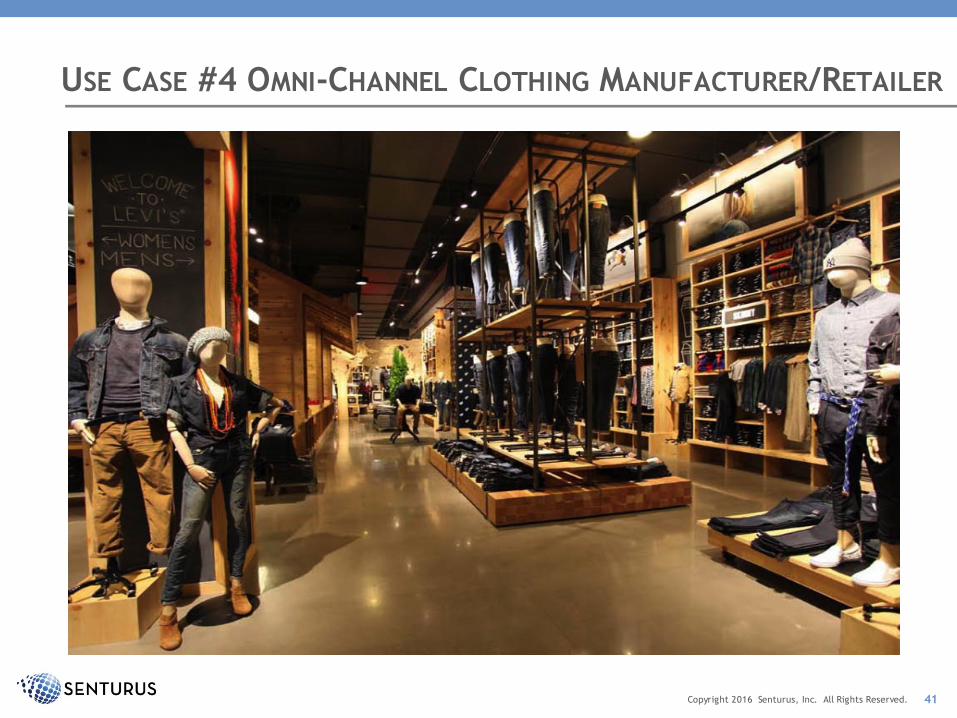
USE CASE #4 OMNI-CHANNEL CLOTHING MANUFACTURER/RETAILER
41Copyright 2016 Senturus, Inc. All Rights Reserved.

Factors
• Lots of complex data sources needing to be blended
• Need to significantly transform and align data
• Need to “enrich” all reports and analyses with additional info: attributes, rollups, hierarchies, plans/targets, etc
• Data useful to all parts of the company (crosses the departmental boundary)
• Data must be timely and “single source of truth”
• Very broad set of reports and analysis types are necessary
USE CASE #4 –MULTIPLE TOOLS & DATA WAREHOUSE
42Copyright 2016 Senturus, Inc. All Rights Reserved.
MAIN REQUIREMENT: WELL PREPARED DATA
TAKEAWAYS
43Copyright 2016 Senturus, Inc. All Rights Reserved.
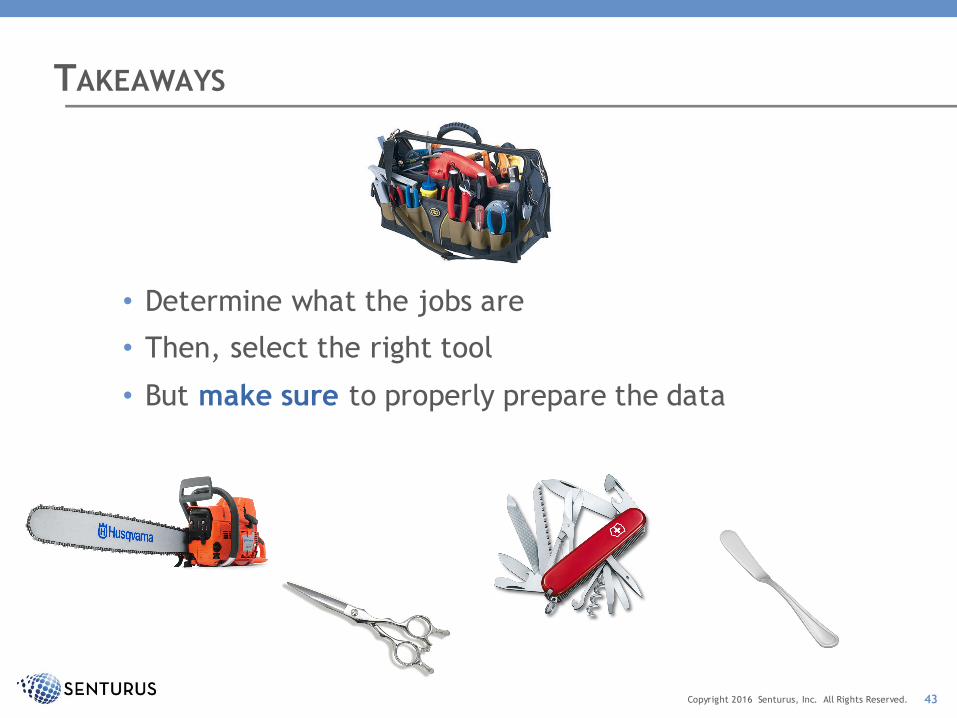
• Determine what the jobs are
• Then, select the right tool
• But make sure to properly prepare the data

To hear the recording from this webinar, visit our website. While you are there, you can also view and download this deck at:
http://www.senturus.com/events/enterprise-bi-platforms-vs-self-service-analytics-tools/
The Senturus comprehensive library of recorded webinars, demos, white papers, presentations, and case studies is available on our website at:
http://www.senturus.com/resources/
Hear the Recording
Copyright 2016 Senturus, Inc. All Rights Reserved.

ADDITIONAL RESOURCES

www.senturus.com/events
Upcoming Free Event
Copyright 2016 Senturus, Inc. All Rights Reserved. 46

Free Resources on www.senturus.com
Copyright 2016 Senturus, Inc. All Rights Reserved. 47
Thank You!
www.senturus.com [email protected]
888 601 6010
Copyright 2016 by Senturus, Inc. This entire presentation is copyrighted and may not be reused or distributed without the written consent of
Senturus, Inc.
Copyright 2016 Senturus, Inc. All Rights Reserved. 48


