Enterococci Staphylococci and E. coli · EQAS 2009 Enterococci, Staphylococci and E. coli EURL...
37
EQAS 2009 Enterococci, Staphylococci and E. coli EURL workshop, April 8, 2010 Lourdes García Migura ([email protected])
Transcript of Enterococci Staphylococci and E. coli · EQAS 2009 Enterococci, Staphylococci and E. coli EURL...
EQAS 2009 Enterococci, Staphylococci and E. coli
EURL workshop, April 8, 2010
Lourdes García Migura ([email protected])
2
Main objectives of the EURL EQAS’s
•
To improve the comparability of antimicrobial susceptibility testing (AST) data
•
To harmonise the breakpoints/epidemiological cut off values
•
To assess the quality of AST in European laboratories and identify possible barriers
•
To support laboratories in performing, evaluating and if necessary improving the quality of AST
3
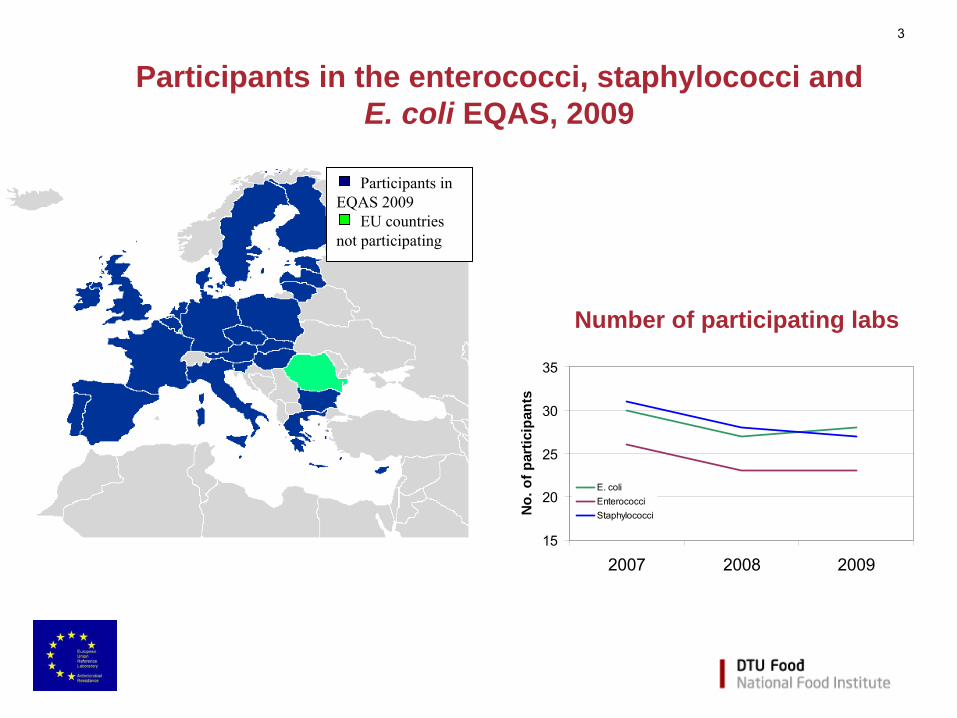
Participants in the enterococci, staphylococci and E. coli EQAS, 2009
Number of participating labs
Participants in EQAS 2009
EU countries not participating
15
20
25
30
35
2007 2008 2009
No.
of p
artic
ipan
ts
E. coliEnterococciStaphylococci
4
Methods for EQAS 2009•
Eight strains of enterococci, staphylococci and E. coli, respectively were selected
•
New participants were provided with the reference strains, E. faecalis ATCC 29212,
S. aureus ATCC 25923, S. aureus
ATCC 29213 and E. coli ATCC 25922 for QC testing
•
AST guidelines were set according to the CLSI. MIC results were interpreted using the epidemiological cut off values set by EUCAST (www.eucast.org), recommended by EFSA and described in the protocol
•
Participants using disk diffusion were advised to interpret the results according to their individual breakpoints
•
Results were categorized as resistant or susceptible
5
Analysis of data based on these agreements
•
During the passed EURL-AR Workshop (2008) the network agreed upon the following decisions for EQAS 2009:
–
The accepted deviation for each laboratory was set up at 5% instead of 7%
–
Results should be further analysed (possibly ignored) if only 75% are correct (test strain/antimicrobial combination)
0
1
2
3
4
5
6
7
8
9
10
Enterococcus Staphylococcus E. coli
Perc
enta
ge o
f dev
iatio
n
EQAS 2007EQAS 2008EQAS 2009
internal control
0
1
2
3
4
5
6
7
8
9
10
Enterococcus Staphylococcus E. coli
Perc
enta
ge o
f dev
iatio
n
EQAS 2007EQAS 2008EQAS 2009
internal control
6
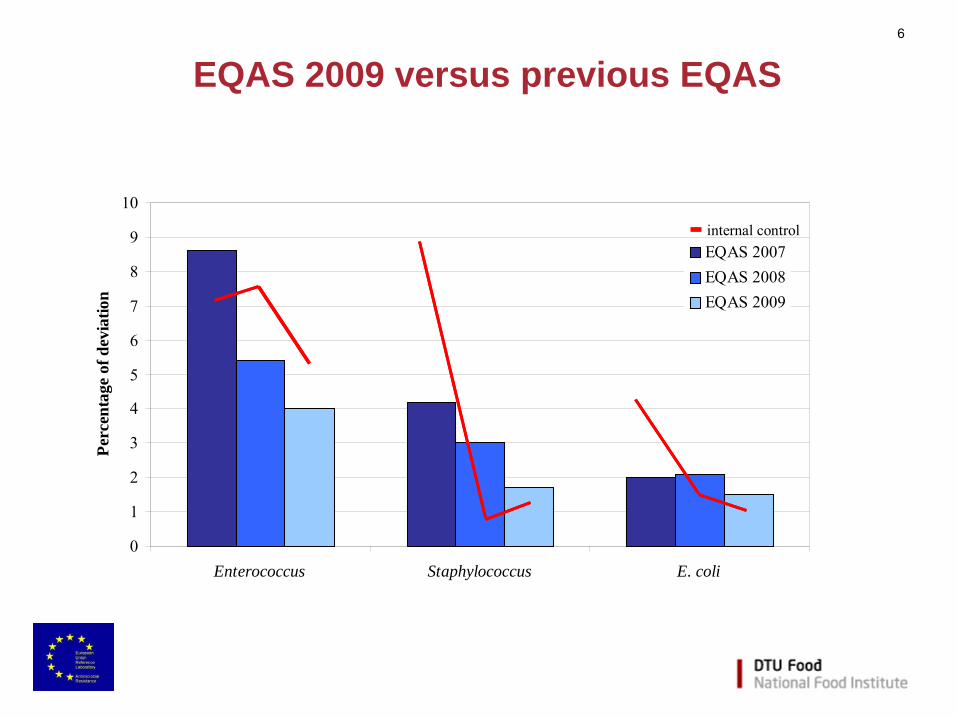
EQAS 2009 versus previous EQAS
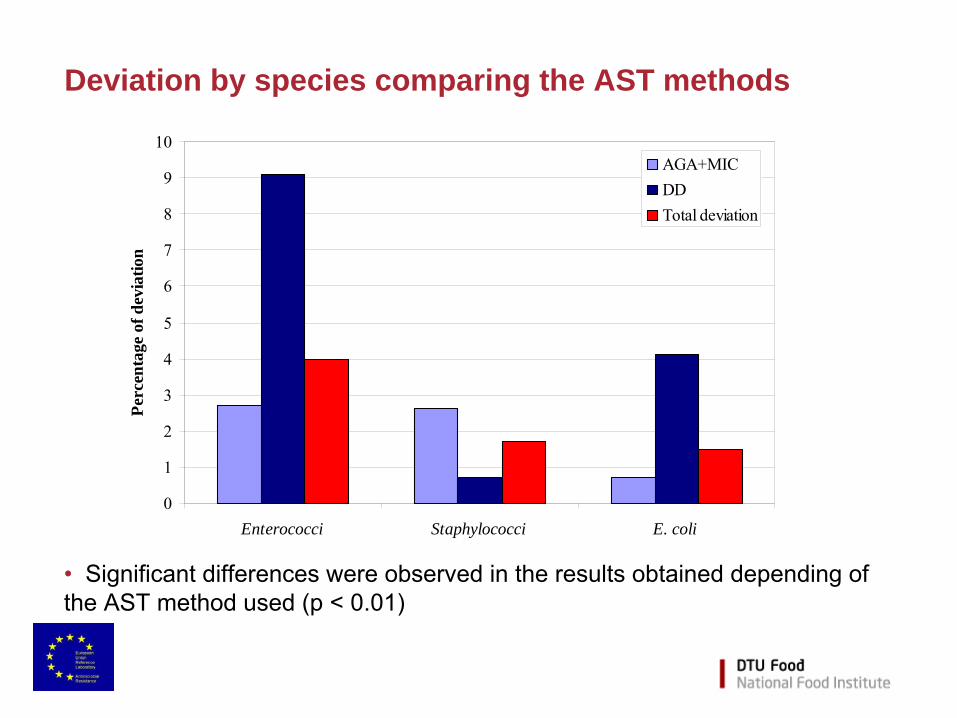
Deviation by species comparing the AST methods
•
Significant differences were observed in the results obtained depending of the AST method used (p < 0.01)
0
1
2
3
4
5
6
7
8
9
10
Enterococci Staphylococci E. coli
Perc
enta
ge o
f dev
iatio
nAGA+MICDDTotal deviation
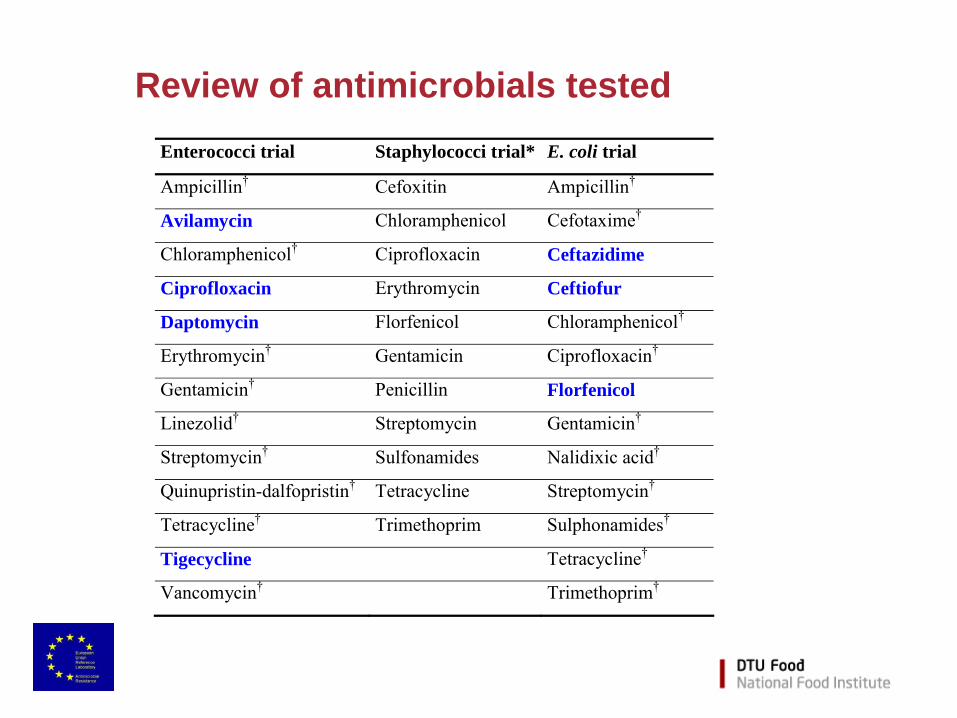
Review of antimicrobials tested Enterococci trial Staphylococci trial* E. coli trial
Ampicillin† Cefoxitin Ampicillin†
Avilamycin Chloramphenicol Cefotaxime†
Chloramphenicol† Ciprofloxacin Ceftazidime
Ciprofloxacin Erythromycin Ceftiofur
Daptomycin Florfenicol Chloramphenicol†
Erythromycin† Gentamicin Ciprofloxacin†
Gentamicin† Penicillin Florfenicol
Linezolid† Streptomycin Gentamicin†
Streptomycin† Sulfonamides Nalidixic acid†
Quinupristin-dalfopristin† Tetracycline Streptomycin†
Tetracycline† Trimethoprim Sulphonamides†
Tigecycline Tetracycline†
Vancomycin† Trimethoprim†
9
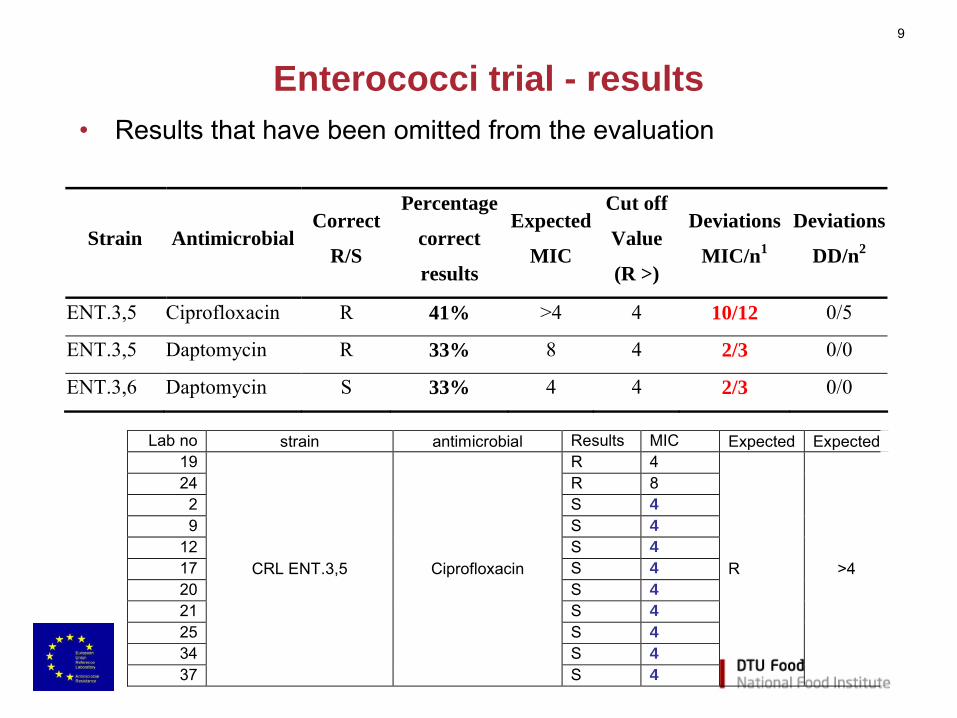
Enterococci trial - results•
Results that have been omitted from the evaluation
Strain AntimicrobialCorrect
R/S
Percentage
correct
results
Expected
MIC
Cut off
Value
(R >)
Deviations
MIC/n1
Deviations
DD/n2
ENT.3,5 Ciprofloxacin R 41% >4 4 10/12 0/5
ENT.3,5 Daptomycin R 33% 8 4 2/3 0/0
ENT.3,6 Daptomycin S 33% 4 4 2/3 0/0
Lab no strain antimicrobial Results MIC Expected Expected
19 R 4 24 R 8
2 S 4 9 S 4
12 S 4 17 S 4 20 S 4 21 S 4 25 S 4 34 S 4 37
CRL ENT.3,5 Ciprofloxacin
S 4
R >4
0
2
4
6
8
10
12
14
16
18
20
ENT.3,1 ENT.3,2 ENT.3,3 ENT.3,4 ENT.3,5 ENT.3,6 ENT.3,7 ENT.3,8
CRL - Enterococci 2009
Perc
enta
ge o
f dev
iatio
n
AGA+MICDDTOTAL
10
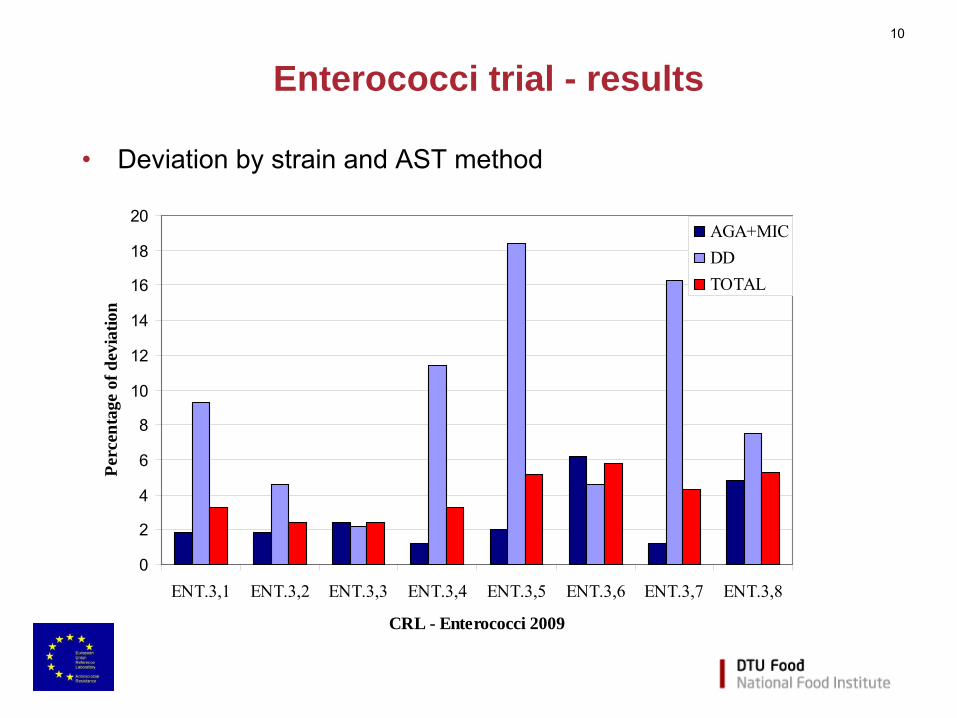
Enterococci trial - results
•
Deviation by strain and AST method
11
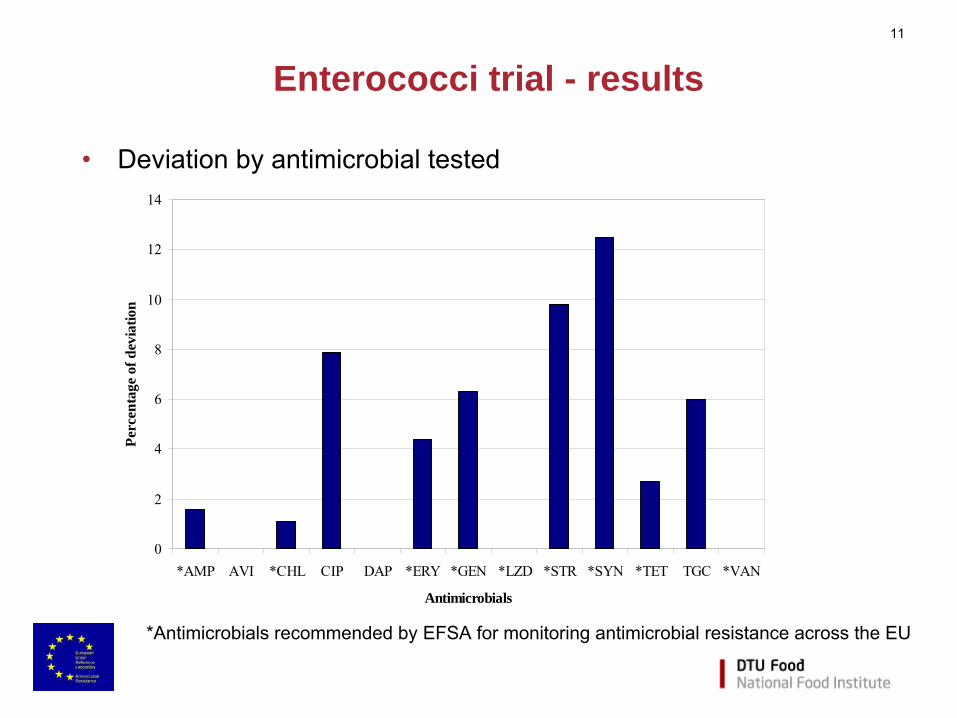
Enterococci trial - results
•
Deviation by antimicrobial tested
*Antimicrobials recommended by EFSA for monitoring antimicrobial
resistance across the EU
0
2
4
6
8
10
12
14
*AMP AVI *CHL CIP DAP *ERY *GEN *LZD *STR *SYN *TET TGC *VAN
Antimicrobials
Perc
enta
ge o
f dev
iatio
n
0
2
4
6
8
10
12
14
16
*18*40 34 39 *23 21 *15 19 33 37 17 24 11 *26 9 12 2 25 20 1 16 22 29
Laboratory number
Perc
enta
ge o
f dev
iatio
n
Deviations including all antimicrobialsDeviations including only antimicrobials reported to EFSA
7% acceptance limit5% acceptance limit
12
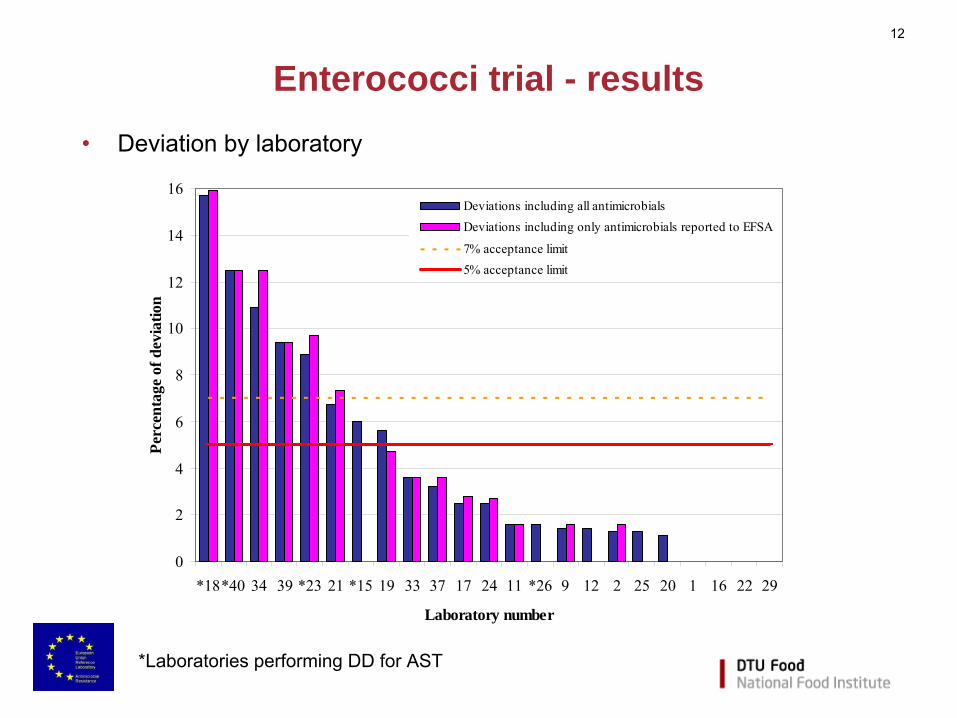
Enterococci trial - results•
Deviation by laboratory
*Laboratories performing DD for AST
13
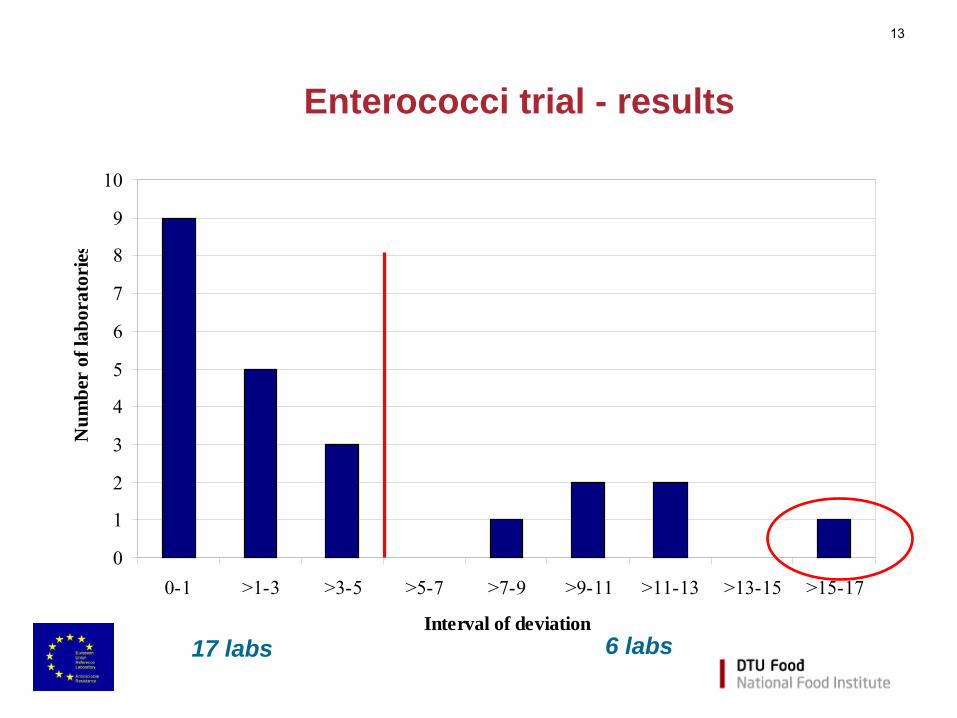
Enterococci trial - results
0
1
2
3
4
5
6
7
8
9
10
0-1 >1-3 >3-5 >5-7 >7-9 >9-11 >11-13 >13-15 >15-17
Interval of deviation
Num
ber
of la
bora
tori
es
17 labs 6 labs
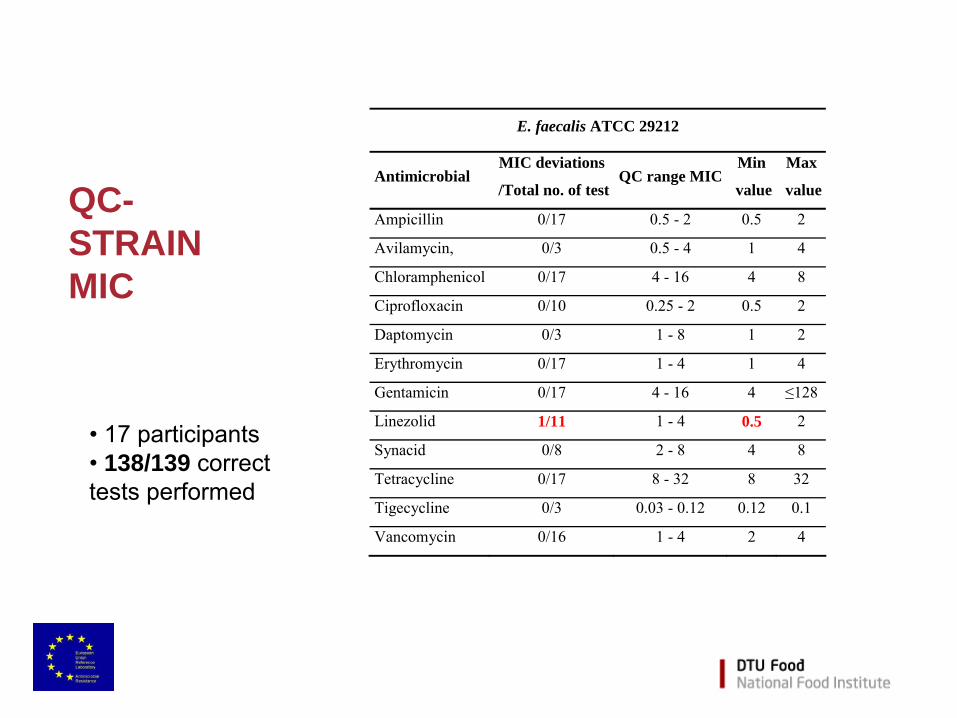
QC- STRAIN MIC
• 17 participants•
138/139 correct
tests performed
E. faecalis ATCC 29212
Antimicrobial MIC deviations
/Total no. of test QC range MIC
Min
value
Max
value
Ampicillin 0/17 0.5 - 2 0.5 2
Avilamycin, 0/3 0.5 - 4 1 4
Chloramphenicol 0/17 4 - 16 4 8
Ciprofloxacin 0/10 0.25 - 2 0.5 2
Daptomycin 0/3 1 - 8 1 2
Erythromycin 0/17 1 - 4 1 4
Gentamicin 0/17 4 - 16 4 ≤128
Linezolid 1/11 1 - 4 0.5 2
Synacid 0/8 2 - 8 4 8
Tetracycline 0/17 8 - 32 8 32
Tigecycline 0/3 0.03 - 0.12 0.12 0.1
Vancomycin 0/16 1 - 4 2 4
Summarizing enterococci trial
•
Deviations in the eight enterococci
strains fall bellow 6% –
decreased in deviation caused by labs performing DD from 16% to 9.1% when compared to 2008
•
7/9 antimicrobials recommended by EFSA failed to produce 100% of correct results–
High level resistance to aminoglycosides deviations caused by particpants using DD
–
Synacid
•
The number of laboratories deviating more than the 5% is still high (6/23)
•
Deviations were mainly caused by laboratories performing DD for AST
16
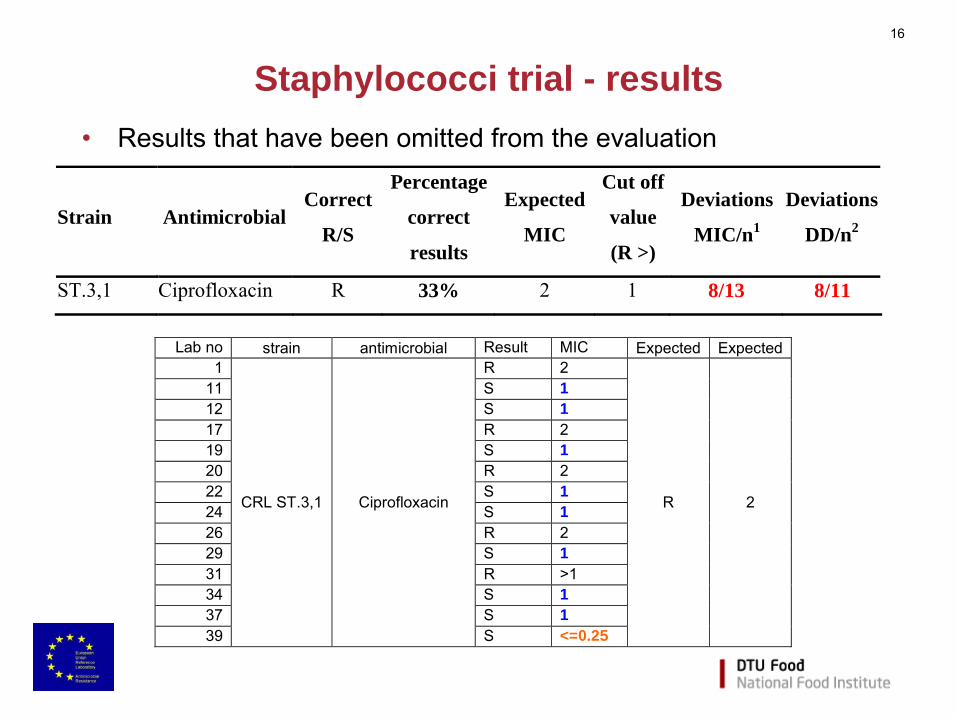
Staphylococci trial - results•
Results that have been omitted from the evaluation
Strain AntimicrobialCorrect
R/S
Percentage
correct
results
Expected
MIC
Cut off
value
(R >)
Deviations
MIC/n1
Deviations
DD/n2
ST.3,1 Ciprofloxacin R 33% 2 1 8/13 8/11
Lab no strain antimicrobial Result MIC Expected Expected
1 R 2 11 S 1 12 S 1 17 R 2 19 S 1 20 R 2 22 S 1 24 S 1 26 R 2 29 S 1 31 R >1 34 S 1 37 S 1 39
CRL ST.3,1 Ciprofloxacin
S <=0.25
R 2
17
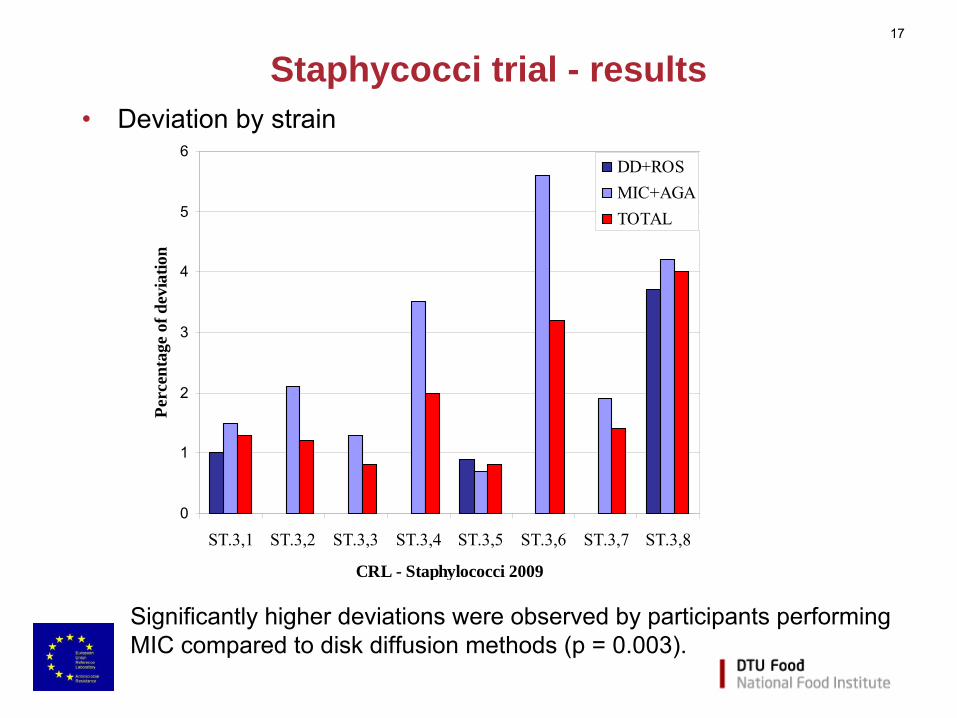
Staphycocci trial - results•
Deviation by strain
Significantly higher deviations were observed by participants performing MIC compared to disk diffusion methods (p = 0.003).
0
1
2
3
4
5
6
ST.3,1 ST.3,2 ST.3,3 ST.3,4 ST.3,5 ST.3,6 ST.3,7 ST.3,8
CRL - Staphylococci 2009
Perc
enta
ge o
f dev
iatio
nDD+ROSMIC+AGATOTAL
18
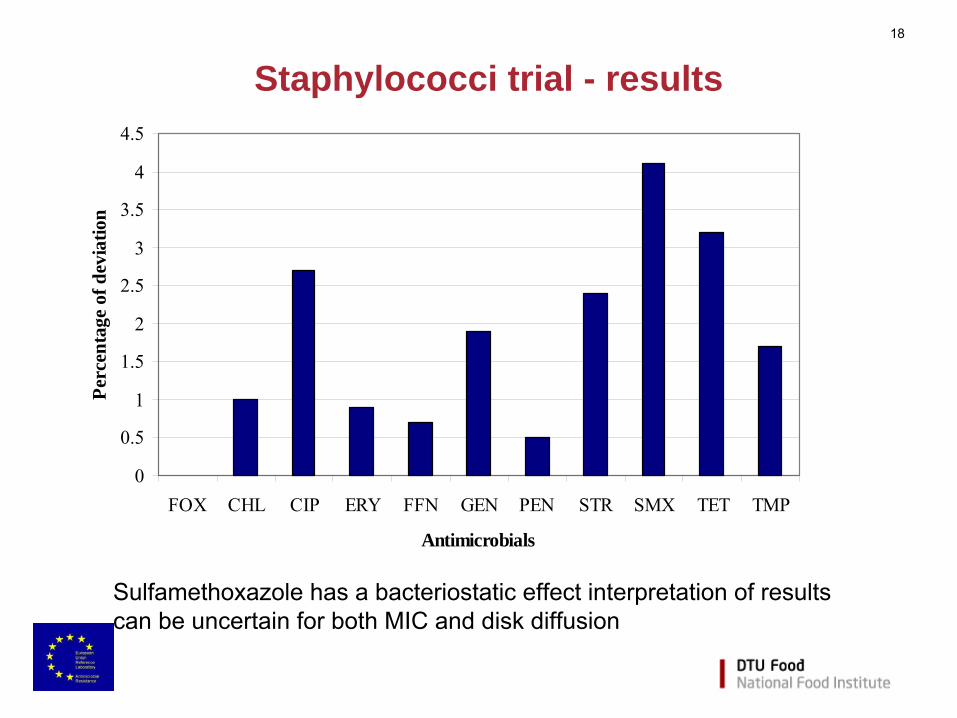
Staphylococci trial - results
•
Deviation by antimicrobial tested
0
0.5
1
1.5
2
2.5
3
3.5
4
4.5
FOX CHL CIP ERY FFN GEN PEN STR SMX TET TMP
Antimicrobials
Perc
enta
ge o
f dev
iatio
n
Sulfamethoxazole
has a bacteriostatic
effect interpretation of results can be uncertain for both MIC and disk diffusion
0
2
4
6
8
10
12
14
16
11 39 12 34 *23 19 20 26 17 *4 *14*40 21 1 *2 *9 *13 *15*18 22 24 25 *29 *30 31 33 37
Laboratory number
Perc
enta
ge o
f dev
iatio
n
5% acceptance limit7% acceptance limit
19
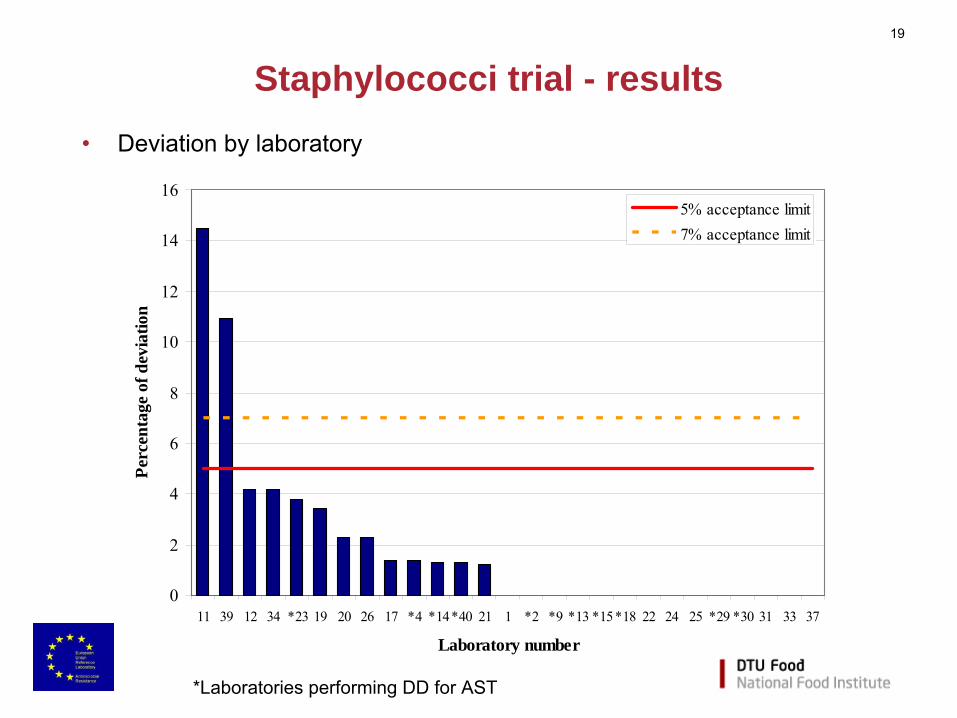
Staphylococci trial - results•
Deviation by laboratory
*Laboratories performing DD for AST
0
2
4
6
8
10
12
14
16
0-1 >1-3 >3-5 >5-7 >7-9 >9-11 >11-13 >13-15
Interval of deviation
Num
ber
of la
bora
tori
es
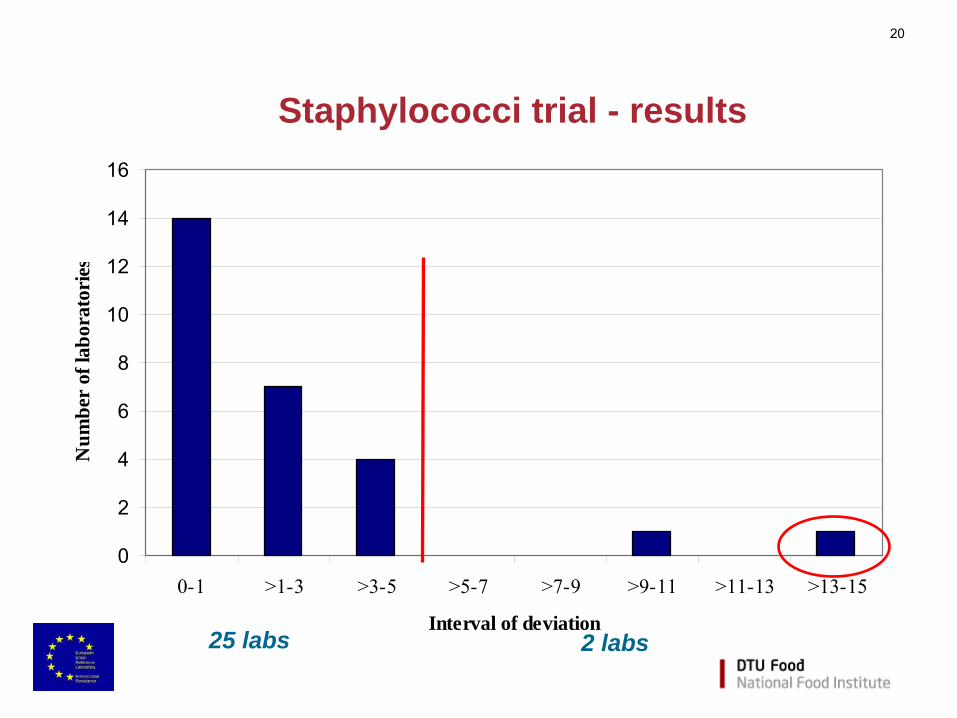
20
Staphylococci trial - results
25 labs 2 labs
Methicillin Resistant S. aureus (MRSA)
•
ST.3,1, ST.3,3 and ST.3,5 were confirmed to be methicillin resistant
•
4.3% deviation–
participant did not perform the test
–
participant did not confirm ST.3,1 but confirmed the other two MRSA strains
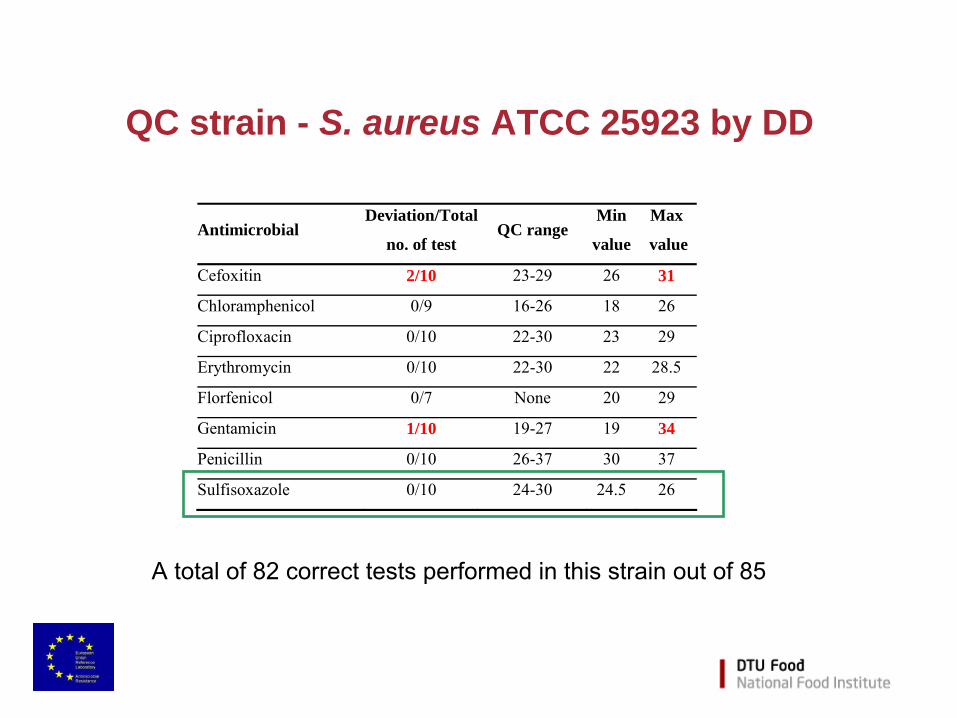
QC strain - S. aureus ATCC 25923 by DD
A total of 82 correct tests performed in this strain out of 85
Antimicrobial Deviation/Total
no. of test QC range
Min
value
Max
value
Cefoxitin 2/10 23-29 26 31
Chloramphenicol 0/9 16-26 18 26
Ciprofloxacin 0/10 22-30 23 29
Erythromycin 0/10 22-30 22 28.5
Florfenicol 0/7 None 20 29
Gentamicin 1/10 19-27 19 34
Penicillin 0/10 26-37 30 37
Sulfisoxazole 0/10 24-30 24.5 26
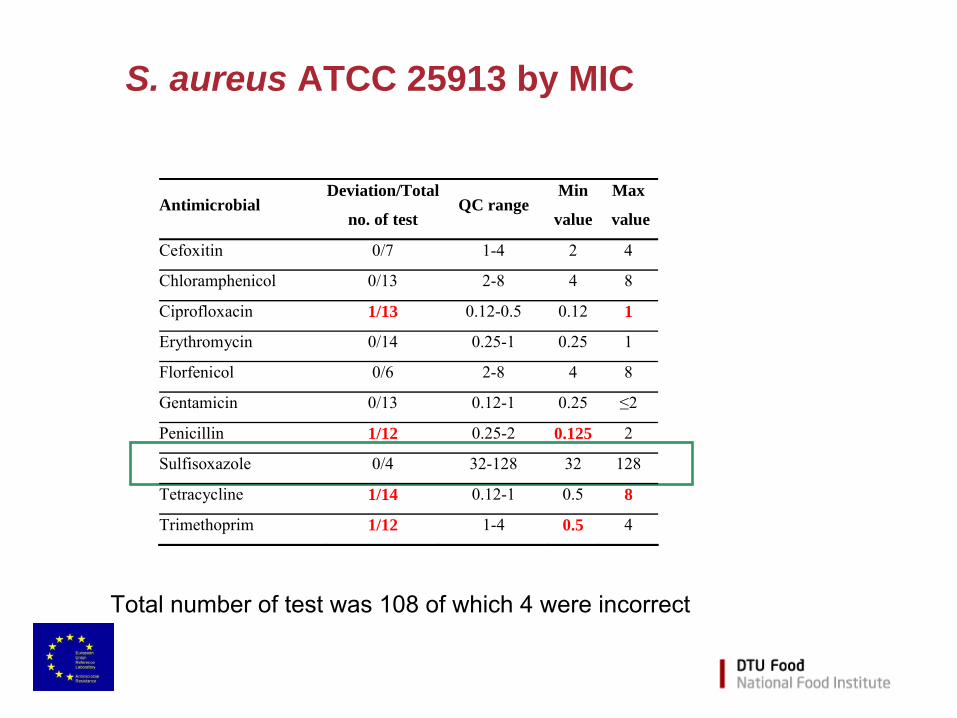
S. aureus ATCC 25913 by MIC
Total number of test was 108 of which 4 were incorrect
Antimicrobial Deviation/Total
no. of test QC range
Min
value
Max
value
Cefoxitin 0/7 1-4 2 4
Chloramphenicol 0/13 2-8 4 8
Ciprofloxacin 1/13 0.12-0.5 0.12 1
Erythromycin 0/14 0.25-1 0.25 1
Florfenicol 0/6 2-8 4 8
Gentamicin 0/13 0.12-1 0.25 ≤2
Penicillin 1/12 0.25-2 0.125 2
Sulfisoxazole 0/4 32-128 32 128
Tetracycline 1/14 0.12-1 0.5 8
Trimethoprim 1/12 1-4 0.5 4
Summarizing staphylococci trial•
participants performing disk diffusion reported significantly better results than those performing MIC
•
All of the strains and antimicrobials tested presented deviations below 5%. –
The antimicrobial with the higher deviation was sulfamethoxazole
(4.1%), bacteriostatic
•
only two laboratories clustered outside the 5%
•
Deviations in identification of the mecA gene were low (4.3%), and caused by two laboratories, one didn’t performed the test
•
Both, laboratories performing DD on S. aureus ATCC 25923 and laboratories using MIC on S. aureus ATCC
25913 produced the
same percentage of deviation (4%)
25
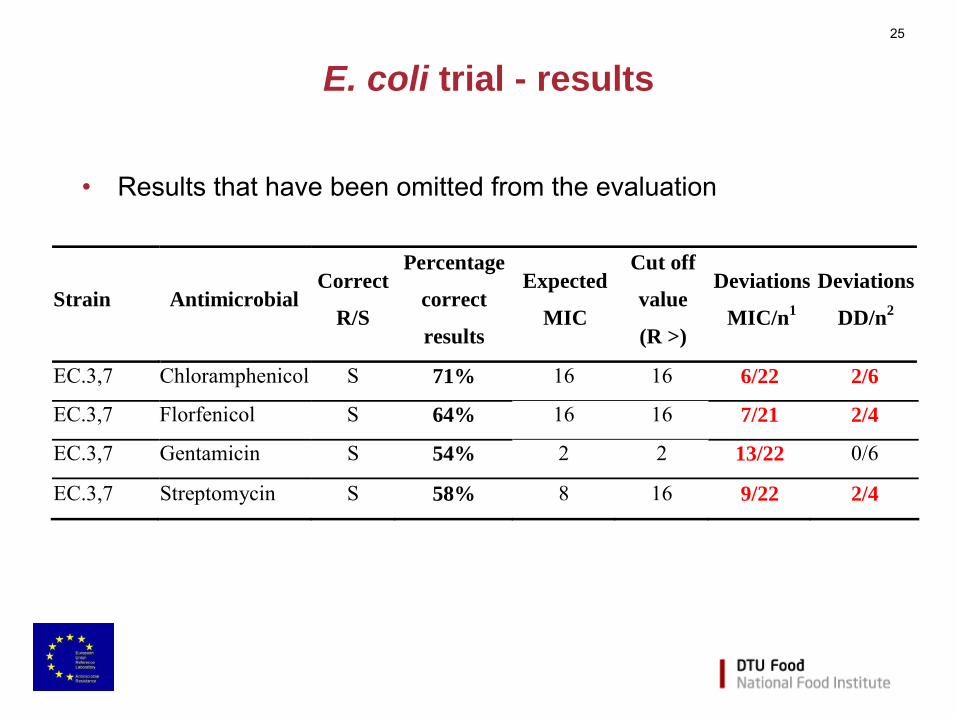
E. coli trial - results
•
Results that have been omitted from the evaluation
Strain Antimicrobial Correct
R/S
Percentage
correct
results
Expected
MIC
Cut off
value
(R >)
Deviations
MIC/n1
Deviations
DD/n2
EC.3,7 Chloramphenicol S 71% 16 16 6/22 2/6
EC.3,7 Florfenicol S 64% 16 16 7/21 2/4
EC.3,7 Gentamicin S 54% 2 2 13/22 0/6
EC.3,7 Streptomycin S 58% 8 16 9/22 2/4
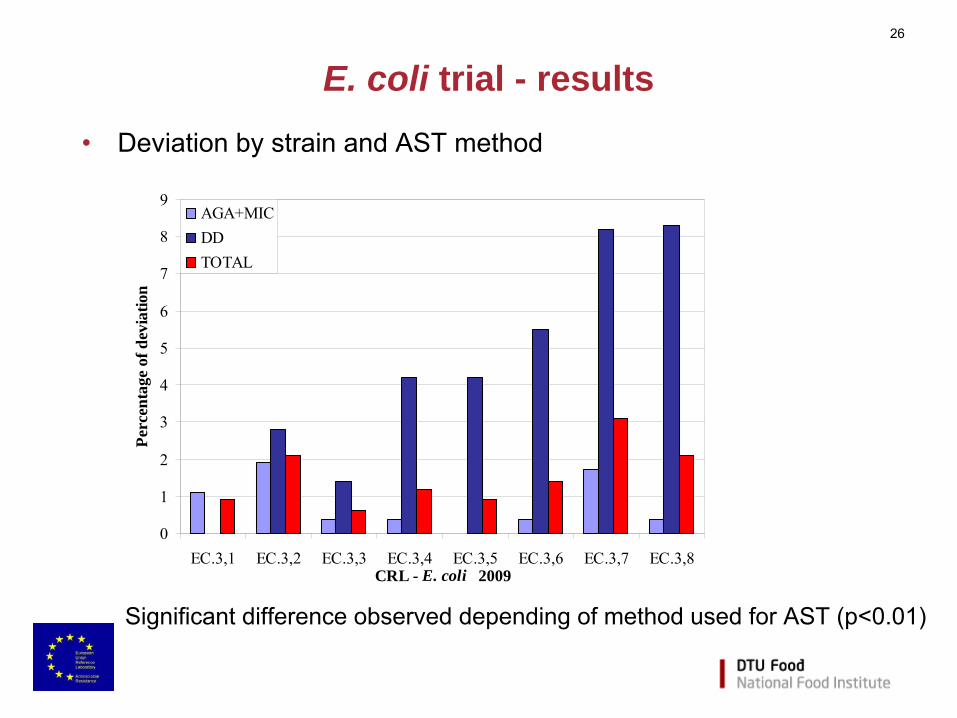
26
E. coli trial - results•
Deviation by strain and AST method
Significant difference observed depending of method used for AST
(p<0.01)
0
1
2
3
4
5
6
7
8
9
EC.3,1 EC.3,2 EC.3,3 EC.3,4 EC.3,5 EC.3,6 EC.3,7 EC.3,8CRL - E. coli 2009
Perc
enta
ge o
f dev
iatio
n
AGA+MICDDTOTAL
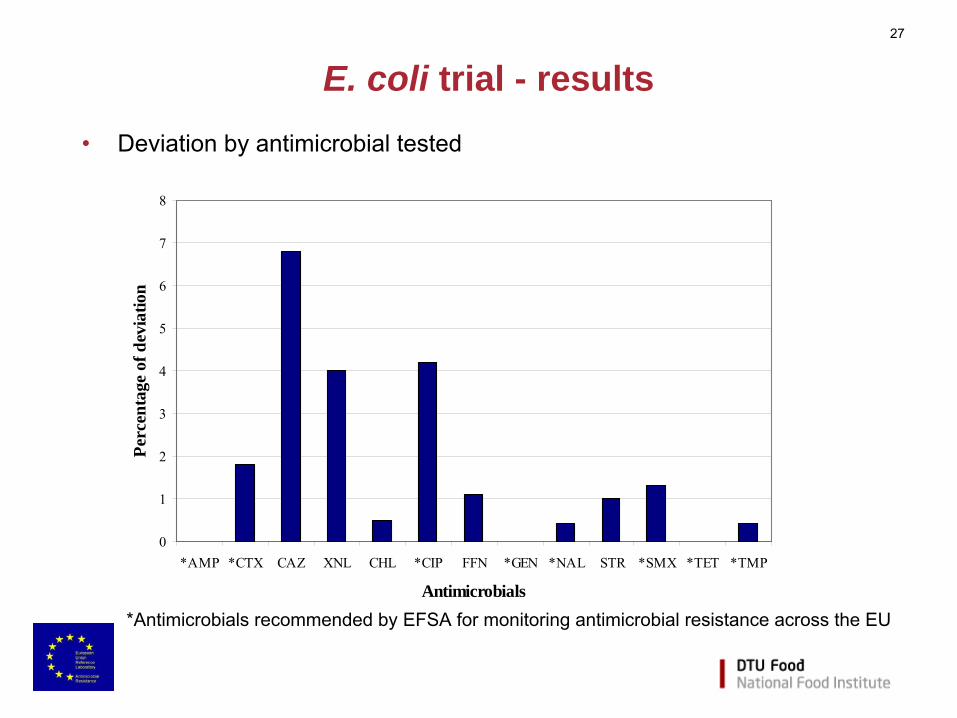
27
E. coli trial - results•
Deviation by antimicrobial tested
*Antimicrobials recommended by EFSA for monitoring antimicrobial
resistance across the EU
0
1
2
3
4
5
6
7
8
*AMP *CTX CAZ XNL CHL *CIP FFN *GEN *NAL STR *SMX *TET *TMP
Antimicrobials
Perc
enta
ge o
f dev
iatio
n
28
Ciprofloxacin resistance
•
Strains EC.3,4, EC.3,6 and EC.3,8 exhibiting low-level resistance to ciprofloxacin were reported as susceptible by some participants performing DD for AST
•
Discrepancy on the cut off values recommended by EFSA (>0,032 mg/L) and those recommended by CLSI (≥4 mg/L) for the MIC interpretation of ciprofloxacin.
•
For those participants performing disk diffusion, the EURL-AR recommends the use of a low concentration of ciprofloxacin (1 µg) in the disks as it appeared to increase the sensitivity of the assay
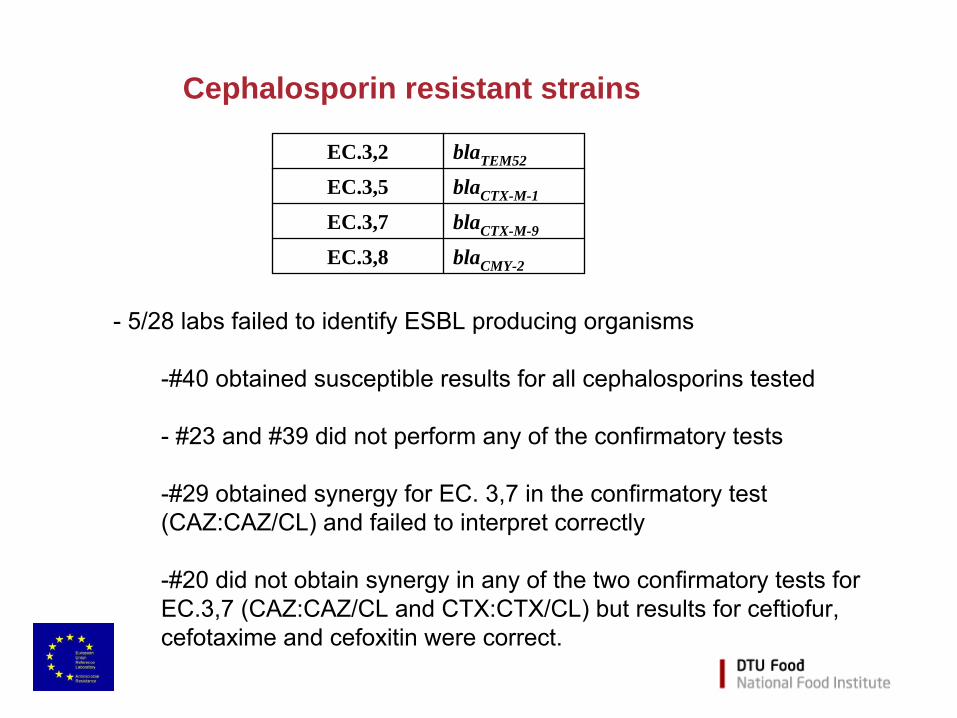
Cephalosporin resistant strains
- 5/28 labs failed to identify ESBL producing organisms
-#40 obtained susceptible results for all cephalosporins tested
- #23 and #39 did not perform any of the confirmatory tests
-#29 obtained synergy for EC. 3,7 in the confirmatory test (CAZ:CAZ/CL) and failed to interpret correctly
-#20 did not obtain synergy in any of the two confirmatory tests for EC.3,7 (CAZ:CAZ/CL and CTX:CTX/CL) but results for ceftiofur, cefotaxime
and cefoxitin
were correct.
EC.3,2 blaTEM52
EC.3,5 blaCTX-M-1
EC.3,7 blaCTX-M-9
EC.3,8 blaCMY-2
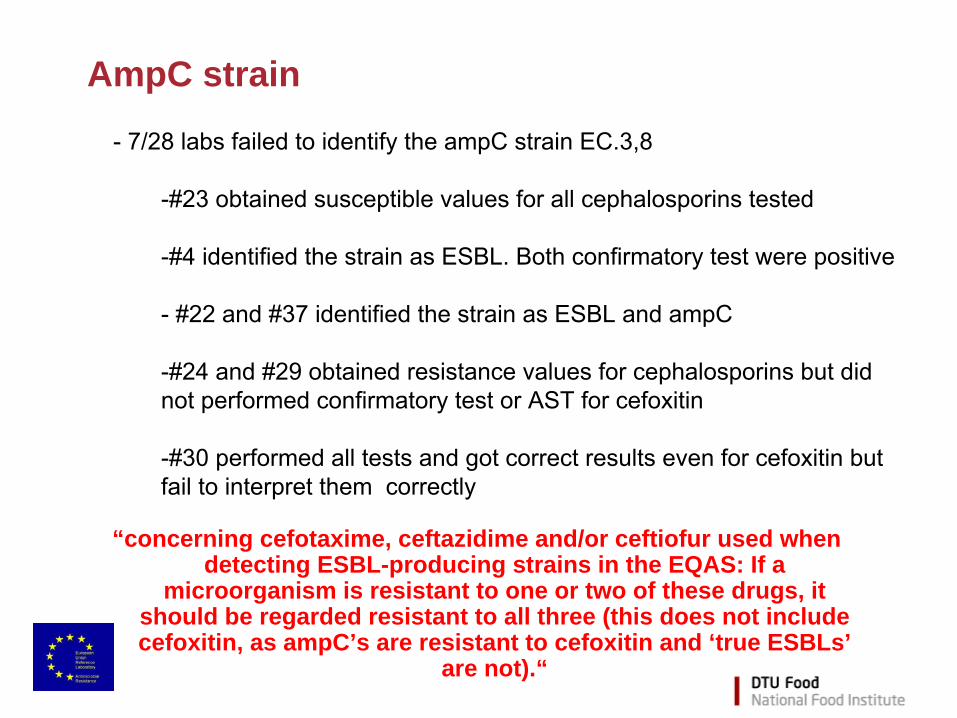
AmpC strain
“concerning cefotaxime, ceftazidime and/or ceftiofur used when detecting ESBL-producing strains in the EQAS: If a
microorganism is resistant to one or two of these drugs, it should be regarded resistant to all three (this does not include cefoxitin, as ampC’s are resistant to cefoxitin and ‘true ESBLs’
are not).“
- 7/28 labs failed to identify the ampC
strain EC.3,8
-#23 obtained susceptible values for all cephalosporins tested
-#4 identified the strain as ESBL. Both confirmatory test were positive
- #22 and #37 identified the strain as ESBL and ampC
-#24 and #29 obtained resistance values for cephalosporins
but did not performed confirmatory test or AST for cefoxitin
-#30 performed all tests and got correct results even for cefoxitin
but fail to interpret them correctly
0
2
4
6
8
10
12
*40 39 *23*15*18 32 29 25 37 24 19 20 1 2 4 6 9 11 12 *14 16 17 21 22 26 *30 33 34
laboratory number
Perc
emta
ge o
f dev
iatio
n
Deviations including only antimicrobials reported to EFSADeviations including all antimicrobials5% acceptance limit7% acceptance limit
31
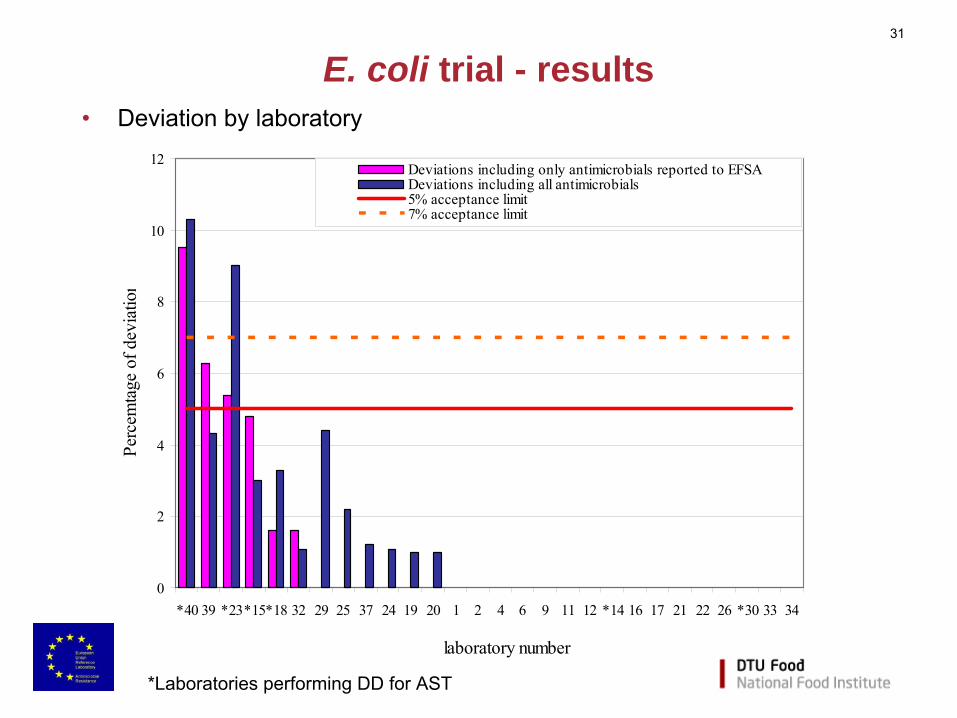
E. coli trial - results•
Deviation by laboratory
*Laboratories performing DD for AST
0
5
10
15
20
25
>0-1 >1-3 >3-5 >5-7 >7-9 >9-11
Interval of deviation
Num
ber
of la
bora
tori
es
32
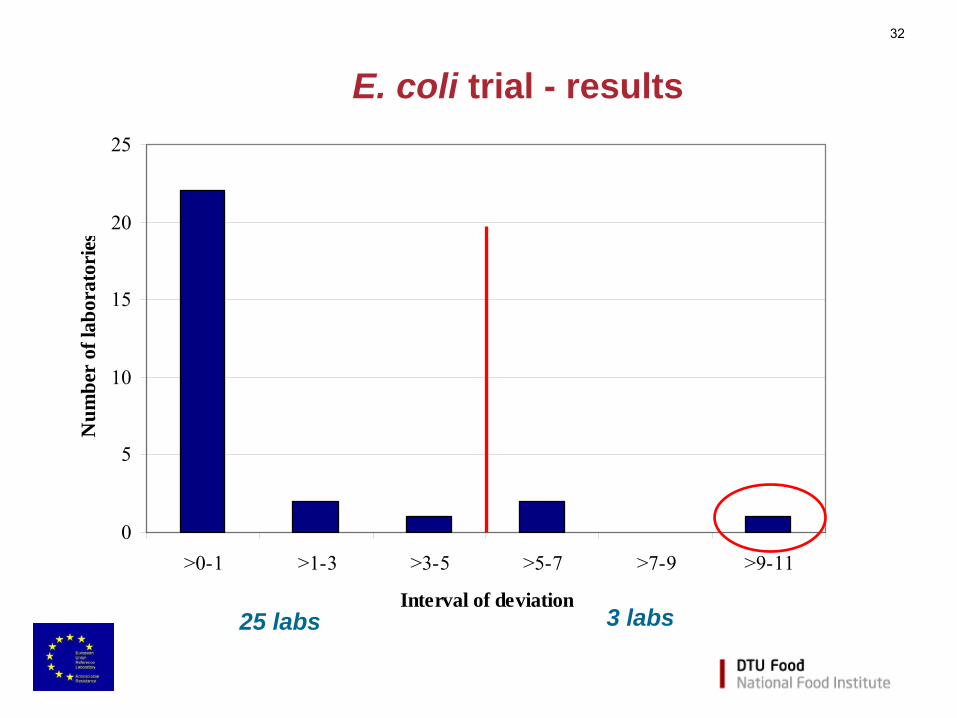
E. coli trial - results
25 labs 3 labs
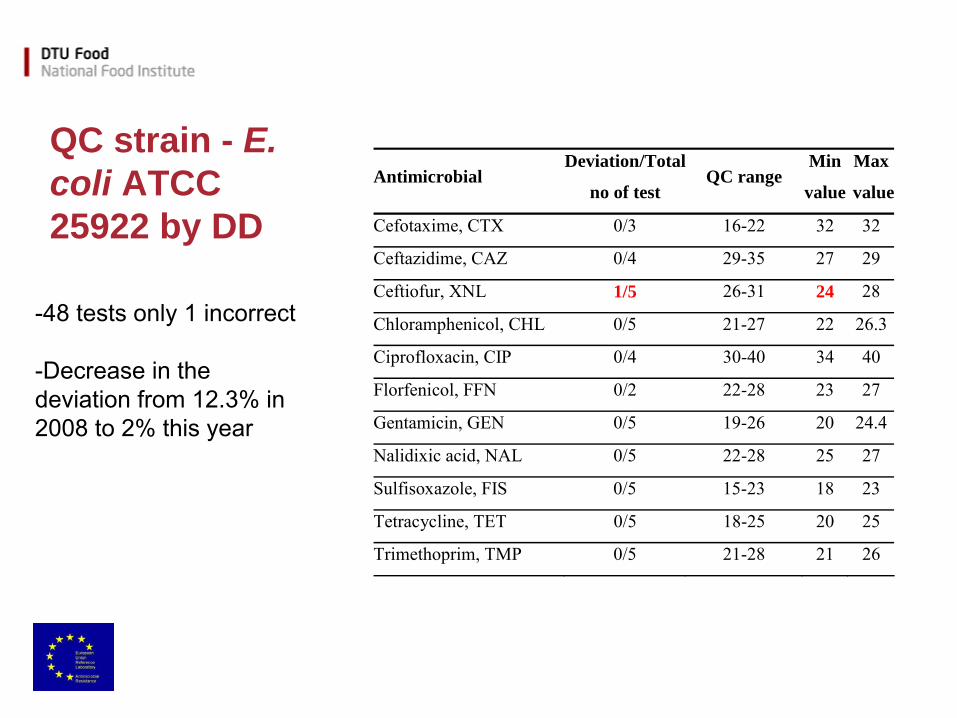
QC strain - E. coli ATCC 25922 by DD
-48 tests only 1 incorrect
-Decrease in the deviation from 12.3% in 2008 to 2% this year
Antimicrobial Deviation/Total
no of test QC range
Min
value
Max
value
Cefotaxime, CTX 0/3 16-22 32 32
Ceftazidime, CAZ 0/4 29-35 27 29
Ceftiofur, XNL 1/5 26-31 24 28
Chloramphenicol, CHL 0/5 21-27 22 26.3
Ciprofloxacin, CIP 0/4 30-40 34 40
Florfenicol, FFN 0/2 22-28 23 27
Gentamicin, GEN 0/5 19-26 20 24.4
Nalidixic acid, NAL 0/5 22-28 25 27
Sulfisoxazole, FIS 0/5 15-23 18 23
Tetracycline, TET 0/5 18-25 20 25
Trimethoprim, TMP 0/5 21-28 21 26
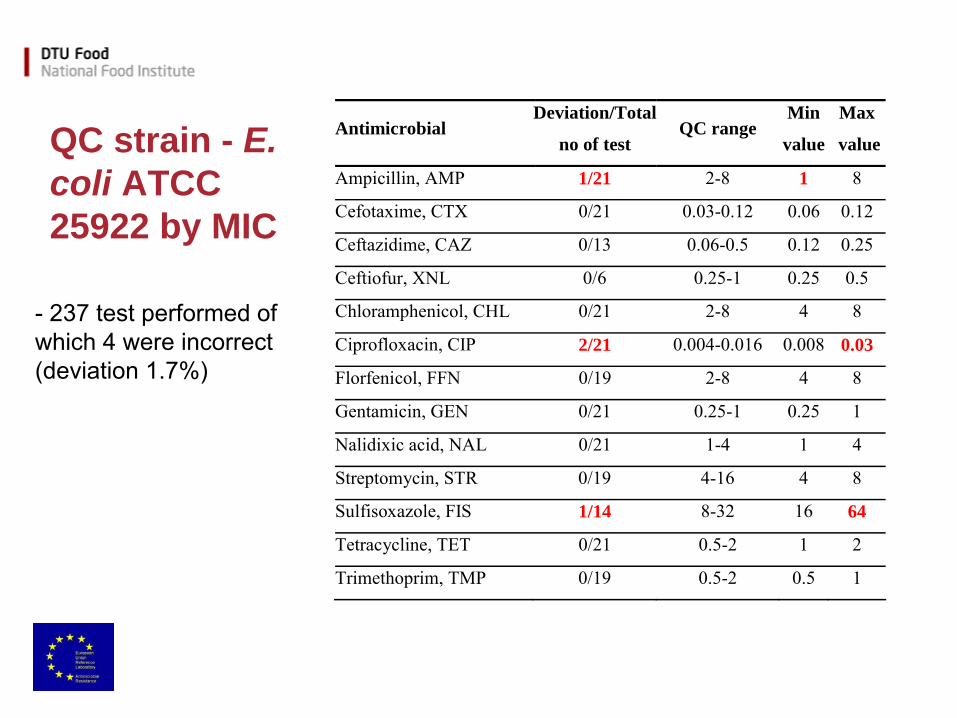
QC strain - E. coli ATCC 25922 by MIC
-
237 test performed of which 4 were incorrect (deviation 1.7%)
Antimicrobial Deviation/Total
no of test QC range
Min
value
Max
value
Ampicillin, AMP 1/21 2-8 1 8
Cefotaxime, CTX 0/21 0.03-0.12 0.06 0.12
Ceftazidime, CAZ 0/13 0.06-0.5 0.12 0.25
Ceftiofur, XNL 0/6 0.25-1 0.25 0.5
Chloramphenicol, CHL 0/21 2-8 4 8
Ciprofloxacin, CIP 2/21 0.004-0.016 0.008 0.03
Florfenicol, FFN 0/19 2-8 4 8
Gentamicin, GEN 0/21 0.25-1 0.25 1
Nalidixic acid, NAL 0/21 1-4 1 4
Streptomycin, STR 0/19 4-16 4 8
Sulfisoxazole, FIS 1/14 8-32 16 64
Tetracycline, TET 0/21 0.5-2 1 2
Trimethoprim, TMP 0/19 0.5-2 0.5 1
Summarizing E. coli trial
•
The best results for E. coli when compared to previous EQAS. Decrease in the average deviation for the E. coli trial, from 2.1% from EQAS 2008 to 1.5%
•
Deviations were mainly caused by laboratories performing DD for AST
•
Only three NRLs
exhibited deviations higher than 5%
:–
identification of low level ciprofloxacin resistance
–
cephalosporin resistance
•
Deviations for ESBL and ampC
detection are still high
•
For
E. coli ATCC 25922, the percentage of positive results for all test performed has increased from 90% in EQAS 2007 to 96.8% in 2008
and 98.3% this year
36
Conclusions
–
Performance has improved in the three trials
–
Enterococci
needs attention regarding the antimicrobials recommended by EFSA (aminoglycosides)
–
MRSA identification has improved
–
Ciprofloxacin resistance harmonization of cut off values
–
ESBL producing E. coli still considered a priority area
–
Main cause of deviations
•
Strains with expected MIC values close to the epidemiological cut off values to define them as resistant
•
Laboratories performing disk diffusion
–
No outliers have been identified this year, however, laboratories with high percentage of deviations would be contacted

Thank you for your attention