A Low Complexity Digital Phase-Locked Loop Based Frequency ...
Upload
entefyCategory
view
319download
0
2016 Research Report
DIGITAL INTERACTION &MODERN COMMUNICATION

What is digital complexity, and how does it affect everyday interactions?
Source: Entefy

Entefy’s 2016 national survey:
1,500 U.S. professionalss

Entefy’s universal communicator—an intelligent communication platform that seamlessly connects the people, services, conversations, contacts, files, apps, smart devices, and smart things in your digital life.
Source: Entefy

We wanted to know…?

Just how many devices and applications do people routinely use?
How many messages are people exchanging with one another?
Does the current state of technology create complexity for busy workers?
What percentage of people care about simplifying their digital lives?

Using an independent third party, we surveyed:
1,500 working adultsEvenly distributed in age range from 18-65Covering both small and large cities across the U.S.

Focused in these four areas:
HealthcareTechnologyFinancial Services Legal
Findings and insights
People are living increasingly active digital lives characterized by the use of multiple devices, applications, and services.

And there’s a bi-modal distribution of interest in a universal communicator that simplifies communication and interaction in today’s digital world.

“Very Interested” in simplifying digital life
93%
technicalnovices
78%
technical experts
Source: Entefy 2016 national survey of 1,500 U.S. professionals

Early adoption
In 1962, Everett Rogers in Diffusion of Innovations concluded that 16% of the U.S. population are innovators or early adopters.

In 2016, we found that 61% self-identified as either first or early adopters of new technology.

1962
16% 61%
2016
Early adoption
then
Early adoption
now
Sources: Entefy 2016 national survey of 1,500 U.S. professionals and Everett Rogers, 2003: The Diffusion of Innovations. Fifth Edition. The Free Press, New York.
Early adoption

Digital device use
Our survey respondents operate in technology-intense environments.

3-4 Devices
5-6 Devices
1-2 Devices
7+ Devices
62.1%
13.1%
2.5%
22.3%
Digital devices used per adult
Source: Entefy 2016 national survey of 1,500 U.S. professionals

Communication apps

Our respondents use an average of 6.9 communication applications.

Communication apps: average number per adult by industry
Source: Entefy 2016 national survey of 1,500 U.S. professionals
Without a single app that allows communication across all of these channels, people curate their own personal digital ecosystems.

Geography and adoption

The number of communication applications used is closely linked to the state in which people live and work.

7.9 apps
5.1 apps
Communication apps: average number per adult by state
Source: Entefy 2016 national survey of 1,500 U.S. professionals

Adults in states with smaller populations, lower density, and less diverse economies (such as Arkansas and Delaware) use 5.1 communication apps on average.

Adults in states with larger populations, higher density, more diverse economies, and established technology industries (such as California and New York) use 7.9 communication apps on average.
These states also have a higher proportion of “First” and “Early Adopters.”
Messaging volume
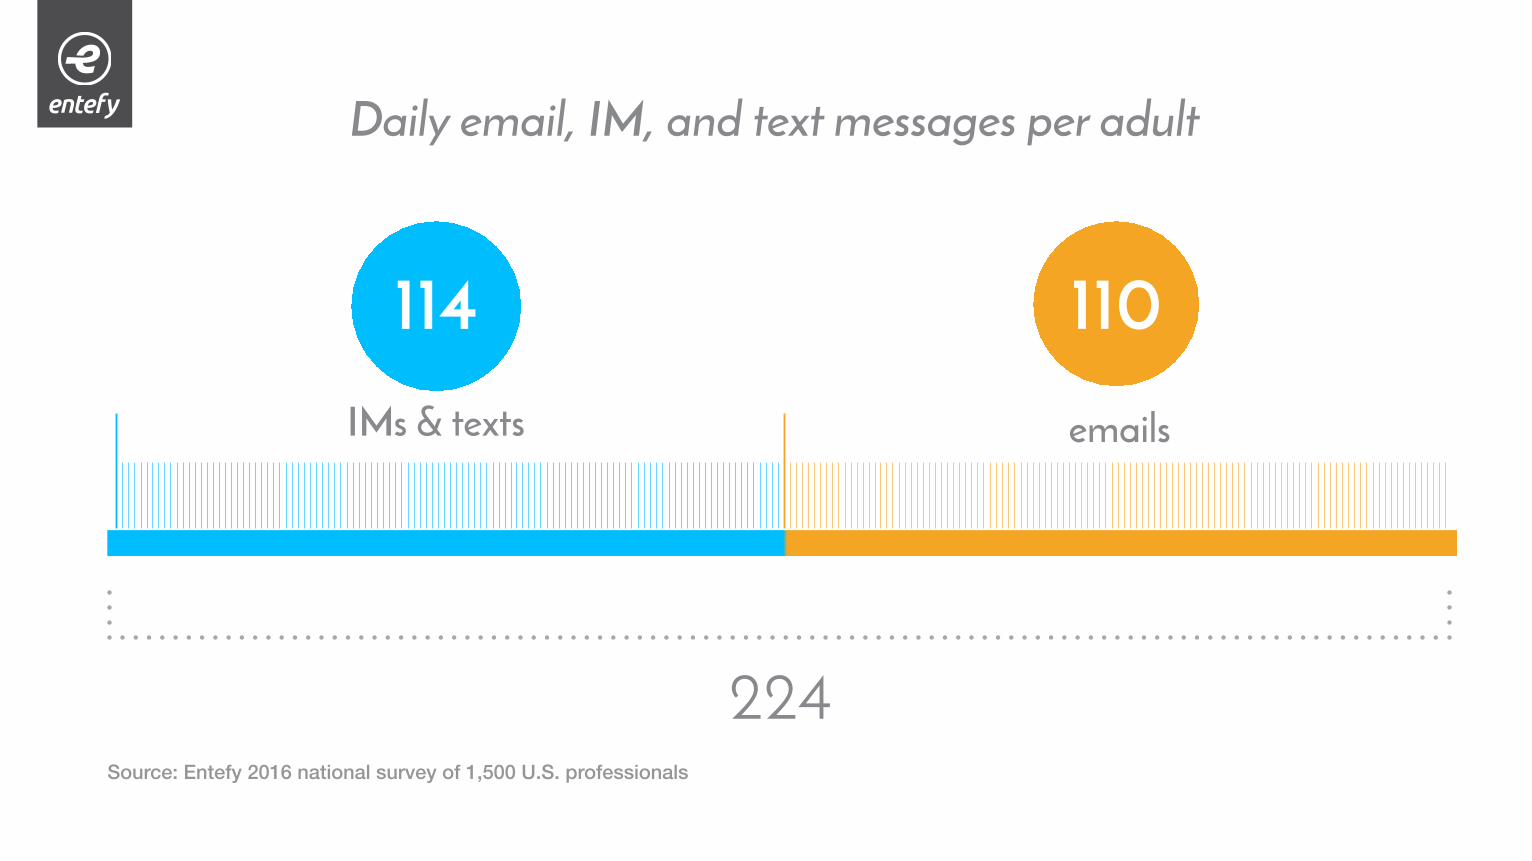
114IMs & texts
110emails
224Source: Entefy 2016 national survey of 1,500 U.S. professionals
Daily email, IM, and text messages per adult

Respondents:
Send and receive 14 messages per waking hour
Use 6.9 digital communication applications (excluding social media) on 3.4 devices
Attribute 60% of their emails as work-related
Social media platforms

We asked our respondents the extend to which they use social media.

Social network use by age: “Heavy Use” vs. “Don’t Use”
Ages: 18-29 Ages: 30-44 Ages: 45-65
Heavy Don’t Heavy Don’t Heavy Don’t
Facebook 59% 65% 50%4% 3% 6%
25% 22% 35%
29% 22% 41%
18% 24% 50%
30% 44% 64%
39% 29% 33%
26% 24% 12%
21% 18% 11%
36% 23% 8%
25% 13% 5%
12% 14% 8%
Snapchat
Source: Entefy 2016 national survey of 1,500 U.S. professionals

70.6%-82.4% of “Heavy” users of social media platforms indicated that they were “Very Interested” in a universal communicator.

Preferences in adopting new technologies
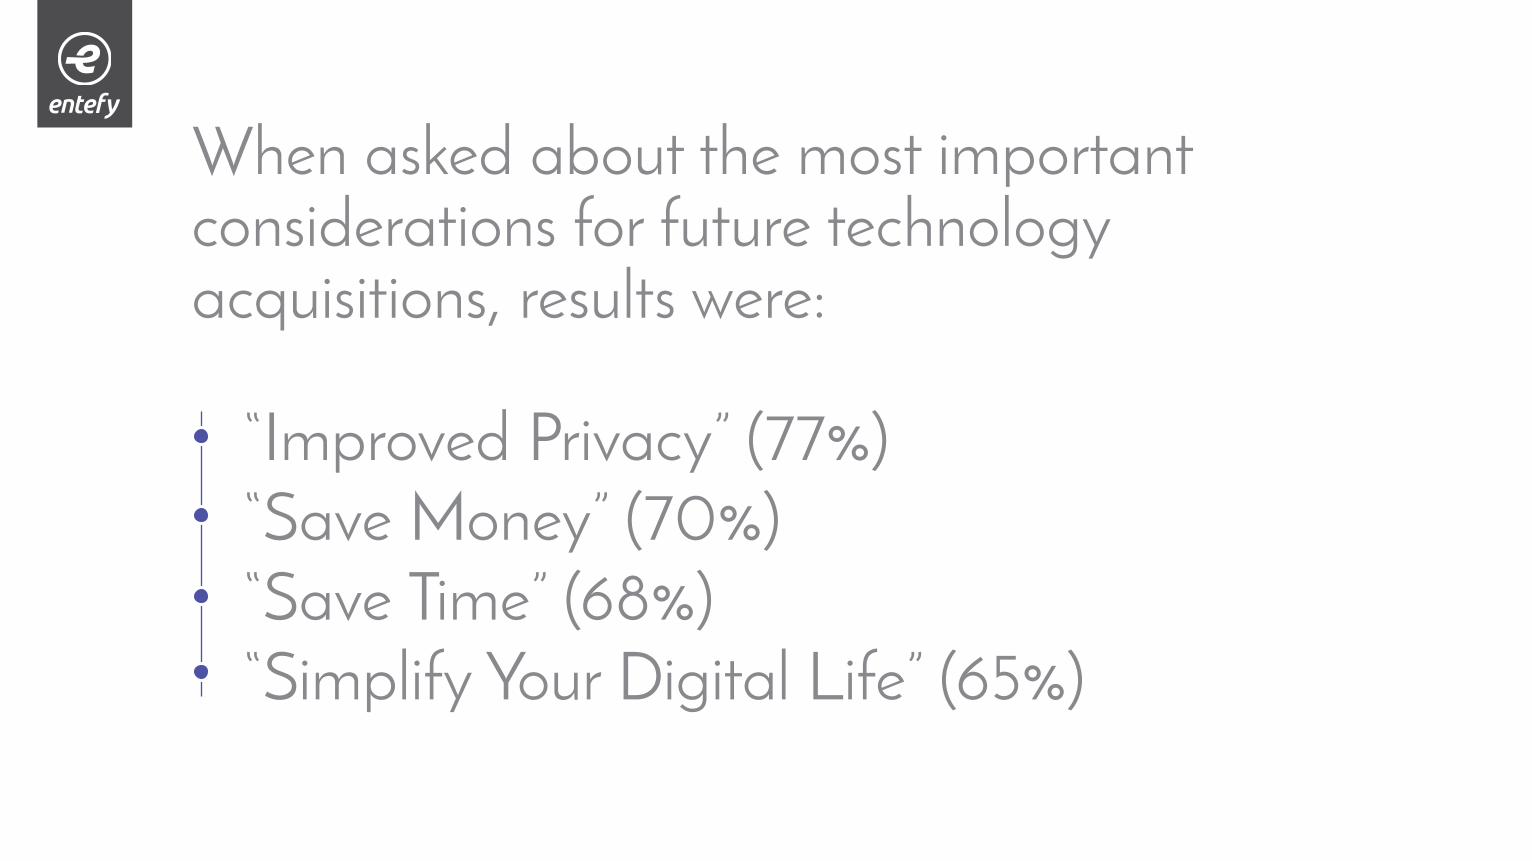
“Improved Privacy” (77%)“Save Money” (70%)“Save Time” (68%)“Simplify Your Digital Life” (65%)
When asked about the most important considerations for future technology acquisitions, results were:
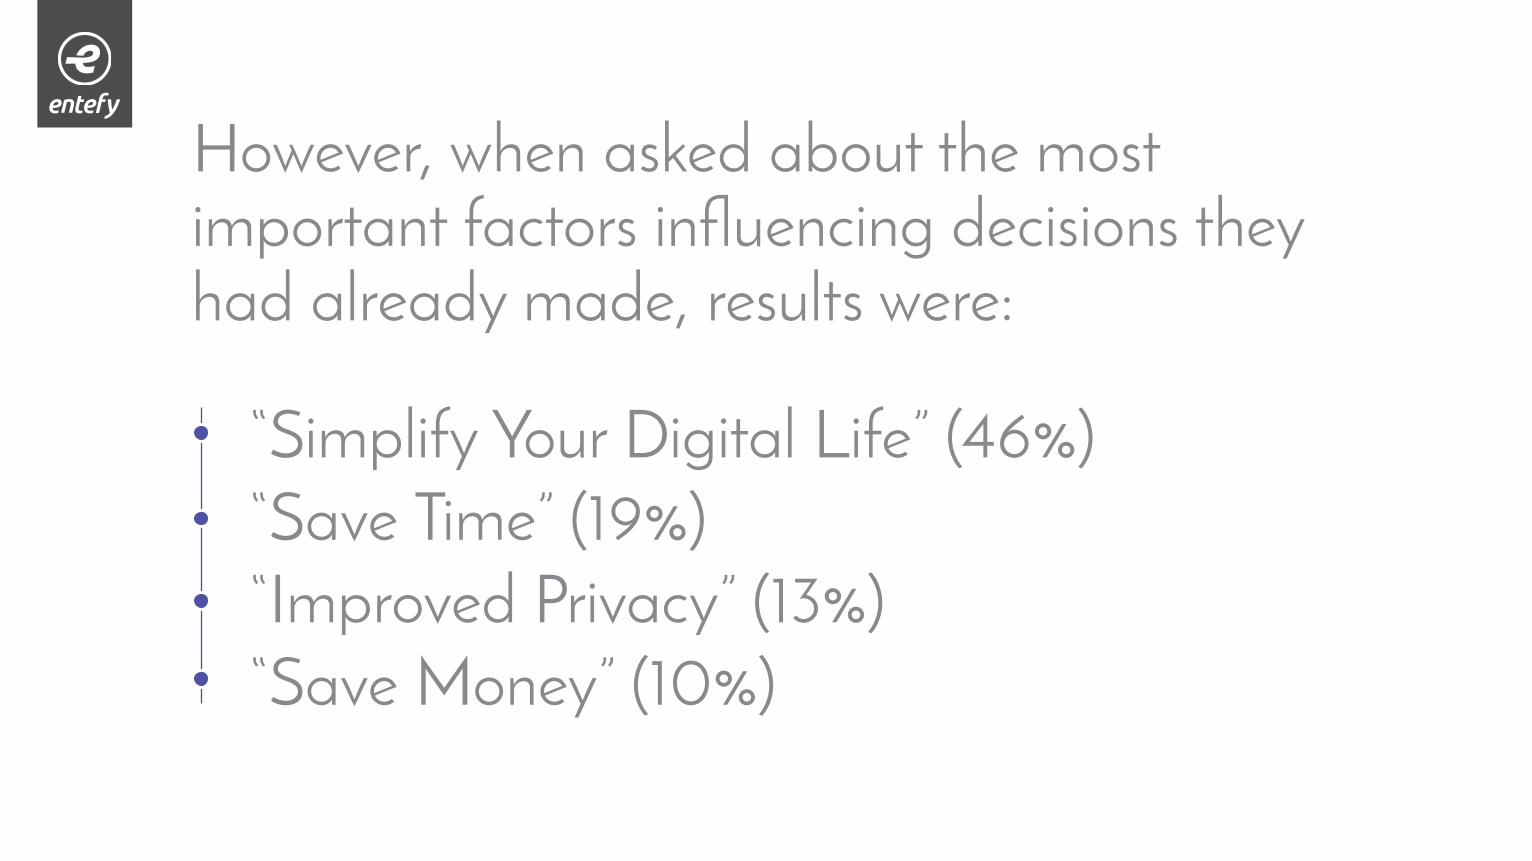
“Simplify Your Digital Life” (46%)“Save Time” (19%)“Improved Privacy” (13%)“Save Money” (10%)
However, when asked about the most important factors influencing decisions they had already made, results were:
What people say and do are two different things.

“Improved Privacy”
“Save Money”
“Save Time”
“Simplify Your Digital Life”
What you doWhat you say vs
77%
70%
68%
65%
10 %
13%
19%
46%
Source: Entefy 2016 national survey of 1,500 U.S. professionals
Adopting new technologies: what really matters

Simplification was clearly the dominant consideration when respondents made actual technology decisions.

Mobile apps we “Can’t Live Without”

“Don’t Use” “Rarely Use” “Actively Use”“Can’t Live Without”
We asked: Which mobile apps do you actively use? The response options were:
Instant messaging
Social networking
Health & fitness
Shopping
Sports
Finance
Business & professional
Food & entertainment
Travel
Music
Home automation
Email 95%
62%
86%
46%
78%
45%
76%
41%
76%
39%
72%
18%
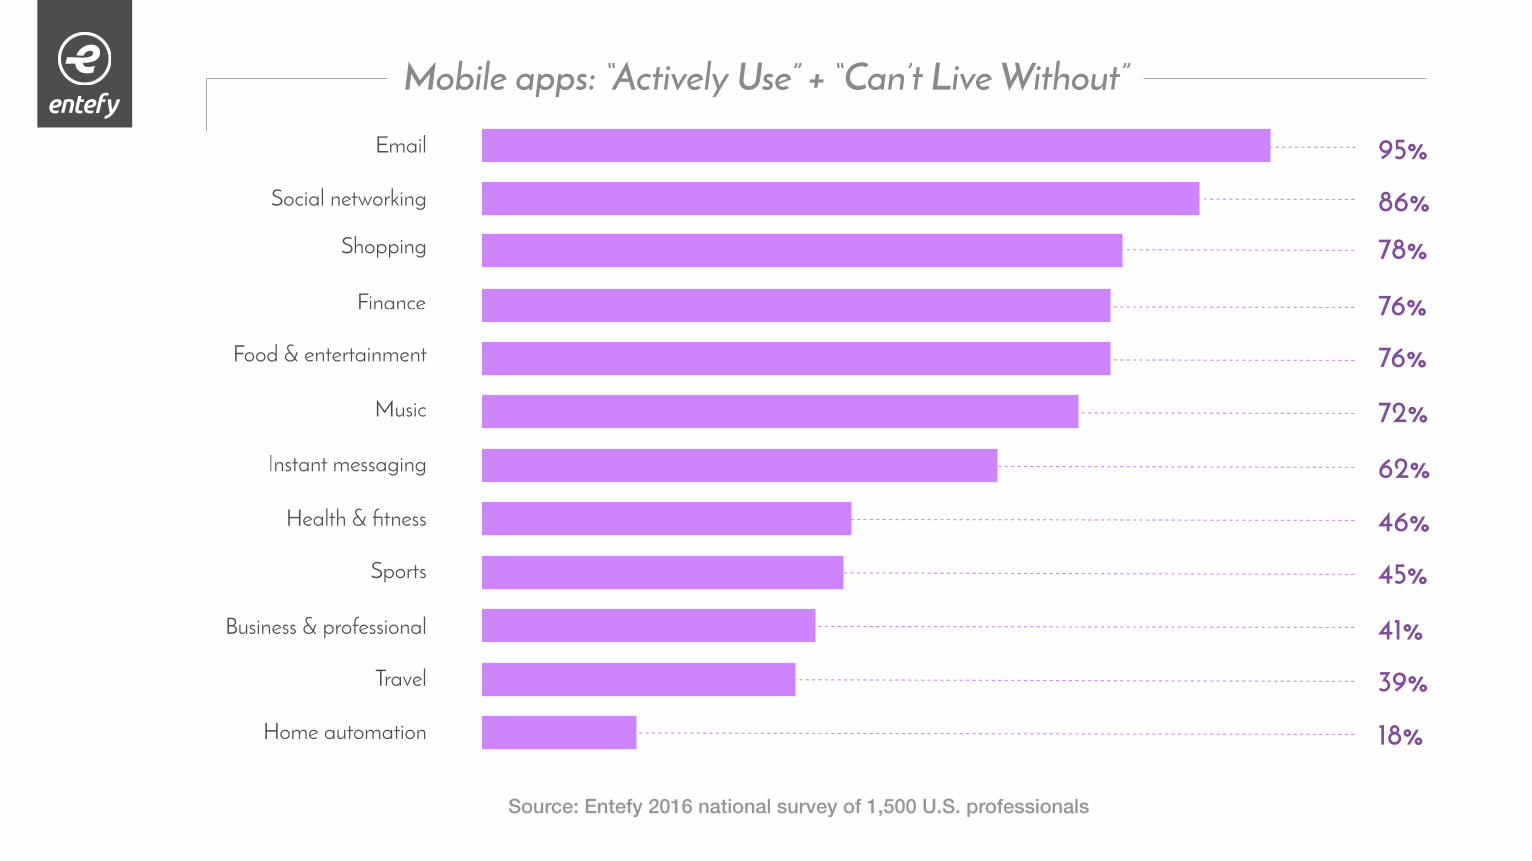
Mobile apps: “Actively Use” + “Can’t Live Without”
Source: Entefy 2016 national survey of 1,500 U.S. professionals

95% of survey respondents said they “Actively Use” or “Can’t Live Without” email.

Social network apps trail email use only slightly and remain relatively popular across all age groups.
Use of instant messaging apps trails email and social network apps.
There’s also a decline in usage from youngest to oldest age groups.

94%
87%
71%
95%
89%
64%
95%
80%
52%
6%
13%
29%
5%
11%
39%
5%
20%
48%
“Don’t Use” + “Rarely Use”
“Don’t Use” + “Rarely Use”
“Don’t Use” + “Rarely Use”
“Actively Use” + “Can’t Live Without”
“Actively Use” + “Can’t Live Without”
“Actively Use” + “Can’t Live Without”
Ages: 18-29 Ages: 30-44 Ages: 45-65
Social Network
Instant Messaging
Digital communication and social network mobile app use by age
Source: Entefy 2016 national survey of 1,500 U.S. professionals
Conclusion

Communication apps are core to the average person’s digital ecosystem.
On average, respondents use 3.4 devices and 6.9 communication apps (11.2 when you include social media apps).
Simplification is the dominant consideration when making actual technology decisions.
An astonishing 95% were “Very Interested” or “Somewhat Interested” in the universal communicator technology.

Put simply…The more complex your digital life, the more complex your digital ecosystem. The more complex your digital ecosystem, the greater the need for core technology designed toreduce complexity for you.

About EntefyAt Entefy, we’re introducing the first universal communicator–a smart platform that uses advanced artificial intelligence to help you seamlessly interact with the people, services, and smart things in your life–all from a single application that runs beautifully across your favorite devices.
©2016 Entefy Inc. All rights reserved