ensus ureau’s Urbanized Areas, Urban lusters,
20
Comparing the Degree of Urbanization to the US Census Bureau’s Urbanized Areas, Urban Clusters, and Rural Areas Michael Ratcliffe, Michael Commons, and Jennifer Zanoni Geography Division US Census Bureau Developing a Global Definition of Cities and Settlements New York, NY USA 30 July 2018
Transcript of ensus ureau’s Urbanized Areas, Urban lusters,

Comparing the Degree of Urbanization to the US Census Bureau’s Urbanized Areas, Urban Clusters, and Rural Areas
Michael Ratcliffe, Michael Commons, and Jennifer Zanoni
Geography Division
US Census Bureau
Developing a Global Definition of Cities and Settlements
New York, NY USA
30 July 2018

Census Bureau Urban Areas
• Urbanized areas: 50,000 or more population.
• Urban clusters: at least 2,500 and less than 50,000 population.
• Defined primarily based on residential population density measured at the census tract and census block levels.• Initial urban core: at least 1,000 per square mile (386 per km2)
• Remainder of urban area: at least 500 per square mile (193 per km2)
2
2010 Census Population 2010 Percent
Total 308,745,538 100.0
Urban 249,253,271 80.7
Urbanized Area 219,922,123 71.2
Urban Cluster 29,331,148 9.5
Rural 59,492,267 19.3


Findings and Results
• The European Commission’s (EC) overall classification of urban and rural population and area compares favorably with the Census Bureau’s urban/rural classification.
• We see close comparability in the urban centre/urbanized area categories and in the rural categories:• 98% likelihood that an EC-urban centre cell is urban in the Census
Bureau’s classification.
• 97.9% likelihood that an EC-rural cell also is rural in the Census Bureau’s classification.
• Differences at all scales can be explained by:
• Differences in population density thresholds and other criteria.
• Differences in geographic units of analysis: grid cells v. census blocks.
4

Comparison of Urbanization Classifications: Washington, DC Area
5
EC Global Human Settlement Classification Census Bureau Urban Area Classification

Findings and Results
• In terms of definitions, the EC’s categories are similar to the Census Bureau’s categories.
• In terms of spatial extent, the EC’s urban categories differ from the Census Bureau’s.• The EC’s urban centre category generally covers a smaller spatial
extent than Census Bureau urbanized areas, but generally corresponds to the initial cores of urbanized areas.
• The EC’s urban cluster category differs substantially from the Census Bureau’s urban cluster category.
• Encompasses territory within Census Bureau urbanized areas that might be considered “suburban.”
• Includes areas defined as urban clusters by the Census Bureau.
• Does not include some smaller Census Bureau urban clusters.
6

Classification Hectares Pct. of Area
Total Rural Area 780,905,007 96.5%
Urbanized Areas 23,062,645 2.9%
Urban Clusters 5,103,293 0.6%
Total Urban Area 28,165,938 3.5%
US Census
Classification Hectares Pct. of Area
Uninhabited or Rural 786,790,741 97.2%
Village 2,746,152 0.3%
Town 2,144,211 0.3%
Suburban 8,150,154 1.0%
Urban Center 9,239,687 1.1%
Euro Urbanisation
Comparison Overview

Rural Urban Cluster Urbanized Area
Uninhabited or Rural 777,124,941 2,850,092 6,815,708
Vi l lage 1,602,541 672,133 471,478
Town 247,326 476,045 1,420,840
Suburban 1,520,987 1,100,524 5,528,643
Urban Center 409,212 4,499 8,825,976
Area in HectaresUS Census
Euro
Urb
anis
atio
n
Rural Urban Cluster Urbanized Area
Uninhabited or Rural 96.05% 0.35% 0.84%
Vi l lage 0.20% 0.08% 0.06%
Town 0.03% 0.06% 0.18%
Suburban 0.19% 0.14% 0.68%
Urban Center 0.05% 0.00% 1.09%
Percent of all AreaUS Census
Euro
Urb
anis
atio
n
Rural Urban Cluster Urbanized Area
Uninhabited or Rural 98.8% 0.4% 0.9% 100%
Vi l lage 58.4% 24.5% 17.2% 100%
Town 11.5% 22.2% 66.3% 100%
Suburban 18.7% 13.5% 67.8% 100%
Urban Center 4.4% 0.0% 95.5% 100%
Percent of Euro-ClassificationUS Census
Euro
Urb
anis
atio
nRural Urban Cluster Urbanized Area
Uninhabited or Rural 99.5% 55.8% 29.6%
Vi l lage 0.2% 13.2% 2.0%
Town 0.0% 9.3% 6.2%
Suburban 0.2% 21.6% 24.0%
Urban Center 0.1% 0.1% 38.3%
100% 100% 100%
US CensusEu
ro
Urb
anis
atio
n
Percent of Census-Classification
Total area for corresponding classifications
Percent of total area for each corresponding classification
Percent of each Euro-classification that falls within
each Census-Classification
Percent of each Census-classification that falls within
each Euro-Classification

Errors of OmissionPercentage of Census Bureau urbanized areas and urban clusters delineated as undeveloped or rural by EC (urban included for comparison), by Census Division
Pct Undev
Pct Rural
Pct Urban
Urbanized Areas 0.4 29.8 69.8
Urban Clusters 0.7 63.3 36.0
TOTAL 0.4 35.9 63.7
9
Division Pct Undev Pct Rural Pct Urban
New England 0.1 47.0 52.9
Middle Atlantic 0.3 36.0 63.7
East North Central 0.1 34.0 65.9
West North Central 0.3 35.2 64.6
South Atlantic 0.7 37.4 61.9
East South Central 0.5 47.8 51.7
West South Central 0.4 34.7 64.9
Mountain 0.9 31.7 67.5
Pacific (excl. AK & HI) 0.4 25.0 74.6
Hawaii 4.1 41.7 54.2
Alaska 2.3 55.2 42.5
All UAs and UCs 0.4 35.9 63.7

Errors of CommissionPercentage of Census Bureau rural area defined as urban by EC, by Census Division
10
DivisionPct. of Rural Area
Delineated as EC-Urban
Pct. of EC-Urban outside Census-
Urban
New England 0.45 7.0
Middle Atlantic 0.66 7.6
East North Central 0.33 7.0
West North Central 0.15 9.0
South Atlantic 0.55 7.4
East South Central 0.27 8.4
West South Central 0.26 9.0
Mountain 0.08 10.1
Pacific (excl. AK & HI) 0.29 8.9
Hawaii 0.48 18.8
Alaska 0.007 15.4
TOTAL 0.23% 8.15%

Combined MeasureUrban Land Area and Ratio of EC-Urban to Census-Urban
11
DivisionCensus-Urban
(hectares)EU-Urban (hectares)
EU-Urban / Census Urban
New England 1,716,510 977,575 0.570
Middle Atlantic 3,082,504 2,097,839 0.681
East North Central 4,344,466 3,077,038 0.708
West North Central 1,763,696 1,254,667 0.711
South Atlantic 6,695,663 4,470,068 0.668
East South Central 2,011,828 1,141,177 0.567
West South Central 3,459,183 2,467,981 0.713
Mountain 1,883,657 1,414,888 0.751
Pacific (excl. AK & HI) 3,102,524 2,540,189 0.819
Hawaii 103,967 69,400 0.668
Alaska 68,836 34,700 0.504
Total 28,232,834 19,545,522 0.692

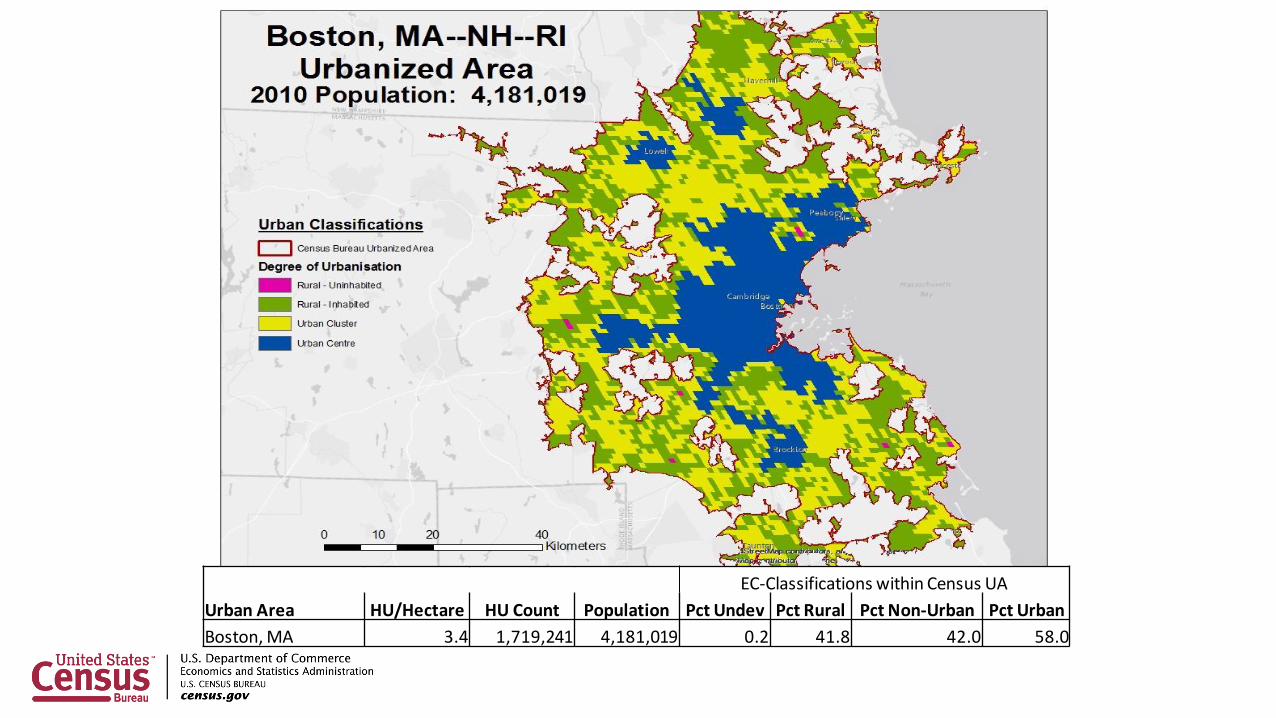
EC-Classifications within Census UA
Urban Area HU/Hectare HU Count Population Pct Undev Pct Rural Pct Non-Urban Pct Urban
Los Angeles, CA 9.2 4,217,448 12,150,996 0.1 4.6 4.7 95.3

EC-Classifications within Census UA
Urban Area HU/Hectare HU Count Population Pct Undev Pct Rural Pct Non-Urban Pct Urban
Phoenix, AZ 5.3 1,575,123 3,629,114 0.6 15.9 16.5 83.5

EC-Classifications within Census UA
Urban Area HU/Hectare HU Count Population Pct Undev Pct Rural Pct Non-Urban Pct Urban
Atlanta, GA 2.67 1,861,932 4,515,419 0.02 25.7 25.7 74.3
EC-Classifications within Census UA
Urban Area HU/Hectare HU Count Population Pct Undev Pct Rural Pct Non-Urban Pct Urban
Boston, MA 3.4 1,719,241 4,181,019 0.2 41.8 42.0 58.0

EC-Classifications within Census UA
Urban Area HU/Hectare HU Count Population Pct Undev Pct Rural Pct Non-Urban Pct Urban
Greenfield, MA 2.9 10,890 22,965 0.0 58.5 58.5 41.5

Comparison of Urban Area Classifications and Categories
17
Urbanized, Suburban, or Sub-Urban?

Concluding Thoughts: Terminology
• Overall, the terms used in the EC’s Level 2 categories are appropriate and useful for the US settlement system.
• Terminology, however, is always a challenge. Terms such as “town,” “village,” and “suburban” have different meanings and perceptions depending on context.
• “Suburb” implies a spatial relationship with an urban center/city. Yet, in the EC’s classification, there is no explicit linkage.
• In the US settlement context, areas classified as “town” in the EC classification may have functional relationships with larger urban centers and are, in effect, suburbs.
18

Concluding Thoughts
• EC’s overall classification of urban and rural population and area compares favorably with the Census Bureau’s urban/rural classification.
• Differences related to density thresholds, geographic units of analysis, minimum population thresholds, and other criteria are to be expected.
• Differences between the two classifications do not indicate that one is better than the other, but do raise questions about the Census Bureau’s criteria and classification that warrant further consideration. • Example: Should the Census Bureau apply different criteria at different
scales to avoid overbounding of smaller urban areas?
19

Thank you! Questions?
Contact Information:
Michael Ratcliffe
301-763-8977
20