Ensuring Your Transitional Housing Program Meets … Lives, Sharing Knowledge, Shaping Systems...
60
Rebuilding Lives, Sharing Knowledge, Shaping Systems Ensuring Your Transitional Housing Program Meets HUD Performance Standards Martha Kenton, MSW, MUP Senior Consultant, Training & Consulting Services Center for Urban Community Services
Transcript of Ensuring Your Transitional Housing Program Meets … Lives, Sharing Knowledge, Shaping Systems...
Rebuilding Lives, Sharing Knowledge, Shaping Systems
Ensuring Your Transitional Housing Program Meets HUD
Performance Standards
Martha Kenton, MSW, MUPSenior Consultant, Training & Consulting Services
Center for Urban Community Services
FRANCES L. & EDWIN L. CUMMINGS MEMORIAL FUND
A special thank you for the support of
Introductions
•What is your name?
•What agency and program are you from?
•Name one positive thing you hope to achieve today
In this training or in general
Training Objectives
By the end of this training you will have an understanding of…
1. What HUD expects from your program and from the NYC Continuum of Care
2. The impact of not meeting HUD performance expectations
3. What data HUD uses to measure performance
4. How to use sample tools to track process and outcome indicators
5. A framework for Continuous Quality Improvement (CQI) that can help your programs to achieve performance targets
Agenda
Part I: NYCCoC and HEARTH Goals What is the NYCCoC?
Overview of HEARTH
Performance Measures under HEARTH
Community level
Program level
APR
Impact of performance
Exercise
Break
Agenda
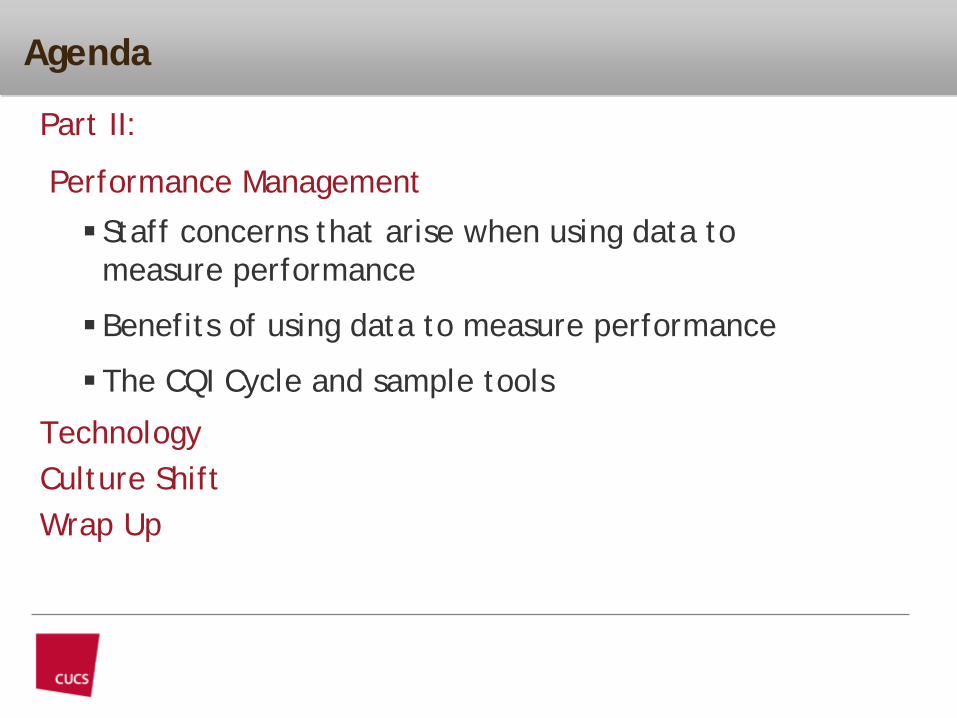
Part II:
Performance Management
Staff concerns that arise when using data to measure performance
Benefits of using data to measure performance
The CQI Cycle and sample tools
Technology Culture ShiftWrap Up
7
Part I: HEARTH &NYC Coalition on the Continuum of Care
NYC Coalition on the Continuum of Care(NYC CoC)
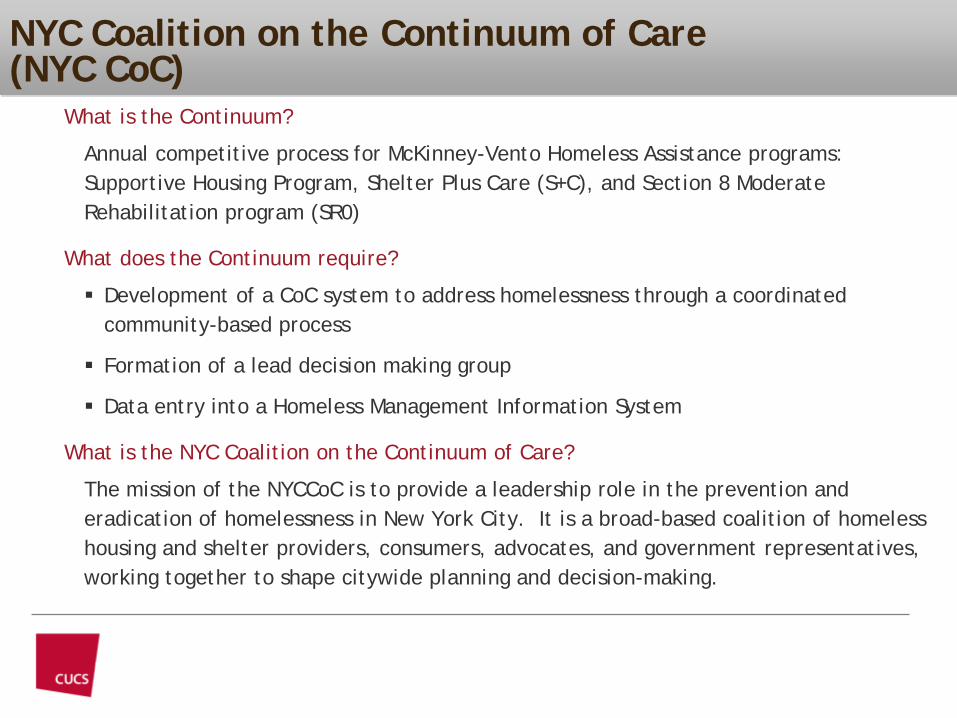
• What is the Continuum?
Annual competitive process for McKinney-Vento Homeless Assistance programs: Supportive Housing Program, Shelter Plus Care (S+C), and Section 8 Moderate Rehabilitation program (SR0)
• What does the Continuum require?
Development of a CoC system to address homelessness through a coordinated community-based process
Formation of a lead decision making group
Data entry into a Homeless Management Information System
• What is the NYC Coalition on the Continuum of Care?
The mission of the NYCCoC is to provide a leadership role in the prevention and eradication of homelessness in New York City. It is a broad-based coalition of homeless housing and shelter providers, consumers, advocates, and government representatives, working together to shape citywide planning and decision-making.
Homeless Emergency Assistance and Rapid Transition to Housing (HEARTH)
•Homeless
•Emergency
•Assistance and
•Rapid
•Transition to
•Housing
•HEARTH provides communities with streamlined resources and better tools to prevent and end homelessness.
HEARTH Overview
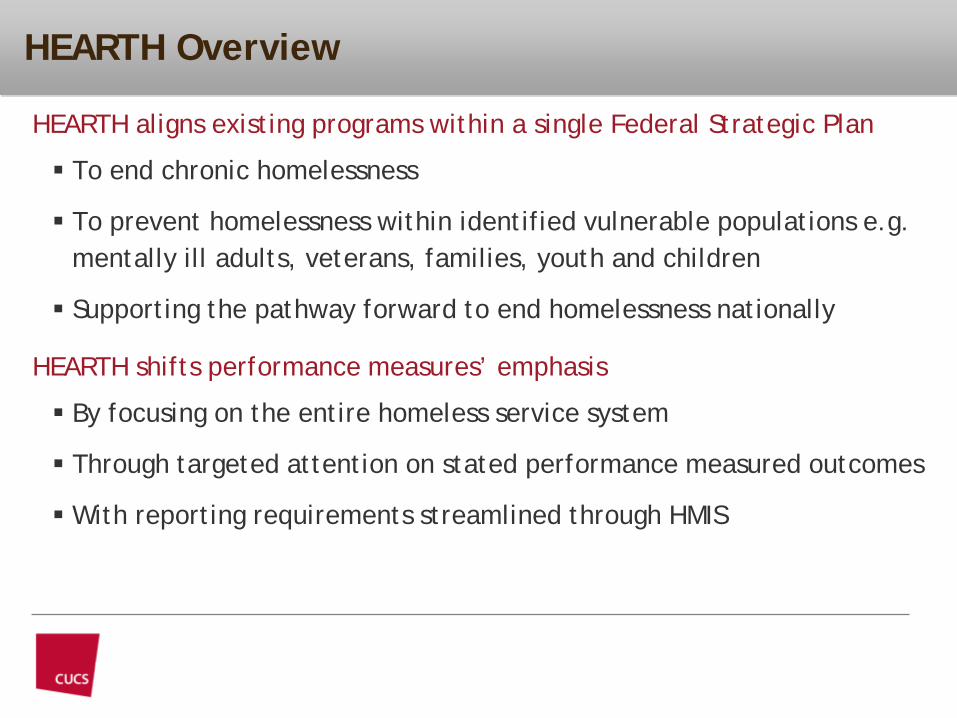
• HEARTH aligns existing programs within a single Federal Strategic Plan
To end chronic homelessness
To prevent homelessness within identified vulnerable populations e.g. mentally ill adults, veterans, families, youth and children
Supporting the pathway forward to end homelessness nationally
• HEARTH shifts performance measures’ emphasis
By focusing on the entire homeless service system
Through targeted attention on stated performance measured outcomes
With reporting requirements streamlined through HMIS
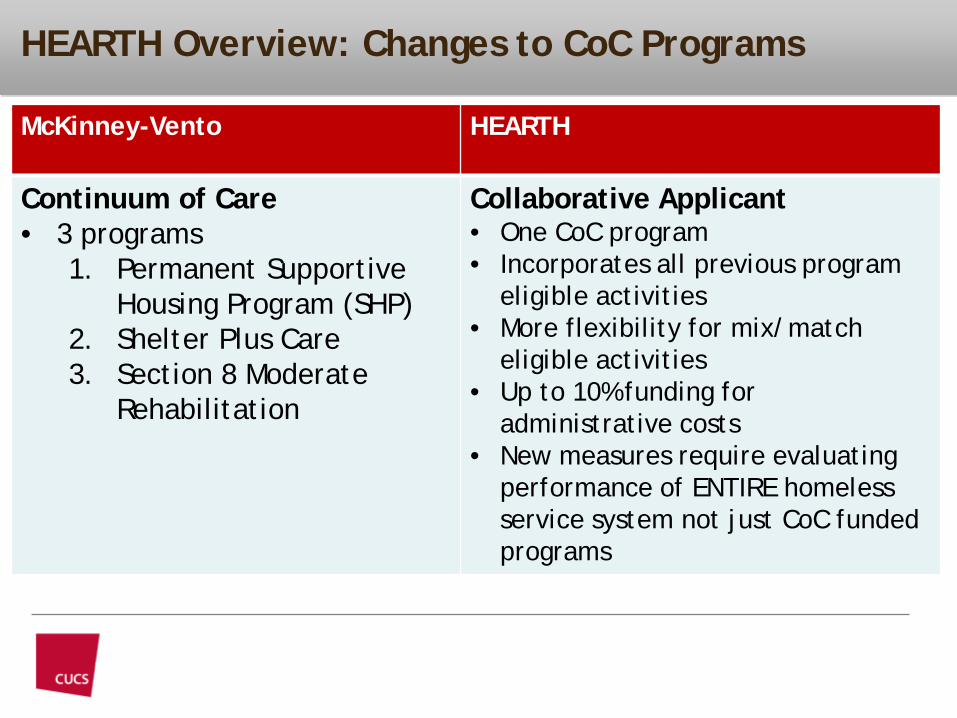
HEARTH Overview: Changes to CoC Programs
McKinney-Vento HEARTH
Continuum of Care• 3 programs
1. Permanent Supportive Housing Program (SHP)
2. Shelter Plus Care3. Section 8 Moderate
Rehabilitation
Collaborative Applicant• One CoC program• Incorporates all previous program
eligible activities • More flexibility for mix/match
eligible activities• Up to 10% funding for
administrative costs• New measures require evaluating
performance of ENTIRE homeless service system not just CoC funded programs
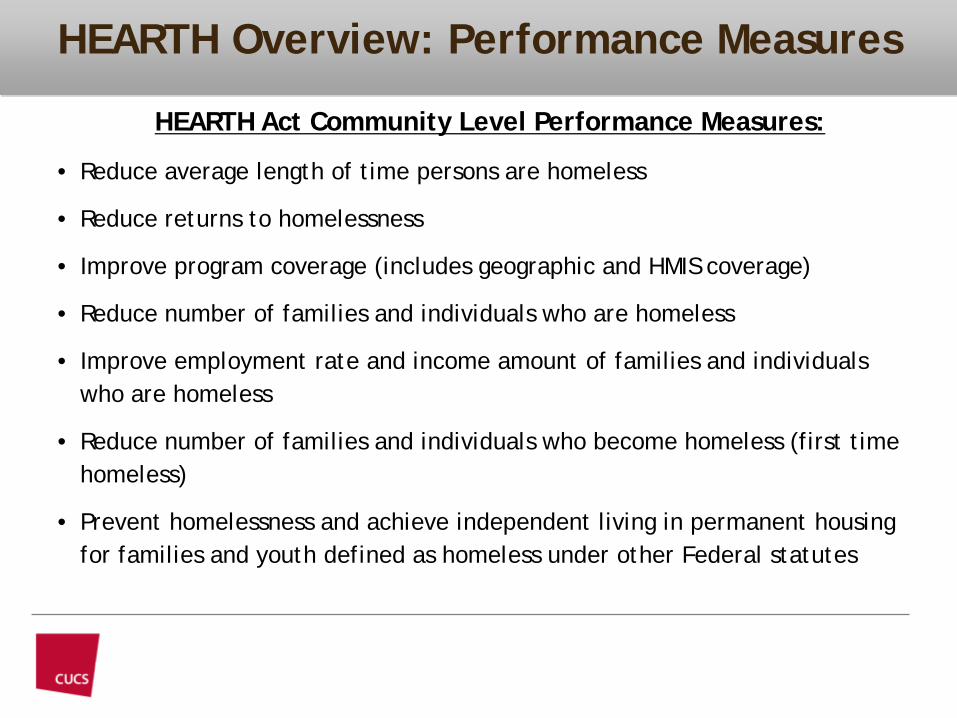
HEARTH Overview: Performance Measures
• HEARTH Act Community Level Performance Measures:
• Reduce average length of time persons are homeless
• Reduce returns to homelessness
• Improve program coverage (includes geographic and HMIS coverage)
• Reduce number of families and individuals who are homeless
• Improve employment rate and income amount of families and individuals who are homeless
• Reduce number of families and individuals who become homeless (first time homeless)
• Prevent homelessness and achieve independent living in permanent housing for families and youth defined as homeless under other Federal statutes
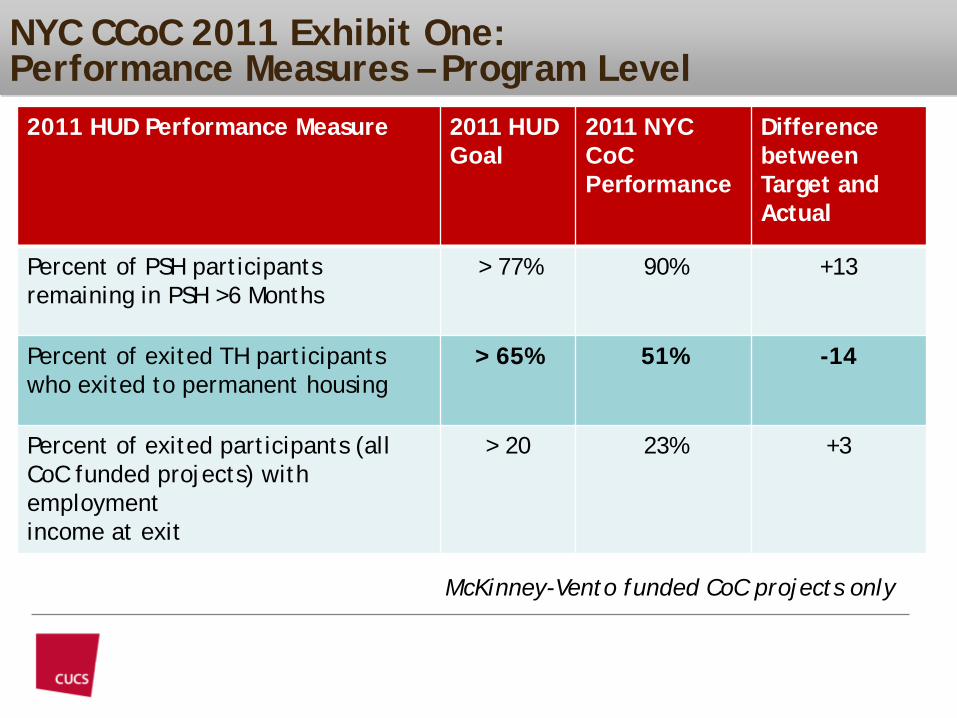
NYC CCoC 2011 Exhibit One:Performance Measures – Program Level
2011 HUD Performance Measure 2011 HUD Goal
2011 NYC CoCPerformance
Difference between Target and Actual
Percent of PSH participants remaining in PSH >6 Months
> 77% 90% +13
Percent of exited TH participants who exited to permanent housing
> 65% 51% -14
Percent of exited participants (all CoC funded projects) with employmentincome at exit
> 20 23% +3
McKinney-Vento funded CoC projects only
HEARTH Overview: Key Performance Measures
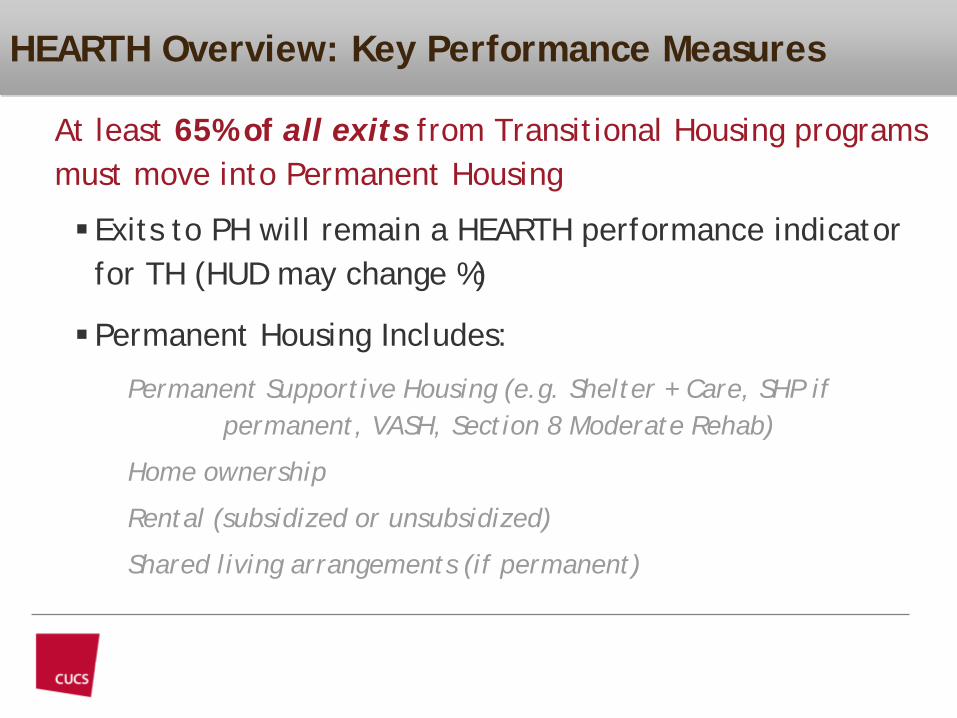
• At least 65% of all exits from Transitional Housing programs must move into Permanent Housing
Exits to PH will remain a HEARTH performance indicator for TH (HUD may change %)
Permanent Housing Includes:
Permanent Supportive Housing (e.g. Shelter + Care, SHP if permanent, VASH, Section 8 Moderate Rehab)
Home ownership
Rental (subsidized or unsubsidized)
Shared living arrangements (if permanent)

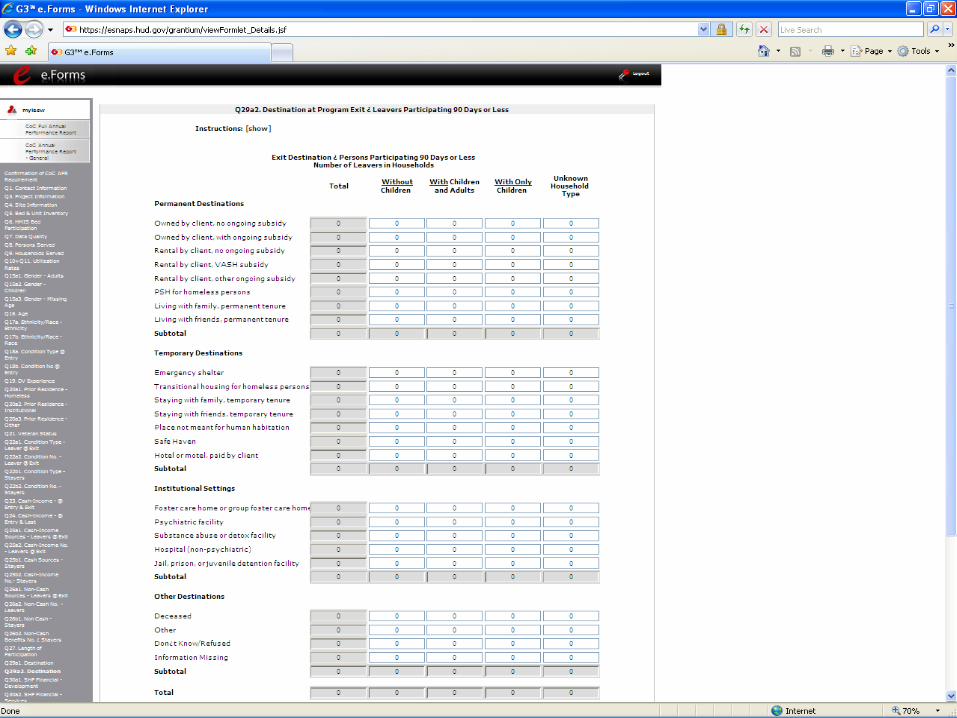
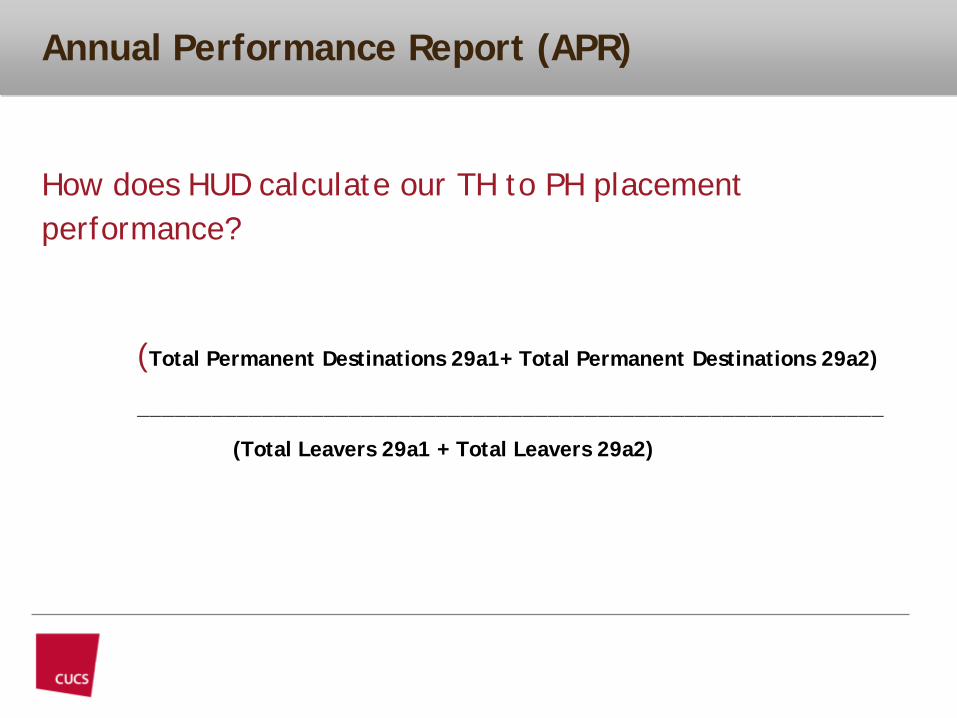
Annual Performance Report (APR)
How does HUD calculate our TH to PH placement performance?
(Total Permanent Destinations 29a1+ Total Permanent Destinations 29a2)
____________________________________________________________
(Total Leavers 29a1 + Total Leavers 29a2)
Impact of Placement Performance
•What are the benefits of increasing placements to PH?
•What happens if you don’t meet the HUD criteria?
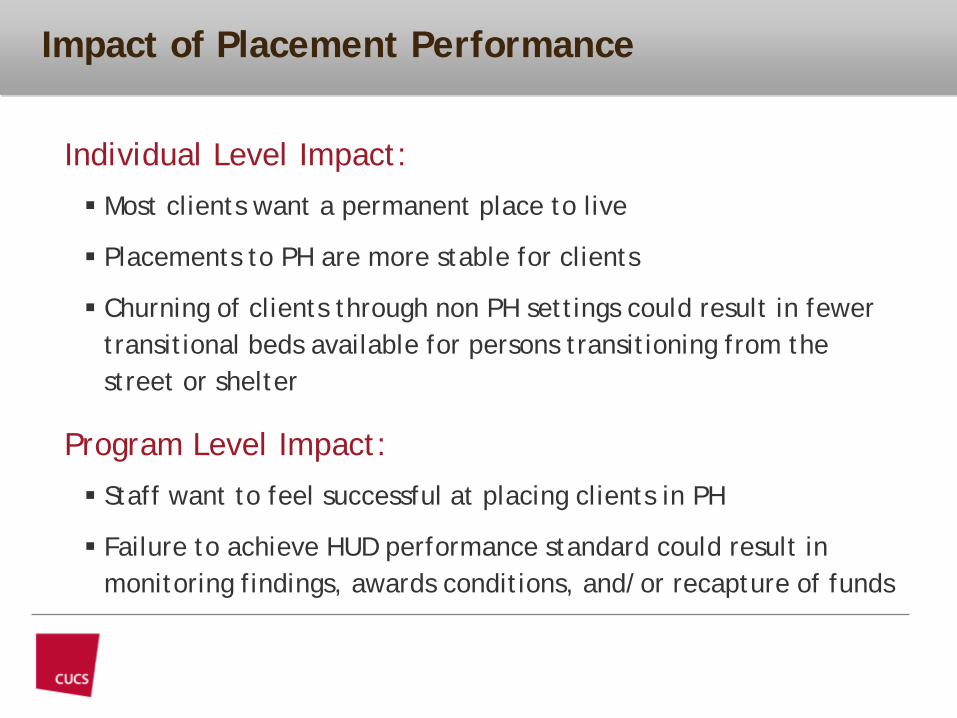
Impact of Placement Performance
• Individual Level Impact:
Most clients want a permanent place to live
Placements to PH are more stable for clients
Churning of clients through non PH settings could result in fewer transitional beds available for persons transitioning from the street or shelter
• Program Level Impact:
Staff want to feel successful at placing clients in PH
Failure to achieve HUD performance standard could result in monitoring findings, awards conditions, and/or recapture of funds
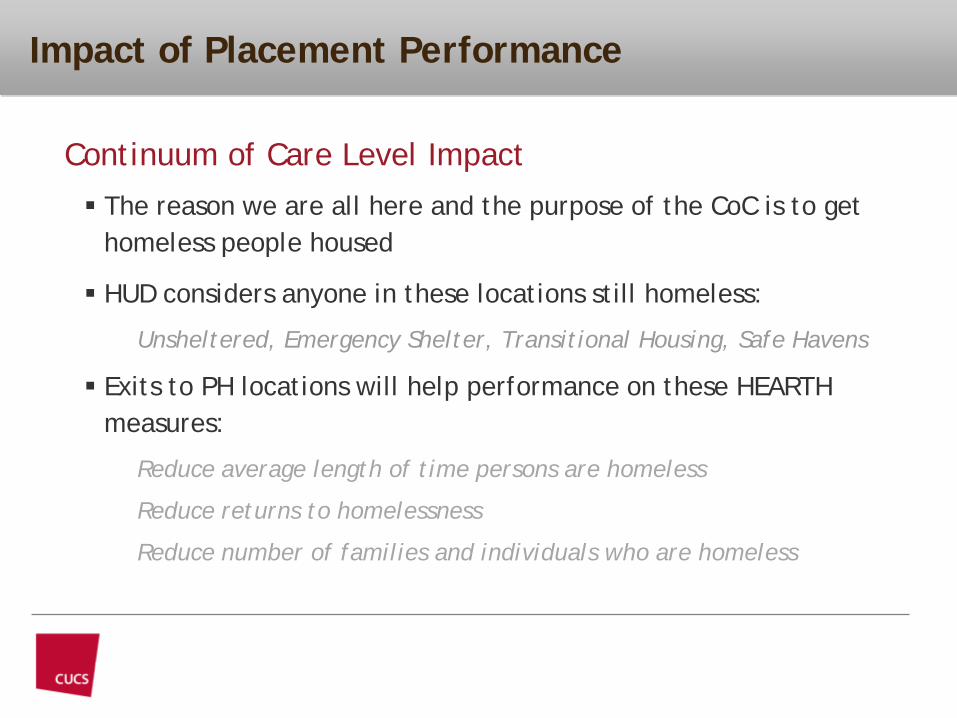
Impact of Placement Performance
• Continuum of Care Level Impact
The reason we are all here and the purpose of the CoC is to get homeless people housed
HUD considers anyone in these locations still homeless:
Unsheltered, Emergency Shelter, Transitional Housing, Safe Havens
Exits to PH locations will help performance on these HEARTH measures:
Reduce average length of time persons are homeless
Reduce returns to homelessness
Reduce number of families and individuals who are homeless
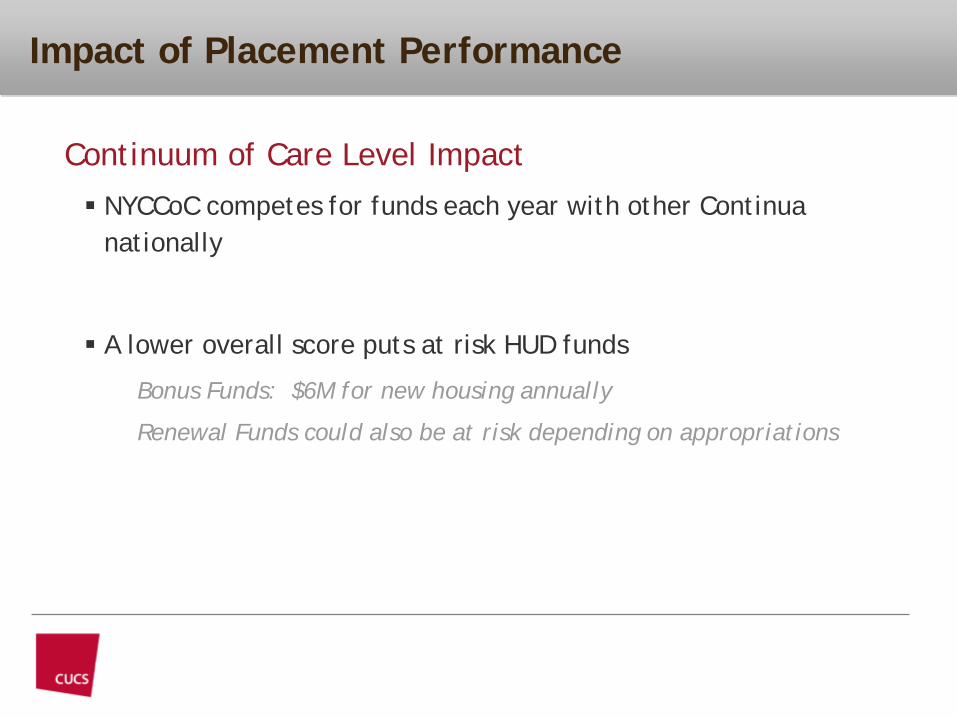
Impact of Placement Performance
• Continuum of Care Level Impact
NYCCoC competes for funds each year with other Continua nationally
A lower overall score puts at risk HUD funds
Bonus Funds: $6M for new housing annually
Renewal Funds could also be at risk depending on appropriations
22
Pre-Training Assignment Review

23
Break
24
Part II Performance Management
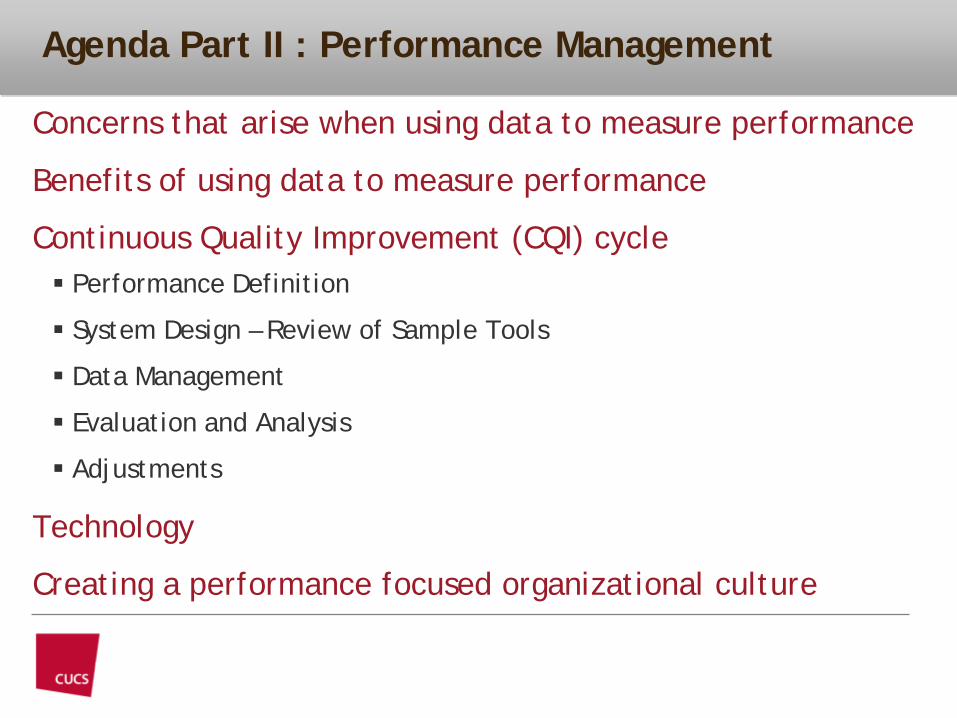
Agenda Part II : Performance Management
• Concerns that arise when using data to measure performance
• Benefits of using data to measure performance
• Continuous Quality Improvement (CQI) cycle Performance Definition
System Design – Review of Sample Tools
Data Management
Evaluation and Analysis
Adjustments
• Technology
• Creating a performance focused organizational culture
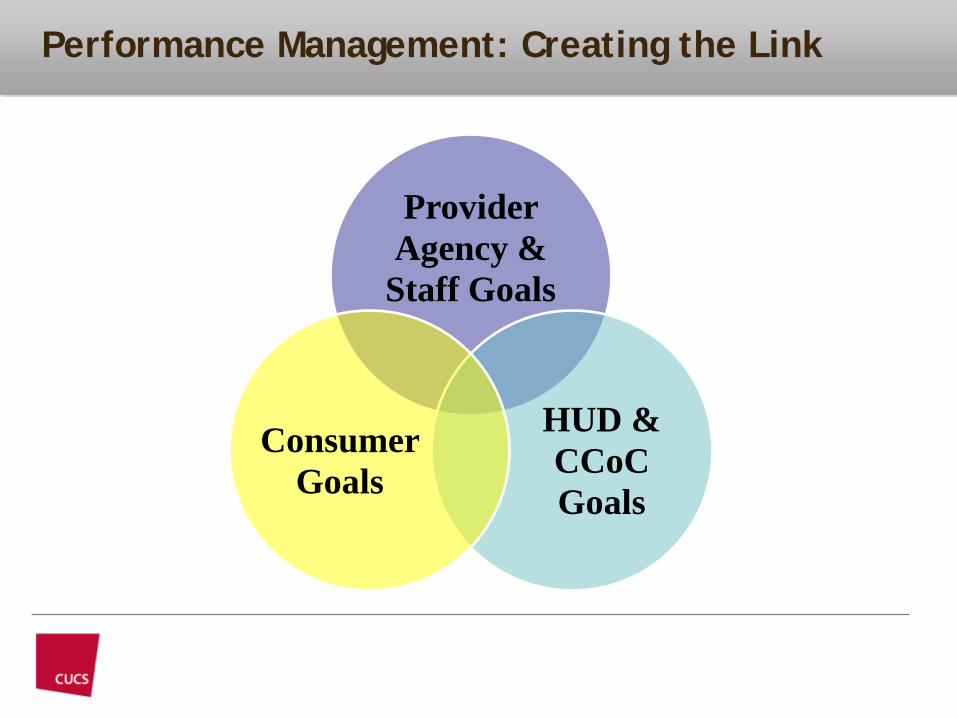
Performance Management: Creating the Link
Provider Agency &
Staff Goals
HUD & CCoC Goals
Consumer Goals
Question….
Name the things that concern staff about using data to measure
performance.
What are the benefits?
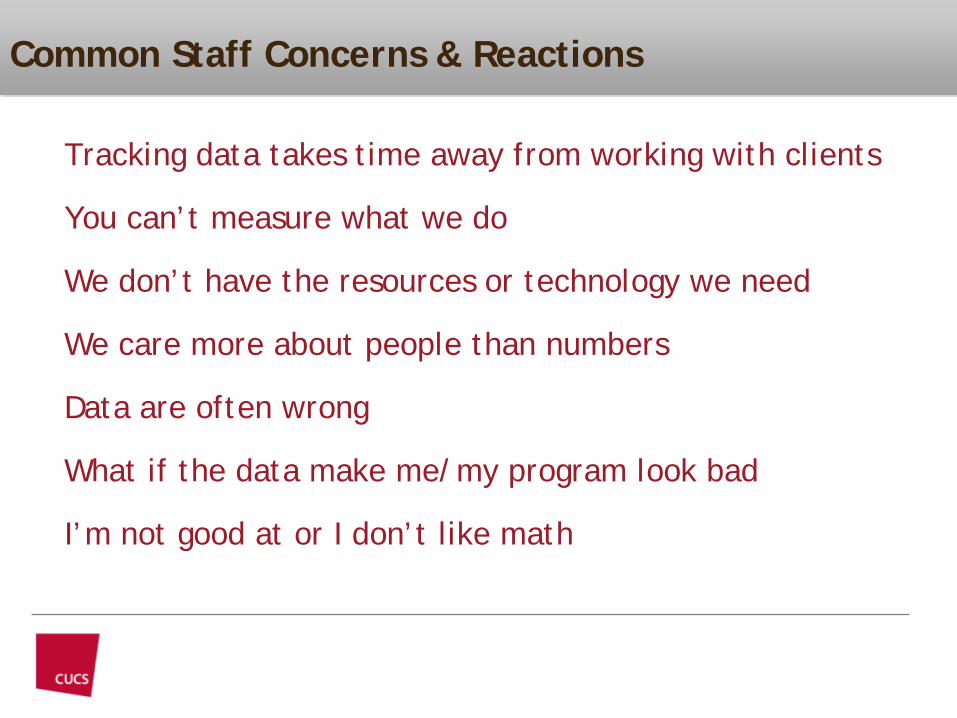
Common Staff Concerns & Reactions
• Tracking data takes time away from working with clients
• You can’t measure what we do
• We don’t have the resources or technology we need
• We care more about people than numbers
• Data are often wrong
• What if the data make me/my program look bad
• I’m not good at or I don’t like math
29
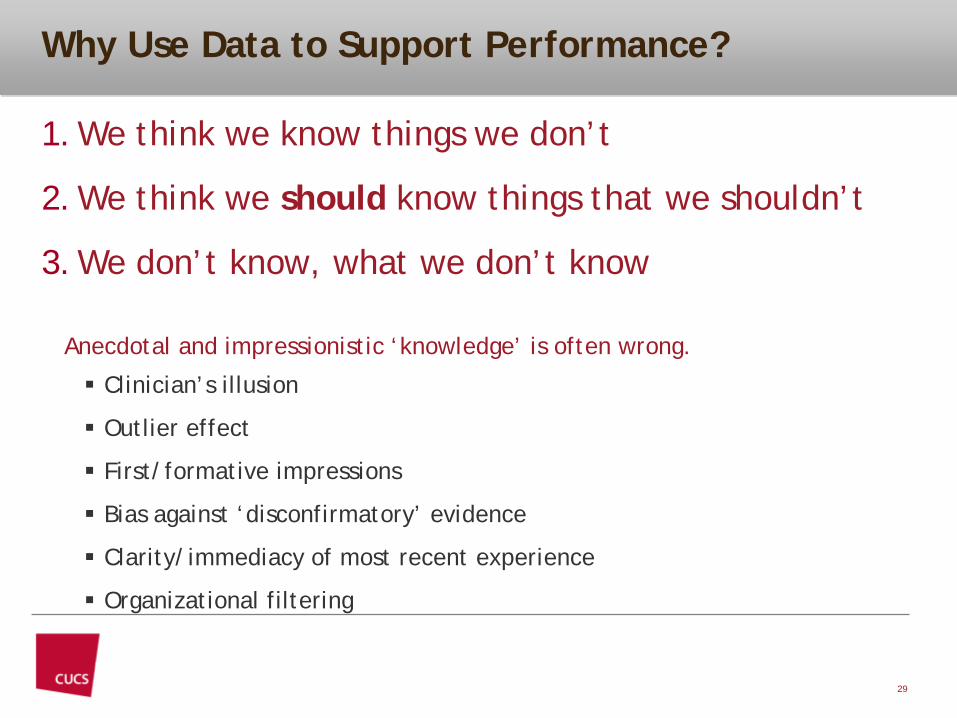
Why Use Data to Support Performance?
1.We think we know things we don’t
2.We think we should know things that we shouldn’t
3.We don’t know, what we don’t know
• Anecdotal and impressionistic ‘knowledge’ is often wrong.
Clinician’s illusion
Outlier effect
First/formative impressions
Bias against ‘disconfirmatory’ evidence
Clarity/immediacy of most recent experience
Organizational filtering
30
What is Performance Management?
Performance Management is NOT about ….
1. Forms needed in triplicate
2. Spreadsheets no one looks at
3. Useless reports that are out of date before they are printed
4. Targets set by people removed from the action
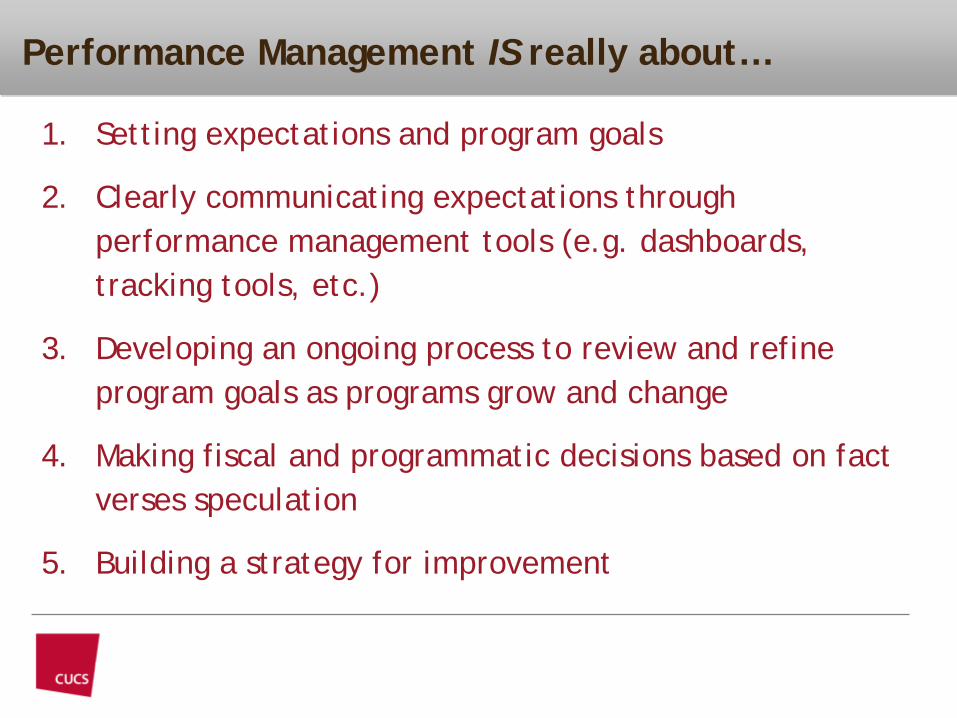
Performance Management IS really about…
1. Setting expectations and program goals
2. Clearly communicating expectations through performance management tools (e.g. dashboards, tracking tools, etc.)
3. Developing an ongoing process to review and refine program goals as programs grow and change
4. Making fiscal and programmatic decisions based on fact verses speculation
5. Building a strategy for improvement
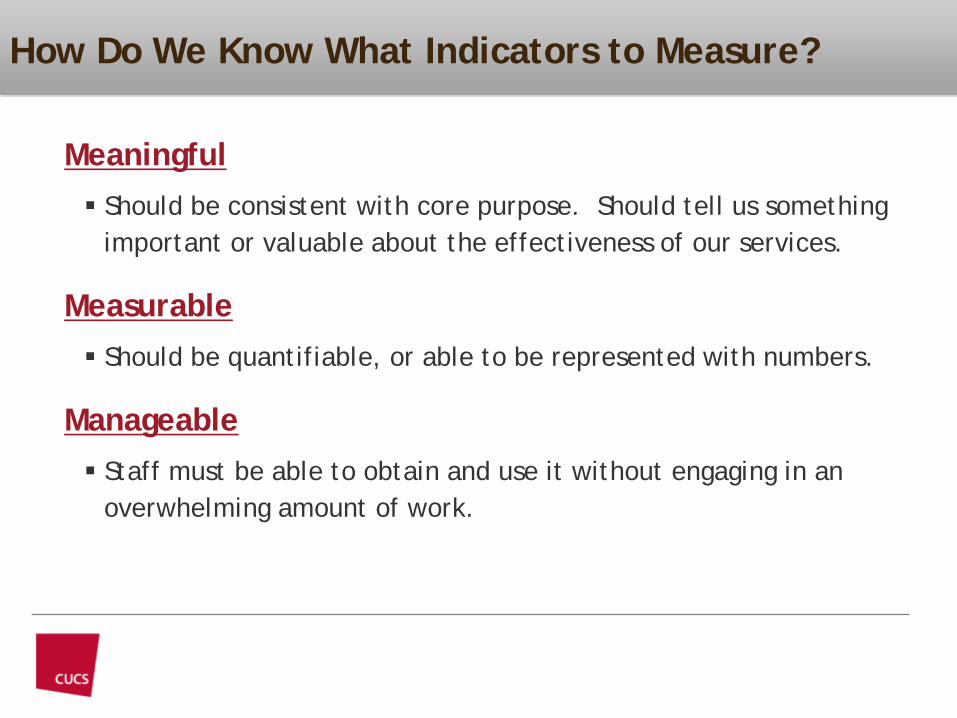
How Do We Know What Indicators to Measure?
• Meaningful Should be consistent with core purpose. Should tell us something
important or valuable about the effectiveness of our services.
• Measurable Should be quantifiable, or able to be represented with numbers.
• Manageable Staff must be able to obtain and use it without engaging in an
overwhelming amount of work.
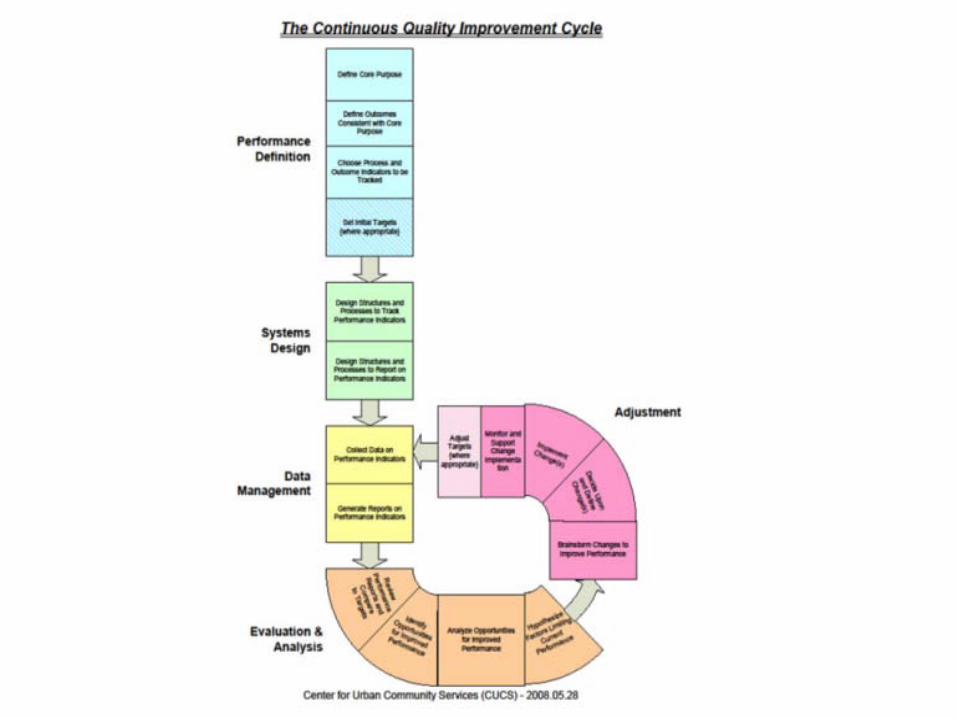
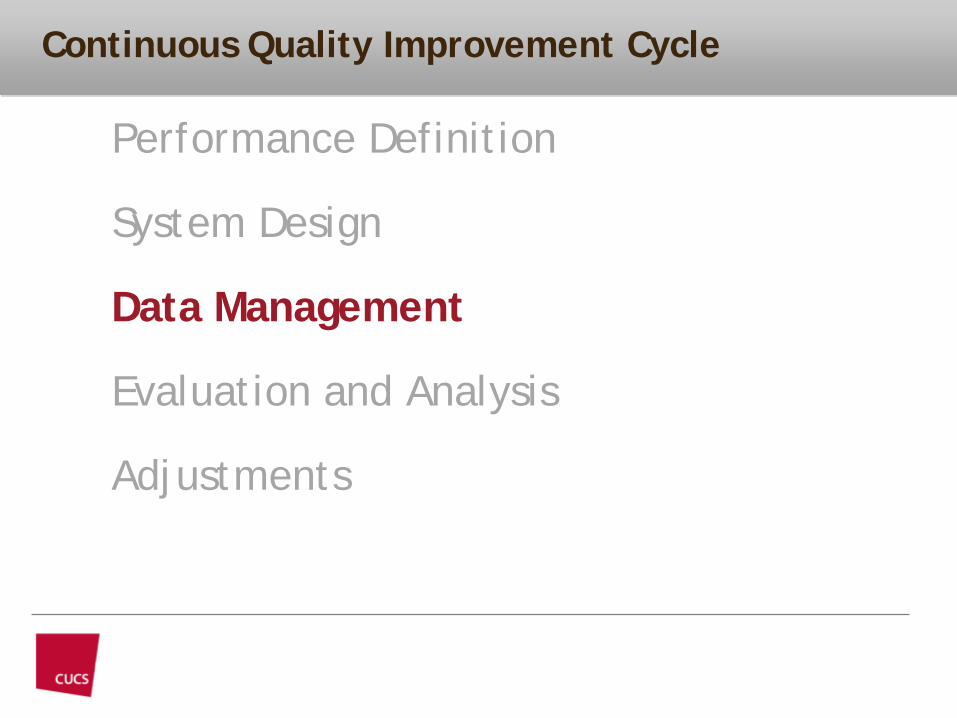
Continuous Quality Improvement Cycle
1. Performance Definition
2. System Design
3. Data Management
4. Evaluation and Analysis
5. Adjustments
Performance Definition: Other Factors to Consider in Choosing Indicators
Always select at least one outcome indicator for each defined outcome: Outcome indicators are the ultimate measure of program performance
Process indicators should be tracked, as well, when: The outcome isn’t immediately measurable and you need an
immediate way to track progress and make course corrections.
They are known predictors of outcomes and will be useful in figuring out what is going right or needs to be adjusted.
Performance Definition: Outcome Indicator
Core purpose: to permanently house homeless people
Performance targets:
HUD: At least 65% of all exits from Transitional Housing programs must move into Permanent Housing
Program specific: Place at least x people into permanent housing each month.
Performance Definition: Process Indicators
Core purpose: to support program goal of exits into permanent housing
Process indicators used in monitoring progress: Identification Documents
Current Medications
Active Benefits
Housing Documents
Current Psycho-Social
Psych Evaluation
Status Letters
PSH Application
Continuous Quality Improvement Cycle
1. Performance Definition
2. System Design
3. Data Management
4. Evaluation and Analysis
5. Adjustments
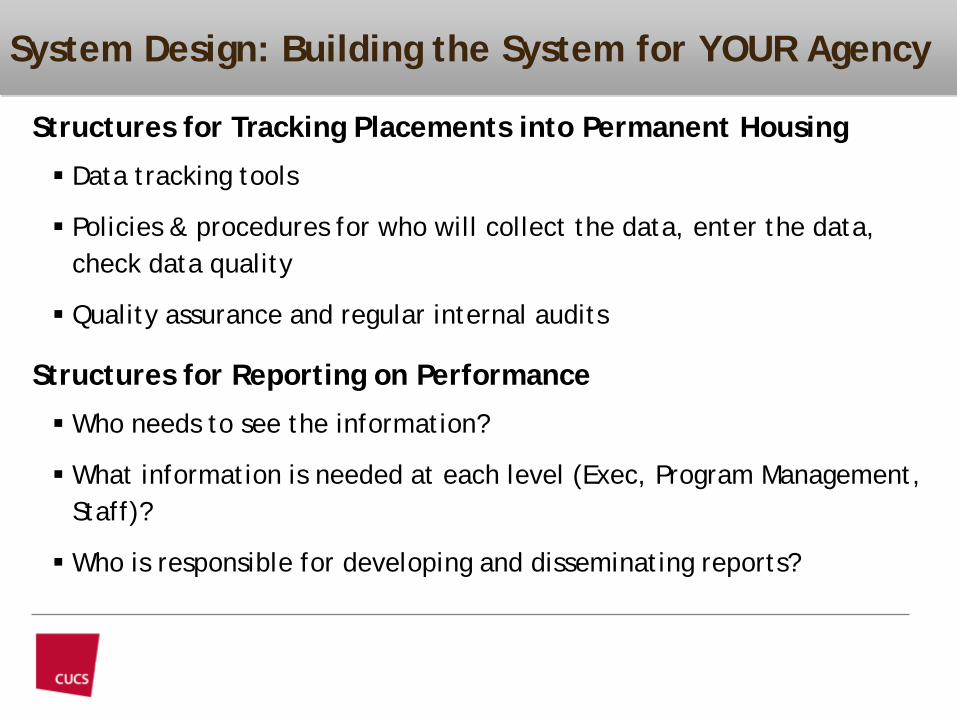
System Design: Building the System for YOUR Agency
• Structures for Tracking Placements into Permanent Housing
Data tracking tools
Policies & procedures for who will collect the data, enter the data, check data quality
Quality assurance and regular internal audits
• Structures for Reporting on Performance
Who needs to see the information?
What information is needed at each level (Exec, Program Management, Staff)?
Who is responsible for developing and disseminating reports?
System Design: Client Level Process Indicators
•Please take out
•Caseload Tracking Form, Sorted by Worker
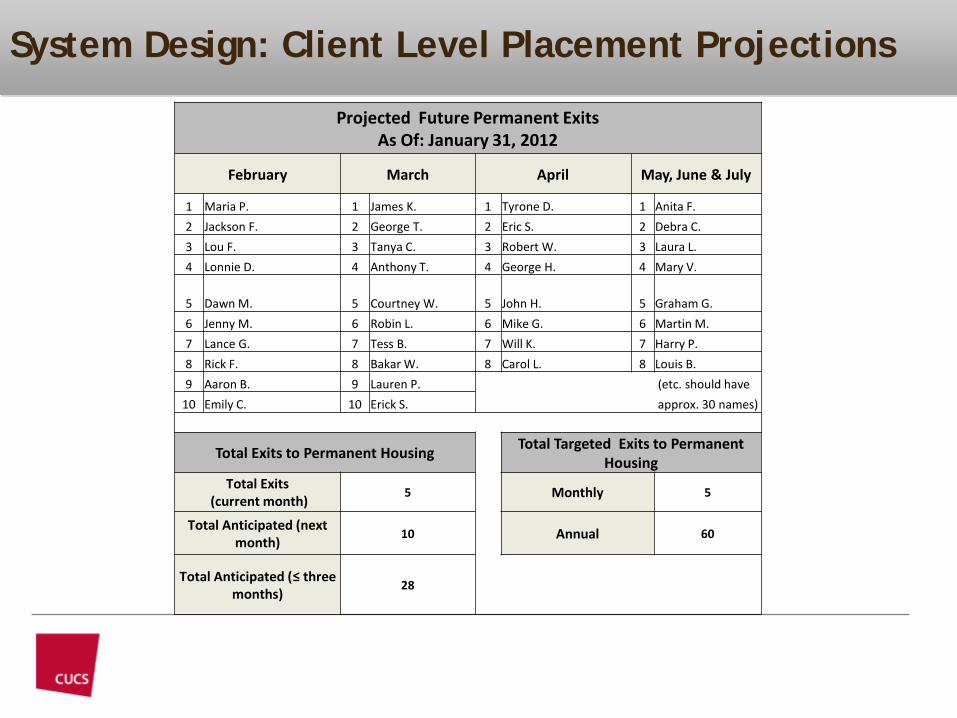
System Design: Client Level Placement Projections
Projected Future Permanent ExitsAs Of: January 31, 2012
February March April May, June & July
1 Maria P. 1 James K. 1 Tyrone D. 1 Anita F.2 Jackson F. 2 George T. 2 Eric S. 2 Debra C.3 Lou F. 3 Tanya C. 3 Robert W. 3 Laura L.4 Lonnie D. 4 Anthony T. 4 George H. 4 Mary V.
5 Dawn M. 5 Courtney W. 5 John H. 5 Graham G.6 Jenny M. 6 Robin L. 6 Mike G. 6 Martin M.7 Lance G. 7 Tess B. 7 Will K. 7 Harry P.8 Rick F. 8 Bakar W. 8 Carol L. 8 Louis B.9 Aaron B. 9 Lauren P. (etc. should have
10 Emily C. 10 Erick S. approx. 30 names)
Total Exits to Permanent Housing Total Targeted Exits to Permanent Housing
Total Exits(current month) 5 Monthly 5
Total Anticipated (next month) 10 Annual 60
Total Anticipated (≤ three months) 28
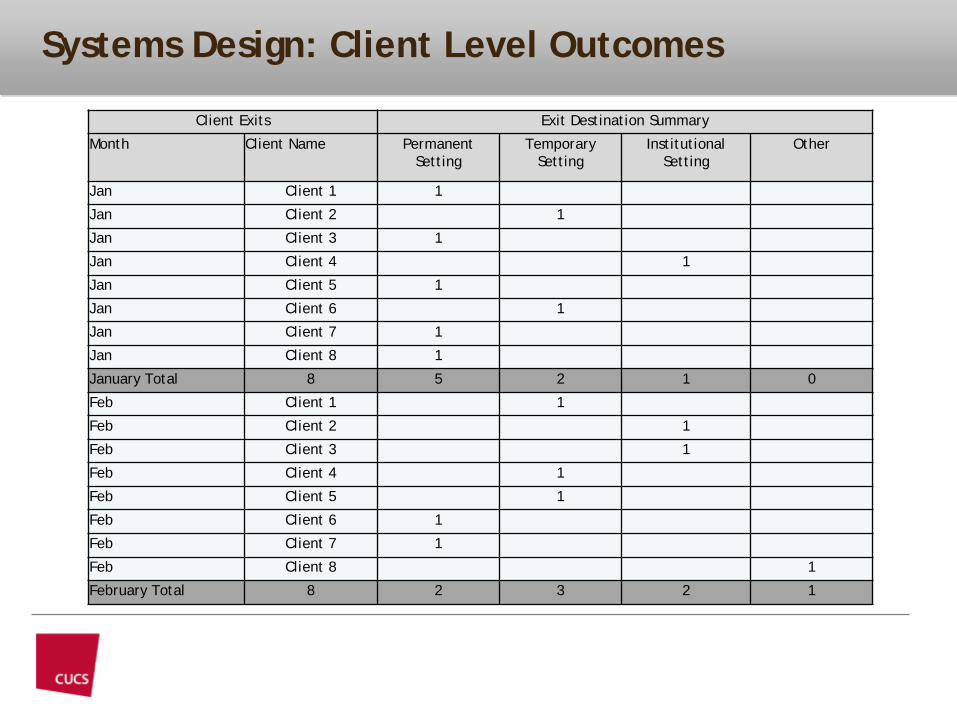
Systems Design: Client Level Outcomes
Client Exits Exit Destination Summary
Month Client Name PermanentSetting
Temporary Setting
Institutional Setting
Other
Jan Client 1 1
Jan Client 2 1
Jan Client 3 1
Jan Client 4 1
Jan Client 5 1
Jan Client 6 1
Jan Client 7 1
Jan Client 8 1
January Total 8 5 2 1 0
Feb Client 1 1
Feb Client 2 1
Feb Client 3 1
Feb Client 4 1
Feb Client 5 1
Feb Client 6 1
Feb Client 7 1
Feb Client 8 1
February Total 8 2 3 2 1
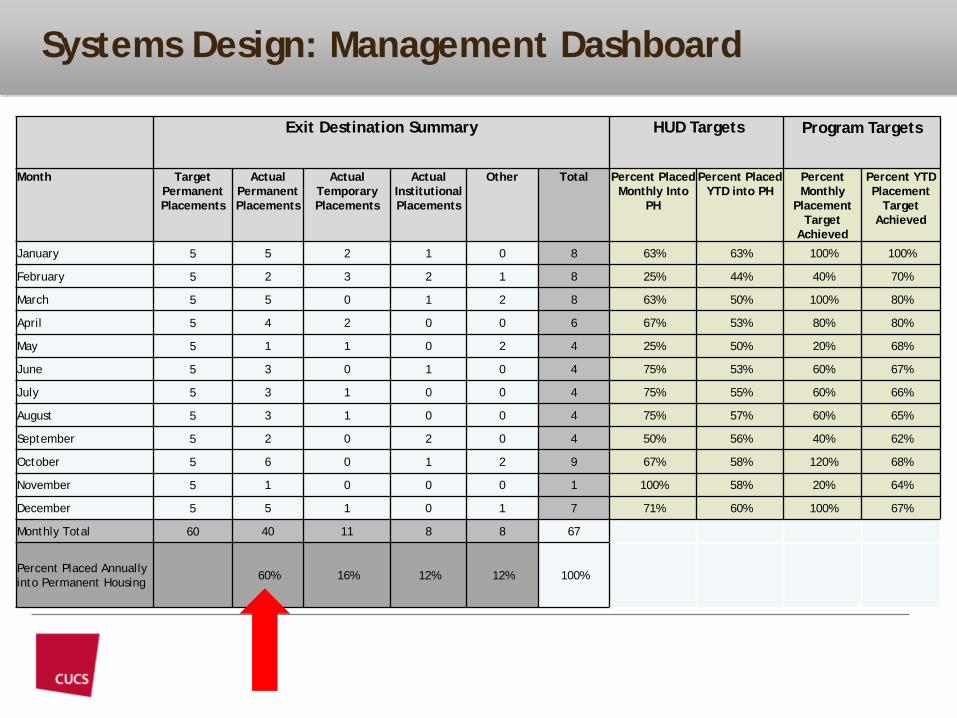
Systems Design: Management Dashboard
Exit Destination Summary HUD Targets Program Targets
Month TargetPermanent Placements
ActualPermanent Placements
ActualTemporary Placements
ActualInstitutional Placements
Other Total Percent Placed Monthly Into
PH
Percent Placed YTD into PH
Percent Monthly
Placement Target
Achieved
Percent YTD Placement
Target Achieved
January 5 5 2 1 0 8 63% 63% 100% 100%
February 5 2 3 2 1 8 25% 44% 40% 70%
March 5 5 0 1 2 8 63% 50% 100% 80%
April 5 4 2 0 0 6 67% 53% 80% 80%
May 5 1 1 0 2 4 25% 50% 20% 68%
June 5 3 0 1 0 4 75% 53% 60% 67%
July 5 3 1 0 0 4 75% 55% 60% 66%
August 5 3 1 0 0 4 75% 57% 60% 65%
September 5 2 0 2 0 4 50% 56% 40% 62%
October 5 6 0 1 2 9 67% 58% 120% 68%
November 5 1 0 0 0 1 100% 58% 20% 64%
December 5 5 1 0 1 7 71% 60% 100% 67%
Monthly Total 60 40 11 8 8 67
Percent Placed Annually into Permanent Housing 60% 16% 12% 12% 100%
Continuous Quality Improvement Cycle
1. Performance Definition
2. System Design
3. Data Management
4. Evaluation and Analysis
5. Adjustments
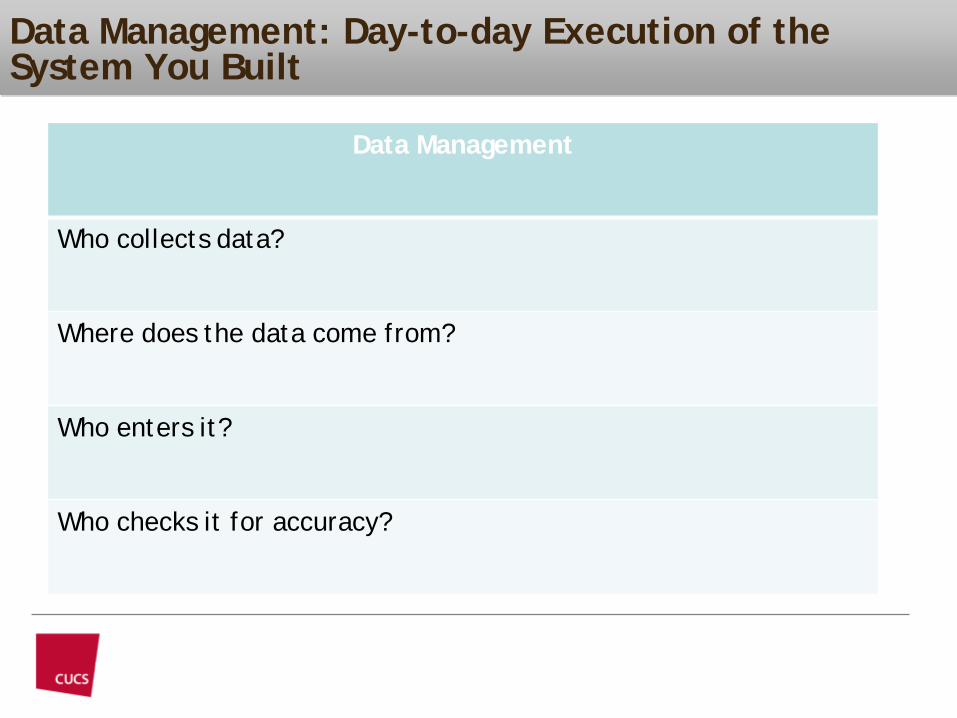
Data Management: Day-to-day Execution of the System You Built
Data Management
Who collects data?
Where does the data come from?
Who enters it?
Who checks it for accuracy?
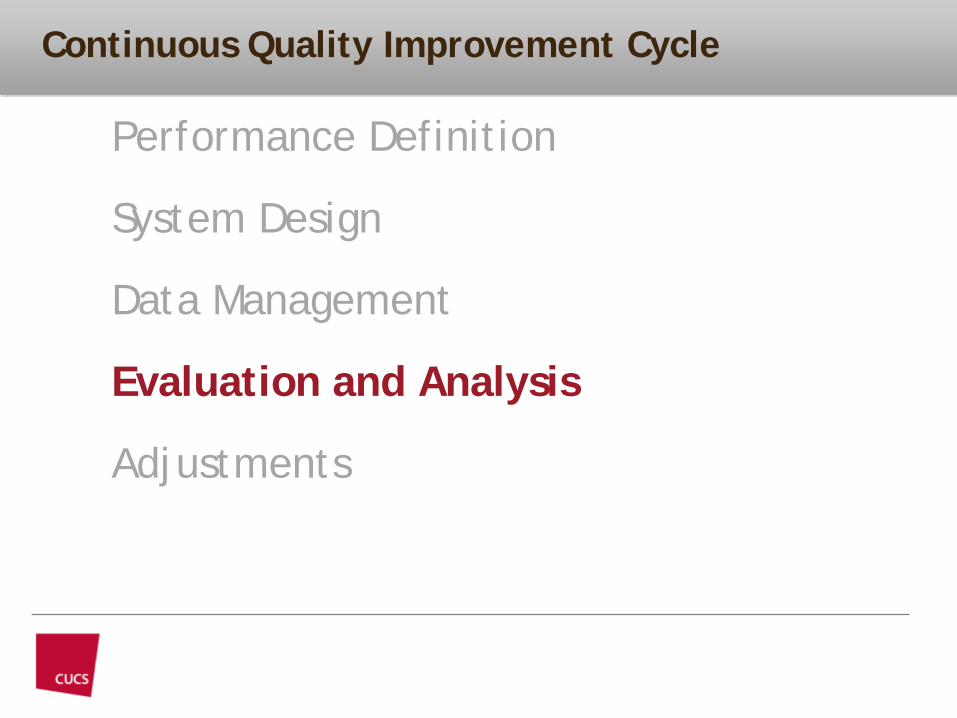
Continuous Quality Improvement Cycle
1. Performance Definition
2. System Design
3. Data Management
4. Evaluation and Analysis
5. Adjustments
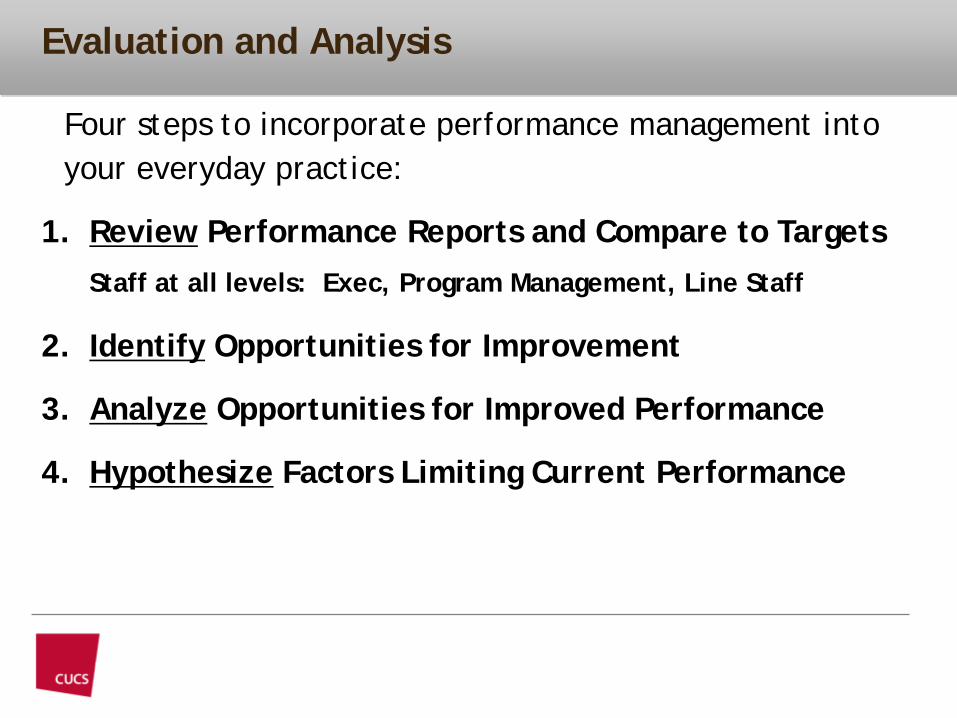
Evaluation and Analysis
• Four steps to incorporate performance management into your everyday practice:
1. Review Performance Reports and Compare to TargetsStaff at all levels: Exec, Program Management, Line Staff
2. Identify Opportunities for Improvement
3. Analyze Opportunities for Improved Performance
4. Hypothesize Factors Limiting Current Performance
Continuous Quality Improvement Cycle
1. Performance Definition
2. System Design
3. Data Management
4. Evaluation and Analysis
5. Adjustments
Adjustments
• It’s not a useless report if you use it!
Brainstorm as many ideas as possible with your team about how to change factors to improve performance
Decide which things are most likely to be manageable and effective
Implement change
Adjustments
• It’s not a useless report if you use it!
Monitor how the changes are impacting performance
Adjust practice to keep making progress.
Adjust targets when you are unable to generate change proposals that can improve performance sufficiently or you are meeting or exceeding the target and you think you can do even better!
Celebrate success!

52
Technology
Technology & Training
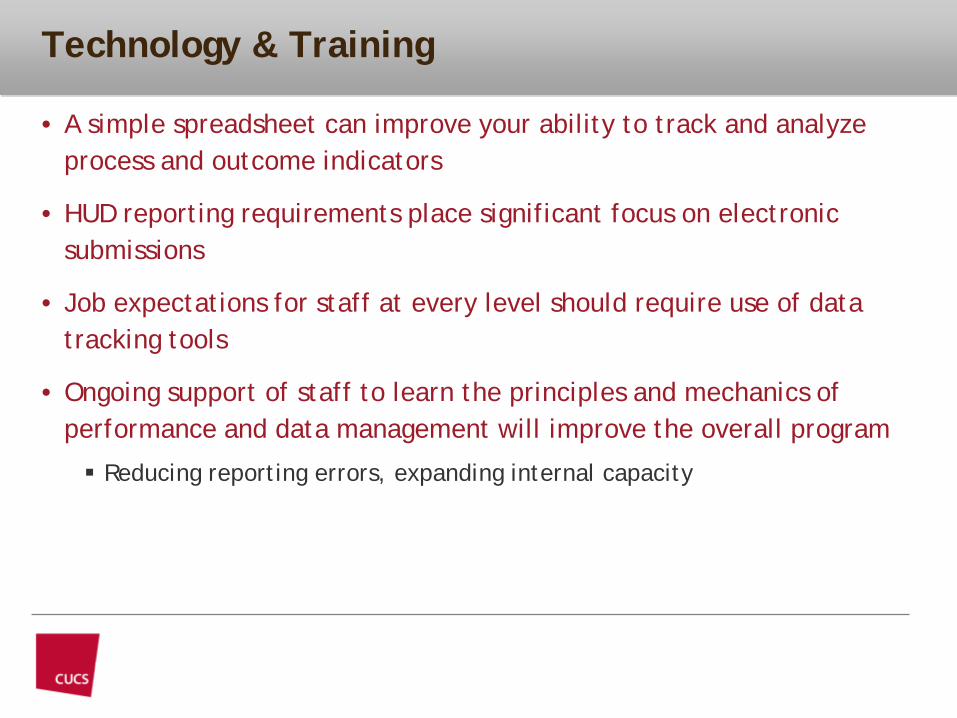
• A simple spreadsheet can improve your ability to track and analyze process and outcome indicators
• HUD reporting requirements place significant focus on electronic submissions
• Job expectations for staff at every level should require use of data tracking tools
• Ongoing support of staff to learn the principles and mechanics of performance and data management will improve the overall program
Reducing reporting errors, expanding internal capacity

54
Shifting Culture
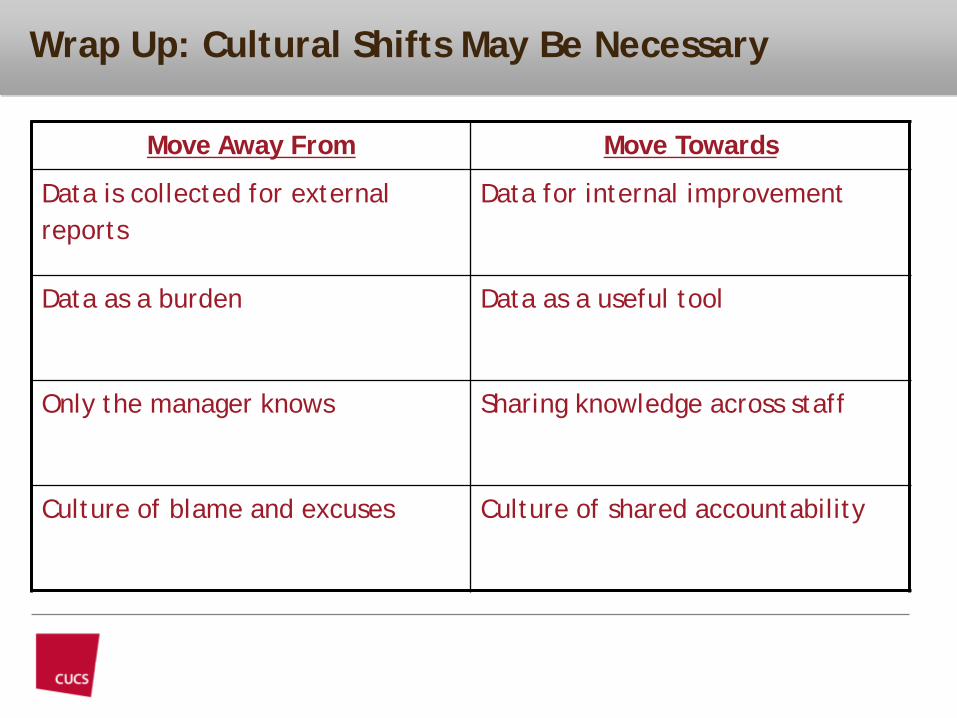
Move Away From Move Towards
Data is collected for external reports
Data for internal improvement
Data as a burden Data as a useful tool
Only the manager knows Sharing knowledge across staff
Culture of blame and excuses Culture of shared accountability
Wrap Up: Cultural Shifts May Be Necessary
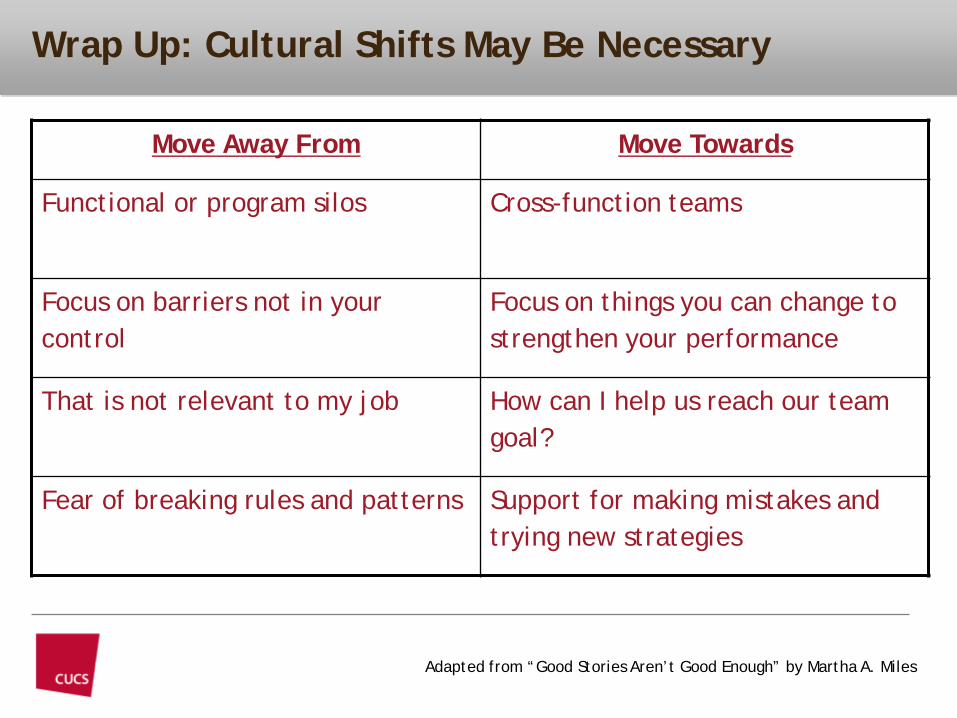
Wrap Up: Cultural Shifts May Be Necessary
Move Away From Move Towards
Functional or program silos Cross-function teams
Focus on barriers not in your control
Focus on things you can change to strengthen your performance
That is not relevant to my job How can I help us reach our team goal?
Fear of breaking rules and patterns Support for making mistakes and trying new strategies
Adapted from “Good Stories Aren’t Good Enough” by Martha A. Miles

57
Wrap Up
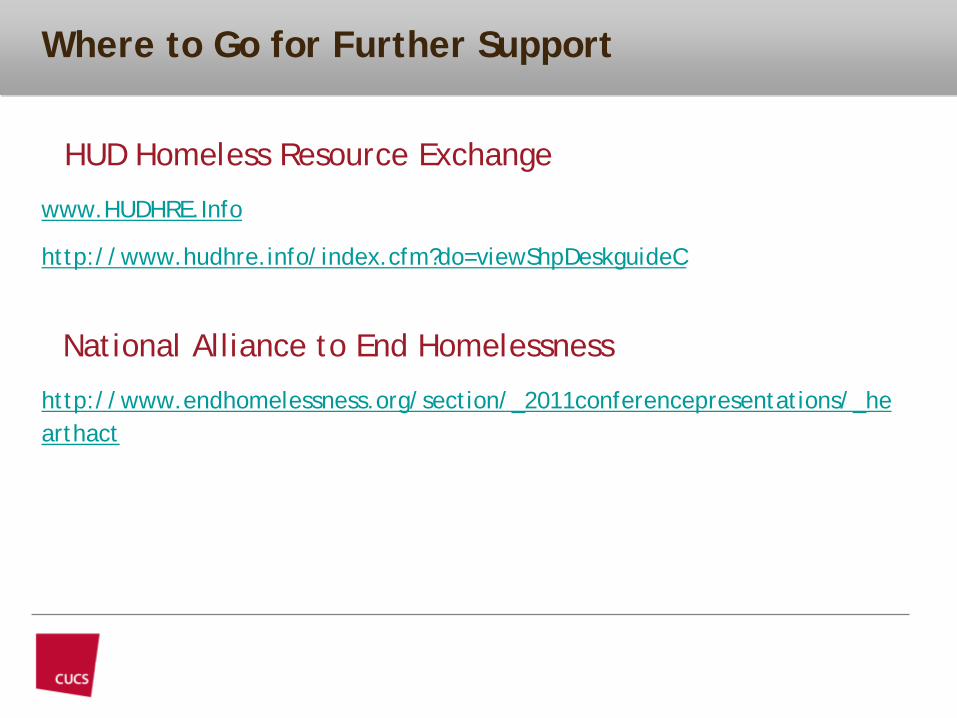
Where to Go for Further Support
• HUD Homeless Resource Exchange
www.HUDHRE.Info
http://www.hudhre.info/index.cfm?do=viewShpDeskguideC
National Alliance to End Homelessness
http://www.endhomelessness.org/section/_2011conferencepresentations/_hearthact
•
•
Follow Up Consultation
• Application Deadline for Consultation Services
February 24th
General Eligibility Criteria
The program applying for technical assistance is a Transitional Housing Program provider.
The program applying for technical assistance receives SHP funds through the NYC Coalition on the Continuum of Care.
The program applying for technical assistance has experienced consistent low performance in the last two reporting years (i.e., <65% placement to PH in FY10 and FY11).
A senior staff member (e.g. program director or similar) has attended the half day training on Continuous Quality Improvement (CQI) provided by CUCS on either February 10th or 14th.
Thank You!
• For further information regarding materials discussed in the training please contact:
• Martha Kenton, Senior Consultant
• (212) 801-3363 or [email protected]