
Ensuring Success for Every Student Facilitating academic success for all through rigorous,...
21
Ensuring Success for Every Student Facilitating academic success for all through rigorous, individual achievement growth targeting
-
Upload
warren-gardner -
Category
Documents
-
view
215 -
download
1
Transcript of Ensuring Success for Every Student Facilitating academic success for all through rigorous,...

Ensuring Success for Every StudentFacilitating academic success for all through rigorous, individual achievement growth targeting

To ensure a student-focused learning environment where every student succeeds.
District 219 Mission
DISTRICT 219 PHILOSOPHY
D219 GROWTH MODEL
ALIG
NE
D
Facilitating academic success for all through rigorous, individual achievement growth targeting
Philosophy
Facilitating academic success for all through rigorous, individual achievement growth targeting
The new growth model is a manifestation of the District 219 philosophy by:
Monitoring the achievement growth of every student
Setting realistic, but rigorous individual targets
Ensuring all students have equitable access to instruction within the curriculum

Current D219 EPAS Program
EXPLORE
(for course placement)
GRADE 8
PLAN
SPRING GRADE 9
Practice ACT
SPRING GRADE 10
ACT/PSAE
SPRING GRADE 11
Facilitating academic success for all through rigorous, individual achievement growth targeting
D219 Growth Model
The new growth model is based on EPAS data, and is consistent with District 219 philosophy by tracking student growth reliably and sensitively for each student. The D219 growth model:
Is anchored to local norms
Benchmarks individual student growth against typical growth of similar District 219 students
Identifies students at risk for failing to meet state and college readiness standards
Facilitating academic success for all through rigorous, individual achievement growth targeting

Local NormsIn addition benchmarking growth against state, national and college readiness benchmarks, the growth model benchmarks individual and aggregate growth against local norms.
Eliminate known limitations of the EPAS system for measuring growth
Reliably identify students at risk for not being on track to meet or exceed state standards
Capture individual and aggregate value-added growth
Facilitating academic success for all through rigorous, individual achievement growth targeting
Local norms provide the following benefits:
Provide more meaningful growth benchmarks

Local Norms
Facilitating academic success for all through rigorous, individual achievement growth targeting
Example: English
CRL = College Readiness Level10
15
20
25
30
35
GR 8 EXPLOREENGLISH
GR 9 PLANENGLISH
GR 10 IACTENGLISH
GR 11 ACTENGLISH
ME
AN
SC
OR
E
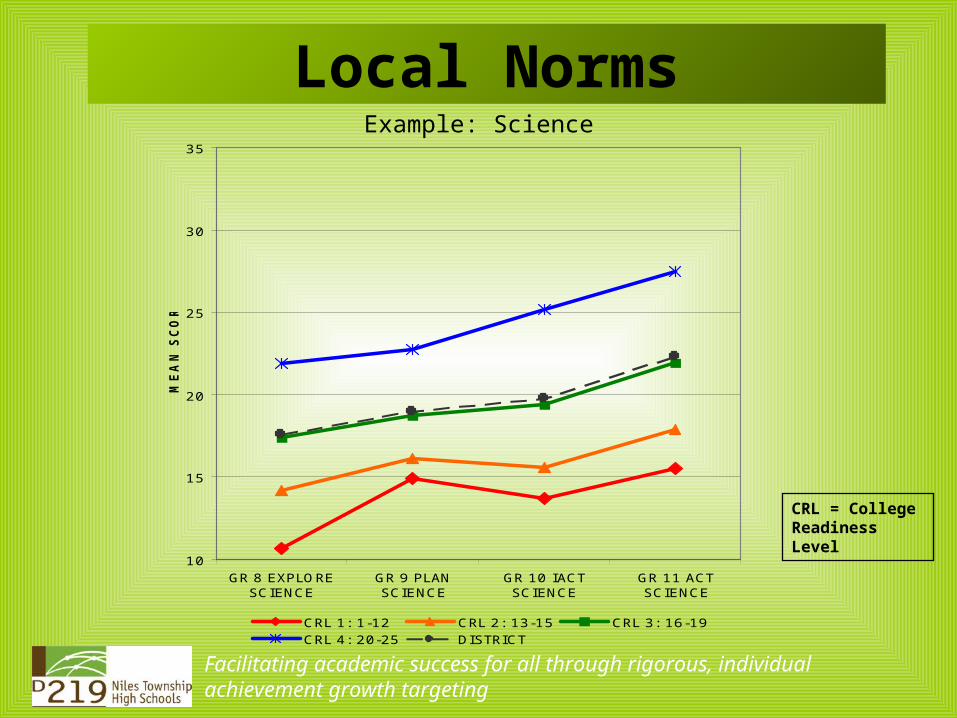
CRL 1: 1-12 CRL 2: 13-15 CRL 3: 16-19
CRL 4: 20-25 DISTRICT

Local Norms
Facilitating academic success for all through rigorous, individual achievement growth targeting
Example: Mathematics
CRL = College Readiness Level
10
15
20
25
30
35
GR 8 EXPLOREMATH
GR 9 PLAN MATH GR 10 IACT MATH GR 11 ACT MATH
ME
AN
SC
OR
E
CRL 1: 1-12 CRL 2: 13-15 CRL 3: 16-19CRL 4: 20-25 DISTRICT

Local Norms
Facilitating academic success for all through rigorous, individual achievement growth targeting
Example: Reading
CRL = College Readiness Level
10
15
20
25
30
35
GR 8 EXPLOREREADING
GR 9 PLANREADING
GR 10 IACTREADING
GR 11 ACTREADING
ME
AN
SC
OR
E
CRL 1: 1-12 CRL 2: 13-15 CRL 3: 16-19CRL 4: 20-25 DISTRICT
Local Norms
Facilitating academic success for all through rigorous, individual achievement growth targeting
Example: Science
CRL = College Readiness Level
10
15
20
25
30
35
GR 8 EXPLORESCIENCE
GR 9 PLANSCIENCE
GR 10 IACTSCIENCE
GR 11 ACTSCIENCE
ME
AN
SC
OR
E
CRL 1: 1-12 CRL 2: 13-15 CRL 3: 16-19CRL 4: 20-25 DISTRICT

Local Prediction ModelsPROBABILITY OF
MEETING OR EXEEDING STANDARDS ON
PSAE READINGBASED ON
EXPLORE PLAN IACTSCORE Reading Reading Reading
36 99%35 99%34 99%33 99%32 99% 99%31 99% 99%30 99% 99%29 99% 99%28 99% 98%27 99% 97%26 99% 96%25 99% 99% 95%24 99% 98% 94%23 99% 97% 91%22 99% 96% 88%21 99% 94% 85%20 99% 91% 80%19 98% 87% 74%18 96% 81% 68%17 92% 74% 61%16 87% 65% 53%15 78% 55% 45%14 66% 45% 37%13 51% 35% 30%12 36% 26% 24%11 23% 19% 18%10 14% 13% 14%9 8% 9% 11%8 5% 6% 8%7 3% 4% 6%6 1% 3% 4%5 1% 2% 3%4 1% 1% 2%3 1% 1% 2%2 1% 1% 1%1 1% 1% 1%
CRB 15 17 (21)PSAE ME 13 15 16
Established growth profiles were also used to develop local prediction models that reliably identify students who are not on track to pass the PSAE*. The model:
Estimates the probability of meeting or exceeding state standards for each test and each content area
For example, a student with an EXPLORE reading score of 13 has a 51% chance of passing the PSAE
* Predictions apply IF District 219 continues to have the same impact and does not make changes to increase growth

Predicting District Performance
Facilitating academic success for all through rigorous, individual achievement growth targeting
PSAE Content Area
*Projected % to Meet or ExceedPSAE 2010
Class of 2011
Reading 63%
Mathematics 55%
Science 68%
* Predictions apply IF District 219 continues to have the same impact and does not make changes to increase growth.

Value-Added Education
If the District 219 Instructional Program is improving, students should outperform the projections.
How are we going to do that?
One student at a time by:
Setting realistic, but rigorous individual student targets for every single student.
Ensuring students have access to the most important components of the curriculum through appropriate course placement.
Improving the effectiveness of all programs.
Facilitating academic success for all through rigorous, individual achievement growth targeting

Setting Individual Targets
Facilitating academic success for all through rigorous, individual achievement growth targeting
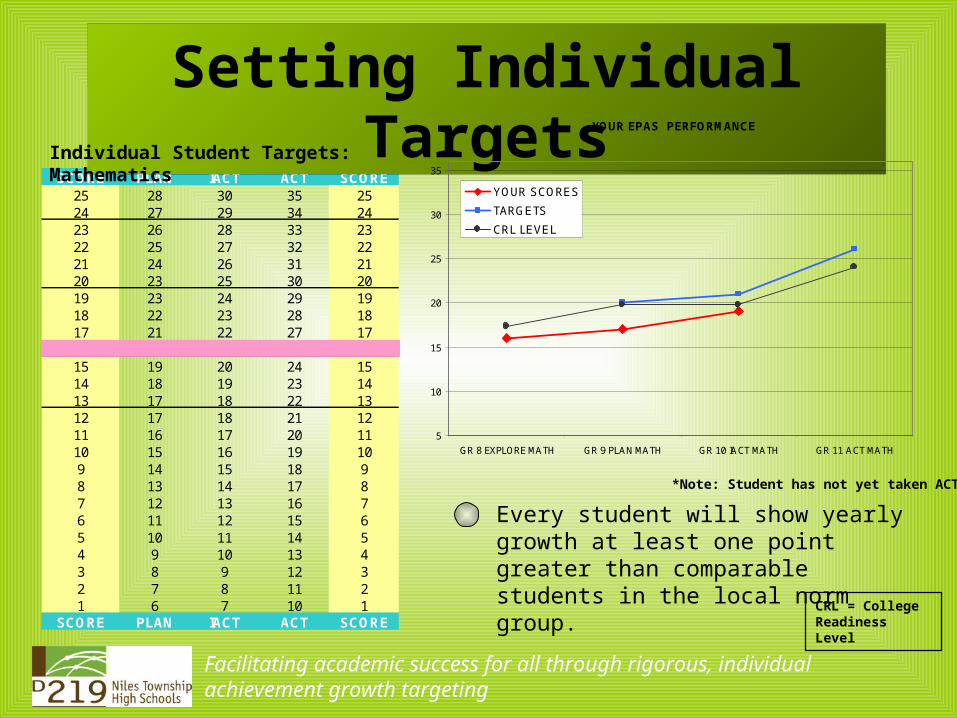
Every student will show yearly growth at least one point greater than comparable students in the local norm group.
Individual Student Targets: English
SCORE PLAN IACT ACT SCORE25 27 29 36 2524 26 28 35 2423 25 27 34 2322 24 26 33 2221 23 25 32 2120 22 24 31 2019 22 23 30 1918 21 22 29 1817 20 21 28 1716 19 20 27 1615 18 18 25 1514 17 17 24 1413 16 16 23 1312 15 15 21 1211 14 14 20 1110 13 13 19 109 12 12 18 98 11 11 17 87 10 10 16 76 9 9 15 65 8 8 14 54 7 7 13 43 6 6 12 32 5 5 11 21 4 4 10 1
SCORE PLAN IACT ACT SCORE CRL = College Readiness Level
YOUR EPAS PERFORMANCE
5
10
15
20
25
30
35
GR 8 EXPLORE ENGLISH GR 9 PLAN ENGLISH GR 10 IACT ENGLISH GR 11 ACT ENGLISH
YOUR SCORES
TARGETS
CRL LEVEL
SCORE PLAN IACT ACT SCORE25 28 30 35 2524 27 29 34 2423 26 28 33 2322 25 27 32 2221 24 26 31 2120 23 25 30 2019 23 24 29 1918 22 23 28 1817 21 22 27 1716 20 21 26 1615 19 20 24 1514 18 19 23 1413 17 18 22 1312 17 18 21 1211 16 17 20 1110 15 16 19 109 14 15 18 98 13 14 17 87 12 13 16 76 11 12 15 65 10 11 14 54 9 10 13 43 8 9 12 32 7 8 11 21 6 7 10 1
SCORE PLAN IACT ACT SCORE
Setting Individual Targets
Facilitating academic success for all through rigorous, individual achievement growth targeting
Every student will show yearly growth at least one point greater than comparable students in the local norm group.
Individual Student Targets: Mathematics
CRL = College Readiness Level
*Note: Student has not yet taken ACT
YOUR EPAS PERFORMANCE
5
10
15
20
25
30
35
GR 8 EXPLORE MATH GR 9 PLAN MATH GR 10 IACT MATH GR 11 ACT MATH
YOUR SCORES
TARGETS
CRL LEVEL

SCORE PLAN IACT ACT SCORE25 28 30 35 2524 27 29 34 2423 26 28 33 2322 25 27 32 2221 24 26 31 2120 23 25 30 2019 23 24 29 1918 22 23 28 1817 21 22 27 1716 20 21 26 1615 19 20 24 1514 18 19 23 1413 17 18 22 1312 17 18 21 1211 16 17 20 1110 15 16 19 109 14 15 18 98 13 14 17 87 12 13 16 76 11 12 15 65 10 11 14 54 9 10 13 43 8 9 12 32 7 8 11 21 6 7 10 1
SCORE PLAN IACT ACT SCORE
Setting Individual Targets
Facilitating academic success for all through rigorous, individual achievement growth targeting
Every student will show yearly growth at least one point greater than comparable students in the local norm group.
Individual Student Targets: Reading
CRL = College Readiness Level
YOUR EPAS PERFORMANCE
5
10
15
20
25
30
35
GR 8 EXPLORE READING GR 9 PLAN READING GR 10 IACT READING GR 11 ACT READING
YOUR SCORES
TARGETS
CRL LEVEL

Setting Individual Targets
Facilitating academic success for all through rigorous, individual achievement growth targeting
Every student will show yearly growth at least one point greater than comparable students in the local norm group.
Individual Student Targets: Science
SCORE PLAN IACT ACT SCORE25 27 30 34 2524 26 29 33 2423 25 28 32 2322 24 27 31 2221 23 26 30 2120 22 25 29 2019 22 23 27 1918 21 22 26 1817 20 21 25 1716 19 20 24 1615 18 19 23 1514 17 18 22 1413 16 17 21 1312 16 17 20 1211 15 16 19 1110 14 15 18 109 13 14 17 98 12 13 16 87 11 12 15 76 10 11 14 65 9 10 13 54 8 9 12 43 7 8 11 32 6 7 10 21 5 6 9 1
SCORE PLAN IACT ACT SCORE CRL = College Readiness Level
YOUR EPAS PERFORMANCE
5
10
15
20
25
30
35
GR 8 EXPLORE SCIENCE GR 9 PLAN SCIENCE GR 10 IACT SCIENCE GR 11 ACT SCIENCE
YOUR SCORES
TARGETS
CRL LEVEL

District 219 will also be using the models to reliably and analytically recommend eighth-grade students into freshman-year courses.
Course Placement
Rigor will be stressed when considering placement. Students will be placed in the highest-level course that is supported by the data.
Facilitating academic success for all through rigorous, individual achievement growth targeting
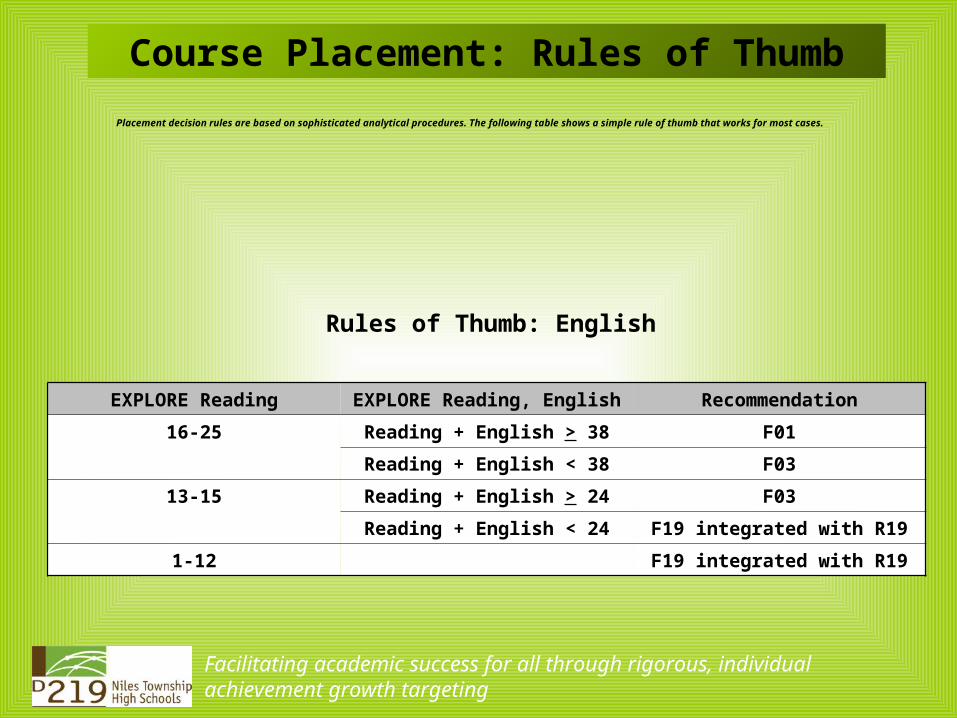
Placement decision rules are based on sophisticated analytical procedures. The following table shows a simple rule of thumb that works for most cases.
Course Placement: Rules of Thumb
Rules of Thumb: English
Facilitating academic success for all through rigorous, individual achievement growth targeting
EXPLORE Reading EXPLORE Reading, English Recommendation
16-25 Reading + English > 38 F01
Reading + English < 38 F03
13-15 Reading + English > 24 F03
Reading + English < 24 F19 integrated with R19
1-12 F19 integrated with R19
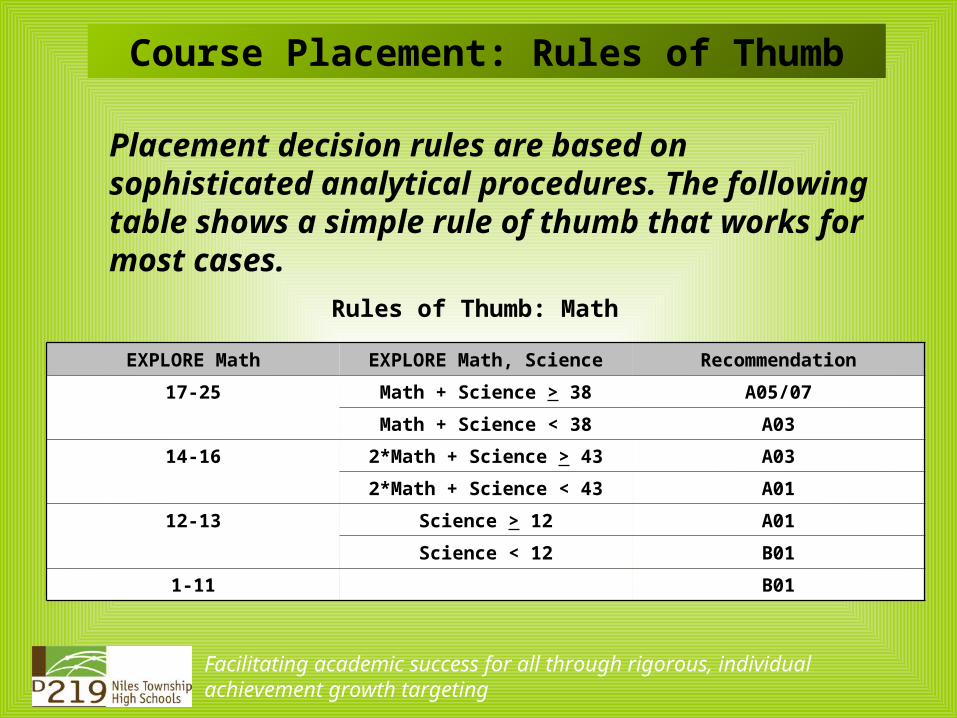
Placement decision rules are based on sophisticated analytical procedures. The following table shows a simple rule of thumb that works for most cases.
Course Placement: Rules of Thumb
Rules of Thumb: Math
Facilitating academic success for all through rigorous, individual achievement growth targeting
EXPLORE Math EXPLORE Math, Science Recommendation
17-25 Math + Science > 38 A05/07
Math + Science < 38 A03
14-16 2*Math + Science > 43 A03
2*Math + Science < 43 A01
12-13 Science > 12 A01
Science < 12 B01
1-11 B01
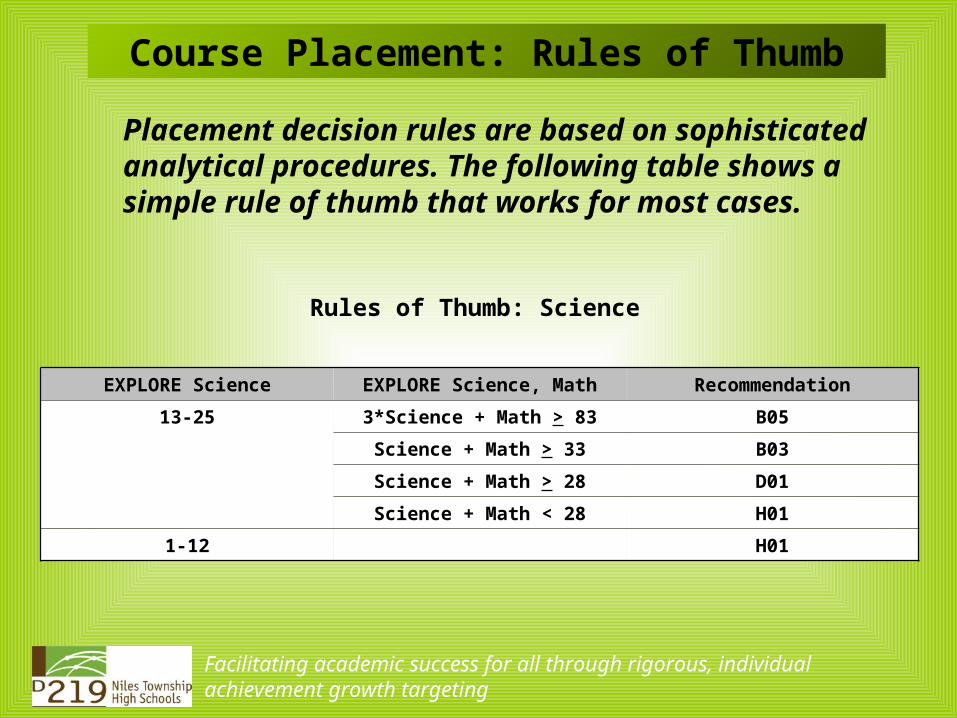
Placement decision rules are based on sophisticated analytical procedures. The following table shows a simple rule of thumb that works for most cases.
Course Placement: Rules of Thumb
Rules of Thumb: Science
Facilitating academic success for all through rigorous, individual achievement growth targeting
EXPLORE Science EXPLORE Science, Math Recommendation
13-25 3*Science + Math > 83 B05
Science + Math > 33 B03
Science + Math > 28 D01
Science + Math < 28 H01
1-12 H01


