
Ensuring Inter-regional Equity and Poverty...
29
1 Ensuring Inter-regional Equity and Poverty Reduction BERT HOFMAN and SUSANA CORDEIRA GUERRA i The World Bank 1. Introduction The decentralization of revenue sources and expenditure responsibilities to subnational levels of government can increase the efficiency of spending, and increase participation in decision making by local constituents. It is also true, however, that decentralization can also result in inequities in service delivery among citizens of the same country depending on where they live. While decentralization need not cause these inequities, devolution of revenue sources combined with disparities in endowments of regions is likely to lead to disparities in fiscal resources at the subnational level. If left by themselves, these disparities could lead either to lower levels of services in fiscally poor regions, and/or lead to higher tax rates for similar levels of government services in those regions. In turn, disparities in service delivery could thwart poverty alleviation efforts, as public services that are usually provided at the subnational level such as primary health and education are critical in empowering the poor. Disparities in the level and quality of these services could therefore eventually perpetuate inequalities in income levels, or at least delay conversion of incomes across regions. Moreover, large fiscal disparities could induce migration to regions that have higher revenues and better services, even though the migrant could have been more productively employed elsewhere. ii Finally, large disparities in public service delivery may cause social unrest in regions that are left behind, and could undermine the sense of unity in a country. Such diversity coupled with increasing disparities across regions may constitute the basis for regional insurrections such as, for example, the Muslim regions of Mindanao in the Philippines and West Papua in Indonesia (Hill, 2000).
Transcript of Ensuring Inter-regional Equity and Poverty...
1
Ensuring Inter-regional Equity and
Poverty Reduction
BERT HOFMAN and SUSANA CORDEIRA GUERRAi The World Bank
1. Introduction
The decentralization of revenue sources and expenditure responsibilities to
subnational levels of government can increase the efficiency of spending, and increase participation in decision making by local constituents. It is also true, however, that decentralization can also result in inequities in service delivery among citizens of the same country depending on where they live. While decentralization need not cause these inequities, devolution of revenue sources combined with disparities in endowments of regions is likely to lead to disparities in fiscal resources at the subnational level. If left by themselves, these disparities could lead either to lower levels of services in fiscally poor regions, and/or lead to higher tax rates for similar levels of government services in those regions. In turn, disparities in service delivery could thwart poverty alleviation efforts, as public services that are usually provided at the subnational level such as primary health and education are critical in empowering the poor. Disparities in the level and quality of these services could therefore eventually perpetuate inequalities in income levels, or at least delay conversion of incomes across regions. Moreover, large fiscal disparities could induce migration to regions that have higher revenues and better services, even though the migrant could have been more productively employed elsewhere.ii Finally, large disparities in public service delivery may cause social unrest in regions that are left behind, and could undermine the sense of unity in a country. Such diversity coupled with increasing disparities across regions may constitute the basis for regional insurrections such as, for example, the Muslim regions of Mindanao in the Philippines and West Papua in Indonesia (Hill, 2000).

Challenges in the Design of Fiscal Equalization and Intergovernmental Transfers
2
Most governments take an interest in the level and distribution of public services provided to their citizens, even in a decentralized system. For some, this is reason enough not to decentralize the financing or the provision of services deemed critical to national goals. Indeed, income redistribution is seen to be primarily a central function because central governments are seen to be better able to manage one of the key instruments for this goal, a progressive income tax.iii Yet, at the same time, services that are likely to affect income distribution or poverty alleviation, or similar national goals are decentralized. Moreover, many governments have entered into commitments on the outcomes of services that are routinely at least partially decentralized to subnational levels of government.iv So they should be concerned about the level and distribution of fiscal resources among levels of governments, as those resources enable subnational governments to deliver services.
Even if governments care about the distribution of services, they may not take
policy action to correct the distribution of fiscal resources among subnational governments—or horizontal fiscal imbalances. This could occur for two reasons. First, policymakers may count on market adjustments. Thus, for some countries migration is considered to be countervailing equalizing force, driving people to the constituency that delivers the most beneficial level of public services at tax rates deemed appropriate by the constituents. Second, there are legitimate policy tradeoffs that need to be weighed: an aggressive transfer policy may be seen to dampen needed incentive for increasing own-revenue mobilization by sub-national governments—a short-term trade-off that de-emphasizes equalization in order to provide for an own-revenue foundation for a future of reduced fiscal disparities and transfer dependency.v Similarly, an equalization-only policy (perhaps only in the early stages of decentralization) may compete with broader considerations of efficiency and/or growth that are on the nation’s agenda. In China, for instance, the coastal development strategy of the 1980s and 1990s deliberately left more resources in the regions with stronger growth prospects.
Using panel data covering the 1985 to 1998 period of fiscal decentralization in
China, Qiao et al find that inequality in the distribution of fiscal resources across provinces was positively related to higher economic growth, and higher growth led in turn to increased inequality (Qiao et al, 2002). Likewise, Yan also finds a similar tradeoff between growth and equity in China, and further shows that the fiscal reforms, in 1985 and 1994 respectively, did not contribute towards increased equalization (Yan, processed).
In other countries governments compensate for horizontal fiscal imbalances not
through redistribution, but by centrally providing certain services in poor regions, while leaving rich regions to fend for themselves. This approach may indeed be beneficial also from an efficiency point of view, as there is some evidence suggesting that the center is better at some services critical for poverty alleviation, including the targeting of a social safety net (Ravaillion, 1998). Finally, redistribution of fiscal resources may remain limited for political reasons: rich regions also tend to be powerful regions, and taking resources away from them to give to poorer regions may simply be politically unfeasible.

Ensuring Inter-regional Equity and Poverty Reduction
3
Most East Asian governments care about equitable services to its people, and consequently take an interest in issues of the distribution of fiscal resources among subnational governments that deliver much of these services. Countries such as Indonesia have included sub-national fiscal equity as an explicit goal in the constitution.vi
Other countries such as the Philippines or China include strong commitments on equal access to services in their constitution, whereas the delivery of many of these services is devolved to sub-national governments.vii Similarly, international commitments to public service outcomes such as the Millennium Development Goals often relate to services delivered at the subnational level. This would imply that the State should care about whether sub-national governments are capable of delivering such services, and this implies a concern about subnational fiscal capacity and its distribution over subnational entities. In fact, most East Asian countries show they care to some extent by having some form of fiscal equalization mechanism in place.
This paper reviews causes and consequences of fiscal inequities among
subnational governments in East Asia. It shows that endowments and fiscal capacities among subnational entities are large, and these inequities translate into large fiscal inequities before equalization. The transfer systems currently in place in East Asian countries are only mildly equalizing, so that even after equalization the remaining fiscal disparities are still large. The paper discusses the possible consequences for service delivery inputs, outputs, and outcomes of these disparities. It concludes by some guidelines on how to make progress in increasing transparency on inequalities at the sub-national level, and how transfer systems can be made more equalizing without undermining the incentives for local governments to raise their own revenues and to spend their resources efficiently. 2. FISCAL DISPARITIES IN EAST ASIA How large are sub-national disparities?
East Asian countries show a large variety in natural endowments, economic
opportunities, level of development, and poverty (Figure 1). Indeed, the richest province in Indonesia has 17 times the GDP per capita as the poorest one, whereas in China that figure is 11 times, and in Viet Nam 9.5.viii Disparities in income per capita have been relatively stable over time, and little convergence seems to have taken place (Hill 2000, Garcia-Garcia and Soehstianingsih 1998). In such an environment, devolving expenditure responsibilities and revenue sources could lead to undesirable inequities because of disparities in revenue potential among regions as well as disparities in the cost of delivering public services.

Challenges in the Design of Fiscal Equalization and Intergovernmental Transfers
4
Table 1: Disparities in Province-level Revenues Before Grants, per Capita (US$, Latest Available Year) China Indonesia Philippines Thailand Viet Nam Maximum 283.2 59.5 7.57 343.4 Minimum 18.1 3.8 0.21 6.5 Average 55.7 12.1 1.46 36.9 max/min 15.7 15.7 35.43 53.0 Standard deviation 54.8 11.6 1.35 61.1 Coefficient of variation 1.0 1.0 0.92 1.65 Sources: SABER Database, Indonesia Regional Fiscal Information System Note: The table presents consolidated province-level data. Because of the different nature of the grant systems (see text), the absolute dollar amounts are not comparable. The revenue numbers include own and shared revenues for Indonesia. Since the IRS in the Philippines is an equalizing transfer, it is excluded from its revenues before grants.
Indeed, sub-national disparities in revenues generating capacity are large within East Asian countries.ix The disparities in own revenues generated are larger than the disparities in income per capita (Table 1).x In China, for instance, own revenues per capita of the richest province in revenue terms is fifteen times that of the poorest region, whereas in Indonesia, the Philippines, and Vietnam the numbers are even significantly higher.xi In the last three countries natural resource revenues collected or shared by the center with the regions exacerbates apparent inequalities. Below the provincial level, inequalities are even larger.xii In Indonesia, for instance, the richest local government had 50 times the own revenues of the poorest one in 2001 (World Bank, 2003b), whereas the richest county in Gansu province had 82 times the revenues per capita of the poorest one (World Bank, 2002a).xiii
This large magnitude of inter-regional fiscal disparities across East Asian
countries is not due to recent trends. Data for China (Table 2) show that fiscal disparities have been persistently large across time.xiv While expenditure disparities have slightly increased, with the inter-provincial coefficient of variation rising from .69 to .83, revenue disparities have fallen from 2.0 to 1.2. Yet, although revenue disparities have fallen, they continue to be large with Shanghai having almost 16 times the revenue per capita of Tibet. Similarly, in terms of inter-provincial expenditure disparities, Tibet’s expenditure per capita was 8 times that of Hainan in 1979, while Shanghai’s is currently 8 times that of Henna.

Ensuring Inter-regional Equity and Poverty Reduction
5
Table 2: Disparities in China’s Provincial Per Capita Fiscal Outcomes, (1979-2002) (RMB yuan, per capita) Revenues Expenditures 1979 2002 1979 2002 Maximum 1525 4362.8 274 5307 Minimum -12 273.7 34 654.5 Average 148.2 805.8 97.9 1620.5 max/min -127.1 15.9 8.1 8.1 Standard deviation 293.5 939.2 67.4 1218.4 Coefficient of variation 2.0 1.2 .69 .83 Sources: Qiao et al, 2003. Note: The table presents consolidated province-level data. The negative minimum value for China is due to the definition of revenues, which includes subsidies to compensate state enterprise losses due to policy as negative revenue.
Figure 1: Provincial Poverty Map of East Asia
20 40 60 80
% of population living below PPP$2/day in 2002
Source: World Bank EAP Data

Challenges in the Design of Fiscal Equalization and Intergovernmental Transfers
6
In Indonesia, disparity in total revenues after grants is by and large as big as it was in 1994 (Table 3). Regarding own revenues, however, disparities were already on the rise prior to the beginning of decentralization in 1999. Ultimately, own revenues plus shared revenues show an increase in disparity post decentralization, especially due to natural resource revenue sharing.
Table 3: Cumulative Coefficients of Variation in Indonesia, (1994-2002) 1994 1999 2000 2002 Own Revenues 0.866 0.876 0.982 0.9 Shared Taxes 0.727 0.695 1.282 0.859 Shared Non-Taxes 0.742 0.74 1.244 1.182 SDO/PWB 0.792 0.506 0.641 0.614 Inpres 0.685 0.508 0.68 0.635 Total Revenue Disparity 0.682 0.512 0.679 0.661 Sources: SABER Database. Note:SDO (subsidi daerah otonom) or subsidy for autonomous region. After 2001, INPRES (instruksi presiden) was made equal to the DAU. Equalization mechanisms in East Asian countries
Indonesia, China, Vietnam, Thailand, and the Philippines have all taken measures to address fiscal disparities though an explicit equalization grant system (Table 4). Many of these grant systems have desirable features: all have a formula-based distribution of resources and three of the five countries have a formula-based determination of the pool of resources to be distributed. In three of these countries, the equalization system takes into account both revenue capacity and some form of expenditure needs, whereas that in Thailand and the Philippines only considers the expenditure needs side. The size of the distribution pool differs greatly from country to country: whereas for Indonesia and the Philippines the equalization grants system makes up the largest share of central-local grants, this is very different for Thailand and China, where earmarked grants dominate. In addition to the equalization grant, the distribution of earmarked grants sometimes includes equalizing elements, but in other cases these grants are not targeted to the poor regions, and may even have a counter-equalizing effect. Finally, although numbers are hard to come by, central spending also has a regional dimension, and if such spending is done on functions that are considered as subnational ones, such spending could be considered as part of the equalization system. This section reviews the current equalization grant systems in Indonesia, China, Vietnam, Thailand and the Philippines.
In Indonesia, the equalization grant, Dana Alokasi Umum or DAU, is the mainstay of the intergovernmental fiscal system. The funding for the DAU consists of 25 percent of central government revenues after tax sharing with the regions.xv Ten percent of the DAU goes to the provincial level, which plays a relatively minor role in public services, and 90 percent goes to the local government level. On aggregate, this grant finances some 70 percent of local government spending, and some 50 percent of provincial government spending. The DAU is distributed according to a formula that takes both revenue capacity and expenditure needs into account. Revenue capacity is defined as potential own-source revenues plus shared tax revenues plus 75 percent of shared natural resource revenues.xvi Expenditure needs are defined as a function of population, poverty

Ensuring Inter-regional Equity and Poverty Reduction
7
rate, land area, and construction cost index as an indicator of “geographical circumstances.” In addition to the formula allocation, part of the DAU is distributed based on past spending patterns—by and large to accommodate transitory effects that occurred in the 2001 decentralization. Finally, a lump sum per region plays a role in the allocation. The new earmarked grants system (DAK) is still small compared to the general grants system (about 3 percent of total grants), but also includes an element of equalization through required counterpart funding: regions with low fiscal capacity pay the minimum of 10 percent counterpart funds whereas those with high fiscal capacity pay up to 50 percent in counterpart funds.
Table 4: Equalization in intergovernmental transfer systems, selected countries Indonesia China Philippines Viet Nam Thailand Equalization Grant Principles
All regions receive an equalizing general grant
16 regions receive an equalizing grant. (Very small, in 2001 only 3 percent of all transfers.)
All regions receive a fixed share of central government tax revenues (IRA).
Allocated to those jurisdictions where approved expenditure budgets exceed the sum of own revenues and the 100 percent retention of all shared revenues.
Discretionary allocated to PAOs, Municipalities and TAOs and then further allocated to individual localities on a formula base.
Formula-based source?
Yes, 25 percent of actual central government revenues after revenue sharing.
No; level of funding decided by the annual budget based on ad hoc principles.
Yes; LGC sets IRA of LGUs at 40 percent of average internal revenue tax collections three years prior to the current year.
Partially. formula based on a calculated budget transfer between the center and the provinces. Negotiated expenditure needs.
No; total amount of different types of grants differs on a yearly basis.

Challenges in the Design of Fiscal Equalization and Intergovernmental Transfers
8
Table 4: Equalization in intergovernmental transfer systems, selected countries Indonesia China Philippines Viet Nam Thailand Main features of Formula
Expenditure needs and revenue capacity based, but 50 percent determined by transitional elements. Expenditure needs as a function of population, poverty rate, land area, and construction cost index. Revenue capacity estimated as standardized own revenues (based on average efforts) plus shared tax revenues plus 75 percent of natural resource revenues.
Expenditure needs and revenue capacity based formula derived from regression analysis on “standard budget.” Relies on variables like provincial GDP, student-teacher ratios, number of civil servants, and population density.
IRA divided among LGUs as follows: provinces (23 percent), cities (23 percent), municipalities (34 percent), and barangays (20 percent). IRA allocated on the basis of population (50 percent), land area (25 percent) and equal sharing (25 percent).
SNG expenditure needs minus total revenue from taxes shared 100 percent with SNG and total budget revenues shared between the central and SNG budgets
5 percent reserved for unfounded devolving functions; 95 percent local authorities; of this amount, PAOs (7 percent), Municipalities (52 percent), and TAOs (41 percent). The allocation across local authorities is based on the following criteria: equal share (25 percent), population (30 percent), area (5 percent), invert to local revenues, excluded grants (20 percent) and invert to specific grants received (20 percent).

Ensuring Inter-regional Equity and Poverty Reduction
9
Table 4: Equalization in intergovernmental transfer systems, selected countries Indonesia China Philippines Viet Nam Thailand Equalizing properties (weak, medium, strong)
Medium; due to transitional elements and imperfections in formula.
Weak; due to limited resources.
Medium; IRA equalizing effect is not enough to counteract large disparities in tax base because it weakly compares expenditure needs and revenue capacity
Weak; but improved from ad hoc negotiated transfers used in the past; introduced clear objectives and stability by fixing formulas, thereby decreasing role of bargaining.
Weak; lack of transparency in allocation leads to self-interested politics; delays in allocation decisions have presented difficulties for LG planning and managing finances throughout fiscal year
Equalization through specific grants (i.e. ad hoc/ conditional)?
Yes. Special allocations dependent on fiscal capacity, but are small
No. Special grants de-equalizing, such as tax rebates state enterprise support. Lacks monitoring mechanisms to ensure effective use.
No; matching grants from central government agencies (augmentation funds) are proportionally small and usually subject to political interests.
No; absence of conditional grants in the conventional use of the term but targeted national programs which function in a similar way (see below).
Yes; other general grants include: tax effort promotion, local good governance promotion, devolution of compensatory functions; train ticket compensation; local development and education. Specific grants include educational (capital projects) and development
Challenges in the Design of Fiscal Equalization and Intergovernmental Transfers
10
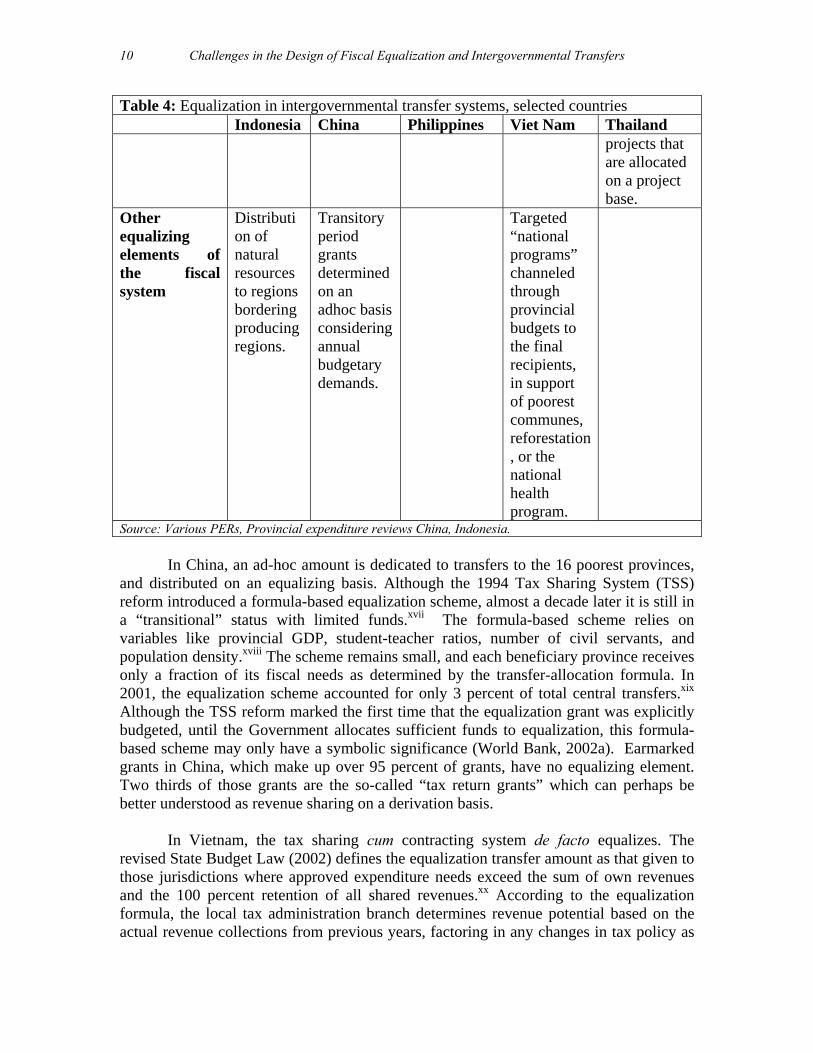
Table 4: Equalization in intergovernmental transfer systems, selected countries Indonesia China Philippines Viet Nam Thailand
projects that are allocated on a project base.
Other equalizing elements of the fiscal system
Distribution of natural resources to regions bordering producing regions.
Transitory period grants determined on an adhoc basis considering annual budgetary demands.
Targeted “national programs” channeled through provincial budgets to the final recipients, in support of poorest communes, reforestation, or the national health program.
Source: Various PERs, Provincial expenditure reviews China, Indonesia.
In China, an ad-hoc amount is dedicated to transfers to the 16 poorest provinces, and distributed on an equalizing basis. Although the 1994 Tax Sharing System (TSS) reform introduced a formula-based equalization scheme, almost a decade later it is still in a “transitional” status with limited funds.xvii The formula-based scheme relies on variables like provincial GDP, student-teacher ratios, number of civil servants, and population density.xviii The scheme remains small, and each beneficiary province receives only a fraction of its fiscal needs as determined by the transfer-allocation formula. In 2001, the equalization scheme accounted for only 3 percent of total central transfers.xix Although the TSS reform marked the first time that the equalization grant was explicitly budgeted, until the Government allocates sufficient funds to equalization, this formula-based scheme may only have a symbolic significance (World Bank, 2002a). Earmarked grants in China, which make up over 95 percent of grants, have no equalizing element. Two thirds of those grants are the so-called “tax return grants” which can perhaps be better understood as revenue sharing on a derivation basis.
In Vietnam, the tax sharing cum contracting system de facto equalizes. The revised State Budget Law (2002) defines the equalization transfer amount as that given to those jurisdictions where approved expenditure needs exceed the sum of own revenues and the 100 percent retention of all shared revenues.xx According to the equalization formula, the local tax administration branch determines revenue potential based on the actual revenue collections from previous years, factoring in any changes in tax policy as

Ensuring Inter-regional Equity and Poverty Reduction
11
well as expected annual economic growth (Martinez-Vazquez, 2003). Expenditure needs are based on the prevailing system of expenditure norms, specified as money amounts per capita, rather than physical standards as prior to 1996, which were unaffordable. Regions are also allowed to keep revenues collected in excess of agreed shares. Beyond the equalization transfer, there are no conditional grants in Vietnam, rather a series of “national programs” for the poorest communes, reforestation goals and/or the national health objectives. These “national programs” are targeted, thus channeled through provincial budgets to the final recipients.
In Thailand, the fiscal equalization grant is among the general type of grants,
which for the most part have a formula-based allocation.xxi Fiscal equalization grants have a strict formula with the following allocation criteria to local authorities: equal share (25 percent), population (30 percent), area (5 percent), invert to local revenues, excluded grants (20 percent), and invert to specific grants received (20 percent). The second type of grants – specific grants – include educational (capital investment projects) and development projects which are allocated on a project based criteria. Although grants were the greatest source of intergovernmental transfers in 2003 (i.e. 38 percent of local revenues), the amount allocated varies on a yearly basis, and actual allocations are not known until well after the fiscal year begins. This leads to a lack of transparency across tiers of government and an extremely politicized system. In addition, the unpredictable nature of grants creates planning and budgeting difficulties for LGs. Ultimately, grants are unable to reflect or alleviate the broader intergovernmental framework and the vertical fiscal imbalance between the Central and subnational governments.
Under the Local Government Code (LGC) in the Philippines, local governments
(LGUs) receive a fixed share of central government tax revenues called the Internal Revenue Allotment (IRA). The Local Government Code sets the aggregate IRA share of LGUs to be 40 percent of internal revenue collections three years prior to the current year.xxii Of this share, provinces and cities each receive 23 percent, municipalities receive 34 percent, and barangays 20 percent.xxiii Within each tier of government, the share is allocated according to three basic criteria: population (50 percent), land area (25 percent), and equal sharing across provinces (25 percent). Prior to the LGC, although allocation criteria were similar, their relative weights differed: population (70 percent), land area (20 percent), equal sharing (10 percent). The increased emphasis on equal sharing (i.e. rise from 10 to 20 percent) coupled with the fall in population weight (i.e. fall from 70 to 50 percent) shows a potential shift in equity concerns.

Challenges in the Design of Fiscal Equalization and Intergovernmental Transfers
12
Do grant systems in East Asian countries equalize? To answer this question, one first needs to define what is meant by “equalization.”
A commonly used one defines fiscal equality as “the capability of sub-national governments to deliver similar levels of services at similar levels of taxes,” (Searle, 2002). While such a definition is important since it points to how an equalization grant might be best designed, it proves too difficult to be operationalized as it requires
information on differences in the cost of services (which can be large) among subnational levels of government, and this data is just not yet available.xxiv Here we therefore use a simpler approach, and ask whether the disparities among subnational government’s revenues decrease as a result of the intergovernmental grants system describes above. The answer to that question is that indeed, for all the countries reviewed, the distribution of revenues per capita becomes more equal after transfers. The coefficient of variation of revenues per capita drops in each of the cases, although the equalizing effect of the transfer system varies significantly among the countries, and is strongest in Vietnam, and weakest in the Philippines (Figure 2 and Table 1& 5).
Figure 2: Disparity in provincial per capita revenues before and after transfers
(coefficient of variation)
0
0.2
0.4
0.6
0.8
1
1.2
China Indonesia Philippines Vietnam
Source: See Footnotes in Tables 1 & 5.
Table 5 : Disparities in Province-level Revenues After Grants, per Capita (US$, Latest Available Year)
China Indonesia Philippines Thailand Viet Nam Maximum 444.4 431.4 117.48 393.1 Minimum 42.8 39.8 4.18 25.1 Average 100.7 106.3 14.76 65.9 Max/min 10.4 10.8 28.13 15.7
Standard deviation 83.1 78.9 13.25 65.2 Coefficient of
variation 0.8 .74 0.90 .99 Sources: SABER Database, China Statistical Yearbook, Finance Yearbook of China, Philippine Statistical Yearbook, Vietnam Statistical Yearbook, Ministry of Finance (Vietnam), Indonesia Regional Fiscal Information System, PERs, RPERs, Staff estimates. Note: The table presents consolidated province-level data. The revenue numbers include own and shared revenues for Indonesia.

Ensuring Inter-regional Equity and Poverty Reduction
13
Further evidence of the equalization properties of the transfer systems comes from cross-section analysis of revenues and expenditures per capita against income per capita. If the income elasticity of expenditures is lower than the income elasticity of revenues, it can be argued that the transfer system is equalizing.xxv This is indeed the case for the East Asian countries for which sufficient data are available (Table 6), suggesting that grants systems equalize. Table 6: Evidence of Equalization Income
elasticity of revenue
Income elasticity of expenditures
Indonesia 0.81 0.57 China 1.03 0.61 Viet Nam 1.26 0.72 Note: reported are the estimated parameter for the log of income per capita in a regression that regresses the log of revenues (expenditures) per capita against the log of income per capita and a constant. All the reported elasticities are significant at the 1 percent level.
Even after transfers, though, the disparities in revenues per capita remain large.
The richest province in the Philippines has 28 times more revenues per capita than the poorest one, while the same numbers for China, Indonesia, and Viet Nam are 8, 10, and 22 respectively. For comparison, in the US, the poorest state has about 65 percent of the revenues of the average state, and in Germany, any state falling below 95 percent of the average level gets subsidized through the “Finanzausgleich” (and any receiving more than 110 percent gets taxed). In Brazil, the richest state has 2.3 times the revenues per capita of the poorest state (World Bank, 2002b). In Russia, disparities are larger: the richest of the 89 regions has revenues per capita some 40 times higher than the poorest (Martinez-Vazquez et al, 1998). However, Russia’s regions are smaller than the average province in most East Asian countries, and indications are that the smaller the sub-national entity in a country, the larger the measured inequality. It is not surprising, therefore, that disparities are larger at the local level than at the provincial level: in Indonesia, the richest local government has thirty times the revenue per capita of the poorest one in 2002 while the comparable number for 2001 was over 50 times (Hofman et al, 2003) whereas within China’s Gansu province, the revenues per capita of the richest county were 37 times as large as the poorest in 1999 (World Bank, 2002a). Thus, intra-provincial disparities appear to be larger than inter-provincial ones.
A number of studies on individual countries confirm the modest performance on
equalization of the intergovernmental fiscal system. A recent empirical study on the Philippines suggests that the IRA equalizing effect has not been sufficient to counter the disparities in tax base across the LGUs (Manasan, processed). The same study found that the IRA has a counter-equalizing effect in provinces between 1995-2000 and in municipalities in 1999-2000. In Indonesia, Lewis (2003) found the DAU distribution to be equalizing, but less than would be warranted on the basis of revenue capacity and expenditure needs alone whereas Hofman, Kajatmiko and Kaiser (2003) elaborate on the

Challenges in the Design of Fiscal Equalization and Intergovernmental Transfers
14
weak equalization performance of the DAU. In Vietnam, equalization performance of the fiscal system seems more pronounced. The distribution of revenue collections and allocations shows that a substantial proportion of revenues collected in the wealthier provinces is redistributed to the poorer provinces for spending. While revenue collections were significantly higher in wealthier provinces, the revenues ultimately allocated to them were significantly lower than those allocated to poorer regions and vice versa (World Bank, 2000a). Rao (2001) presents cross-section estimates of the revenue and expenditure elasticity of income, showing that the latter is much lower than the former. This implies a significant degree of equalization, in line with the steep drop in coefficient of variation presented in this paper. For China, Yan (2003) shows through a simple regression analysis that the two fiscal reforms (in 1985 and 1994) were not able to exert meaningful effects on interregional equalization. Evidence on the distribution of earmarked grants indicates that they are predominantly flowing to the richer provinces (Achmad et al, 2000, and World Bank 1994). The fiscal system has been unable to alleviate the de-equalizing effects of market reform and appears to have exacerbated regional disparities (Yan, 2003). Disparities in revenues per capita after grants translate into disparities in expenditures per capita, although not one-to-one. The difference may be access to borrowing, or use of built up reserves.
Do Fiscal Disparities Matter?
Do the observed fiscal disparities matter? Policy makers may be concerned about these disparities for a number of reasons, but from a poverty alleviation perspective they matter if they translate into large disparities in service delivery and service outcomes among subnational governments. Indicators of service delivery at the sub-national level are as scarce as fiscal data, but Human Development Indicators (HDI),xxvi persons per hospital bed,xxvii literacy, xxviii and life expectancy,xxix are available for most countries under review. Persons per hospital bed can be considered as a service input indicator, , whereas the other indicators are examples of outcome indicators. These indicators show a large variation across and within countries, but variation is lower than the fiscal indicators analyzed before.xxx When considering persons per hospital beds, Indonesia’s poorest ranking province is 7.6 times worst than the better ranking one, while the same numbers for Vietnam, China, Philippines, and Thailand are – if not as bad, yet still discouraging – 3.3, 3.4, 4.4, and 6.8 respectively.xxxi As in literacy rates, China’s highest-ranking province is almost 3 times as literate as the lowest ranking one, while Indonesia (1.34) and Vietnam (1.9) are close behind. HDI and life expectancy indicators also confirm the same trend of disparity with Vietnam’s highest province ranking nearly twice as high as the lowest one in both indicators, while China and Indonesia also rank slightly below.

Ensuring Inter-regional Equity and Poverty Reduction
15
Table 7: Disparities in Province-level HDI Indices, 1997-2002* China Indonesia Philippines Thailand Viet Nam Maximum 0.9 0.7 0.6 0.8 Minimum 0.5 0.5 0.3 0.5 Average 0.7 0.6 0.5 0.7 Max/min 1.6 1.3 1.7 1.7 Standard deviation 0.1 0.04 0.1 0.1 Coefficient of variation .10 0.1 0.2 0.08 Sources: UNDP Human Development Indicators. Note: Data is not available across all provinces for Thailand. Data for the Philippines is at the regional level. Table 8: Disparities in Province-level Persons per hospital bed, 1997-2002* China Indonesia Philippines Thailand Viet Nam Maximum 650 3969 3503 1114 867.9 Minimum 190 524 797 165 261.2 Average 405.3 1862 2125.3 579.7 524.8 Max/min 3.4 7.6 4.4 6.8 3.3 Standard deviation 105.3 904 1537 494.7 152.9 Coefficient of variation 0.3 0.5 0.7 0.9 0.3 Sources: UNDP Human Development Indicators, Statistical Yearbooks Notes: *Data are for the most recent year available. Data for the Philippines is at the regional level. Table 9: Disparities in Province-level Life Expectancy, 1996-2002* China Indonesia Philippines Thailand Viet Nam Maximum 78.1 72.2 73.7 79.8 74.5 Minimum 64.3 59.3 60.32 61.6 54.6 Average 71.2 66.4 70.7 72.3 70.4 Max/min 1.2 1.2 1.2 1.2 1.4 Standard deviation 3.2 3.1 3.2 35.7 4.0 Coefficient of variation .04 .05 .05 .49 .1 Sources: UNDP Human Development Indicators, Statistical Yearbooks Notes: *Data are for the most recent year available Data for the Philippines are at the regional level and for males only. Data for Vietnam are for males only.

Challenges in the Design of Fiscal Equalization and Intergovernmental Transfers
16
Table 10: Disparities in Province-level Literacy Rate, 1994-2002* China Indonesia Philippines Thailand Viet Nam Maximum 93.6 98.8 98.8 96.9 Minimum 33.8 74.4 73.5 51.3 Average 83.2 90.9 92.2 88.2 Max/min 2.8 1.33 1.3 1.9 Standard deviation 11.0 6.27 5.9 8.3 Coefficient of variation .13 .07 0.1 .1 Sources: UNDP Human Development Indicators, Statistical Yearbooks Notes: *Data are for the most recent year available Data is not available across all provinces for Thailand. Data for the Philippines is at the regional level.
To assess whether there is a systemic relation between fiscal disparities and disparities in service delivery indicators, we use a simple regression approach. We use two specifications (Table 7): specification I is a simple regression of social outcome indicators (i.e. HDI, persons per hospital beds, life expectancy, and literacy rates) as a function of a constant and expenditures per capita. In specification II, we also include GPP per capita as one of the explanatory variables to control for potential correlations between provincial (regional) income per capita and expenditures – and their respective implications in terms of service delivery outcomes.xxxii
Specification I suggests a modestly significant correlation between social
outcomes indicators and subnational expenditures. For the most part in China and Vietnam, the four indicators are significantly correlated with expenditures. In China, the only exception is literacy rates, which although positive, is not significant; moreover, the reason may be that education financing is still partly under the auspices of the central government given recent efforts to re-centralize education expenditures. In Vietnam, the only exception is persons per hospital beds and the reason is that the government’s role in the financing of health expenditures is relatively modest; “In 1998, the public expenditure share in aggregate health spending was only about 20 percent, with households accounting for the remaining 80 percent” (World Bank, 2000a). Accordingly, given the predominance of private funding in health services, government subnational revenues then would not make a tangible difference in outcomes. In this case, then, infant mortality, for example, might be a better health outcome measure. Indeed, differing from life expectancy, which may imply other variables such as food source, for example, infant mortality is more directly related to health services. In Indonesia, however, the results are only significant for persons per hospital bed and life expectancy, and the reason for such relatively modest results may possibly be due to the very nascent decentralization process in the country.
In the second specification, expenditures per capita are not found to be correlated
with service output and outcome indicators. A possible explanation for these ambiguous results may be multicollinearity, which reduces the efficiency of the estimation—although the estimator remains unbiased.xxxiii

Ensuring Inter-regional Equity and Poverty Reduction
17
Table 11: Expenditure Disparities and Public Services Outputs and Outcomes
Results of regression analysis China Indonesia Viet Nam Dependent Variable and Specification HDI I .102* .008 .096* HDI II1 -.01 .002 -.001 Persons per Hospital Beds I -.48* -0.29* .04 Persons per Hospital Beds II -.39* -.15 -.15 Life Expectancy I .04* .02* .04* Life Expectancy II -.02* .01 -.02 Literacy I .03 .02 .06** Literacy II -.03 .01 -.02
Source: Staff estimates Note: The table presents the results of regression analysis with the output or outcome indicator as a dependent variable. Dependent variables are a constant and expenditures per capita in specification I (y=α + β*expenditure per capita), and a constant, expenditures per capita, and provincial GDP per capita in specification II (y=α + β*expenditure per capita + γ*GPP per capita). A ‘*’ (‘**’) indicates significance at the 5 (10) percent level. Average number of observations for each specification: : China (28), Indonesia (27), Vietnam (59). China results exclude Chongqing, Tibet and Qinghai. Indonesia results exclude Aceh, Papua and Maluku. Vietnam results exclude Ba Ria Vung Tau and Long An.
Challenges in the Design of Fiscal Equalization and Intergovernmental Transfers
18
Literature on public spending and
outcomes shows that although public spending can be critical for improvements in health and education outcomes, there is large variation in the effectiveness of the use of funds. For example, although Thailand and Peru both increased public spending on primary schooling, primary schooling completion rates fell in Thailand while they increased in Peru. Conversely, Mexico and Jordan health spending diverged, while child mortality fell in both countries.xxxiv
Another possible explanation for
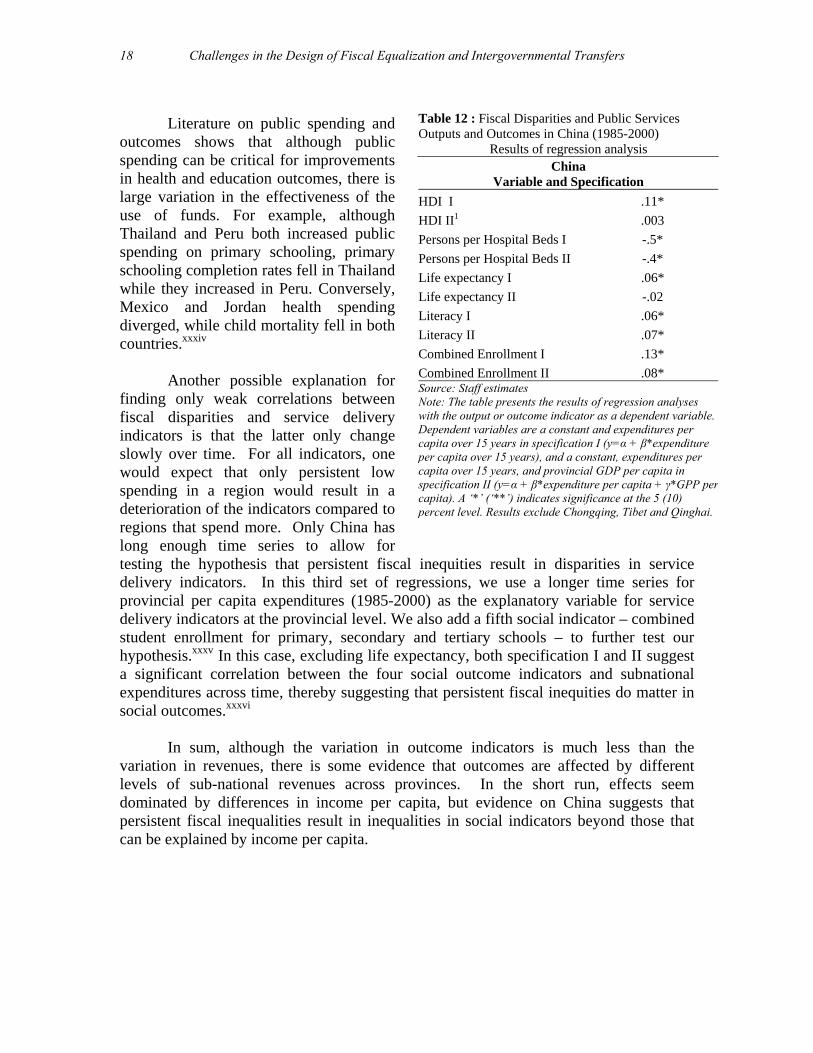
finding only weak correlations between fiscal disparities and service delivery indicators is that the latter only change slowly over time. For all indicators, one would expect that only persistent low spending in a region would result in a deterioration of the indicators compared to regions that spend more. Only China has long enough time series to allow for testing the hypothesis that persistent fiscal inequities result in disparities in service delivery indicators. In this third set of regressions, we use a longer time series for provincial per capita expenditures (1985-2000) as the explanatory variable for service delivery indicators at the provincial level. We also add a fifth social indicator – combined student enrollment for primary, secondary and tertiary schools – to further test our hypothesis.xxxv In this case, excluding life expectancy, both specification I and II suggest a significant correlation between the four social outcome indicators and subnational expenditures across time, thereby suggesting that persistent fiscal inequities do matter in social outcomes.xxxvi
In sum, although the variation in outcome indicators is much less than the
variation in revenues, there is some evidence that outcomes are affected by different levels of sub-national revenues across provinces. In the short run, effects seem dominated by differences in income per capita, but evidence on China suggests that persistent fiscal inequalities result in inequalities in social indicators beyond those that can be explained by income per capita.
Table 12 : Fiscal Disparities and Public Services Outputs and Outcomes in China (1985-2000)
Results of regression analysis China
Variable and Specification HDI I .11* HDI II1 .003 Persons per Hospital Beds I -.5* Persons per Hospital Beds II -.4* Life expectancy I .06* Life expectancy II -.02 Literacy I .06* Literacy II .07* Combined Enrollment I .13* Combined Enrollment II .08* Source: Staff estimates Note: The table presents the results of regression analyses with the output or outcome indicator as a dependent variable. Dependent variables are a constant and expenditures per capita over 15 years in specification I (y=α + β*expenditure per capita over 15 years), and a constant, expenditures per capita over 15 years, and provincial GDP per capita in specification II (y=α + β*expenditure per capita + γ*GPP per capita). A ‘*’ (‘**’) indicates significance at the 5 (10) percent level. Results exclude Chongqing, Tibet and Qinghai.

Ensuring Inter-regional Equity and Poverty Reduction
19
3. CONCLUSIONS This paper has shown that fiscal disparities among sub-national governments in
East Asian countries are considerable. Equalization mechanisms diminish subnational fiscal disparities, yet even after equalization, disparities remain large. The paper finds disparities among service delivery outputs and outcomes to be considerable as well, but data and methodological issues prevent us from establishing a strong link with the large fiscal disparities. For the one country for which sufficient data are available (China), the paper finds that persistent fiscal disparities do seem to matter in health and education outcomes.
Nonetheless, there are numerous reasons why inequalities may persist. The first
is that there may be significant variation in expenditure needs. This could be for two reasons: (i) a large variety in costs among the sub-national governments and (ii) an asymmetry in decentralization, or in other words, some regions do more than others. A second is the central government’s emphasis on revenue mobilization. Too much equalization, if not well designed, could reduce the incentive for own revenue mobilization, to the detriment of general government’s tax take in the economy. A third could be that inequalities among regions could induce a desirable migration to regions with better economic prospects. A fourth reason is that poor regions may be less capable in handling money than rich ones, or less concerned with poverty alleviation than the center. A fifth is a more political one: rich regions are also powerful regions, and they do not like to lose out against the poorer regions. Particular reasons in the East Asian context include the coastal development strategy in China, which allowed “some provinces to get rich first” and Indonesia, where natural resource regions with separatist tendencies were bought with a larger share of the natural resource revenues. A fifth reason is simply that rich regions are often also powerful regions, and it is hard for the center to tax away and redistribute resources from the rich regions.
Based on these preliminary findings and on the broader implications of inter-
regional equity, we have a set of recommendations in four areas: (i) information management, (ii) transfer systems, (iii) central government role (iv) future research and analysis. The policy debate on fiscal inequalities, and on intergovernmental fiscal relations more general, requires more data. Without more and sound information on how large inequalities are and how they have evolved over time, a policy debate on what inequalities are acceptable or desirable is impossible. In each of the countries in East Asia there is a dearth of sub-national fiscal-related data. The data for the countries analyzed in this paper are far from perfect, but it has to be emphasized that many other country cases had to be dropped because there were no fiscal data at all available at the subnational level. The lack of data hold even more true for levels of government below the first tier sub-national government. In addition, data on service delivery cost differentials is also critical to assess inter-regional disparities in access to services. Better data requires setting up monitoring systems in government, an undertaking that requires significant resources. Indonesia, for example, has managed to maintain a database on sub-national fiscal information at the center, which, supported by the legal requirement of regions to report, has information on most of its 410 local governments. In China, the data are there

Challenges in the Design of Fiscal Equalization and Intergovernmental Transfers
20
at the originating level, but the aggregation of information at each level of government implies that the central government has little relevant information on the fiscal situation at the sub-national level. For some countries in order to get better data, adjustments in accounting systems and budget classification is needed as well. For instance, in China, significant fiscal resources are classified as “extrabudgetary” and the information on those funds is even more scarce than that on budgetary funds, and they are large enough to fundamentally alter conclusions on fiscal disparities and other policy issues.
Apart from more data, more policy analysis should be done on the data to inform
the policy debate. Ultimately, countries should aim to regularly review the results and progress of their respective intergovernmental fiscal systems, including issues of fiscal disparities and service delivery disparities. For example, following the highly successful example of South Africa, Indonesia has published (March 2004) the first of what is to be a regular intergovernmental fiscal review. Such a report would allow policy makers to evaluate their intergovernmental fiscal system on a regular basis.
Irrespective of whether more or less fiscal equalization is desirable, there is a
significant scope for improvement in the design of intergovernmental systems. In most countries, there is a need to identify a more comprehensive objective for the equalization system as a whole. The center must determine its equalization objectives and set of priorities (i.e. income levels, fiscal capacity, expenditure needs, per person revenues available) within a politically viable scenario, thereby defining the funding sources (i.e. central government revenues versus fraternal contributions) (Bahl, 2000). Objectives pursued by equalization grants are frequently unclear, wherein some grants embody the features of earmarked grants – usually based on temporary considerations. A more comprehensive objective, then, would be to aim for each local government to at least be able to deliver a minimum level of public goods and services. Country-specific recommendations include:
• China’s transfer system could aim to reflect local revenue capacity and expenditures
needs in a rules-based manner, rather than through an ad hoc distribution and derivation. In addition to a more transparent system, China should also aim for simpler equalization mechanisms such as potentially consolidating the various equalization grants into one overarching grant. To further enhance both transparency and simplicity, it would be helpful to systematically identify the total pool of equalization funds – to be decided based on potential tradeoffs between equalization, growth and overall incentives for local revenue mobilization and expenditures.
• In Vietnam, negotiation and discretion remain primarily for “surplus” provinces and local governments. Moreover, it should consider the introduction of conditional grants and/or other transfer instruments – with or without matching provisions – to create incentives and provide financing for expenditures in national priority areas such as health and education. This funding can also be used for social assistance programs at the local level along with grants for capital infrastructure among other options. Furthermore, Martinez-Vazquez argues for the need to structure transfers at the sub-provincial level (Martinez-Vazquez, 2004b).

Ensuring Inter-regional Equity and Poverty Reduction
21
• Although Indonesia’s transfer system introduces the notion of expenditure needs and revenue capacity through its equalization grant, it should move towards defining a more equalizing DAU by phasing out the transitional elements of base amount and “hold harmless” in the allocation. In terms of transparency and simplicity, Indonesia should primarily decide on a more consistent treatment of natural resource revenues in revenue sharing and in the equalization formula. In addition, it should introduce a selective system of specific grants combined with an (on) lending window to promote the financing of national priorities at the local level.
As for future research agenda, and analysis, the data we collected for the most
recent year available shows that although there are huge fiscal disparities across subnational governments, they are relatively modest for health and education outcomes. Why? What are the countervailing forces within each country or groups of subnational provinces and/or municipalities? Are there migration tendencies? Is there a push for asymmetrical decentralization? What are government preferences and what role do this play in actual policy-making? Moreover, discussion about the center’s role and the impact of its central programs are critical in the context of decentralizing inter-governmental relations. These and many other questions are a fruitful line of research requiring further empirical analysis.

Challenges in the Design of Fiscal Equalization and Intergovernmental Transfers
22
References Ahmad, Ehtisham, and John Craig (1997). “Intergovernmental Transfers,” in Teresa Ter-Minassian (ed.), Fiscal Federalism in Theory and Practice, International Monetary Fund: Washington DC. _________, Li Keping and Thomas Richardson (2000). “Recentralization in China?” Conference on Fiscal Decentralization, November. Bahl, Roy (2000). “Intergovernmental Transfers in Developing and Transition Countries: Principles and Practice,” Urban and Local Government: Municipal Finance, World Bank: Washington DC. _________, and Jorge Martinez-Vazquez, “Fiscal Federalism and Economic Reform in China,” International Studies Program, Georgia State University. Processed. Balisacan, Arsenio M., Ernesto M. Pernia, Abuzar Asra (2003) “Revisiting Growth and Poverty Reduction in Indonesia: What do Subnational Data Show?” Bulletin of Indonesian Economic Studies, Vol. 39(3): 329-51. Birdsall, Nancy, Estelle James (1990). “Efficiency and Equity in Social Spending: How and why Governments Misbehave,” Policy, Research, and External Affairs, Population and Human Resources Operations, World Bank: Washington DC. Bourguignon, François, “Transition of China’s Northeast: The Need for Combining Regional and National Policies,” Paper for Development Strategy for Northeast China Seminar, Shenyang, Liaoning Province, China, December 3-4, 2003. Processed. Brodjonegoro, Bambang (2000). “Regional Autonomy and Fiscal Decentralization in Democratic Indonesia,” Hitotsubashi Journal of Economics (41). Buchanan, James M. (1950). “Federalism and Fiscal Equity,” The American Economic Review, Vol. 40 (4). Ebel, Bob. (2003). “Intergovernmental Transfers,” Presentation at Decentralization and Intergovernmental Fiscal Reform Workshop, World Bank: Washington, DC, March 24-26. _________,(2003). “Subnational Revenues and Intergovernmental Relations,” Presentation at Decentralization and Intergovernmental Fiscal Reform Workshop,” World Bank: Washington DC, March 24-26. Filmer, Deon (2003). “The Incidence of Public Expenditures on Health and Education,” Background Note for World Development Report 2004: Making Services Work for Poor People, World Bank: Washington DC.

Ensuring Inter-regional Equity and Poverty Reduction
23
Garcia-Garcia, Jorge and Lana Soehstianingsih (1998). “Why do differences in Provincial Income Persist in Indonesia,” Bulletin of Indonesian Economic Studies, Vol. 34 (1). Gauri, Varun (2003). “Social Rights and Economics : Claims to Health Care and Education in Developing Countries,” Development Research Group, World Bank: Washington DC, Gill, Nicholas, Andres Rodriguez-Pose (2003). “Is there a global link between regional disparities and devolution?” Research Papers in Environmental and Spatial Analysis, No. 79, Department of Geography & Environment, London School of Economics and Political Science. Grosh, Margaret E. (1995). “Toward Quantifying the Trade-off: Administrative Costs and Incidence in Targeted Programs in Latin America,” in Dominique Van de Walle and Kimberly Nead (eds.), Public Spending and the Poor: Theory and Evidence, , World Bank: Washington DC. Hegedus, Jozsef (2001). “Creating Change Networks for Local Governance,” Presentation for WBI/LGI/UNDP Initiative for Central Asia, Bratislava, July30-August 3. Hill, Hal (2002). “Spatial Disparities in Developing East Asia: A Survey.” Asian-Pacific Economic Literature, Vol. 16(1). ___________, (2000). “Intra-country Regional Disparities,” Paper for presentation at the Second Asian Development Forum, Singapore, June 6-8. Hofman, Bert, Kadjatmiko, Kai Kaiser, (2003). “Fiscal Equalization in Indonesia’s 2001 “Big Bang” Decentralization,” Processed. Jimenez, Emmanuel, Donald Cox, (1995). “Private Transfers and the Effectiveness of Public Income Redistribution in the Philippines,” in Dominique Van de Walle and Kimberly Nead (eds.), Public Spending and the Poor: Theory and Evidence, World Bank: Washington DC. Lewis, Blane (2003). “Local Government Borrowing and Repayment in Indonesia: Does Fiscal Capacity Matter?” World Development, Vol. 31(6): 1047-1063. Manasan, Rosario, “Fiscal Decentralization: The Case of the Philippines,” Philippine Institute for Development Studies, Processed. Martinez-Vazquez, Jorge, Jameson Boex (1998). “Fiscal Decentralization in the Russian Federation: Main Trends and Issues.” Prepared for EDI/World Bank. Martinez-Vazquez, Jorge, Jameson Boex, “The Design of Equalization Grants: Theory and Applications,” Course on Intergovernmental Relations, World Bank Institute, World Bank: Washington DC.

Challenges in the Design of Fiscal Equalization and Intergovernmental Transfers
24
< http://www.worldbank.org/wbi/publicfinance/decentralization/coursemodule.htm#4> Martinez-Vazquez. Jorge, Robert M. McNab (2003). “Fiscal Decentralization and Economic Growth,” World Development. Processed. ___________, (2003). “Improving the Design of Fiscal Decentralization in Vietnam,” Presentation. February. ___________, (2004a). “The Design of Fiscal Decentralization: Principles and Best International Practice,” Presentation, PER-IFA Mission, Hanoi, April. ___________, (2004b). “Improving the Design of Fiscal Decentralization in Vietnam,” Prepared for World Bank Vietnam Public Expenditure Review. Processed. McLure, Charles E. Jr. (1999). “The Tax Assignment Problem: Conceptual and Administrative Considerations in Achieving Subnational Fiscal Autonomy,” World Bank: Washington DC. Milanovic, Branko (2001). “Conflict Between Horizontal Equity and Maximum Poverty Reduction, How Best to Allocate Funds to Regions: An Empirical Analysis,” World Bank: Washington DC. Pritchett, Lant, Jonah Gelbach (2000). “Indicator Targeting in a Political Economy: Leakier can be Better,” World Bank: Washington DC. Pritchett, Lant, Deon Filmer, Jeffrey Hammer (1999). “Health Policy in Poor Countries: Weak Links in the Chain,” World Bank: Washington DC. Prud’homme, Rémy (1995). “The Dangers of Decentralization,” World Bank Research Observer, Vol. 10(2). Qiao, Baoyun, Jorge Martinez-Vazquez and Yongsheng Xu (2003). “Growth and Equity Tradeoff in Decentralization Policy: China’s Experience,” International Studies Program, Georgia State University. Rafuse, Robert (1992). Representative Expenditure, US Advisory Commission on Intergovernmental Relations. Rao, M. Govinda, “Fiscal Assignment and Service Delivery,” Presentation, Institute for Social and Economic Change: Bangalore, India. ___________ “Poverty Alleviation under Fiscal Decentralization.” Institute for Social and Economic Change: Bangalore, India. Processed.
Ensuring Inter-regional Equity and Poverty Reduction
25
___________, (2001). Challenges in Fiscal Decentralization An Asian Perspective, Paper presented at the conference Public Finance in Developing and Transition Countries, Atlanta, Georgia. ___________ , Richard M. Bird, Jennie Litvack, “Fiscal Decentralization and Poverty Alleviation in a Transitional Economy: The Case of Viet Nam,” Asian Economic Journal, Vol. 12 (4), 1998: 353-378. Ravallion, Martin (1999). “Are poorer states worse at targeting their poor?” Economic Letters, Vol. 65. ___________, (1990). Gaurav Datt, “Regional Disparities, Targeting, and Poverty in India,” Policy, Research, and External Affairs, Population and Human Resources Operations, World Bank. ___________, (1998). “Reaching Poor Areas in a Federal System,” Policy Research Working Paper, Development Research Group, World Bank: Washington DC. ___________, (1999). “Is More Targeting Consistent with Less Spending,” World Bank: Washington DC. ___________, (1993). “Poverty Alleviation Through Regional Targeting: A Case Study for Indonesia,” in Karla Hoff, Avishay Braverman, and Joseph Stiglitz (eds.), The Economics of Rural Organization: Theory, Practice and Policy. World Bank and Oxford University Press: Washington DC and New York. Searle, Bob (2002). “Federal Fiscal Relations in Australia,” International Centre for Economic Research, Torino, Italy. Smoke, Paul, “Fiscal Decentralization in Developing Countries: A Review of Current Concepts and Practice,” United Nations Research Institute for Social Development, Palais des Nations. Processed. Tanzi, Vito and L. Shuknecht (1995). “The Growth of Government and the Reform of the State in Industrial Countries.” IMF Working Paper, December. Ter-Minassian, Teresa (1997). Fiscal Federalism in Theory and Practice, International Monetary Fund, International Monetary Fund: Washington DC.
United Nations Development Programme, China Human Development Report (1999), United Nations: New York. Van de Walle, Dominique (1995). “Incidence and Targeting: An Overview of Implications for Research and Policy,” in Dominique Van de Walle and Kimberly Nead (eds). Public Spending and the Poor: Theory and Evidence, World Bank: Washington DC.
Challenges in the Design of Fiscal Equalization and Intergovernmental Transfers
26
Wong, Christine (2002). “Issues of Equalization in China,” Presentation in Intergovernmental Fiscal Relations in East Asia Workshop, World Bank: Washington DC, January. World Bank (1993). “China: Budgetary policy and intergovernmental fiscal relations,” Report no.11094-CHA, Washington DC. World Bank (2000a). “Managing Public Resources Better,” Vietnam Public Expenditure Review, Washington DC. World Bank (2002a). China: National Development and Subnational Finance: A Review of Provincial Expenditures, Washington DC. World Bank (2002b). “Brazil: Issues in Brazilian Federalism,” Brazil Country Management Unit, Poverty Reduction Economic Management Sector Unit, Latin America and the Caribbean Region, Washington DC. World Bank (2003a). “Philippines: Improving Government Performance: Discipline, Efficiency and Equity in Managing Public Resources,” Poverty Reduction Economic Management, East Asia and the Pacific Region, Washington DC. World Bank (2003b). “Decentralizing Indonesia,” Regional Public Expenditure Review, Poverty Reduction Economic Management, East Asia and the Pacific Region, Washington DC. World Bank (2003c). “World Development Indicators,” World Bank: Washington DC. World Bank (2004a). “World Development Report: Making Services Work for Poor People,” World Bank and Oxford University Press: Washington DC. World Bank (2004b). “Chinese 11th Five Year Plan,” Concept Note, Development Economic Research Group, Washington DC. World Bank (2004c). “2004 Public Expenditure Review & Integrated Fiduciary Assessment,” Aide Memoire, Multi-Donor Mission, April 5-16. World Bank (2004d). “Inequality in Latin America and the Caribbean: Breaking with History?” World Bank Latin American and Caribbean Studies, Washington DC. World Bank (2004e). “Managing Decentralization in East Asia,” Poverty Reduction Economic Management, East Asia and Pacific Region, World Bank: Washington DC. Processed. Yan (2003). “Regional Equalization in China’s Public Finance.” Processed.

Ensuring Inter-regional Equity and Poverty Reduction
27
Zhang, Zhihua, and Jorge Martinez-Vazquez (2003). “The System of Equalization Transfers in China,” International Studies Program Working Paper 03-13, Andrew Young School of Policy Studies, Georgia State University. i The findings, interpretations, and conclusions expressed in this paper are entirely those of the authors. They do not represent the views of the World Bank, its Executive Directors, or the countries they represent. The authors are very grateful to Dana Weist, Roland White, Paul Smoke, Bob Ebel, Jorge Martinez Vazquez, Roy Bahl, Tamar Manuelyan Atinc, Richard Bird, David Rosenblatt, Roy van der Weide, Sjamsu Rahardjs, Kai Kaiser, Blane Lewis, Arvind Gupta, Shan Gooptu, Minh Van Nguyen and Jessica Tisch for helpful comments, and wish to express thanks to colleagues who provided subnational fiscal data (Ed Mountfield, Bambang Suharnoko, Bastian Zaini, Joven Balbosa, Amit Mukherjee, Khuankaew Varakornkarn, Xiaofan Liu, Christine Wong). ii Migration can be considered excessive in an economic sense, if the marginal productivity of a worker would be higher in his place of origin, or if the congestion costs in the region of destination are larger than the private benefits obtained from the better services; see Ahmad and Craig in Ter Minassian, eds. (1997). iii For an extensive discussion of this point, see Tanzi (1995) and Prud’homme (1995). iv A review, assessing constitutional rights to education and health care in 187 countries, concludes that of the 165 countries with written constitutions available, 116 made reference to a right to education and 73 to a right to health care (Gauri 2003). v In the Philippines, for example, IRA allocations have somewhat detracted from LGUs incentive to improve the collection of own source revenues (World Bank 2003a). vi Art. XVIII (a) sub 2 of the Indonesian Constitution states “The relationship in finances, public services, utilization of natural resources and other resources…..shall be regulated and executed fairly and equitably based on the law.” vii Art II section 9 and 10 of the Philippine Constitution states “The State shall promote a just and dynamic social order that will ensure the prosperity and independence of the nation and free the people from poverty through policies that provide adequate social services, promote full employment, a rising standard of living, and an improved quality of life for all. The State shall promote social justice in all phases of national development.” viii Excludes the oil-producing region of Ba-Ria Vung Tao (Vietnam). ix Data limitations force us to restrict our sample to 5 countries: China, Indonesia, Philippines, Thailand, and Vietnam. x SABER Database refers to the authors’ original data collection process. xi Fiscal disparities can differ depending on the indicator of inequality chosen. In addition to the method chosen, a future draft of this paper will also show fiscal disparity calculations using the population weighted Theil indicator, aiming to have a better measure of the impact of fiscal disparities from the individual’s perspective. xii This is a systemic point: the smaller the entities analyzed, the larger the disparities found. xiii The level of fiscal disparities is sensitive to cost differentials across provinces; however, data on provincial cost of living is not readily available for the countries in the sample.

Challenges in the Design of Fiscal Equalization and Intergovernmental Transfers
28
xiv Data limitations, along with concomitant changes in respective countries’ decentralization processes, make similar type of analysis very difficult for other countries in our sample. xv In principle, the law prescribes this to be 25 percent of actual revenues, but for now the practice has been to take budgeted revenues as the basis for the aggregate amount of DAU. xvi For detail, see Hofman, Kajatmiko and Kaiser (2003). xvii As a result of the 1994 TSS reform revenue sharing arrangements were changed from a negotiated, mildly equalizing system to one based on strict tax assignments (Wong, processed). xviii For detail, see Ahmad, Ehtisham, Li Keping, Thomas Richardson (2000). xix World Bank, 2004e; see China Country Review. xx World Bank, 2004e; see Vietnam Country Review. xxi In addition to fiscal equalization, general grants include tax effort promotion, local good governance promotion, devolution of compulsory functions, train ticket compensation, local development, and education. Exceptions to the formula-based allocation criteria are: local good governance, train ticket compensation and local development. xxii Although the aggregate IRA share is fixed by law, subsequent to the 1998 Asian financial crisis, the central government withheld – without any consultation processes – 5 percent of the IRA. Despite the Supreme Court ruling in favor of LGUs, there still remains disagreement whether the formula should be subjected to appropriation or whether it should be decreased as part of the appropriation process in Congress; see Manasan (200X). xxiii Prior to the LGC, inter-tier allocation differed greatly: provinces (27 percent), cities (22 percent), municipalities (41 percent) and barangays (10 percent). xxiv There has been some success in utilizing this data for purposes of grant design in the United States. See Robert Rafuse, Representative Expenditures, US Advisory Commission on Intergovernmental Relations (1992) xxv This ignores the effect of borrowing. However, since it is likely that richer regions have more access to borrowing, the conclusions on equalization are likely to hold. xxvi This report adopts the UNDP procedure for computing HDI. The computation of provincial HDI is based on three indicators: longevity, as measured by life-expectancy at birth; education attainment, as measured by a combination of adult literacy (two-thirds weight) and combined primary, secondary and tertiary enrolment ratios (one-third weight); and standard of living, as measured by real GDP per capita in terms of PPP$. (UNDP, 1999). xxvii This paper broadly defines persons per hospital beds as the number of people per each inpatient bed available in public hospitals, unless specified. In Indonesia, the indicators includes special and general hospitals as well. xxviii This paper broadly defines literacy rate as the percentage of people ages 15 and above who cannot, with understanding, read and write a short, simple statement about their everyday life (World Bank, 2003c). xxix This paper broadly defines life expectancy as the number of years a newborn infant would live if prevailing patterns of mortality at the time of its birth were to stay the same throughout its life (World Bank, 2003c). xxx Variation is measured through the coefficient of variation, which is the standard deviation divided by the average. xxxi Although within countries max-to-min ratios are able to pick up the same trends as more sophisticated measures (e.g. gini coefficient), across countries they are more responsive than other measures to the tail-end of the distribution. xxxii Specification II aims to address the problem of reverse causality between expenditures (=revenues) and outcomes. Otherwise, reverse causality would suggest the possibility that our regression estimates may be upwardly biased. The possible problem of multicollinearity in specification II, then, will later be addressed in the third set of regressions in the paper, when examining a longer time series for China. xxxiii Indeed, expenditures are found to be highly correlated with GPP for China (.67), Indonesia (.42), and Vietnam (.67) with significance at the 1 percent level. In this case, subject to the availability of data, it would be interesting to see if the same results hold at even lower levels of governments. The only exception to the rule is China. xxxiv (World Bank, 2004a). xxxv As demonstrated in the previous set of regressions, life expectancy yields ambiguous results since it is affected by a broad range of factors that are not controlled for in our specifications. Consequently, infant or

Ensuring Inter-regional Equity and Poverty Reduction
29
child mortality would be a better indicator. In the absence of this kind of data, we have to chosen to use combined gross enrollment as our fifth outcome indicator in this third and final set of regressions. xxxvi The only exception to the results is HDI (in specification II), yet this is understandable since GDP is one of its components.


![DU ğ Hunpan1.un.org/intradoc/groups/public/documents/un-dpadm/unpan045740~1.pdf · PK˜˜˜˜˜˜˜˜˜˜!˜İü•7f˜˜˜ ˜˜˜˜˜˜˜[Content_Types].xml](https://static.fdocuments.in/doc/165x107/5d55335788c993f4768b5cb8/du-g-1pdf-pkiue7f-contenttypesxml.jpg)
