ENSCO INTERNATIONAL INCORPORATED
64
>> RIGHT TIME >> RIGHT PLACE >> RIGHT COMPANY 2004 Annual Report ENSCO INTERNATIONAL INCORPORATED
Transcript of ENSCO INTERNATIONAL INCORPORATED

>> R I G H T T I M E >> R I G H T P L A C E >> R I G H T C O M P A N Y
EN
SC
O
IN
TE
RN
AT
IO
NA
L
IN
CO
RP
OR
AT
ED
2004 An
nu
al R
ep
ort
ENSCO International Incorporated
500 North Akard Street
Suite 4300
Dallas, TX 75201-3331
www.enscous.com
2004 Annual Report
E N S C O I N T E R N A T I O N A L I N C O R P O R A T E D

E N S C O B O A R D O F D I R E C T O R S (from left to right):
David M. Carmichael, Thomas L. Kelly II, Gerald W. Haddock, Joel V. Staff, Paul E. Rowsey, III,
Morton H. Meyerson, Rita M. Rodriguez, and Carl F. Thorne
This photograph was taken during a recent Board of Directors’ meeting which was held at our
Europe & Africa Business Unit in Aberdeen, Scotland.
Total Assets$ in millions
2,108.0
E N S C O I N T E R N A T I O N A L I N C O R P O R A T E D I S A P R E M I E R G L O B A L O F F S H O R E O I L A N D G A S
D R I L L I N G C O N T R A C T O R . Our modern fleet of 54 offshore drilling rigs serves most of the major oil and
gas provinces of the world through our three major business units, including North & South America, Europe
& Africa, and Asia & Pacific Rim. The Company is headquartered in Dallas, Texas, and is publicly traded on
the New York Stock Exchange under the symbol of ESV.
2,323.8
3,061.53,183.0
3,322.0
Stockholders’ Equity$ in millions
1,328.91,440.2
1,967.02,081.1
2,181.9
00 01 02 03 04
Net Income$ in millions
85.4
207.3
59.3
108.3 102.8
FINANCIAL HIGHLIGHTS
2004 2003 2002 2001 2000(in millions, except per share amounts and ratios)
Revenues * $ 768.0 $ 781.2 $ 641.6 $ 731.0 $ 473.7Net Income 102.8 108.3 59.3 207.3 85.4Diluted Earnings Per Share 0.68 0.72 0.42 1.50 0.61Working Capital 277.9 355.9 189.2 312.0 171.6Total Assets 3,322.0 3,183.0 3,061.5 2,323.8 2,108.0Long-Term Debt 527.1 549.9 547.5 462.4 422.2Stockholders’ Equity 2,181.9 2,081.1 1,967.0 1,440.2 1,328.9Current Ratio 2.3 2.9 2.0 3.1 2.5Long-Term Debt to Total Capital 0.19 0.21 0.22 0.24 0.24
* During 2004, the Company transferred three rigs (ENSCO 23, ENSCO 24 and ENSCO 55) to a shipyard as partial payment for the construction of a new high performancepremium jackup rig to be named ENSCO 107. The Company’s revenues for each of the years in the five-year period ended December 31, 2004 have been restated to reclassify theoperating results of the ENSCO 23, ENSCO 24 and ENSCO 55 as discontinued operations. During 2003, the Company sold its 27-vessel marine transportation fleet, whichrepresented the entire marine transportation services segment previously reported by the Company. The Company’s revenues for each of the years in the four-year period endedDecember 31, 2003 have been restated to reclassify the operating results of the Company’s marine transportation services segment as discontinued operations.
00 01 02 03 04 00 01 02 03 04

To Our Stockholders:
NSCO generated net income of $103 million on
revenues of $768 million in 2004. The majority
of our markets showed improvement during the
year. However, unexpected softness in the North Sea jackup
market during the summer months and idle time on our
deepwater semisubmersible rig for half of the year, negatively
impacted financial results and provided a false signal in an
otherwise strengthening global offshore drilling market.
The oil and gas industry faces a significant challenge.
The Issue: How to meet the world’s growing demand for
energy after years of under-investment, against a backdrop
of what has always been a steadily depleting resource base.
The Solution: Increase drilling activity to offset depletion
and to ultimately increase oil and gas supply.
We believe our industry is at a positive inflection
point (The Right Time), and that ENSCO is well
positioned (The Right Place) with the requisite People,
Assets, and Operations (The Right Company) to serve
our stakeholders and to benefit from the opportunities that
lie ahead.
We are faced with a significant challenge. The oil and gas
industry must turn to the drill bit to arrest production decline
and to ultimately add supply.
Oil demand is overtaking supply. The global economy
grew at a rapid pace in 2004, spurring the growth rate of oil
demand to levels not seen since the mid-1990’s. In China
alone, oil demand increased by 15% during the year, and
almost two-thirds of future oil demand growth is expected
to be generated by developing countries such as China. This
growth comes at a time when the world’s excess production
capacity is at the lowest level in over a decade. Current
excess production capacity is estimated at approximately
2% of worldwide oil demand, barely enough to meet current
annual growth, and well below the 5% average over the
last five years.
ENSCO International Incorporated 2004 Annual Report > 1
E
E N S C O V I S I O N S T A T E M E N T :
To be The Offshore Driller of
Choice to oil and gas companies
on a global basis. This will
be achieved by consistently
exceeding the expectations of
our customers through the
effective combination of our
People, Equipment, and Expertise.

OPEC Excess Oil Production Capacity Versus Worldwide Demand
World OilDemand
OPECExcess OilProductionCapacity
Source: OPEC, IEA, BP Statistical Review, Simmons & Company International
The challenge to meet the growth in oil demand is
even more significant given that many of the world’s most
prolific oilfields have reached peak production and have
begun to decline. More and more drilling will be required
to offset depletion. As an indication of the urgency of this
challenge, Saudi Arabia reportedly is planning to double its
rig count over the coming months.
Reliability and adequacy of hydrocarbon supply will
remain issues. Political and civil unrest in many resource-
rich regions are growing concerns. For several public
operating companies, closer regulatory scrutiny has forced
reserve adjustments, and production replacement has
proved to be elusive.
While oil will remain the most significant fuel in the
global energy mix for years to come, much of the world is
also turning to natural gas as an environmentally friendly
and cost-efficient supplement. Over the next several decades,
consumption of natural gas is expected to increase, in
absolute terms, more than any other energy source. Major
operating companies are committing billions of dollars to
liquefied natural gas (LNG) and gas-to-liquids (GTL)
projects. There are significant gas reserves to be developed
in the Middle East and the Pacific Rim to support these
projects, and much of this drilling will be done by higher
capacity equipment, primarily jackup rigs.
Increased drilling activity is required as global oil demand continues to grow.
ENSCO International Incorporated 2004 Annual Report> 2
>> T I M E
OPEC excess oil production
capacity declined to a 10-year low
in 2004. Following increases by
Saudi Arabia late in the year, OPEC
surplus capacity is now estimated
at approximately 1.8 million b/d, or
approximately 2% of worldwide
demand, well below the 5%
average over the last five years.
20
30
40
50
60
70
80
90
40200089694929098868482808
De
ma
nd
(M
Mb
/d)
0
2
4
6
8
10
12
14
16
Ex
cess
Ca
pa
city
(M
Mb
/d)

Operating companies are responding to the supply
challenge. In 2005, spending by operators is projected to
increase by over 10% for the third year in a row. In their
quest to offset production declines and increase supply,
major operating companies are targeting promising
international prospects and deeper horizons in mature areas.
Large independent operators are also competing for high-
potential international opportunities as they strive for growth.
National oil companies are also becoming more active as
they pursue energy independence and/or export objectives,
in many cases through alliances with experienced, well-
capitalized mega-majors.
As operators begin to address the supply issue, their
drilling requirements are expanding. In terms of fleet
capability and geography, ENSCO is well positioned to
meet this demand.
With much of the world’s oil discovered years ago,
and particularly with many of the most readily accessible
reservoirs now in steady production decline, operating
companies must resort to reserves that are significantly more
costly and difficult to develop. Access to larger fields will
require drilling to deeper measured depths, at times with
greater horizontal deviation, and in deeper waters. ENSCO
is proactively addressing these trends by increasing its fleet
capability and repositioning rigs into expanding markets.
Fleet Renewal – ENSCO continues to focus on fleet
renewal, encompassing extensive rig enhancement and life
extension, limited new construction, selective rig
acquisitions, and disposition of non-core assets. We have
taken advantage of market cycles, investing counter-
cyclically to minimize upgrade costs and to add new rigs at
economically attractive terms. We firmly believe we have a
sustainable cost advantage, and it is highly unlikely that our
fleet will ever be replicated in terms of cost and capability.
This advantage should position ENSCO to generate superior
future returns.
The challenge to meet the
growth in demand is even more
significant given that many of
the world’s most prolific
oilfields have reached peak
production and have begun to
decline. More and more
drilling will be required to
offset depletion.
Photo courtesy of OMSCO, A ShawCor Company
ENSCO International Incorporated 2004 Annual Report > 3

// NORTH & SOUTH AMERICA // EUROPE & AFRICA // ASIA & PACIFIC RIM
REPRESENT CURRENT AREAS OF OPERATION
ENSCO International Incorporated 2004 Annual Report> 4
>> P L A C E
NORTH AMERICA
18 JACKUP RIGS
1 SEMISUBMERSIBLE
3 PLATFORM RIGS
SOUTH AMERICA
6 BARGE RIGS
EUROPE
7 JACKUP RIGS
AFRICA
1 JACKUP RIG
MIDDLE EAST
AND INDIA
9 JACKUP RIGS
SOUTHEAST ASIA
AND AUSTRALIA
8 JACKUP RIGS
1 BARGE RIG
1 JACKUP RIG UNDER
CONSTRUCTION

We are nearing completion of a jackup rig
enhancement program that we commenced in 1995.
When this initiative is substantially completed in late
2005, we will have invested over $1.2 billion to upgrade
and extend the life of our jackup fleet. During 2004, we
completed a major upgrade on one jackup and minor
enhancements and life extension on another, with seven
projects scheduled to be completed in 2005.
A part of our fleet renewal program has been
accomplished through opportunistic new construction.
We added to our fleet of ultra-high specification jackups
with the delivery of ENSCO 106 in early 2005. ENSCO
107 remains under construction, and is targeted for
completion late this year. Total investment in ENSCO
106 was approximately $108 million, and we expect the
cost of ENSCO 107 to be comparable. A portion of the
ENSCO 107 cost was covered by exchanging older
equipment, thus divesting ourselves of non-core assets, as
we have done historically.
At the conclusion of our rig renewal program, and
upon delivery of ENSCO 107, over half of the Company’s
jackup fleet will be high-specification units (including
nine ultra high-specification rigs), with the remainder
being upgraded premium rigs. All of our rigs will be
environmentally friendly, in terms of single-point discharge,
and most will be outfitted for international service.
In addition to being a leader in the premium jackup
market, we have proven our ability to participate in the
deepwater market through the successful introduction of
the ENSCO 7500. This rig was built for approximately
half of the investment cost of similar modern deepwater
rigs and provides us a sustainable competitive cost
advantage. As the deepwater market continues to grow,
we will actively pursue avenues to efficiently increase our
deepwater presence.
Geographic Positioning – With the extensive capital
investment and long lead-time involved in the LNG and
GTL programs in the Middle East and the Pacific Rim, gas
development and the associated drilling must proceed so
that return objectives can be realized. Recognizing this
opportunity, ENSCO relocated three jackup rigs from the
Gulf of Mexico during 2004, with two rigs mobilizing to
ENSCO International Incorporated 2004 Annual Report > 5
Major operating companies are
committing billions of dollars to
LNG and GTL projects. There
are significant gas reserves to
be developed in the Middle East
and the Pacific Rim to support
these projects, and much of this
drilling will be done by higher
capacity equipment, primarily
jackup rigs.
ENSCO is proactive in enhancing fleet capability and repositioning
rigs into expanding markets.

the Middle East and one to Southeast Asia. All three rigs
secured term contracts, with higher day rates than were
available in the Gulf of Mexico. Early in 2005, another
ENSCO rig was mobilized from Trinidad to the Gulf of
Mexico to undergo modifications before relocation to the
Middle East to commence a long-term contract. This
redeployment of assets allows us to take advantage of strong
long-term work opportunities and to improve our
geographic balance.
With the growing backlog of work in the Middle East,
and the importance of the region in terms of global
hydrocarbon supply, last year we established our Asia &
Pacific Rim headquarters in Dubai, U.A.E. This is in addition
to a regional Southeast Asia office we continue to maintain
in Singapore to support our Pacific Rim operations.
ENSCO is committed to offering exemplary service to our
customers, providing a safe and challenging work
environment for our employees, and rewarding our
stockholders, both now and in the future.
Since inception in 1987, ENSCO has made significant
progress relative to the expansion and renewal of our asset
base, in terms of capability and global presence. Our jackup
fleet is now one of the largest, most versatile, and capable
fleets in the world. When compared to other publicly
traded offshore drilling contractors, it is currently the
youngest fleet (based on original delivery dates). This does
ENSCO International Incorporated 2004 Annual Report> 6
>> P E O P L E
C O R E V A L U E S
Ethical behavior as individuals and as an organization
No harm to people, property, or to the environment
Superior operating performance
Can-do attitude
Outstanding commitment to all stakeholders

not take into account the impact of significant enhancement
and life extension work on our jackup rigs, which would
make this comparison even more favorable to ENSCO.
Operational Excellence – ENSCO goes beyond being a
provider of superior equipment. Customer satisfaction is
realized by achieving operational excellence, with exemplary
safety and environmental records, and superior service and rig
performance. In 2004, ENSCO significantly out-performed
the industry safety average, and incurred the fewest number of
recordable and lost-time incidents in the Company’s history.
ENSCO 96, a jackup rig working in Qatar, was recognized by
a major operator as “Jackup Rig of the Year”, the second year
in a row that an ENSCO rig was awarded this honor. While
we achieved record low incident rates, we are not satisfied, and
have implemented an aggressive program designed to ensure
ongoing improvement. We continue to work toward our
ultimate goal of “zero incidents.”
During the year, our environmental management
system received ISO 14001 certification for all rigs in
our Europe & Africa Business Unit, as well as several rigs
in our North & South America Business Unit. Ultimately,
we intend for all of our operations to meet the same
high standards.
Outstanding rig performance can only be achieved
with superior equipment, operated by skilled and
motivated personnel. ENSCO has invested significantly
to increase rig capability, efficiency, and safety. The
Company also continues to invest in programs designed
to better train, develop, and motivate personnel. By way
of example, we developed a proprietary skill-based learning
program in our North & South America Business Unit.
Rig personnel can become certified in their specific roles
through a means of self-study, testing, and supervisor
review. The program is also a study tool for employees
pursuing advancement opportunity.
Looking Ahead – ENSCO’s business approach strikes
a balance between fleet growth and financial returns. We
employ an innovative and disciplined approach to fleet
renewal and pursuit of excellence in day-to-day operations.
We are among the most cost-efficient and return-conscious
contractors in the industry, consistently generating high
relative margins and competitive returns.
ENSCO International Incorporated 2004 Annual Report > 7
Customer satisfaction is
realized through achieving
operational excellence. In 2004,
ENSCO significantly out-
performed the industry safety
average, and incurred the
fewest number of recordable
and lost-time incidents in the
Company’s history.
Outstanding rig performance can only be achieved with superior
equipment, operated by skilled and motivated personnel.

We have built a significant asset base in a very
careful and deliberate manner. At the end of 2004, cash
and temporary investments were $267 million, and our
long-term debt ratio was below 20%, the lowest level
since the early nineties. All of this occurred
notwithstanding the substantial level of capital deployed
relative to our growth and renewal initiatives. Our
balance sheet affords us great flexibility as we continue
to build our asset base.
In 2004, much was accomplished. With the
increasing demand for high-specification rigs, firming
contract backlog, and rising rig day rates, our fleet
renewal and relocation initiatives are paying dividends.
We are, however, constantly reminded that our work is
never done. Our strategic goals which provide a roadmap
to achieving industry-leading performance, are to:
• Realize continuous improvement from operational
excellence initiatives;
• Position ENSCO as The Contractor of Choice by
providing superior equipment, operated by well-trained
and motivated personnel, who conduct operations in a
safe, efficient, and environmentally responsible manner;
• Successfully attract, train, develop, motivate, and
retain employees;
• Continue to rationalize and upgrade the Company’s
asset base in a disciplined manner, so as to enhance
long-term shareholder value; and
• Establish and maintain consistency in practices,
policies, and procedures on a global basis, so as to
ensure consistent and repeatable levels of service.
ENSCO is prepared to meet our customers’ ever
expanding drilling requirements, particularly in terms of
quality and demanding applications. We believe ENSCO is
the Right Company to deliver the greatest ultimate benefit
to all stakeholders, now and in the future.
ENSCO International Incorporated 2004 Annual Report> 8
>> C O M P A N Y
Carl F. ThorneChairman of the Board and Chief Executive OfficerMarch 1, 2005
We believe ENSCO is the Right Company to deliver the greatest
ultimate benefit to all stakeholders, now and in the future.

ENSCO International Incorporated 2004 Annual Report > 9
F I N A N C I A L T A B L E O F C O N T E N T S
2 00 4 >> R E S U L T S
ENSCO has built a significant
asset base in a very careful and
deliberate manner. With the
increasing demand for high-
specification rigs, firming
contract backlog, and rising rig
day rates, our fleet renewal
and relocation initiatives are
paying dividends.
// 10OffshoreEquipment Listing
// 12Operating Statistics
// 13Management’sDiscussion andAnalysis ofFinancial Conditionand Results ofOperations
// 29Management’sReport on InternalControl overFinancial Reporting
// 30Reports ofIndependentRegistered PublicAccounting Firm
// 33ConsolidatedBalance Sheets
// 34ConsolidatedStatements of Cash Flows
// 35Notes toConsolidatedFinancialStatements
// 56SelectedConsolidatedFinancial Data
// 32ConsolidatedStatements of Income

ENSCO International Incorporated 2004 Annual Report> 10
Offshore Equipment Listing
JACKUP RIGSYear Maximum Water Customer
Rig Name Built/Rebuilt Rig Make Depth/Drilling Depth Current Location as of 2/15/05
North AmericaENSCO 60 1981/2003 Lev-111-C 300'/25,000' Gulf of Mexico Taylor EnergyENSCO 64 1973/2002 MLT-53-S 350'/30,000' Gulf of Mexico Shipyard(1)
ENSCO 68 1976/2004 MLT-116-CE 400'/30,000' Gulf of Mexico Pogo ProducingENSCO 69 1976/1995 MLT-84-S 400'/25,000' Gulf of Mexico LLOGENSCO 74 1999 MLT Super 116-C 400'/30,000' Gulf of Mexico SpinnakerENSCO 75 1999 MLT Super 116-C 400'/30,000' Gulf of Mexico Devon EnergyENSCO 76 2000 MLT Super 116-C 350'/30,000' Gulf of Mexico Committed(2)
ENSCO 81 1979/2003 MLT-116-C 350'/30,000' Gulf of Mexico BPENSCO 82 1979/2003 MLT-116-C 300'/30,000' Gulf of Mexico ChevronTexacoENSCO 83 1979 MLT-82 SD-C 250'/25,000' Gulf of Mexico ExxonMobilENSCO 84 1981/2005 MLT-82 SD-C 250'/25,000' Gulf of Mexico ShipyardENSCO 86 1981 MLT-82 SD-C 250'/30,000' Gulf of Mexico ExxonMobilENSCO 87 1982 MLT-116-C 350'/25,000' Gulf of Mexico SenecaENSCO 89 1982 MLT-82 SD-C 250'/25,000' Gulf of Mexico LLOGENSCO 90 1982/2002 MLT-82 SD-C 250'/25,000' Gulf of Mexico SantosENSCO 93 1982/2002 MLT-82 SD-C 250'/25,000' Gulf of Mexico Hunt OilENSCO 98 1977/2003 MLT-82 SD-C 250'/25,000' Gulf of Mexico Devon EnergyENSCO 99 1985 MLT-82 SD-C 250'/30,000' Gulf of Mexico ShipyardENSCO 105 2002 KFELS-MOD V-B 400'/30,000' Gulf of Mexico Millennium
Europe/AfricaENSCO 70 1981/1996 Hitachi-K1032N 250'/30,000' Denmark DONGENSCO 71 1982/1995 Hitachi-K1032N 225'/25,000' Denmark MaerskENSCO 72 1981/1996 Hitachi-K1025N 225'/25,000' United Kingdom ExxonMobilENSCO 80 1978/1995 MLT-116-CE 225'/30,000' United Kingdom ADTI/NewfieldENSCO 85 1981/1995 MLT-116-C 225'/25,000' United Kingdom BHPBENSCO 92 1982/1996 MLT-116-C 225'/25,000' United Kingdom ConocoPhillipsENSCO 100 1987/2000 MLT-150-88-C 350'/30,000' Nigeria ExxonMobilENSCO 101 2000 KFELS-MOD V-A 400'/30,000' Denmark ConocoPhillips
Asia PacificENSCO 50 1983/1998 FG-780II-C 300'/25,000' India British GasENSCO 51 1981/2002 FG-780II-C 300'/25,000' Brunei ShellENSCO 52 1983/1997 FG-780II-C 300'/25,000' Malaysia Petronas CarigaliENSCO 53 1982/1998 FG-780II-C 300'/25,000' Qatar Ras GasENSCO 54 1982/1997 FG-780II-C 300'/25,000' Qatar Ras GasENSCO 56 1982/1997 FG-780II-C 300'/25,000' Australia ROCENSCO 57 1982/2003 FG-780II-C 300'/25,000' Malaysia MurphyENSCO 67 1976/1996 MLT-116-CE 400'/30,000' Singapore ShipyardENSCO 88 1982/2004 MLT-82 SD-C 250'/25,000' Qatar Ras GasENSCO 94 1981/2001 Hitachi-250-C 250'/25,000' Qatar Ras GasENSCO 95 1981/2005 Hitachi-250-C 250'/25,000' Pakistan PPLENSCO 96 1982/1997 Hitachi-250-C 250'/25,000' Qatar Ras GasENSCO 97 1980/1997 MLT-82 SD-C 250'/25,000' Qatar QPDENSCO 102 2002 KFELS-MOD V-A 400'/30,000' Australia ExxonMobilENSCO 104 2002 KFELS-MOD V-B 400'/30,000' East Timor ConocoPhillipsENSCO 106 2005 KFELS-MOD V-B 400'/30,000' Australia Apache(3)
ENSCO 107 2005 KFELS-MOD V-B 400'/30,000' Singapore Under construction
ENSCO International Incorporated 2004 Annual Report> 10

ENSCO International Incorporated 2004 Annual Report > 11
Offshore Equipment Listing
SEMISUBMERSIBLE RIGMaximum Water Customer
Rig Name Year Built Rig Type Depth/Drilling Depth Current Location as of 2/15/05
ENSCO 7500 2000 Dynamically Positioned 8,000'/30,000' Gulf of Mexico Dominion
BARGE RIGSMaximum Customer
Rig Name Year Built Drilling Depth Current Location as of 2/15/05
ENSCO I 1999 30,000' Indonesia TotalENSCO II 1999 30,000' Venezuela ShellENSCO III 1999 30,000' Venezuela ChevronTexacoENSCO XI 1994 25,000' Venezuela Stacked(4)
ENSCO XII 1994 25,000' Venezuela Available(4)
ENSCO XIV 1994 25,000' Venezuela Stacked(4)
ENSCO XV 1994 25,000' Venezuela Stacked(4)
PLATFORM RIGSYear Built/ Maximum Customer
Rig Name Rebuilt Drilling Depth Current Location as of 2/15/05
ENSCO 25 1980/1998 30,000' Gulf of Mexico ChevronTexaco(5)
ENSCO 26 1982/1999 30,000' Gulf of Mexico Available(4)
ENSCO 29 1981/1997 30,000' Gulf of Mexico Taylor
Notes:(1) ENSCO 64 is in a shipyard undergoing analysis of the damage caused by Hurricane Ivan. (See Note 13 to the Company’s consolidated financial statements.)
(2) ENSCO 76 is in a shipyard preparing for a three-year contract with Aramco that is scheduled to commence in June 2005 offshore Saudi Arabia.
(3) Construction of ENSCO 106 was completed on February 7, 2005 in Singapore. The rig is currently under mobilization to perform a one-year contract for Apache that isscheduled to commence in March 2005 offshore Australia.
(4) Rigs classified as available are being actively marketed and can commence work on short notice. Stacked rigs do not have operating crews immediately available and mayrequire some recommissioning before commencing operations.
(5) ENSCO 25 is currently undergoing repairs for damage sustained by Hurricane Ivan. The rig is currently receiving a standby rate and repairs are expected to be completedin late February 2005, at which time it will resume drilling operations for ChevronTexaco.
ENSCO International Incorporated 2004 Annual Report > 11

ENSCO International Incorporated 2004 Annual Report> 12
Operating Statistics
The following table provides information regarding the Company’s contract drilling services from continuing operations foreach of the years in the five-year period ended December 31, 2004. Previously reported rig utilization and average day rateshave been revised to reflect the removal of the activity associated with one jackup rig and two platform rigs sold in May 2004.
2004 2003 2002(1) 2001 2000
Rig utilization:(2)
Jackup rigsNorth America 84% 86% 87% 82% 99%Europe/Africa 82% 93% 81% 88% 59%Asia Pacific 82% 82% 78% 96% 73%South America/Caribbean 97% 99% 100% – –
Total jackup rigs 84% 86% 84% 86% 85%Semisubmersible rig – North America 51% 96% 92% 92% 77%Barge rig – Asia Pacific(3) 100% 99% 40% – –Barge rigs – South America/Caribbean 15% 20% 17% 34% 33%Platform rigs 40% 67% 95% 64% 50%
Total 73% 78% 75% 75% 72%
Average day rates:(4)
Jackup rigsNorth America $ 42,006 $ 31,679 $ 26,939 $ 46,783 $ 34,982Europe/Africa 60,542 64,615 74,759 65,172 38,560Asia Pacific 63,226 63,154 58,836 42,313 37,548South America/Caribbean 87,529 86,381 77,223 – –
Total jackup rigs 53,429 48,428 45,798 50,045 35,945Semisubmersible rig – North America 123,988 188,335 185,655 180,146 173,905Barge rig – Asia Pacific(3) 48,317 41,333 41,750 – –Barge rigs – South America/Caribbean 37,437 39,475 39,987 42,553 39,897Platform rigs 29,401 26,124 25,852 27,751 24,713
Total $ 53,416 $ 50,393 $ 48,128 $ 50,997 $ 35,806
(1) Rig utilization and average day rates include the results of the five jackup rigs obtained in the Chiles acquisition from the August 7, 2002 acquisition date.
(2) Utilization is the ratio of aggregate contract days divided by the number of days in the period.
(3) The Company mobilized a barge rig from Venezuela to Indonesia that commenced a long-term contract in December 2002.
(4) Average day rates are derived by dividing contract drilling revenue by the aggregate number of contract days, adjusted to exclude certain types of non-recurringreimbursable revenue and lump sum revenue and contract days associated with certain mobilizations, demobilizations, shipyard contracts and standby contracts.
ENSCO International Incorporated 2004 Annual Report> 12

Management’s Discussion and Analysis of Financial Condition and Results of Operations
INTRODUCTION
ENSCO International Incorporated and subsidiaries (“ENSCO” or the “Company”) is an international offshore contractdrilling company with a fleet of 54 drilling rigs, including 43 jackup rigs, seven barge rigs, three platform rigs and onesemisubmersible rig. The Company’s offshore contract drilling operations are integral to the exploration, development andproduction of oil and natural gas and the Company is one of the leading providers of offshore drilling services to theinternational oil and gas industry.
The Company drills and completes oil and gas wells under contracts with major international, government-owned andindependent oil and gas companies. The drilling services provided by the Company are conducted on a “day rate” contractbasis, under which the Company provides its drilling rigs and rig crews and receives a fixed amount per day for drillingwells. The customer bears substantially all of the ancillary costs of constructing the wells and supporting drilling operations,as well as the economic risk relative to the success of the wells.
Financial operating results in the offshore contract drilling industry have historically been very cyclical and are primarilyrelated to the demand for drilling rigs and the available supply of rigs. Demand for rigs is directly related to the regional andworldwide levels of offshore exploration and development spending by oil and gas companies, which is beyond the control ofthe Company. Offshore exploration and development spending may fluctuate substantially from year to year and from regionto region. Such spending fluctuations result from many factors, including:
• demand for oil and gas,• regional and global economic conditions and expected changes therein,• political and legislative environments in the U.S. and other major oil-producing countries,• production levels and related activities of OPEC and other oil and gas producers, and• the impact that these and other events have on the current and expected future pricing of oil and natural gas.
The supply of drilling rigs is limited and new rigs require a substantial capital investment and a long period of time toconstruct. In addition, it is time consuming and costly to move rigs between markets. Accordingly, as demand changes in aparticular market, the supply of rigs may not adjust quickly, and therefore the utilization and day rates of rigs could fluctuatesignificantly.
Since factors that affect offshore exploration and development spending are beyond the control of the Company and rigdemand can change quickly, it is difficult for the Company to predict industry conditions or trends in operating results.Periods of low demand result in excess rig supply, which generally reduces rig utilization levels and day rates; periods of highdemand tighten rig supply, generally resulting in increased rig utilization levels and day rates.
The Company’s drilling rigs are deployed throughout the world, with drilling operations concentrated in the majorgeographic regions of North America, Europe/Africa, Asia Pacific (which includes Asia, the Middle East and Australia) and South America/Caribbean. The Company competes with other offshore drilling contractors on the basis of price, qualityof service, operational and safety performance, equipment suitability and availability, reputation and technical expertise.Competition is usually on a regional basis, but offshore drilling rigs are mobile and may be moved from one region toanother in response to demand.
BUSINESS ENVIRONMENT
The Company’s domestic offshore drilling operations are conducted in the Gulf of Mexico. The U.S. natural gas market andtrends in oil and gas company spending largely determine domestic offshore drilling industry conditions. The explorationand development spending budgets of most companies drilling in the Gulf of Mexico were reduced from historical levelsduring 2002 and demand for jackup drilling rigs in the Gulf of Mexico was significantly lower than in prior years. Whilesome jackup rigs departed the Gulf of Mexico for international service during 2002, the supply of jackup rigs remained inexcess of demand. As a result of this imbalance, day rates were significantly lower in 2002 as compared to prior years. Duringthe first half of 2003, demand for jackup rigs in the Gulf of Mexico decreased from the already-reduced 2002 levels, as oiland gas companies focused more of their spending on international projects. However, demand began to improve in thesecond half of 2003, as the supply of jackup rigs in the Gulf of Mexico declined after some of the Company’s competitorsmobilized rigs to international markets in response to contract opportunities. Day rates for Gulf of Mexico jackup rigs beganto increase during the second half of 2003, due primarily to the reduction in the supply of rigs. The supply of jackup rigs inthe Gulf of Mexico declined further during 2004, as the Company and some of its competitors mobilized additional rigs tointernational markets. Demand for jackup rigs in the Gulf of Mexico improved significantly during the second half of 2004due to both the reduced supply of rigs and increased spending by oil and gas companies. During the first six months of2004, jackup day rate trends were mixed, with day rates for the larger premium jackup rigs decreasing slightly from year-end2003 levels due to a modest oversupply of larger rigs, while day rates for smaller jackup rigs increased slightly from year-end2003 rates. However, average day rates for jackup rigs in the Gulf of Mexico improved significantly during the second half of2004, as a result of the increased demand.
ENSCO International Incorporated 2004 Annual Report > 13

In Europe, jackup rig demand and day rates during 2002 were improved over comparable levels in prior years, dueprimarily to increased spending by oil and gas companies. However, during the latter part of 2002 both demand and dayrates began to decline. Demand and day rates for jackup rigs in Europe remained fairly stable over the first half of 2003, asthe impact of reduced spending by oil and gas companies was offset by a reduction in the supply of rigs after some of theCompany’s competitors mobilized rigs to stronger markets. During the second half of 2003, reduced oil and gas companyspending resulted in limited term work opportunities and jackup day rates in Europe declined. During 2004, demand andday rates for jackup rigs in Europe generally remained at reduced levels, but in recent months demand and day rates havebegun to improve.
Demand for jackup rigs in most Asia Pacific region markets has been strong during 2002, 2003 and 2004, as many ofthe major international and government-owned oil companies increased spending in those markets. Day rates for Asia Pacific jackup rigs improved during much of 2002 as a result of the increased demand. However, Asia Pacific region dayrates remained relatively stable over the course of 2003 and 2004, as the Company and some of its competitors mobilizedadditional rigs to the region in response to the increased demand.
RESULTS OF OPERATIONS
In May 2004, the Company transferred three rigs (ENSCO 23, ENSCO 24 and ENSCO 55) to Keppel FELS Limited(“KFELS”) as partial payment for the construction of a new high performance premium jackup rig that is scheduled fordelivery in late 2005 or early 2006. The results of operations of ENSCO 23, ENSCO 24 and ENSCO 55 have beenreclassified as discontinued operations in the consolidated statements of income for each of the years in the three-year periodended December 31, 2004.
In April 2003, the Company sold its 27-vessel marine transportation fleet. The results of operations of the marinetransportation fleet have been reclassified as discontinued operations in the consolidated statements of income for each of theyears in the two-year period ended December 31, 2003.
In August 2002, the Company completed its merger with Chiles Offshore Inc. (“Chiles”), which was accounted for as apurchase business combination in accordance with generally accepted accounting principles in the United States, with theCompany treated as the acquirer. The Company’s financial statements include the operating results of Chiles from the August7, 2002 acquisition date. The acquired Chiles operations consisted of a fleet of five high performance premium jackup rigs,including two rigs operating in the Gulf of Mexico, one rig operating offshore Australia, one rig operating offshore Trinidadand Tobago, and one rig under construction that subsequently entered service in the Gulf of Mexico during December 2002.
The Company’s consolidated operating results for each of the years in the three-year period ended December 31, 2004,are as follows (in millions):
2004 2003 2002
Revenues $768.0 $781.2 $641.6Operating expenses
Contract drilling 425.5 445.2 341.5Depreciation and amortization 144.1 130.2 112.0Impairment of assets – – 59.9General and administrative 26.3 22.0 18.6
Operating income 172.1 183.8 109.6Other expense, net (32.6) (31.6) (19.6)Provision for income taxes 36.0 43.1 28.8Income from continuing operations 103.5 109.1 61.2Loss from discontinued operations (.7) (.8) (1.9)Net income $102.8 $108.3 $ 59.3
In 2004, net income for the Company decreased by $5.5 million, or 5%, and operating income decreased by $11.7million, or 6%, as compared to 2003. These decreases are due primarily to reduced utilization and average day rates for theEurope/Africa jackup rigs and ENSCO 7500, partially offset by increased average day rates for the North America jackup rigs and increased operating days for the Asia Pacific jackup rigs.
ENSCO International Incorporated 2004 Annual Report> 14

In 2003, net income for the Company increased by $49.0 million, or 83%, and operating income increased by $74.2 million, or 68%, as compared to 2002. These increases are due primarily to a $59.9 million impairment charge in 2002 relating to the Company’s Venezuela-based assets and the addition of the five rigs obtained as part of the Chilesacquisition during the third quarter of 2002. Approximately $13.0 million of the $74.2 million increase in operating income is attributable to the five rigs acquired from Chiles.
Detailed explanations of the Company’s operating results for each of the years in the three-year period ended December31, 2004, including discussions of revenues and contract drilling expense based on geographical location and type of rig, areset forth below.
Revenues and Contract Drilling ExpenseThe following is an analysis of the Company’s revenues and contract drilling expense for each of the years in the three-yearperiod ended December 31, 2004 (in millions):
2004 2003 2002
RevenuesJackup rigs:
North America $255.5 $213.8 $164.3Europe/Africa 146.0 179.7 180.6Asia Pacific 268.8 233.3 182.1South America/Caribbean 31.5 32.4 11.4
Total jackup rigs 701.8 659.2 538.4Semisubmersible rig – North America 23.8 66.2 61.6Barge rig – Asia Pacific 18.0 19.5 2.5Barge rigs – South America/Caribbean 13.7 18.2 17.7Platform rigs – North America 10.7 18.1 21.4
Total $768.0 $781.2 $641.6
Contract Drilling ExpenseJackup rigs:
North America $137.4 $145.1 $121.6Europe/Africa 95.8 99.2 81.8Asia Pacific 136.2 134.1 81.4South America/Caribbean 12.5 13.3 5.3
Total jackup rigs 381.9 391.7 290.1Semisubmersible rig – North America 15.8 19.4 21.6Barge rig – Asia Pacific 8.9 11.4 2.8Barge rigs – South America/Caribbean 10.2 11.8 13.7Platform rigs – North America 8.7 10.9 13.3
Total $425.5 $445.2 $341.5
ENSCO International Incorporated 2004 Annual Report > 15

An analysis of rig utilization and average day rates for each of the years in the three-year period ended December 31,2004, based on geographical location and type of rig, are included in the accompanying table of Operating Statistics. Thefollowing is an analysis of the Company’s offshore drilling rigs at December 31, 2004, 2003 and 2002:
2004 2003 2002
Jackup rigs:North America(1)(2) 18 21 21Europe/Africa 8 8 8Asia Pacific(1) 15 12 12South America/Caribbean 1 1 1
Total jackup rigs 42 42 42Semisubmersible rig – North America 1 1 1Barge rig – Asia Pacific 1 1 1Barge rigs – South America/Caribbean 6 6 6Platform rigs – North America(3) 3 3 3
Total(4) 53 53 53
(1) During 2004, the Company mobilized one jackup rig from the Gulf of Mexico to a shipyard in Singapore and two jackup rigs from the Gulf of Mexico to a shipyard inthe Middle East for enhancement procedures before being deployed in the Asia Pacific region. At December 31, 2004, the jackup rig in Singapore remains in the shipyardand will be available in May 2005. One of the jackup rigs in the Middle East commenced drilling operations in November 2004 in Qatar while the other commenceddrilling operations in February 2005 in Pakistan.
(2) Excludes the jackup rig ENSCO 55, which was operating in North America at December 31, 2003 and 2002 but was sold in connection with the execution of a rigconstruction agreement during the second quarter of 2004, and its operating results have been reclassified as discontinued operations.
(3)Excludes the platform rigs ENSCO 23 and ENSCO 24, which were available for operations in North America at December 31, 2003 and 2002 but were sold inconnection with the execution of a rig construction agreement during the second quarter 2004, and their operating results have been reclassified as discontinued operations.
(4)The total number of rigs excludes ENSCO 106 and ENSCO 107. ENSCO 106, which was owned by a joint venture in which the Company held a 25% interest, wasunder construction at December 31, 2004 and was acquired by the Company in February 2005. ENSCO 107, which commenced construction during the first quarter of2004, is expected to enter service in late 2005 or early 2006.
North America Jackup RigsIn 2004, revenues for the North America jackup rigs increased by $41.7 million, or 20%, and contract drilling expensesdecreased by $7.7 million, or 5%, as compared to 2003. The increase in revenues is due primarily to a 33% increase in theaverage day rates, partially offset by decreased revenue attributable to the reduced size of the Company’s North Americajackup rig fleet in 2004 resulting from the relocation of three jackup rigs from the Gulf of Mexico. The significant increasein average day rates is primarily attributable to a reduction in supply of Gulf of Mexico jackup rigs resulting from therelocation of several rigs by the Company and its competitors to international markets in the latter half of 2003 and in 2004.Although supply and demand factors have improved, short-term contracts remain prevalent in the Gulf of Mexico jackupmarket, and it is not possible to determine whether the current increasing day rate trend will continue. The slight decrease incontract drilling expense is primarily attributable to the reduced size of the fleet in 2004 and reduced insurance costs,partially offset by $4.0 million of costs incurred in 2004 in connection with the termination of a rig transportation contractand related costs of assisting tugs and ancillary activities associated with the delayed relocation of two jackup rigs from theGulf of Mexico to the Middle East and increased personnel costs.
In 2003, revenues for the North America jackup rigs increased by $49.5 million, or 30%, and contract drilling expensesincreased by $23.5 million, or 19%, as compared to 2002. The increases were due primarily to the addition of three rigs tothe North America jackup rig fleet in the third quarter of 2002 as a result of the Chiles acquisition. During 2003, thesethree rigs generated an aggregate $42.7 million of revenues and $29.8 million of contract drilling expenses compared to anaggregate of $18.1 million of revenues and $9.3 million of contract drilling expenses for the last five months of 2002.Excluding the impact of the three additional rigs, revenues increased by $24.9 million, or 17%, and contract drillingexpenses increased by $3.0 million, or 3%, as compared to 2002. The $24.9 million increase in revenues was primarilyattributable to an 18% increase in average day rates, and to a lesser extent, increased mobilization revenue. The $3.0 millionincrease in contract drilling expenses was due primarily to increased mobilization and personnel costs, partially offset by theimpact of decreased utilization. The majority of the average day rate improvement is attributable to increased day ratesduring the third and fourth quarters of 2003, which was driven primarily by a reduction in supply of Gulf of Mexico jackuprigs resulting from the relocation of certain rigs by the Company’s competitors to international markets, increasing thedemand and day rates for rigs remaining in the Gulf of Mexico.
ENSCO International Incorporated 2004 Annual Report> 16

Europe/Africa Jackup RigsIn 2004, revenues for the Europe/Africa jackup rigs decreased by $33.7 million, or 19%, and contract drilling expensesdecreased by $3.4 million, or 3%, as compared to 2003. The decrease in revenues is primarily attributable to a 6% decrease inthe average day rates and a reduction in utilization to 82% in 2004 from 93% in 2003. The decrease in average day rates andutilization is due to market weakness in the North Sea that began during the latter part of 2003 and continued throughout2004. Although there are indications that spending by oil and gas companies in the North Sea is beginning to increase, it isnot possible to determine if this trend will continue or if demand for jackup rigs in the North Sea will improve. Contractdrilling expense decreased from the prior year period primarily due to reduced repair and insurance costs as well as $900,000of expenses associated with a crane failure during the prior year, partially offset by increased personnel costs.
In 2003, revenues for the Europe/Africa jackup rigs decreased by $900,000 and contract drilling expenses increased by$17.4 million, or 21%, as compared to 2002. The decrease in revenues was primarily attributable to 14% decrease in averageday rates partially offset by an increase in utilization to 93% in 2003 from 81% in 2002. The majority of the decrease inaverage day rates occurred during the third and fourth quarters of 2003 and resulted primarily from limited term workopportunities in the North Sea. The majority of the increase in utilization is attributable to a reduction in the amount oftime rigs spent in shipyards undergoing enhancement, regulatory work and contract preparation, from 300 rig days in 2002to 97 rig days in 2003. The increase in contract drilling expenses was due primarily to the impact of increased utilizationand, to a lesser extent, the increased cost structure associated with ENSCO 100, which operated offshore Nigeria for twelvemonths in 2003 compared to only five months during 2002. Contract drilling expenses for ENSCO 100 run 20% to 30%higher in Nigeria as compared to the North Sea due to higher transportation, freight and shore base support costs.
Asia Pacific Jackup RigsIn 2004, revenues for the Asia Pacific jackup rigs increased by $35.5 million, or 15%, and contract drilling expensesincreased by $2.1 million, or 2%, as compared to 2003. The increase in revenues is primarily due to improved utilization andincreased revenues associated with reimbursed costs. The Company relocated three rigs to the Asia Pacific region during2004, including two rigs undergoing enhancement procedures since arrival that remained in shipyards at year-end, and athird rig that commenced operations in November after completing enhancement procedures. Excluding the impact of thesethree rigs, utilization of the remaining 12 rigs in the Asia Pacific jackup rig fleet increased to 93% in 2004 from 82% in2003. The improved utilization resulted from a reduction in the amount of time rigs spent in shipyards undergoingenhancements and contract preparation during 2004 compared to 2003. The increase in contract drilling expense is primarilyattributable to $6.7 million of costs associated with the three rigs added to the Asia Pacific fleet in 2004, the impact ofincreased utilization of the remaining rigs in the fleet and increased mobilization and reimbursable expenses, partially offsetby a $13.4 million decrease in costs associated with the ENSCO 102 joint venture charter operations, which ceased effectiveJanuary 31, 2004 upon ENSCO’s acquisition of the rig from the joint venture, and a decrease in insurance expense.
In 2003, revenues for the Asia Pacific jackup rigs increased by $51.2 million, or 28%, and contract drilling expensesincreased by $52.7 million, or 65%, as compared to 2002. The increases were due primarily to the addition of ENSCO 102and ENSCO 104 to the Asia Pacific jackup rig fleet in the third quarter of 2002. During 2003, these rigs generated anaggregate $68.0 million of revenues and $46.6 million of contract drilling expenses, including a net $14.6 million ofcontract drilling expenses associated with the ENSCO 102 joint venture charter operations, compared to an aggregate of$22.9 million of revenues and $11.8 million of contract drilling expenses for the last five months of 2002. Excluding theimpact of ENSCO 102 and ENSCO 104 from the Asia Pacific jackup rig fleet operations, revenues increased by $6.1 million,or 4%, and contract drilling expenses increased by $17.9 million, or 26%, from 2002. The $6.1 million increase in revenueswas primarily attributable to an increase in mobilization revenue during 2003. The $17.9 million increase in contractdrilling expenses was due primarily to increased contract drilling expenses associated with ENSCO 51, which was fullyutilized during 2003, but incurred minimal contract drilling expenses while in a shipyard during the majority of 2002, theincreased cost structure associated with ENSCO 53, which operated offshore Australia during 2003 as compared to operatingoffshore Thailand during 2002, and increased personnel and repair expenses associated with the remaining rigs in the fleet.
South America/Caribbean Jackup RigIn 2004, revenues for the South American/Caribbean jackup rig decreased by $900,000, or 3%, and contract drillingexpenses decreased by $800,000, or 6%, as compared to 2003. The decrease in revenues is primarily due to a decrease inrevenue associated with reimbursed costs. The decrease in contract drilling expense is due primarily to minor decreases in personnel, repair and maintenance, insurance and reimbursable expenses.
ENSCO International Incorporated 2004 Annual Report > 17

In 2003, revenues for the South America/Caribbean jackup rig increased by $21.0 million, or 184%, and contractdrilling expenses increased by $8.0 million, or 151%, as compared to 2002. The increases are due to a full year of contractoperations in 2003 compared to 146 days of contract operations in 2002 as the jackup rig was acquired in connection withthe Chiles acquisition on August 7, 2002.
North America Semisubmersible RigIn 2004, revenues for ENSCO 7500 decreased by $42.4 million, or 64%, and contract drilling expenses decreased by $3.6 million, or 19%, as compared to 2003, as the rig completed an approximate three-year contract in the first quarter of2004 and was idle approximately six months while completing minor improvements, regulatory inspection, maintenance and repair procedures during 2004.
In 2003, revenues for ENSCO 7500 increased by $4.6 million, or 7%, and contract drilling expenses decreased by $2.2 million, or 10%, as compared to 2002. The increase in revenues was due primarily to an increase in utilization to 96%in 2003 from 92% in 2002 and to a lesser extent, a 1% increase in the average day rate. The rig experienced down timeduring 2002 to undergo hull repairs. The decrease in contract drilling expenses was due primarily to costs related to theaforementioned hull repairs incurred in 2002.
Asia Pacific Barge RigIn 2004, revenues for the Asia Pacific barge rig decreased by $1.5 million, or 8%, and contract drilling expenses decreased by$2.5 million, or 22%, as compared to 2003. The decrease in revenues is primarily due to a $4.0 million decrease in revenuesassociated with mobilization and other customer reimbursements in 2003 relating to costs associated with initial contractoperations, partially offset by a 17% increase in the average day rate of ENSCO I. The decrease in contract drilling expense isdue primarily to a reduction in the aforementioned reimbursed costs.
In 2003, revenues and contract drilling expenses for the Asia Pacific barge rig increased by $17.0 million and $8.6 million,respectively, as compared to 2002. The increases were due to a full year of contract operations in Indonesia during 2003compared to 138 days of mobilization and shipyard activity in 2002, as ENSCO I was mobilized from Venezuela in August2002 to a shipyard in Singapore for modifications and enhancements to fulfill a long-term contract in Indonesia. Shipyardmodifications were completed, and contract operations commenced, in late December 2002. Substantially all of the $2.5 millionof revenue for 2002 is attributable to the mobilization of the rig from Venezuela to the drilling location in Indonesia.
South America/Caribbean Barge RigsIn 2004, revenues for the South America/Caribbean barge rigs decreased by $4.5 million, or 25%, and contract drillingexpenses decreased by $1.6 million, or 14%, as compared to 2003. The decrease in revenues and contract drilling expense isdue primarily to ENSCO II, which was idle 104 days during 2004, primarily for regulatory inspection and remedialprocedures, but worked all of 2003.
In 2003, revenues for the South America/Caribbean barge rigs increased by $500,000, or 3%, and contract drillingexpenses decreased by $1.9 million, or 14%, as compared to 2002. The increase in revenues was due primarily to increasedutilization of ENSCO III, which operated under a short-term contract at the end of 2003 and was idle during 2002, partiallyoffset by reduced activity of ENSCO XII, which completed a contract and demobilized from Trinidad to Venezuela during2002 and was idle during 2003. The decrease in contract drilling expenses was due primarily to reduced costs associated withENSCO I, which was mobilized from Venezuela to Indonesia in August 2002, the termination of the ENSCO XII contract in 2002 and subsequent demobilization from Trinidad to Venezuela and the devaluation of the Venezuelan currency duringthe current year.
North America Platform RigsIn 2004, revenues for the North America platform rigs decreased by $7.4 million, or 41%, and contract drilling expensesdecreased by $2.2 million, or 20%, as compared to 2003. The decreases are due primarily to ENSCO 29, which operated at89% utilization during 2003, but was idle in 2004 until the fourth quarter, when it began earning a standby rate whilepreparing for a long-term contract that commenced in February 2005.
In 2003, revenues for the North America platform rigs decreased by $3.3 million, or 15%, and contract drilling expensesdecreased by $2.4 million, or 18%, as compared to 2002. The decreases in revenues and contract drilling expenses were due primarily to reduced utilization of ENSCO 26, which was idle during the majority of 2003, but fully utilized in 2002.
ENSCO International Incorporated 2004 Annual Report> 18

Depreciation and AmortizationDepreciation and amortization expense for 2004 increased by $13.9 million, or 11%, as compared to 2003. The increase isprimarily attributable to depreciation on capital enhancement projects completed in 2004 and 2003 and depreciation onENSCO 102, which was acquired in January 2004.
Depreciation and amortization expense for 2003 increased by $18.2 million, or 16%, as compared to 2002. The increasewas primarily attributable to the depreciation associated with the five rigs obtained in the Chiles acquisition in August 2002and depreciation on capital enhancement projects completed in 2003 and 2002, partially offset by an approximate $3.8million reduction in depreciation resulting from the Company’s impairment of its barge rigs in Venezuela in the fourthquarter of 2002.
Impairment of AssetsThe Company’s South America/Caribbean barge rig fleet operations have historically been concentrated on Lake Maracaibo inVenezuela. Lake Maracaibo market conditions have been depressed for several years due to reduced or deferred explorationand development spending by Venezuela’s national oil company, Petroleos de Venezuela, S.A. (“PdVSA”). In addition, theeconomic and political situation in Venezuela has become increasingly unstable during recent years. As a result of theuncertainty surrounding its South America/Caribbean barge rig fleet, the Company has evaluated the carrying value of thebarge rigs for impairment on a regular basis during recent years.
During the fourth quarter of 2002, the economic and political environment in Venezuela deteriorated severely. A strikeoriginating within PdVSA spread nationwide, involving the entire oil industry and the banking system, and causingsubstantial economic upheaval. The strike, mass terminations of PdVSA employees, and political influence in themanagement of PdVSA resulted in the near shutdown of the Venezuelan oil industry. Exchange controls were enacted andmany Venezuela businesses ceased or reduced operations causing substantial layoffs. As a result of these adversedevelopments, the Company recognized a $59.9 million impairment charge related to its Venezuela-based assets in the fourthquarter of 2002. At December 31, 2004, the carrying value of the Company’s six barge rigs in Venezuela totaled $46.2million. (See Note 4 to the Company’s Consolidated Financial Statements for a further discussion of the impairment of theCompany’s assets in Venezuela.)
General and AdministrativeGeneral and administrative expense for 2004 increased by $4.3 million, or 20%, as compared to 2003. The increase isprimarily attributable to increased personnel costs, audit fees and consulting services related to information systems, theSarbanes-Oxley Act and other projects, offset in part by a decrease resulting from a $1.1 million payment of one-timeseverance costs during the first quarter of 2003 under an employment contract assumed in connection with the Chilesacquisition in 2002.
General and administrative expense in 2003 increased by $3.4 million, or 18%, as compared 2002. The increase wasprimarily attributable to the payment in the first quarter of 2003 of one-time severance costs of $1.1 million under anemployment contract assumed in connection with the Chiles acquisition, an increase in other personnel costs, an increase ininsurance costs and an increase in professional fees related to the implementation of the Company’s new accounting andprocurement system.
Other Income (Expense)Other income (expense) for each of the years in the three-year period ended December 31, 2004, is as follows (in millions):
2004 2003 2002
Interest income $ 3.7 $ 3.4 $ 5.1Interest expense, net:
Interest expense (40.5) (38.7) (36.2)Capitalized interest 3.9 2.0 5.1
(36.6) (36.7) (31.1)Other, net .3 1.7 6.4
$(32.6) $(31.6) $(19.6)
ENSCO International Incorporated 2004 Annual Report > 19

Interest income increased by $300,000 in 2004, as compared to 2003, due to higher average cash balances invested.Interest income decreased by $1.7 million in 2003, as compared to 2002, due to lower average interest rates.
Interest expense increased by $1.8 million in 2004, as compared to 2003, due primarily to a minor increase in averageeffective interest rates. Interest expense increased by $2.5 million in 2003, as compared to 2002 due primarily to theadditional debt assumed in the Chiles acquisition in August 2002.
Capitalized interest increased by $1.9 million in 2004, as compared to 2003, due to an increase in the amount investedin rig construction and enhancement projects, primarily the ENSCO 107 construction project and the enhancement projectsassociated with ENSCO 68, ENSCO 88 and ENSCO 67. Capitalized interest decreased by $3.1 million in 2003, as comparedto 2002, due to a decrease in the amount invested in construction and enhancement projects, primarily the ENSCO 102 andthe ENSCO 105 construction projects, which were completed in the third and fourth quarters of 2002, respectively.
Other, net for 2004 consists primarily of a $3.9 million gain resulting from the settlement of an insurance claim relatedto ENSCO 7500 hull repairs and lost revenue in the first quarter of 2002 and net foreign currency translation gains of $2.0 million, partially offset by a $5.5 million loss for the insurance deductible related to damages sustained on ENSCO 64and ENSCO 25 during Hurricane Ivan in the Gulf of Mexico. (See Note 13 to the Company’s Consolidated Financial Statements.)
Other, net for 2003 consists primarily of a $3.0 million gain related to the receipt and sale of shares of common stock ofPrudential Financial, Inc. The shares were issued to the Company as a result of the Company’s previous purchase of a GroupAnnuity Contract upon termination of a predecessor consolidated pension plan and the conversion of Prudential Financial,Inc. from a mutual company to a stock company. Other net for 2003 also includes $900,000 in foreign currency translationlosses and a loss of $300,000 related to the decline in fair value of certain treasury rate lock agreements obtained in connectionwith the Chiles acquisition. (See “Market Risk” for further information on the Chiles treasury rate lock agreements.)
Other, net for 2002 includes a $5.8 million gain in connection with the settlement of an insurance claim related to theENSCO 51, which sustained damage from a natural gas fire, and net gains resulting from changes in foreign currency exchangerates, partially offset by an $800,000 loss related to the decrease in fair value of certain treasury rate lock agreements obtained inconnection with the Chiles acquisition. (See “Market Risk” for further information on the Chiles treasury rate lock agreements.)
Discontinued OperationsIn February 2004, the Company entered into an agreement with KFELS, a major international shipyard, to exchange threerigs (ENSCO 23, ENSCO 24 and ENSCO 55) and $55.0 million for the construction of a new high performance premiumjackup rig to be named ENSCO 107. The exchange of the three rigs occurred in May 2004 and was treated as a sale with no significant gain or loss recognized, as the fair value of the rigs approximated their book value of $39.9 million. Theresults of operations of the ENSCO 23, ENSCO 24 and ENSCO 55 have been reclassified as discontinued operations in theconsolidated statements of income for each of the years in the three-year period ended December 31, 2004.
In February 2003, the Company reached an agreement to sell its 27-vessel marine transportation fleet. After receipt of various regulatory consents, the transaction was finalized in April 2003 for approximately $79.0 million. The Companyrecognized a pre-tax gain of approximately $6.4 million related to the transaction. The operating results of the marinetransportation fleet, which represent the entire marine transportation services segment previously reported by the Company,have been reclassified as discontinued operations in the consolidated statements of income for each of the years in the two-yearperiod ended December 31, 2003.
Following is a summary of loss from discontinued operations for each of the years in the three-year period endedDecember 31, 2004 (in millions):
2004 2003 2002
RevenuesContract drilling $ 2.6 $ 9.6 $ 7.9Marine transportation – 7.6 48.6
2.6 17.2 56.5Operating expenses
Contract drilling 3.7 12.5 12.4Marine transportation – 12.2 47.0
3.7 24.7 59.4Operating loss before income taxes (1.1) (7.5) (2.9)Income tax benefit .4 2.6 1.0Gain on sale of discontinued operations, net – 4.1 –
Loss from discontinued operations $ (.7) $ (.8) $ (1.9)
ENSCO International Incorporated 2004 Annual Report> 20

Provision for Income TaxesThe Company recorded income tax expense of $36.0 million and $43.1 million in the years ended December 31, 2004 and2003, respectively. The $7.1 million decrease in the income tax provision from 2003 to 2004 is primarily attributable toreduced profitability of the Company in addition to a decrease in effective tax rate to 25.8% in 2004 from 28.3% in 2003.The decrease in effective tax rate is due primarily to an increase in the relative portion of the Company’s earnings generatedby foreign subsidiaries whose earnings are being permanently reinvested and taxed at lower rates. The “American JobsCreation Act of 2004” became law effective October 22, 2004 and provides for a special one-time dividends received taxdeduction on the repatriation of certain foreign earnings to a U.S. tax payer, provided certain criteria are met. The Companyis currently analyzing this tax legislation to determine its impact, if any, on the Company’s future income tax accounting andconsolidated financial statements.
The Company recorded income tax expense of $43.1 million and $28.8 million in the years ended December 31, 2003and 2002, respectively. The $14.3 million increase in the income tax provision from 2002 to 2003 is primarily attributableto the increased profitability of the Company, offset in part by a decrease in effective tax rate to 28.3% in 2003 from 32.0%in 2002. The decrease in effective tax rate is due primarily to a $1.7 million decrease in a valuation allowance. In 2002, theCompany recorded a $2.6 million valuation allowance against a deferred tax asset that arose as a result of the recognition ofan impairment charge associated with the carrying value of the Company’s barge rigs in Venezuela. During 2003, thevaluation allowance decreased $1.7 million due to an equal amount of decrease in the associated deferred tax asset, whichresulted from the excess of tax depreciation over the amount of depreciation recognized for financial reporting. The decreasein effective tax rate attributable to the reduced valuation allowance was offset in part by the impact of changes in the relativeportion of the Company’s earnings generated by foreign subsidiaries whose earnings are being permanently reinvested andtaxed at lower rates and the impact of certain tax credits and income not subject to tax.
LIQUIDITY AND CAPITAL RESOURCES
Although somewhat cyclical, the Company has historically relied on its cash flow from continuing operations to meetliquidity needs and fund the majority of its cash requirements. Management believes the Company has maintained a strongfinancial position through the disciplined and conservative use of debt. A substantial majority of the Company’s cash flow isinvested in the expansion and enhancement of its fleet of drilling rigs.
During the three-year period ended December 31, 2004, the Company’s primary sources of cash included an aggregate$751.1 million generated from drilling operations and an aggregate $111.4 million from the disposition of assets, including$78.8 million from the sale of its marine transportation fleet in 2003. During the three-year period ended December 31,2004, the Company’s primary uses of cash included an aggregate $833.4 million for the acquisition, construction,enhancement and other improvement of drilling rigs, including $99.9 million associated with the acquisition of Chiles, andan aggregate $109.7 million for repayment of loans.
Detailed explanations of the Company’s liquidity and capital resources for each of the years in the three-year periodended December 31, 2004, including discussions of cash flow from continuing operations and capital expenditures, financingand capital resources, off-balance sheet arrangements and contractual obligations and commercial commitments, are set forthbelow.
Cash Flow from Continuing Operations and Capital ExpendituresThe Company’s cash flow from continuing operations and capital expenditures on continuing operations for each of the yearsin the three-year period ended December 31, 2004 are as follows (in millions):
2004 2003 2002
Cash flow from continuing operations $258.4 $290.6 $202.1
Capital expenditures on continuing operations:Rig acquisition $ 94.6 $ – $ –New construction 1.6 1.0 31.8Enhancements 161.8 139.6 147.7Minor upgrades and improvements 46.6 45.5 38.5
$304.6 $186.1 $218.0
Cash flow from continuing operations in 2004 decreased by $32.2 million, or 11%, from 2003. The decrease resultedprimarily from a $30.3 million decrease in cash receipts from drilling services, a $7.1 million increase in income taxpayments and $5.1 million of cash payments in 2004 related to the recovery and damage analysis of ENSCO 64, partially
ENSCO International Incorporated 2004 Annual Report > 21

offset by a $4.3 million decrease in cash payments associated with contract drilling expenses and a $4.9 million decrease ininterest payments. ENSCO 64 was severely damaged by Hurricane Ivan in September 2004 and the payments made inconnection with its recovery and damage analysis are expected to be recovered from insurance proceeds to be received in 2005.
Cash flow from continuing operations in 2003 increased by $88.5 million, or 44%, from 2002. The improvementresulted primarily from a $179.4 million increase in cash receipts from drilling services, offset in part by a $79.8 millionincrease in cash payments associated with contract drilling expenses, a $10.4 million increase in interest payments and a $3.7 million increase in income tax payments. The majority of both the increase in cash receipts from drilling services andthe increase in cash payments associated with contract drilling expenses is attributable to the five rigs obtained in the Chilesacquisition and the newly constructed ENSCO 102, which were added to the Company’s rig fleet in the third quarter of2002 and provided a full year of operating results in 2003 compared to only five months in 2002.
The Company continues to expand the size and quality of its fleet of drilling rigs. During the past three years, theCompany has invested $449.1 million upgrading the capability and extending the service lives of its drilling rigs as part of itsongoing enhancement program and an additional $34.4 million relating to the construction of new rigs. During 2004, theCompany purchased the ENSCO 102 from an affiliated joint venture for a net payment of $94.6 million. Also during 2004, theCompany transferred three rigs (ENSCO 23, ENSCO 24 and ENSCO 55) to KFELS as partial payment for the construction ofENSCO 107. In 2002, the Company utilized a net $99.9 million of cash in connection with the Chiles acquisition.
Upon completion of rig construction on February 7, 2005, the Company purchased ENSCO 106 from an affiliated jointventure for a net payment of $79.6 million. In addition to the acquisition of the ENSCO 106, management anticipates thatcapital expenditures in 2005 will include approximately $250.0 million for rig enhancement projects, approximately $65.0million for construction of ENSCO 107 and approximately $50.0 million for minor upgrades and improvements. (See Note 6to the Company’s Consolidated Financial Statements for information concerning the Company’s investment in the jointventure related to ENSCO 106; see “Outlook” for information concerning the construction of ENSCO 107.) Depending onmarket conditions and opportunities, the Company may also make capital expenditures to construct or acquire additional rigs.
Financing and Capital ResourcesThe Company’s long-term debt, total capital and long-term debt to total capital ratios at December 31, 2004, 2003 and2002 are summarized below (in millions, except percentages):
2004 2003 2002
Long-term debt $ 527.1 $ 549.9 $ 547.5Total capital* 2,709.0 2,631.0 2,514.5Long-term debt to total capital 19.5% 20.9% 21.8%
*Total capital includes long-term debt plus stockholders’ equity.
During the years ended December 31, 2004 and 2003, there were no significant changes in the Company’s long-termdebt or total capital. The Company’s total capital increased substantially during the year ended December 31, 2002, dueprimarily to the $449.1 million of common stock issued and $153.0 million of long-term debt assumed in connection withthe Chiles acquisition. The aggregate $31.1 million of proceeds from long-term borrowings during the three years endedDecember 31, 2004 was received under an interim rig construction loan that was subsequently replaced by long-term bonds.In addition to scheduled principal payments on outstanding bonds during the three years ended December 31, 2004, theCompany paid $51.2 million in 2002 to retire all amounts outstanding under a revolving credit facility obtained inconnection with the Chiles acquisition.
At December 31, 2004, the Company has an aggregate $252.5 million outstanding under three separate bond issuesthat require semiannual principal and interest payments. The Company also makes semiannual interest payments on $150.0million of notes and $150.0 million of debentures, due in 2007 and 2027, respectively. The future amount of principal andinterest payments due in connection with the Company’s outstanding long-term debt is summarized below in “ContractualObligations and Commercial Commitments.”
The Company has a $250.0 million unsecured revolving credit agreement (the “Credit Agreement”) with a syndicate ofbanks that matures in July 2007. The Company had no amounts outstanding under the Credit Agreement at December 31,2004 and does not currently anticipate borrowing under the Credit Agreement during 2005. The Company is in compliancewith the financial covenants under the Credit Agreement, which require the maintenance of a specified level of interestcoverage, debt ratio and tangible net worth. The Company maintains investment grade credit ratings of Baa1 from Moody’sand BBB+ from Standard & Poor’s.
ENSCO International Incorporated 2004 Annual Report> 22

Off-Balance Sheet ArrangementsDuring recent years the Company entered into two separate joint venture arrangements with KFELS in connection with theconstruction and ownership of two jackup rigs. ENSCO Enterprises Limited (“EEL”) was established by the Company (withan initial 25% ownership interest) and KFELS (with an initial 75% ownership interest) to own and charter ENSCO 102.Construction of ENSCO 102 commenced in 2000 and was completed in May 2002, after which the Company chartered ENSCO102 from EEL. In January 2004, the Company exercised a purchase option and acquired ENSCO 102 from EEL and EEL wasliquidated. ENSCO Enterprises Limited II (“EEL II”) was established by the Company (25% ownership interest) and KFELS(75% ownership interest) in March 2003 to construct and own ENSCO 106. Upon completion of rig construction in February2005, the Company exercised a purchase option and acquired ENSCO 106 from EEL II and EEL II was effectively liquidated.
The Company’s equity interests in EEL and EEL II constituted variable interests in variable interest entities, as definedin the Financial Accounting Standards Board’s Interpretation No. 46 (revised December 2003), “Consolidation of VariableInterest Entities, an Interpretation of ARB No. 51” (“FIN 46R”). However, the Company did not absorb a majority of theexpected losses or receive a majority of the expected residual returns of EEL and EEL II, as defined by FIN 46R, andaccordingly was not required to consolidate EEL or EEL II.
Further information regarding the Company’s off-balance arrangements is presented in Note 6 to the ConsolidatedFinancial Statements.
Contractual ObligationsThe Company’s significant contractual obligations as of December 31, 2004, and the periods in which such obligations aredue, are as follows (in millions):
Payments due by period
2006 2008and and After
2005 2007 2009 2009 Total
Principal payments on long-term debt $ 23.0 $196.0 $46.0 $287.5 $ 552.5Interest payments on long-term debt 35.1 66.2 40.6 224.2 366.1Operating leases 5.1 4.2 .8 – 10.1ENSCO 107 construction agreement 55.0 – – – 55.0Other* 86.4 – – – 86.4Total contractual cash obligations $204.6 $266.4 $87.4 $511.7 $1,070.1
*Other contractual obligations consist primarily of the $79.6 million paid in February 2005 in connection with the acquisition of ENSCO 106.
LiquidityThe Company’s liquidity position at December 31, 2004, 2003 and 2002 is summarized in the table below (in millions,except ratios):
2004 2003 2002
Cash and short-term investments $267.0 $354.0 $185.5Working capital 277.9 355.9 189.2Current ratio 2.3 2.9 2.0
Management expects to fund the Company’s short-term liquidity needs, including an aggregate $514.6 million ofcontractual obligations and anticipated capital expenditures during 2005, as well as any working capital requirements, fromits cash and cash equivalents and operating cash flow.
Management expects to fund the Company’s long-term liquidity needs, including contractual obligations andanticipated capital expenditures, from its cash and cash equivalents, investments, operating cash flow and, if necessary, fundsdrawn under its Credit Agreement or other future financing arrangements.
The Company has historically funded the majority of its liquidity from operating cash flow. The Company anticipatesthe majority of its cash flow in the near to intermediate-term will continue to be invested in the expansion and enhancementof its fleet of drilling rigs. As a substantial majority of such expenditures are elective, the Company expects to be able tomaintain adequate liquidity throughout future business cycles through the deferral or acceleration of its future capitalinvestments, as necessary. Accordingly, while future operating cash flow cannot be accurately predicted, management believesits long-term liquidity will continue to be funded primarily by operating cash flow.
ENSCO International Incorporated 2004 Annual Report > 23

MARKET RISK
The Company has net assets and liabilities denominated in numerous foreign currencies and uses various methods to manageits exposure to foreign currency exchange risk. The Company predominantly structures its drilling contracts in U.S. dollars,which significantly reduces the portion of the Company’s cash flows and assets denominated in foreign currencies. TheCompany also employs various strategies, including the use of derivative instruments, to match foreign currency denominatedassets with equal or near equal amounts of foreign currency denominated liabilities, thereby minimizing exposure to earningsfluctuations caused by changes in foreign currency exchange rates. The Company utilizes derivative instruments to hedgeforecasted foreign currency denominated transactions. At December 31, 2004, the Company had foreign currency exchangecontracts outstanding to exchange $87.6 million U.S. dollars for Australian dollars, Great Britain pounds and Euros, all ofwhich mature during the next 15 months. Based on a hypothetical 10% adverse change in foreign currency exchange rates,the net unrealized loss associated with the Company’s foreign currency denominated assets and liabilities and related foreigncurrency exchange contracts as of December 31, 2004 would approximate $5.7 million.
The Company uses various derivative financial instruments to manage its exposure to interest rate risk. The Companyoccasionally uses interest rate swap agreements to effectively convert the variable interest rate on debt to a fixed rate or thefixed rate on debt to a variable rate, and interest rate lock agreements to hedge against increases in interest rates on pendingfinancing. At December 31, 2004, the Company had no outstanding interest rate swap agreements or interest rate lock agreements.
In connection with the acquisition of Chiles on August 7, 2002, the Company obtained $80.0 million notional amountof outstanding treasury rate lock agreements that were scheduled to mature in October 2003. Upon acquisition, the Companydesignated approximately $65.0 million notional amount of the treasury rate lock agreements as an effective hedge againstthe variability in cash flows of $76.5 million of MARAD guaranteed bonds the Company intended to issue in October 2003.The Company deemed the remaining $15.0 million notional amount of treasury rate lock agreements obtained in the Chilesacquisition to be speculative in nature. The Company subsequently settled the $15.0 million notional amount of treasuryrate lock agreements deemed as speculative in October 2002 ($10.0 million) and June 2003 ($5.0 million). The Companysettled the $65.0 million notional amount of treasury rate lock agreements designated as an effective hedge in October 2003in connection with the pricing and subsequent issuance of the MARAD bonds. (See Note 8 to the Company’s ConsolidatedFinancial Statements.)
The Company utilizes derivative instruments and undertakes hedging activities in accordance with its establishedpolicies for the management of market risk. The Company does not enter into derivative instruments for trading or otherspeculative purposes. Management believes that the Company’s use of derivative instruments and related hedging activitiesdo not expose the Company to any material interest rate risk, foreign currency exchange rate risk, commodity price risk,credit risk or any other market rate or price risk.
OUTLOOK
Changes in industry conditions and the corresponding impact on the Company’s operations cannot be accurately predictedbecause of the short-term nature of many of the Company’s contracts and the volatility of oil and natural gas prices and otherfactors that impact oil and gas drilling and expenditure activity, rig utilization and day rates. Whether recent levels ofregional and worldwide expenditures for oil and gas drilling and drilling activity will increase, decrease or remain unchanged,is not determinable at this time. Accordingly, future rig demand and trends in average day rates and utilization levels areuncertain. Management’s current plans and expectations relative to its major areas of operations and near-term industryconditions are detailed below.
Rig ConstructionConstruction of ENSCO 106 has been completed and the rig was delivered to the Company on February 7, 2005. Upondelivery of the rig, the Company exercised its purchase option and acquired full ownership of ENSCO 106 from its jointventure partner. ENSCO 106 is currently under mobilization to perform a one-year contract offshore Australia that isexpected to commence in March 2005.
ENSCO 107 is under construction by KFELS in Singapore and remains on schedule for delivery in late 2005 or early2006. ENSCO 107 will be an enhanced KFELS MOD V (B) design modified to ENSCO specifications and a sister rig toENSCO 106.
ENSCO International Incorporated 2004 Annual Report> 24

Rig Enhancements and RelocationsENSCO 67 is currently in a Singapore shipyard for major enhancements and is projected to return to service in the AsiaPacific region during the second quarter of 2005. ENSCO 76 is in a shipyard undergoing modifications in preparation for athree-year contract to commence offshore Saudi Arabia in June 2005. ENSCO 84 and ENSCO 99 are in a shipyard undergoingenhancements and are projected to return to service in the Gulf of Mexico during February and April 2005, respectively. The Company also plans to commence enhancement procedures on three additional Gulf of Mexico jackup rigs during 2005,including two enhancements with projected shipyard durations of approximately four months each commencing in April and July, and a major enhancement with projected shipyard duration of nine months commencing in March.
Two of the Company’s drilling rigs, the ENSCO 64 jackup rig and ENSCO 25 platform rig, sustained considerabledamage during Hurricane Ivan in September 2004. The physical damage to the rigs, as well as the related removal, salvageand recovery costs, are covered by insurance, subject to an aggregate escalating deductible of up to $5.5 million. Damage toENSCO 64 is substantial and an analysis to determine the full extent of such damage has not been completed. It is possibleENSCO 64 will be declared a constructive total loss, as defined by the Company’s insurance policies. If this is the case, the Company will surrender the rig and receive $65.0 million of insurance proceeds, which will result in the recognition of a gain, as the insurance proceeds exceed the $52.8 million carrying value of the rig. If ENSCO 64 is not declared aconstructive total loss, the Company plans to repair the rig and return it to service. The Company will not be able toestimate the amount of time necessary to complete repairs until the analysis of damages has been completed. Repair of thedamage to ENSCO 25 is nearing completion and the Company expects the rig to return to service in late February 2005.
North AmericaAs of February 22, 2004, all of the Company’s jackup rigs in the North America region not undergoing enhancementprocedures are working. The ENSCO 7500, the Company’s deep water semisubmersible rig, is currently working andcommitted into the third quarter of 2007.
Of the Company’s three platform rigs, one is currently working, another is earning a standby rate while completingrepairs caused by Hurricane Ivan and expected to return to service in late February 2005, and one is idle. The two platformrigs under contract are expected to work into the fourth quarter of 2005. The Company’s three platform rigs have experiencedaverage utilization of 63% over the previous five years, primarily as a result of reduced opportunities for deep-well drillingcontracts. The Company’s platform rigs, which are all capable of completing 25,000 to 30,000 feet wells, are best suited forlong-term, deep well drilling applications where the platform rig components will stay in place for a substantial period oftime. The Company’s platform rigs currently compete against smaller, easier to mobilize and assemble, self-erecting platformrigs for shallow well drilling. The Company is not able to predict when there will be a recovery of drilling activity that will require a sustained use of the class of platform rigs owned and operated by the Company. The Company evaluated thecarrying values of its platform rigs in December 2003 and determined such carrying values were not impaired. The Companywill continue to perform such evaluations as circumstances dictate.
Europe/AfricaAs of February 22, 2005, all of the Company’s jackup rigs in the Europe/Africa region are working, with several rigscommitted beyond the second quarter of 2005. The Company expects some idle time during the first and second quarters of 2005, primarily for regulatory inspections and remedial procedures, repairs and minor improvements and upgrades.
Asia PacificAs of February 22, 2005, all of the Company’s jackup rigs in the Asia Pacific region are working except for ENSCO 67,ENSCO 76 and ENSCO 106, all three of which are discussed above. The Company currently has substantial backlog in theAsia Pacific region, with in excess of 3,000 rig days under contract in 2006 and thereafter.
South America/CaribbeanAs of February 22, 2005, four of the Company’s six barge rigs located in Venezuela are idle without work commitments.ENSCO II and ENSCO III are working under contracts scheduled to be completed in October 2005 and March 2005,respectively. Due to the continuing political and economic instability in Venezuela, the Company believes the timing of arecovery of drilling activity in Venezuela is uncertain. The Company evaluated the carrying values of its barge rigs inDecember 2004 and determined such carrying values were not impaired. The Company will continue to perform suchevaluations and monitor the situation in Venezuela, as circumstances dictate.
ENSCO International Incorporated 2004 Annual Report > 25

CRITICAL ACCOUNTING POLICIES AND ESTIMATES
The preparation of financial statements and related disclosures in conformity with generally accepted accounting principles inthe United States requires the Company’s management to make estimates, judgments and assumptions that affect the amountsreported in the consolidated financial statements and accompanying notes. The Company’s significant accounting policies are included in Note 1 to the Consolidated Financial Statements. These policies, along with the underlying assumptions and judgments made by the Company’s management in their application, have a significant impact on the Company’sconsolidated financial statements. The Company identifies its most critical accounting policies as those that are the mostpervasive and important to the portrayal of the Company’s financial position and results of operations, and that require themost difficult, subjective and/or complex judgments by management regarding estimates about matters that are inherentlyuncertain. The Company’s most critical accounting policies are those related to property and equipment, impairment of long-lived assets and goodwill and income taxes.
Property and EquipmentAt December 31, 2004, the carrying value of the Company’s property and equipment totaled $2,431.3 million, whichrepresents 73% of total assets. This carrying value reflects the application of the Company’s property and equipmentaccounting policies, which incorporate estimates, assumptions and judgments by management relative to the capitalizedcosts, useful lives and salvage values of the Company’s rigs.
The Company develops and applies property and equipment accounting policies that are designed to appropriately andconsistently capitalize those costs incurred to enhance, improve and extend the useful lives of its assets and expense thosecosts incurred to repair or maintain the existing condition or useful lives of its assets. The development and application ofsuch policies requires judgment and assumptions by management relative to the nature of, and benefits from, expenditureson Company assets. The Company establishes property and equipment accounting policies that are designed to depreciate oramortize its assets over their estimated useful lives. The assumptions and judgments used by management in determining the estimated useful lives of its property and equipment reflect both historical experience and expectations regarding futureoperations, utilization and performance of its assets. The use of different estimates, assumptions and judgments in theestablishment of property and equipment accounting policies, especially those involving the useful lives of the Company’srigs, would likely result in materially different carrying values of assets and results of operations.
Useful lives of rigs are difficult to estimate due to a variety of factors, including technological advances that impact themethods or cost of oil and gas exploration and development, changes in market or economic conditions, and changes in lawsor regulations affecting the drilling industry. The Company evaluates the remaining useful lives of its rigs on a periodic basis,considering operating condition, functional capability and market and economic factors. The Company’s most recent changein estimated useful lives occurred in January 1998, when the Company extended the useful lives of its drilling rigs by anaverage of five to six years.
The Company’s fleet of jackup rigs (42 as of December 31, 2004), which comprise in excess of 78% of both the grosscost and net carrying amount of the Company’s property and equipment at December 31, 2004, is depreciated over usefullives ranging from 15 to 30 years. The Company’s semisubmersible rig is depreciated over a 30-year useful life and its sevenbarge rigs are depreciated over 20-year useful lives. The Company’s three platform rigs are depreciated over useful livesranging from 13 to 16 years. The following table provides an analysis of estimated increases and decreases in depreciationexpense that would have been recognized for the year ended December 31, 2004, for various assumed changes in the usefullives of the Company’s drilling rigs effective January 1, 2004:
Increase (decrease) in Estimated increase (decrease)useful lives of the in depreciation expense that would
Company’s drilling rigs have been recognized (in millions)
10% $(13.1)20% (24.0)
(10%) 15.8(20%) 35.5
Impairment of Long-Lived Assets and GoodwillThe Company evaluates the carrying value of its property and equipment, primarily its drilling rigs, when events or changesin circumstances indicate that the carrying value of such rigs may not be recoverable. Generally, extended periods of idle timeand/or inability to contract rigs at economical rates are an indication that a rig may be impaired. However, the offshoredrilling industry is highly cyclical and it is not unusual for rigs to be unutilized or underutilized for significant periods oftime and subsequently resume full or near full utilization when business cycles change. Likewise, during periods of supply
ENSCO International Incorporated 2004 Annual Report> 26

and demand imbalance, rigs are frequently contracted at or near cash break-even rates for extended periods of time untildemand comes back into balance with supply. Impairment situations may arise with respect to specific individual rigs,groups of rigs, such as a specific type of drilling rig, or rigs in a certain geographic location. The Company’s rigs are mobileand may be moved from markets with excess supply, if economically feasible. The Company’s jackup rigs and semisubmersiblerig are suited for, and accessible to, broad and numerous markets throughout the world. However, there are fewer economicallyfeasible markets available to the Company’s barge rigs and platform rigs.
The Company tests goodwill for impairment on an annual basis, or when events or changes in circumstances indicate thata potential impairment exists. The goodwill impairment test requires the Company to identify reporting units and estimatethe fair value of those units as of the testing date. If the estimated fair value of a reporting unit exceeds its carrying value, itsgoodwill is considered not impaired. If the estimated fair value of a reporting unit is less than its carrying value, the Companyestimates the implied fair value of the reporting unit’s goodwill. If the carrying amount of the reporting unit’s goodwill exceedsthe implied fair value of the goodwill, an impairment loss is recognized in an amount equal to such excess. In the event theCompany disposes drilling rig operations that constitute a business, goodwill would be allocated in the determination of gain orloss on sale. Based on the Company’s test performed as of December 31, 2004, there was no impairment of goodwill.
Asset impairment evaluations are, by nature, highly subjective. In most instances they involve expectations of futurecash flows to be generated by the Company’s drilling rigs, and are based on management’s assumptions and judgmentsregarding future industry conditions and operations, as well as management’s estimates of future expected utilization, contractrates, expense levels and capital requirements of the Company’s drilling rigs. The estimates, assumptions and judgments usedby management in the application of the Company’s asset impairment policies reflect both historical experience and anassessment of current operational, industry, economic and political environments. The use of different estimates, assumptions,judgments and expectations regarding future industry conditions and operations, would likely result in materially differentcarrying values of assets and results of operations.
Certain of the Company’s barge rigs and platform rigs have experienced extended periods of idle time in one or moreprevious years. The Company has evaluated the carrying values of these rigs on several occasions in recent years and haspreviously recognized impairment charges on all of its barge rigs located in Venezuela. An evaluation of the expected futurecash flows of six barge rigs in Venezuela and five platform rigs in the Gulf of Mexico in December 2003 determined thecarrying value of each rig was not impaired. In December 2004, the Company obtained third-party fair value appraisals forfive of the six barge rigs, which also indicated their carrying values were not impaired. The sixth barge rig was under contract261 days during 2004, with the majority of the idle time attributable to regulatory inspection and remedial procedures, andis currently under a long-term contract that is scheduled for completion in October 2005. In May 2004, the companytransferred two of the five platform rigs to a shipyard in connection with the ENSCO 107 construction agreement. Thetransfer was treated as a sale and the fair value of the two rigs approximated their carrying value. Of the three remainingplatform rigs, two are currently under contracts that are expected to run into the fourth quarter of 2005. There is nogoodwill associated with the Company’s barge rigs or platform rigs.
Income TaxesThe Company conducts operations and earns income in numerous foreign countries and is subject to the laws of taxingjurisdictions within those countries, as well as U.S. federal and state tax laws. At December 31, 2004, the Company has a$359.5 million net deferred income tax liability and $57.8 million of accrued liabilities for income taxes currently payable.
The carrying values of deferred income tax assets and liabilities reflect the application of the Company’s income taxaccounting policies in accordance with Statement of Financial Accounting Standards No. 109, “Accounting for IncomeTaxes” (“SFAS 109”), and are based on management’s assumptions and estimates regarding future operating results and levelsof taxable income, as well as management’s judgments regarding the interpretation of the provisions of SFAS 109.Carryforwards and tax credits are assessed for realization as a reduction of future taxable income by using a “more likely thannot” determination. A U.S. deferred tax liability has not been recognized for undistributed earnings of foreign subsidiariesbecause it is not practicable to estimate. Should the Company elect to make a distribution of foreign earnings, or be deemedto have made a distribution of foreign earnings through application of various provisions of the Internal Revenue Code, itmay be subject to additional U.S. income taxes.
The carrying values of liabilities for income taxes currently payable are based on management’s interpretation ofapplicable tax laws, and incorporate management’s assumptions and judgments regarding the use of tax planning strategiesin various taxing jurisdictions. The use of different estimates, assumptions and judgments in connection with accounting forincome taxes, especially those involving the deployment of tax planning strategies, may result in materially different carryingvalues of income tax assets and liabilities and results of operations.
ENSCO International Incorporated 2004 Annual Report > 27

The Company operates in many jurisdictions where tax laws relating to the offshore drilling industry are not welldeveloped. In jurisdictions where available statutory law and regulations are incomplete or underdeveloped, the Companyobtains professional guidance and considers existing industry practices before deploying tax planning strategies and meetingits tax obligations. Tax returns are routinely subject to audit in most jurisdictions and tax liabilities are frequently finalizedthrough a negotiation process. While the Company has historically not experienced significant adjustments to previouslyrecognized tax assets and liabilities as a result of finalizing tax returns, there can be no assurance that significant adjustmentswill not arise in the future. In addition, there are several factors that could cause the future level of uncertainty relating tothe Company’s tax liabilities to increase, including the following:
• During recent years the portion of the Company’s overall operations conducted in foreign tax jurisdictions has beenincreasing and the Company currently anticipates this trend will continue.
• In order to deploy tax planning strategies and conduct foreign operations efficiently, the Company’s subsidiariesfrequently enter into transactions with affiliates, which are generally subject to complex tax regulations and frequentlyare reviewed by tax authorities.
• The Company may conduct future operations in certain tax jurisdictions where tax laws are not well developed and itmay be difficult to secure adequate professional guidance.
• Tax laws, regulations, agreements and treaties change frequently, requiring the Company to modify existing taxstrategies to conform to such changes.
NEW ACCOUNTING PRONOUNCEMENTS
In December 2004, the FASB issued Statement of Financial Accounting Standards No. 123, (revised 2004) “Share-BasedPayment” (“SFAS 123(R)”). This statement is a revision of Statement of Financial Accounting Standards No. 123,“Accounting for Stock-Based Compensation” as amended (“SFAS 123”), and requires entities to measure the cost of employeeservices received in exchange for an award of equity instruments based on the grant-date fair value of the award. The cost willbe recognized over the period during which an employee is required to provide services in exchange for the award (usuallythe vesting period). SFAS 123(R) covers various share-based compensation arrangements including share options, restrictedshare plans, performance-based awards, share appreciation rights and employee share purchase plans. SFAS 123(R) eliminatesthe ability to use the intrinsic value method of accounting for share options, as provided in Accounting Principles BoardOpinion No. 25, “Accounting for Stock Issued to Employees” (“APB 25”). SFAS 123(R) is effective as of the beginning ofthe first interim period that begins after June 15, 2005, with early adoption encouraged. The Company is currentlyevaluating the statement’s transition methods and does not expect this statement to have an effect materially different thanthat of the pro forma SFAS 123 disclosures provided in Note 1 to the Company’s Consolidated Financial Statements.
In December 2004, the FASB issued Statement of Financial Accounting Standards No. 153, “Exchanges ofNonmonetary Assets, an amendment of APB Opinion No. 29” (“SFAS 153”). This statement amends APB Opinion No. 29to permit the exchange of nonmonetary assets to be recorded on a carry over basis when the nonmonetary assets do not havecommercial substance. This is an exception to the basic measurement principal of measuring a nonmonetary asset exchange atfair value. A nonmonetary asset exchange has commercial substance if the future cash flows of the entity are expected tochange significantly as a result of the exchange. SFAS 153 is effective for nonmonetary asset exchanges occurring in fiscalperiods beginning after June 15, 2005. If the Company enters into significant nonmonetary asset exchanges in the future,SFAS 153 could have a material effect on its consolidated financial position, results of operations or cash flows.
In December 2003, the FASB issued Interpretation No. 46 (revised December 2003), “Consolidation of Variable InterestEntities, an Interpretation of ARB No. 51” (“FIN 46R”). FIN 46R requires a company to consolidate a variable interestentity, as defined, when the company will absorb a majority of the variable interest entity’s expected losses, receive a majorityof the variable interest entity’s expected residual returns, or both. FIN 46R also requires certain disclosures relating toconsolidated variable interest entities and unconsolidated variable interest entities in which a company has a significantvariable interest. The provisions of FIN 46R are required for companies that have interests in variable interest entities orpotential variable interest entities commonly referred to as special-purpose entities for periods ending after December 15,2003. The provisions of FIN 46R are required to be applied for periods ending after March 15, 2004 for all other types ofentities. The Company’s equity interests in ENSCO Enterprises Limited (“EEL”) and ENSCO Enterprises Limited II (“EELII”) constituted variable interests in variable interest entities under FIN 46R. However, the Company did not absorb amajority of the expected losses or receive a majority of the expected residual returns of EEL and EEL II, as defined by FIN46R, and accordingly was not required to consolidate EEL or EEL II. (See “Liquidity and Capital Resources – Off-BalanceSheet Arrangements” and Note 6 to the Company’s Consolidated Financial Statements.)
ENSCO International Incorporated 2004 Annual Report> 28

Management’s Report on Internal Control over Financial Reporting
The Company’s management is responsible for establishing and maintaining adequate internal control over financial reporting,as such term is defined in Exchange Act Rules 13a-15(f) or 15d-15(f). The Company’s internal control over financial reportingsystem is designed to provide reasonable assurance to the Company’s management and Board of Directors regarding thepreparation and fair presentation of published financial statements. Because of its inherent limitations, internal control overfinancial reporting may not prevent or detect misstatements. Therefore, even those systems determined to be effective canprovide only reasonable assurance with respect to financial statement preparation and presentation. Projections of any evaluationof effectiveness to future periods are subject to the risk that controls may become inadequate because of changes in conditions,or that the degree of compliance with the policies or procedures may deteriorate. Under the supervision and with theparticipation of management, including the Chief Executive Officer and Chief Financial Officer, the Company has conductedan evaluation of the effectiveness of its internal control over financial reporting based on the framework in Internal Control –Integrated Framework issued by the Committee of Sponsoring Organizations of the Treadway Commission. Based on thisevaluation, the Company has concluded that its internal control over financial reporting is effective as of December 31, 2004to provide reasonable assurance regarding the reliability of financial reporting and the preparation of financial statements forexternal purposes in accordance with generally accepted accounting principles.
KPMG LLP, the independent registered public accounting firm who audited the Company’s consolidated financialstatements, have issued an audit report on our assessment of the Company’s internal control over financial reporting. KPMG LLP’s attestation report on management’s assessment of the Company’s internal control over financial reporting isincluded herein.
February 22, 2005
ENSCO International Incorporated 2004 Annual Report > 29

Reports of Independent Registered Public Accounting Firm
To the Board of Directors and Stockholders of ENSCO International Incorporated:
We have audited the accompanying consolidated balance sheets of ENSCO International Incorporated and subsidiaries(ENSCO) as of December 31, 2004 and 2003, and the related consolidated statements of income and cash flows for each of the years in the three-year period ended December 31, 2004. These consolidated financial statements are the responsibilityof ENSCO’s management. Our responsibility is to express an opinion on these consolidated financial statements based on our audits.
We conducted our audits in accordance with the standards of the Public Company Accounting Oversight Board (UnitedStates). Those standards require that we plan and perform the audit to obtain reasonable assurance about whether the financialstatements are free of material misstatement. An audit includes examining, on a test basis, evidence supporting the amountsand disclosures in the financial statements. An audit also includes assessing the accounting principles used and significantestimates made by management, as well as evaluating the overall financial statement presentation. We believe that our auditsprovide a reasonable basis for our opinion.
In our opinion, the consolidated financial statements referred to above present fairly, in all material respects, the financialposition of ENSCO as of December 31, 2004 and 2003, and the results of its operations and its cash flows for each of theyears in the three-year period ended December 31, 2004, in conformity with U.S. generally accepted accounting principles.
We also have audited, in accordance with the standards of the Public Company Accounting Oversight Board (UnitedStates), the effectiveness of ENSCO International Incorporated’s internal control over financial reporting as of December 31,2004, based on criteria established in Internal Control-Integrated Framework issued by the Committee of SponsoringOrganizations of the Treadway Commission (COSO), and our report dated February 22, 2005 expressed an unqualified opinionon management’s assessment of, and the effective operation of, internal control over financial reporting.
KPMG LLPDallas, TexasFebruary 22, 2005
ENSCO International Incorporated 2004 Annual Report> 30

ENSCO International Incorporated 2004 Annual Report > 31
To the Board of Directors and Stockholders of ENSCO International Incorporated:
We have audited management’s assessment, included in the accompanying Management’s Report on Internal Control OverFinancial Reporting, that ENSCO International Incorporated and subsidiaries (ENSCO) maintained effective internal controlover financial reporting as of December 31, 2004, based on criteria established in Internal Control-Integrated Frameworkissued by the Committee of Sponsoring Organizations of the Treadway Commission (COSO). ENSCO’s management isresponsible for maintaining effective internal control over financial reporting and for its assessment of the effectiveness ofinternal control over financial reporting. Our responsibility is to express an opinion on management’s assessment and anopinion on the effectiveness of ENSCO’s internal control over financial reporting based on our audit.
We conducted our audit in accordance with the standards of the Public Company Accounting Oversight Board (UnitedStates). Those standards require that we plan and perform the audit to obtain reasonable assurance about whether effectiveinternal control over financial reporting was maintained in all material respects. Our audit included obtaining an under-standing of internal control over financial reporting, evaluating management’s assessment, testing and evaluating the designand operating effectiveness of internal control, and performing such other procedures as we considered necessary in thecircumstances. We believe that our audit provides a reasonable basis for our opinion.
A company’s internal control over financial reporting is a process designed to provide reasonable assurance regarding thereliability of financial reporting and the preparation of financial statements for external purposes in accordance with generallyaccepted accounting principles. A company’s internal control over financial reporting includes those policies and proceduresthat (1) pertain to the maintenance of records that, in reasonable detail, accurately and fairly reflect the transactions anddispositions of the assets of the company; (2) provide reasonable assurance that transactions are recorded as necessary topermit preparation of financial statements in accordance with generally accepted accounting principles, and that receipts andexpenditures of the company are being made only in accordance with authorizations of management and directors of thecompany; and (3) provide reasonable assurance regarding prevention or timely detection of unauthorized acquisition, use, ordisposition of the company’s assets that could have a material effect on the financial statements.
Because of its inherent limitations, internal control over financial reporting may not prevent or detect misstatements.Also, projections of any evaluation of effectiveness to future periods are subject to the risk that controls may become inadequatebecause of changes in conditions, or that the degree of compliance with the policies or procedures may deteriorate.
In our opinion, management’s assessment that ENSCO maintained effective internal control over financial reporting asof December 31, 2004, is fairly stated, in all material respects, based on criteria established in Internal Control-IntegratedFramework issued by COSO. Also, in our opinion, ENSCO maintained, in all material respects, effective internal control overfinancial reporting as of December 31, 2004, based on criteria established in Internal Control-Integrated Framework issuedby COSO.
We also have audited, in accordance with the standards of the Public Company Accounting Oversight Board (UnitedStates), the consolidated balance sheets of ENSCO International Incorporated and subsidiaries as of December 31, 2004 and2003, and the related consolidated statements of income and cash flows for each of the years in the three-year period endedDecember 31, 2004, and our report dated February 22, 2005 expressed an unqualified opinion on those consolidatedfinancial statements.
KPMG LLPDallas, TexasFebruary 22, 2005

ENSCO International Incorporated 2004 Annual Report> 32
Consolidated Statements of Income
Year Ended December 31,(in millions, except per share amounts) 2004 2003 2002
Operating Revenues $768.0 $781.2 $641.6Operating Expenses
Contract drilling 425.5 445.2 341.5Depreciation and amortization 144.1 130.2 112.0Impairment of assets – – 59.9General and administrative 26.3 22.0 18.6
595.9 597.4 532.0Operating Income 172.1 183.8 109.6Other Income (Expense)
Interest income 3.7 3.4 5.1Interest expense, net (36.6) (36.7) (31.1)Other, net .3 1.7 6.4
(32.6) (31.6) (19.6)Income from Continuing Operations Before Income Taxes 139.5 152.2 90.0Provision for Income Taxes
Current income tax expense 12.1 14.0 18.9Deferred income tax expense 23.9 29.1 9.9
36.0 43.1 28.8Income from Continuing Operations 103.5 109.1 61.2Income (Loss) from Discontinued Operations
Loss from discontinued operations, net (.7) (4.9) (1.9)Gain on disposal of discontinued operations, net – 4.1 –
(.7) (.8) (1.9)Net Income $102.8 $108.3 $ 59.3
Earnings (Loss) Per Share – BasicContinuing operations $ .69 $ .73 $ .43Discontinued operations (.01) (.01) (.01)
$ .68 $ .72 $ .42
Earnings (Loss) Per Share – DilutedContinuing operations $ .69 $ .73 $ .43Discontinued operations (.01) (.01) (.01)
$ .68 $ .72 $ .42
Weighted Average Common Shares OutstandingBasic 150.5 149.6 140.7Diluted 150.6 150.1 141.4
Cash Dividends Per Common Share $ .10 $ .10 $ .10
The accompanying notes are an integral part of these consolidated financial statements.

ENSCO International Incorporated 2004 Annual Report > 33
Consolidated Balance Sheets
December 31,(in millions, except par value amounts) 2004 2003
ASSETS
Current AssetsCash and cash equivalents $ 267.0 $ 354.0Accounts receivable, net 183.0 149.4Prepaid expenses and other 43.7 39.9
Total current assets 493.7 543.3Property and Equipment, at Cost 3,445.5 3,126.3
Less accumulated depreciation 1,014.2 909.1Property and equipment, net 2,431.3 2,217.2
Goodwill 341.0 342.7Other Assets, Net 56.0 79.8
$3,322.0 $3,183.0
LIABILITIES AND STOCKHOLDERS’ EQUITY
Current LiabilitiesAccounts payable $ 15.6 $ 15.8Accrued liabilities 177.2 148.6Current maturities of long-term debt 23.0 23.0
Total current liabilities 215.8 187.4Long-Term Debt 527.1 549.9Deferred Income Taxes 375.3 345.9Other Liabilities 21.9 18.7Commitments and ContingenciesStockholders’ Equity
First preferred stock, $1 par value, 5.0 million shares authorized, none issued – –Preferred stock, $1 par value, 15.0 million shares authorized, none issued – –Common stock, $.10 par value, 250.0 million shares authorized, 174.5 million and
173.9 million shares issued 17.5 17.4Additional paid-in capital 1,420.0 1,409.0Retained earnings 1,016.3 928.6Restricted stock (unearned compensation) (12.5) (13.0)Accumulated other comprehensive loss (9.0) (10.9)Treasury stock, at cost, 23.4 million shares (250.4) (250.0)
Total stockholders’ equity 2,181.9 2,081.1$3,322.0 $3,183.0
The accompanying notes are an integral part of these consolidated financial statements.

ENSCO International Incorporated 2004 Annual Report> 34
Consolidated Statements of Cash Flows
Year Ended December 31,(in millions) 2004 2003 2002
Operating ActivitiesNet income $ 102.8 $ 108.3 $ 59.3Adjustments to reconcile net income to net cash provided by operating activities:
Loss from discontinued operations, net .7 4.9 1.9Depreciation and amortization 144.1 130.2 112.0Impairment of assets – – 59.9Deferred income tax provision 23.9 29.1 9.9Gain on sale of discontinued operations, net – (4.1) –Tax benefit from stock compensation 2.1 6.6 4.0Amortization of other assets 6.3 5.6 10.3Net loss (gain) on asset dispositions .3 – (5.8)Other 3.5 2.5 2.5Changes in operating assets and liabilities:
Decrease (increase) in accounts receivable (33.6) 13.8 (30.6)Increase in prepaid expenses and other assets (8.0) (11.6) (21.2)Increase (decrease) in accounts payable (.1) .6 (13.5)Increase in accrued and other liabilities 16.4 4.7 13.4
Net cash provided by operating activities of continuing operations 258.4 290.6 202.1
Investing ActivitiesAdditions to property and equipment (304.6) (186.1) (218.0)Net cash used in Chiles acquisition – – (99.9)Net proceeds from sale of discontinued operations – 78.8 –Proceeds from disposition of assets 3.1 5.2 24.3Sale (purchase) of short-term investments – 38.4 (6.8)Sale of long-term investments – – 23.0Investment in joint ventures (11.3) (13.5) –
Net cash used in investing activities of continuing operations (312.8) (77.2) (277.4)
Financing ActivitiesProceeds from long-term borrowings – 26.7 4.4Reduction of long-term borrowings (23.0) (23.0) (63.7)Cash dividends paid (15.1) (15.0) (14.2)Proceeds from exercise of stock options 7.8 12.4 19.5Deferred financing costs – (5.8) (1.3)Other (.4) (.7) (1.0)
Net cash used in financing activities of continuing operations (30.7) (5.4) (56.3)Effect of exchange rate changes on cash and cash equivalents (2.0) .9 (.9)Net cash (used in) provided by discontinued operations .1 (2.0) .8Increase (Decrease) in Cash and Cash Equivalents (87.0) 206.9 (131.7)Cash and Cash Equivalents, Beginning of Year 354.0 147.1 278.8Cash and Cash Equivalents, End of Year $ 267.0 $ 354.0 $ 147.1
The accompanying notes are an integral part of these consolidated financial statements.

ENSCO International Incorporated 2004 Annual Report > 35
Notes to Consolidated Financial Statements
1. DESCRIPTION OF THE BUSINESS AND SUMMARY OF SIGNIFICANT ACCOUNTING POLICIES
BusinessENSCO International Incorporated and subsidiaries (the “Company”) is one of the leading international providers of offshoredrilling services to the oil and gas industry. The Company’s contract drilling operations are integral to the exploration,development and production of oil and gas. Business levels for the Company, and its corresponding operating results, aresignificantly affected by worldwide levels of offshore exploration and development spending by oil and gas companies. Levelsof offshore exploration and development spending may fluctuate substantially from year to year and from region to region.Such fluctuations result from many factors, including demand for oil and gas, regional and global economic conditions,political and legislative environments in major oil-producing countries, the production levels and related activities of OPECand other oil and gas producers, technological advancements that impact the methods or cost of oil and gas exploration anddevelopment, and the impact that these and other events have on the current and expected future pricing of oil and natural gas(see Note 14 “Segment Information” for additional information concerning the Company’s operations by geographic region).
Principles of ConsolidationThe accompanying consolidated financial statements include the accounts of the Company and its majority owned subsidiaries.All significant intercompany accounts and transactions have been eliminated.
Pervasiveness of EstimatesThe preparation of financial statements in conformity with accounting principles generally accepted in the United Statesrequires management to make certain estimates and assumptions that affect the reported amounts of assets and liabilities, therelated revenues and expenses, and disclosure of gain and loss contingencies at the date of the financial statements. Actualresults could differ from those estimates.
Foreign Currency TranslationThe U.S. dollar is the functional currency of all the Company’s foreign subsidiaries. The financial statements of foreignsubsidiaries are remeasured in U.S. dollars based on a combination of both current and historical exchange rates. Gains andlosses caused by the remeasurement process are reflected in the consolidated statements of income. The Company had nettranslation gains of $2.0 million for the year ended December 31, 2004, net translation losses of $900,000 for the year endedDecember 31, 2003 and net translation gains of $900,000 for the year ended December 31, 2002. In prior years, thefinancial statements of certain foreign subsidiaries were maintained in the local foreign currency. Foreign currency translationadjustments for those subsidiaries were accumulated as a separate component of stockholders’ equity and are included inaccumulated other comprehensive loss at December 31, 2004 and 2003.
Cash Equivalents and Short-Term InvestmentsHighly liquid investments with maturities of three months or less at the date of purchase are considered cash equivalents.Highly liquid investments with maturities of greater than three months but less than one year at the date of purchase areclassified as short-term investments. All of the Company’s short-term investments are classified as held-to-maturity andstated at amortized cost.
Property and EquipmentAll costs incurred in connection with the acquisition, construction, enhancement and improvement of assets are capitalized,including allocations of interest incurred during periods that drilling rigs are under construction or undergoing majorenhancements and improvements. Maintenance and repair costs are charged to operating expenses. Upon sale or retirement ofassets, the related cost and accumulated depreciation are removed from the accounts and the resulting gain or loss is includedin income.
The Company provides for depreciation on the straight-line method, after allowing for salvage values, over the estimateduseful lives of its assets. Drilling rigs and related equipment are depreciated over estimated useful lives ranging from four to30 years. Other equipment, including computer and communications hardware and software costs, is depreciated overestimated useful lives ranging from two to six years. Buildings and improvements are depreciated over estimated useful livesranging from two to 30 years.

ENSCO International Incorporated 2004 Annual Report> 36
The Company evaluates the carrying value of its property and equipment for impairment when events or changes incircumstances indicate that the carrying value of such assets may not be recoverable. For property and equipment used in theCompany’s operations, recoverability is determined by comparing the net carrying value of an asset to either an independentfair value appraisal of the asset or the expected undiscounted future cash flows, before interest, of the asset. The amount ofimpairment loss, if any, is measured as the difference between the net book value of the asset and its estimated fair value.Property and equipment held for sale is recorded at the lower of net book value or net realizable value.
The Company recorded no impairment charges during the years ended December 31, 2004 and 2003. The Companyrecorded an impairment charge of $59.9 million in 2002, related to certain assets in Venezuela (see Note 4 “VenezuelaImpairment”).
GoodwillGoodwill is recorded at fair value. The Company tests goodwill for impairment on an annual basis, or when events or changesin circumstances indicate that a potential impairment exists. The Company performed its annual goodwill impairment test asof December 2004 and determined that goodwill was not impaired.
The Company initially recorded $246.4 million of goodwill during August 2002 in connection with the acquisition ofChiles Offshore Inc. (“Chiles”). During 2004 and 2003, the Company recorded purchase price adjustments reducing goodwillby $1.7 million and $7.5 million, respectively, primarily related to deferred taxes. The following table summarizes changesin the Company’s goodwill during 2004 and 2003 (in millions):
2004 2003
Balance as of January 1 $342.7 $350.2Purchase price adjustments (1.7) (7.5)Balance as of December 31 $341.0 $342.7
Operating Revenues and ExpensesSubstantially all of the Company’s drilling services contracts (“contracts”) are performed on a day rate basis and the terms ofsuch contracts are typically for a specific period of time or the period of time required to complete a specific task, such asdrilling a well. Contract revenue and expenses are recognized on a per day basis, as the work is performed. Day rate revenuesare typically earned, and contract drilling expenses are typically incurred, on a uniform basis over the terms of the Company’scontracts.
In connection with some contracts, the Company receives lump-sum fees or similar compensation for the mobilization ofequipment and personnel prior to the commencement of drilling services or the demobilization of equipment and personnelupon contract completion. Fees received for the mobilization or demobilization of equipment and personnel are included inoperating revenue. The costs incurred in connection with the mobilization and demobilization of equipment and personnelare included in contract drilling expense. Effective October 1, 2004, the Company changed its method of accounting for thefees received and related costs incurred to mobilize its rigs from one geographic area to another. Mobilization fees receivedand costs incurred are now deferred and recognized over the period that the related drilling services are performed on astraight-line basis. Prior to October 1, 2004, only the excess of mobilization fees received over costs incurred or the excess ofmobilization costs incurred over fees received, as applicable, was deferred and recognized over the period that the relateddrilling services are performed on a straight-line basis. The Company changed its method of accounting for mobilization feesand costs because it believes it is more appropriate to defer all mobilization fees and costs during the mobilization period andsubsequently recognize them over the period that the drilling services are performed. If the method of accounting formobilization fees and costs adopted on October 1, 2004, had been utilized in prior periods, the Company’s operating incomeand net income would not have changed and the change in the amounts of operating revenue and contract drilling expenseswithin previously reported periods would not have been material. Demobilization fees and related costs are recognized asincurred, upon contract completion. Costs associated with the mobilization of equipment and personnel to more promisingmarket areas without contracts are expensed as incurred.
Deferred mobilization costs are included in other current assets and other assets, net and totaled $700,000 and $100,000at December 31, 2004 and 2003, respectively. Deferred mobilization revenue is included in accrued liabilities and otherliabilities and totaled $1.7 million at December 31, 2004. There was no deferred mobilization revenue at December 31, 2003.
In connection with some contracts, the Company receives up-front, lump-sum fees or similar compensation for capitalimprovements to its rigs or vessels. Such compensation is deferred and recognized as revenue over the related contract period.The cost of such capital improvements is capitalized and depreciated over the useful life of the asset. Deferred revenueassociated with capital improvements is included in accrued liabilities and totaled $1.1 million and $2.5 million atDecember 31, 2004 and 2003, respectively.

ENSCO International Incorporated 2004 Annual Report > 37
The Company must obtain certifications from various regulatory bodies in order to operate its drilling rigs and mustmaintain such certifications through periodic inspections and surveys. The costs incurred in connection with maintainingsuch certifications, including inspections, tests, surveys and drydock, as well as remedial structural work and othercompliance costs, are deferred and amortized over the corresponding certification periods. Deferred regulatory certificationand compliance costs are included in prepaid expenses and other current assets and other assets, net, and totaled $7.0 millionand $8.0 million at December 31, 2004 and 2003, respectively.
Derivative Financial InstrumentsThe Company uses derivative financial instruments (“derivatives”) to reduce its exposure to various market risks, primarilyinterest rate risk and foreign currency risk. The Company employs an interest rate risk management strategy thatoccasionally utilizes derivatives to minimize or eliminate unanticipated fluctuations in earnings and cash flows arising fromchanges in, and volatility of, interest rates. The Company maintains a foreign currency risk management strategy that utilizesderivatives to reduce its exposure to unanticipated fluctuations in earnings and cash flows caused by changes in foreigncurrency exchange rates. The Company does not enter into derivatives for trading or other speculative purposes.
All derivatives are recorded on the Company’s consolidated balance sheet at fair value. Accounting for the gains andlosses resulting from changes in the fair value of derivatives depends on the use of the derivative and whether it qualifies forhedge accounting. Derivatives qualify for hedge accounting when they are formally designated as hedges at inception of theassociated derivative contract and are effective in reducing the risk exposure that they are designated to hedge. TheCompany’s assessment for hedge effectiveness is formally documented at hedge inception and the Company reviews hedgeeffectiveness throughout the designated hedge period on at least a quarterly basis.
Changes in the fair value of derivatives that are designated as hedges of the fair value of recognized assets or liabilities orunrecognized firm commitments (“fair value hedges”) are recorded currently in earnings and included in “other, net” on theconsolidated statement of income. Changes in the fair value of derivatives that are designated as hedges of the variability inexpected future cash flows associated with existing recognized assets or liabilities or forecasted transactions (“cash flowhedges”) are recorded in the accumulated other comprehensive loss section of stockholders’ equity. Amounts recorded inaccumulated other comprehensive loss associated with cash flow hedges are subsequently reclassified into earnings as earningsare affected by the underlying hedged forecasted transaction.
Gains and losses on a cash flow hedge, or a portion of a cash flow hedge, that no longer qualifies as effective due to anunanticipated change in forecasted transactions are recognized currently in earnings and included in “other, net” on theconsolidated statement of income based on the change in the market value of the cash flow hedge. When a forecastedtransaction is no longer likely to occur and a cash flow hedge contract is terminated, gains and losses on the cash flow hedgepreviously recorded in the accumulated other comprehensive loss section of shareholders’ equity are reclassified currently intoearnings and included in “other, net” on the consolidated statement of income. In assessing the effectiveness of a cash flowhedge, the hedge’s time value component is excluded from the measurement of hedge effectiveness and recognized currentlyin earnings in “other, net” on the consolidated statement of income.
The Company occasionally enters into derivatives that economically hedge certain risks, but the Company does notdesignate such derivatives as hedges or the derivatives otherwise do not qualify for hedge accounting. In these situations,there generally exists a natural hedging relationship where changes in the fair value of the derivatives offset changes in thefair value of the underlying hedged items. Changes in the fair value of these derivatives are recognized currently in earnings.
Derivatives with asset fair values are reported in other current assets or other assets, net, depending on maturity date.Derivatives with liability fair values are reported in accrued current liabilities or other liabilities, depending on maturitydate. At December 31, 2004 and 2003, the fair value of the Company’s foreign currency derivatives was a net asset of $4.0 million and $2.0 million, respectively.
Income TaxesThe Company conducts operations and earns income in numerous foreign countries and is subject to the laws of taxingjurisdictions within those countries, as well as U.S. federal and state tax laws. Current income taxes are recognized for theamount of taxes payable or refundable based on the laws and income tax rates in the taxing jurisdictions in which operationsare conducted and income is earned.
Deferred tax assets and liabilities are recognized for the anticipated future tax effects of temporary differences betweenthe financial statement basis and the tax basis of the Company’s assets and liabilities using the enacted tax rates in effect at year end. A valuation allowance for deferred tax assets is recorded when it is more likely than not that the benefit from the deferred tax asset will not be realized. It is the policy and intention of the Company to permanently reinvest all of the undistributed earnings of its foreign subsidiaries in such subsidiaries. Accordingly, no U.S. deferred taxes are provided on the undistributed earnings of foreign subsidiaries.

ENSCO International Incorporated 2004 Annual Report> 38
The Company’s drilling rigs are frequently moved from one taxing jurisdiction to another based on where they arecontracted to perform drilling services. The movement of drilling rigs among taxing jurisdictions may include a transfer of theownership of the drilling rig among the Company’s subsidiaries. Income taxes attributable to gains resulting from intercompanysales of the Company’s drilling rigs, as well as the tax effect of any reversing temporary differences resulting from intercompanysales or transfers, are deferred and amortized on a straight-line basis over the remaining useful life of the rig.
In some instances, the Company determines that certain temporary differences may not result in a taxable or deductibleamount in future years, as it is more likely than not the Company will commence operations and depart from a given taxingjurisdiction without such temporary differences being recovered or settled. Under these circumstances, no future taxconsequences are expected and no deferred taxes are recognized in connection with such operations. The Company evaluatesits determinations on a periodic basis and in the event its expectations relative to future tax consequences change, theapplicable deferred taxes are recognized.
Stock-Based Employee CompensationThe Company uses the intrinsic value method of accounting for employee stock options in accordance with AccountingPrinciples Board Opinion No. 25, “Accounting for Stock Issued to Employees” (“APB 25”). No compensation expenserelated to employee stock options is included in the Company’s net income, as the exercise price of the Company’s stockoptions equals the market value of the underlying stock on the date of grant. The following table includes disclosuresrequired by Statement of Financial Accounting Standards No. 123, “Accounting for Stock-Based Compensation” as amended(“SFAS 123”), and illustrates the effect on net income and earnings per share as if the Company had applied the fair valuerecognition provisions of SFAS 123 for each of the years in the three-year period ended December 31, 2004 (in millions,except per share amounts):
2004 2003 2002
Net income, as reported $102.8 $108.3 $ 59.3Less stock-based employee compensation expense, net of tax (9.7) (9.2) (12.6)Pro forma net income $ 93.1 $ 99.1 $ 46.7
Basic earnings per share:As reported $ .68 $ .72 $ .42Pro forma .62 .66 .33
Diluted earnings per share:As reported .68 .72 .42Pro forma .62 .66 .33
In deriving stock-based employee compensation expense under SFAS 123, the Company recognizes forfeitures as theyoccur. The fair value of each option grant is estimated on the date of grant using the Black-Scholes option pricing modelwith the following weighted average assumptions:
2004 2003 2002
Risk-free interest rate 3.2% 2.2% 3.9%Expected life (in years) 4.1 4.3 4.5Expected volatility 40.7% 48.1% 52.5%Dividend yield .4% .3% .4%
In December 2004, the FASB issued Statement of Financial Accounting Standards No. 123, (revised 2004) “Share-BasedPayment” (“SFAS 123(R)”). This statement is a revision of SFAS 123, and requires entities to measure the cost of employeeservices received in exchange for an award of equity instruments based on the grant-date fair value of the award. The cost willbe recognized over the period during which an employee is required to provide services in exchange for the award (usuallythe vesting period). SFAS 123(R) covers various share-based compensation arrangements including share options, restrictedshare plans, performance-based awards, share appreciation rights and employee share purchase plans. SFAS 123(R) eliminatesthe ability to use the intrinsic value method of accounting for share options, as provided in APB 25. SFAS 123(R) is effectiveas of the beginning of the first interim period that begins after June 15, 2005, with early adoption encouraged. TheCompany is currently evaluating the statement’s transition methods and does not expect this statement to have an effectmaterially different than that of the pro forma SFAS 123 disclosures above.

ENSCO International Incorporated 2004 Annual Report > 39
Earnings Per ShareFor each of the years in the three-year period ended December 31, 2004, there were no adjustments to net income forpurposes of calculating basic and diluted earnings per share. The following is a reconciliation of the weighted averagecommon shares used in the basic and diluted earnings per share computations for each of the years in the three-year periodended December 31, 2004 (in millions):
2004 2003 2002
Weighted average common shares outstanding (basic) 150.5 149.6 140.7Potentially dilutive common shares:
Restricted stock grants .1 .0 .0Stock options .0 .5 .7
Weighted average common shares outstanding (diluted) 150.6 150.1 141.4
Options to purchase 3.3 million shares of common stock in 2004, 3.4 million shares of common stock in 2003 and3.3 million shares of common stock in 2002 were not included in the computation of diluted earnings per share because theexercise price of the options exceeded the average market price of the common stock.
ReclassificationsCertain previously reported amounts have been reclassified to conform to the 2004 presentation.
2. ACQUISITION
On August 7, 2002, the Company acquired Chiles Offshore Inc. (“Chiles”) pursuant to a Merger Agreement by and amongthe Company, Chore Acquisition, Inc., a wholly-owned subsidiary of the Company, and Chiles (the “Merger Agreement”).Under the terms of the Merger Agreement, each Chiles shareholder received 0.6575 of a share of the Company’s common stockand $5.25 in cash in exchange for each share of Chiles common stock held. The Company issued approximately 13.3 millionshares of its common stock, and paid approximately $106.6 million in cash to the holders of Chiles common stock.
The merger was accounted for as a purchase business combination in accordance with accounting principles generallyaccepted in the United States, with the Company treated as the acquirer. The $567.9 million purchase price was calculatedusing the number of the Company’s common shares issued in the acquisition and a $33.65 per share average trading price ofthe Company’s common stock for a period of time immediately before and after the merger was announced, plus cashconsideration of $5.25 per share of Chiles common stock outstanding immediately prior to the merger, estimated directmerger fees and expenses and the estimated fair value of vested Chiles employee stock options.
The purchase price was allocated to assets acquired and liabilities assumed based on estimated fair market values at thedate of acquisition. The Company has recorded $237.2 million of goodwill in connection with the acquisition, which issupported by the nature of the offshore drilling industry, the acquisition of long-lived drilling equipment, and the assembledworkforce of Chiles.
3. DISCONTINUED OPERATIONS
In February 2004, the Company entered into an agreement with Keppel FELS Limited (“KFELS”), a major internationalshipyard, to exchange three rigs (ENSCO 23, ENSCO 24 and ENSCO 55) and $55.0 million for the construction of a newhigh performance premium jackup rig to be named ENSCO 107. The exchange of the three rigs occurred in May 2004 andwas treated as a sale with no significant gain or loss recognized, as the fair value of the rigs approximated their book value of$39.9 million. The results of operations of the ENSCO 23, ENSCO 24 and ENSCO 55 have been reclassified as discontinuedoperations in the consolidated statements of income for each of the years in the three-year period ended December 31, 2004.
In February 2003, the Company reached an agreement to sell its 27-vessel marine transportation fleet. After receipt ofvarious regulatory consents, the transaction was finalized in April 2003 for approximately $79.0 million. The Companyrecognized a pre-tax gain of approximately $6.4 million related to the transaction. The operating results of the marinetransportation fleet, which represent the entire marine transportation services segment previously reported by the Company,have been reclassified as discontinued operations in the consolidated statements of income for each of the years in the two-year period ended December 31, 2003.

ENSCO International Incorporated 2004 Annual Report> 40
Following is a summary of loss from discontinued operations for each of the years in the three-year period endedDecember 31, 2004 (in millions):
2004 2003 2002
RevenuesContract drilling $ 2.6 $ 9.6 $ 7.9Marine transportation – 7.6 48.6
2.6 17.2 56.5Operating expenses
Contract drilling 3.7 12.5 12.4Marine transportation – 12.2 47.0
3.7 24.7 59.4Operating loss before income taxes (1.1) (7.5) (2.9)Income tax benefit .4 2.6 1.0Gain on sale of discontinued operations, net – 4.1 –
Loss from discontinued operations $ (.7) $ (.8) $ (1.9)
4. VENEZUELA IMPAIRMENT
The Company’s South America/Caribbean barge rig fleet operations have historically been concentrated on Lake Maracaibo in Venezuela. Lake Maracaibo market conditions have been depressed for several years due to reduced or deferred explorationand development spending by Venezuela’s national oil company, Petroleos de Venezuela, S.A. (“PdVSA”). In addition, theeconomic and political situation in Venezuela has become increasingly unstable during recent years. As a result of theuncertainty surrounding its South America/Caribbean barge rig fleet, the Company has evaluated the carrying value of thebarge rigs for impairment on a regular basis during recent years.
During the fourth quarter of 2002, the economic and political environment in Venezuela deteriorated severely. A strikeoriginating within PdVSA spread nationwide, involving the entire oil industry and the banking system, and causing substantialeconomic upheaval. The strike, mass terminations of PdVSA employees, and political influence in the management of PdVSAresulted in the near shutdown of the Venezuelan oil industry. Exchange controls were enacted and many Venezuela businessesceased or reduced operations, causing substantial layoffs. These adverse developments resulted in a reduction in management’sexpectations of future cash flows to be generated by the barge rigs and the recognition of a $59.9 million impairment chargein the fourth quarter of 2002.
In order to calculate the impairment charge, the Company utilized the traditional present value method to determinethe fair value of its barge rigs. Expected future cash flows to be generated by the barge rigs were developed based onmanagement assumptions and judgments regarding future Venezuela industry conditions and operations, and includedestimates of future utilization, day rates, expense levels and capital requirements of the barge rigs, discounted at a ten percentrate commensurate with the risk of the expected future cash flows.
There was little change in the economic and political environment in Venezuela during 2003 and 2004, as PdVSAcontinued to limit capital spending, particularly in the Lake Maracaibo area. The timing of an expected recovery of drillingactivity in Venezuela is uncertain. While several of the Company’s barge rigs are suited for other markets, both locally andglobally, such markets are not nearly as extensive as the markets available to jackup or semisubmersible rigs. The Companyevaluated the carrying value of its barge rigs in December 2003 and 2004 and will continue to perform such evaluations andmonitor the situation in Venezuela, as circumstances dictate. No impairment charges were recorded during the years endedDecember 31, 2004 and 2003. At December 31, 2004, the carrying value of the Company’s six barge rigs in Venezuelatotaled $46.2 million.
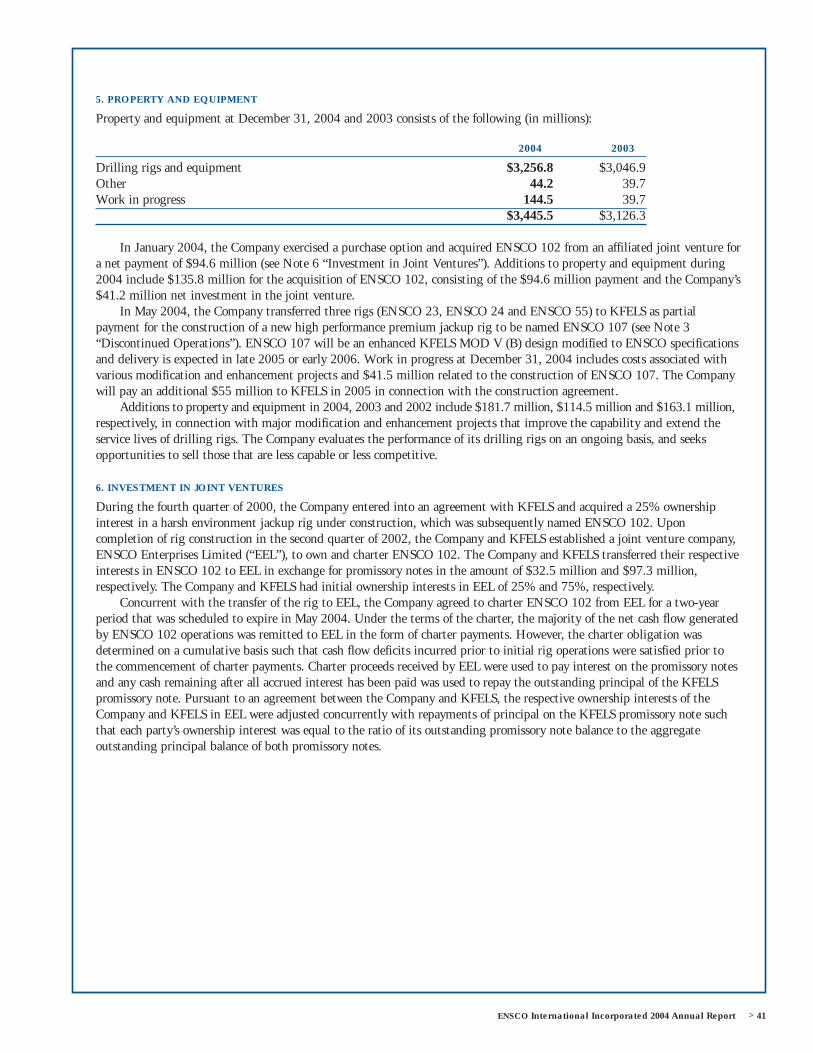
ENSCO International Incorporated 2004 Annual Report > 41
5. PROPERTY AND EQUIPMENT
Property and equipment at December 31, 2004 and 2003 consists of the following (in millions):
2004 2003
Drilling rigs and equipment $3,256.8 $3,046.9Other 44.2 39.7Work in progress 144.5 39.7
$3,445.5 $3,126.3
In January 2004, the Company exercised a purchase option and acquired ENSCO 102 from an affiliated joint venture fora net payment of $94.6 million (see Note 6 “Investment in Joint Ventures”). Additions to property and equipment during2004 include $135.8 million for the acquisition of ENSCO 102, consisting of the $94.6 million payment and the Company’s$41.2 million net investment in the joint venture.
In May 2004, the Company transferred three rigs (ENSCO 23, ENSCO 24 and ENSCO 55) to KFELS as partialpayment for the construction of a new high performance premium jackup rig to be named ENSCO 107 (see Note 3“Discontinued Operations”). ENSCO 107 will be an enhanced KFELS MOD V (B) design modified to ENSCO specificationsand delivery is expected in late 2005 or early 2006. Work in progress at December 31, 2004 includes costs associated withvarious modification and enhancement projects and $41.5 million related to the construction of ENSCO 107. The Companywill pay an additional $55 million to KFELS in 2005 in connection with the construction agreement.
Additions to property and equipment in 2004, 2003 and 2002 include $181.7 million, $114.5 million and $163.1 million,respectively, in connection with major modification and enhancement projects that improve the capability and extend theservice lives of drilling rigs. The Company evaluates the performance of its drilling rigs on an ongoing basis, and seeksopportunities to sell those that are less capable or less competitive.
6. INVESTMENT IN JOINT VENTURES
During the fourth quarter of 2000, the Company entered into an agreement with KFELS and acquired a 25% ownershipinterest in a harsh environment jackup rig under construction, which was subsequently named ENSCO 102. Uponcompletion of rig construction in the second quarter of 2002, the Company and KFELS established a joint venture company,ENSCO Enterprises Limited (“EEL”), to own and charter ENSCO 102. The Company and KFELS transferred their respectiveinterests in ENSCO 102 to EEL in exchange for promissory notes in the amount of $32.5 million and $97.3 million,respectively. The Company and KFELS had initial ownership interests in EEL of 25% and 75%, respectively.
Concurrent with the transfer of the rig to EEL, the Company agreed to charter ENSCO 102 from EEL for a two-yearperiod that was scheduled to expire in May 2004. Under the terms of the charter, the majority of the net cash flow generatedby ENSCO 102 operations was remitted to EEL in the form of charter payments. However, the charter obligation wasdetermined on a cumulative basis such that cash flow deficits incurred prior to initial rig operations were satisfied prior tothe commencement of charter payments. Charter proceeds received by EEL were used to pay interest on the promissory notesand any cash remaining after all accrued interest has been paid was used to repay the outstanding principal of the KFELSpromissory note. Pursuant to an agreement between the Company and KFELS, the respective ownership interests of theCompany and KFELS in EEL were adjusted concurrently with repayments of principal on the KFELS promissory note suchthat each party’s ownership interest was equal to the ratio of its outstanding promissory note balance to the aggregateoutstanding principal balance of both promissory notes.

ENSCO International Incorporated 2004 Annual Report> 42
Under the terms of the agreement with KFELS, the Company had an option to purchase ENSCO 102 from EEL, at aformula derived price, which was scheduled to expire in May 2004. In January 2004, the Company exercised its purchaseoption and acquired ENSCO 102 for a net payment of $94.6 million. EEL was effectively liquidated upon the Company’sacquisition of ENSCO 102. A summary of the unaudited financial statements of EEL as of December 31, 2003 and for eachof the periods in the three-year period ended December 31, 2004, is as follows:
ENSCO ENTERPRISES LIMITED
Condensed Balance SheetDecember 31, 2003
(in millions, unaudited)ASSETS
Cash $ 1.5Charter revenue receivable 2.9Property and equipment, net of accumulated depreciation 122.0
$126.4
LIABILITIES AND STOCKHOLDERS’ EQUITY
Interest payable $ 3.1Notes payable 124.9Stockholders’ equity
Common stock and paid in capital 4.9Accumulated deficit (6.5)
Total stockholders’ equity (1.6)$126.4
ENSCO ENTERPRISES LIMITED
Condensed Statement of Operations (in millions, unaudited)
Period fromYear Ended December 31, May 7, 2002 (Inception)
2004 2003 to December 31, 2002
Charter revenue $1.6 $17.1 $ .3Depreciation expense (.5) (5.9) (1.9)Interest expense (.8) (9.7) (6.4)
Net income (loss) $ .3 $ 1.5 $(8.0)
ENSCO 102 commenced drilling operations under a term contract in September 2002. During December 2002, all ofthe cash flow deficits incurred prior to initial rig operations were satisfied and EEL began recognizing charter revenue. AtDecember 31, 2003, the Company’s ownership interest in EEL was 26% and the Company’s net investment in EEL totaled$41.9 million, which is included in other assets, net on the consolidated balance sheet. The Company recognized $400,000,$2.8 million and $500,000, net of intercompany eliminations, from its equity in the earnings of EEL for the years endedDecember 31, 2004, 2003 and 2002, respectively. The Company’s equity in the earnings and losses of EEL is included incontract drilling expenses on the consolidated statements of income.
During the first quarter of 2003, the Company entered into an agreement with KFELS to establish a second jointventure company, ENSCO Enterprises Limited II (“EEL II”), to construct a premium heavy duty jackup rig to be namedENSCO 106. The Company agreed to contribute $3.0 million of procurement and management services and $23.3 millionin cash for a 25% interest in EEL II. The terms of the EEL II agreement are similar to those of the EEL agreement, with theCompany holding an option to purchase the remaining 75% interest in ENSCO 106, at a formula derived price, at any timeduring construction or the two-year period after completion of construction. At December 31, 2004 and 2003, theCompany’s net investment in EEL II totaled $23.2 million and $11.9 million, respectively, and is included in other assets,net on the consolidated balance sheet.
Upon completion of rig construction in February 2005, the Company exercised its purchase option and acquired ENSCO106 for a net payment of $79.6 million. EEL II was effectively liquidated upon the Company’s acquisition of ENSCO 106.

ENSCO International Incorporated 2004 Annual Report > 43
The Company’s equity interest in EEL and EEL II constituted variable interests in variable interest entities, as defined inthe Financial Accounting Standards Board’s Interpretation No. 46 (revised December 2003), “Consolidation of VariableInterest Entities, an Interpretation of ARB No. 51” (“FIN 46R”). However, the Company did not absorb a majority of theexpected losses or receive a majority of the expected residual returns of EEL and EEL II, as defined by FIN 46R, andaccordingly, was not required to consolidate EEL or EEL II.
7. LONG-TERM DEBT
Long-term debt at December 31, 2004 and 2003 consists of the following (in millions):
2004 2003
4.65% Bonds due 2020 $ 72.0 $ 76.55.63% Bonds due 2011 40.5 46.36.36% Bonds due 2015 139.4 152.06.75% Notes due 2007 149.7 149.67.20% Debentures due 2027 148.5 148.5
550.1 572.9Less current maturities (23.0) (23.0)Total long-term debt $527.1 $549.9
4.65% Bonds Due 2020In October 2003, the Company issued $76.5 million of 17-year bonds to provide long-term financing for the ENSCO 105.The bonds are guaranteed by the United States Maritime Administration (“MARAD”) and will be repaid in 34 equalsemiannual principal installments of $2.3 million ending in October 2020. Interest on the bonds is payable semiannually, inApril and October, at a fixed rate of 4.65%. The bonds are collateralized by the ENSCO 105 and the Company hasguaranteed the performance of its obligations under the bonds to MARAD. Proceeds from the bond issuance were used toretire a floating rate term loan that provided interim financing for the construction of the ENSCO 105.
5.63% Bonds Due 2011In connection with the acquisition of Chiles on August 7, 2002, the Company assumed Chiles’ bonds that were originallyissued to provide long-term financing for the ENSCO 76. The bonds are guaranteed by MARAD and are being repaid in 24equal semiannual principal installments of $2.9 million ending in July 2011. Interest on the bonds is payable semiannually,in January and July, at a fixed rate of 5.63%. The bonds are collateralized by the ENSCO 76 and the Company hasguaranteed the performance of its obligations under the bonds to MARAD. The outstanding principal balance of the bondsat the August 7, 2002 acquisition date was $52.9 million and the Company recorded an approximate $700,000 discount onthe debt.
6.36% Bonds Due 2015In January 2001, the Company issued $190.0 million of 15-year bonds to provide long-term financing for the ENSCO 7500.The bonds are guaranteed by MARAD and are being repaid in 30 equal semiannual principal installments of $6.3 millionending in December 2015. Interest on the bonds is payable semiannually, in June and December, at a fixed rate of 6.36%.The bonds are collateralized by the ENSCO 7500 and the Company has guaranteed the performance of its obligations underthe bonds to MARAD.
Notes Due 2007 and Debentures Due 2027In November 1997, the Company issued $300.0 million of unsecured debt in a public offering, consisting of $150.0 millionof 6.75% Notes due November 15, 2007 (the “Notes”) and $150.0 million of 7.20% Debentures due November 15, 2027(the “Debentures”). Interest on the Notes and the Debentures is payable semiannually in May and November. The Notes andDebentures may be redeemed at any time at the option of the Company, in whole or in part, at a price equal to 100% of theprincipal amount thereof plus accrued and unpaid interest, if any, and a make-whole premium. The indenture under whichthe Notes and the Debentures were issued contains limitations on the incurrence of indebtedness secured by certain liens, andlimitations on engaging in certain sale/leaseback transactions and certain merger, consolidation or reorganization transactions.The Notes and Debentures are not subject to any sinking fund requirements.

ENSCO International Incorporated 2004 Annual Report> 44
Revolving Credit AgreementThe Company has a $250.0 million unsecured revolving credit agreement (the “Credit Agreement”) with a syndicate ofbanks that matures in July 2007. Interest on amounts borrowed under the Credit Agreement is based on LIBOR plus anapplicable margin rate (currently .525%), depending on the Company’s credit rating. The Company pays a facility fee(currently .225% per annum) on the total $250.0 million commitment, which also is based on the Company’s credit rating.In addition, the Company is required to pay a utilization fee of .25% per annum on outstanding advances under the facility ifsuch advances exceed 33% of the total $250.0 million commitment. The Company is required to maintain certain financialcovenants under the Credit Agreement, including a specified level of interest coverage, debt ratio and tangible net worth.The Company had no amounts outstanding under the Credit Agreement at December 31, 2004 and 2003.
MaturitiesThe aggregate maturities of long-term debt, excluding un-amortized discounts of $2.4 million, for each of the five yearssubsequent to December 31, 2004, are as follows (in millions):
2005 $ 23.02006 23.02007 173.02008 23.02009 23.0Thereafter 287.5
Total $552.5
The Company is in compliance with the covenants of all of its debt instruments.
8. DERIVATIVE FINANCIAL INSTRUMENTS
In connection with the acquisition of Chiles on August 7, 2002, the Company obtained $80.0 million notional amount ofoutstanding treasury rate lock agreements. Upon closing of the acquisition, the Company designated $65.0 million notionalamount of the treasury rate lock agreements as an effective hedge against the variability in cash flows of $76.5 million ofMARAD guaranteed bonds that the Company intended to issue in October 2003. The Company deemed the remaining$15.0 million notional amount of treasury rate lock agreements obtained in the Chiles acquisition to be speculative in natureand subsequently settled $10.0 million notional amount in the fourth quarter of 2002 and the final $5.0 million notionalamount in the second quarter of 2003. The Company recognized losses of $300,000 and $800,000 for the years endedDecember 31, 2003 and 2002, respectively, in connection with the decline in fair value of the $15.0 million notional amountof treasury rate lock agreements deemed to be speculative. The change in fair value of the $65.0 million notional amount oftreasury rate lock agreements designated as an effective hedge during the years ended December 31, 2003 and 2002 has beenincluded in other comprehensive income, net of tax. The Company settled the $65.0 million notional amount of treasurylocks in October 2003 in connection with the pricing and subsequent issuance of the MARAD bonds (see Note 7 “LongTerm Debt”).
At December 31, 2004 the net unrealized losses on derivative instruments included in accumulated other comprehensiveloss totaled $7.9 million and the estimated amount that will be reclassified to earnings during the next twelve months is asfollows (in millions):
Unrealized losses to be reclassified to interest expense $ 1.2Unrealized gains to be reclassified to contract drilling expenses (2.4)Net unrealized gain to be reclassified to earnings $(1.2)
During the year ended December 31, 2004, a $41,000 loss was included in other, net in the consolidated statement ofincome to recognize the loss on an ineffective portion of the Company’s cash flow hedges. During the year ended December31, 2004, a $305,000 gain was included in other, net in the consolidated statement of income to recognize the gain on thetime value component of the cash flow hedge’s gain excluded from the assessment of hedge effectiveness. No portion of theCompany’s cash flow hedge’s gains or losses was excluded from the assessment of hedge effectiveness in 2003 and 2002. Noamounts were reclassified to earnings during 2004, 2003 or 2002 in connection with forecasted transactions that were nolonger considered likely to occur or as a result of terminated cash flow hedge contracts. At December 31, 2004, the Companyhad foreign currency exchange contracts outstanding to exchange $87.6 million U.S. dollars for Australian dollars, GreatBritain pounds and Euros, all of which mature during the next 15 months.

ENSCO International Incorporated 2004 Annual Report > 45
The Company utilizes derivative instruments and undertakes hedging activities in accordance with its establishedpolicies for the management of market risk. The Company does not enter into derivative instruments for trading or otherspeculative purposes. Management believes that the Company’s use of derivative instruments and related hedging activitiesdo not expose the Company to any material interest rate risk, foreign currency exchange rate risk, commodity price risk,credit risk or any other market rate or price risk.
9. COMPREHENSIVE INCOME
The components of the Company’s comprehensive income for each of the years in the three-year period ended December 31,2004, are as follows (in millions):
2004 2003 2002
Net Income $102.8 $108.3 $59.3Other comprehensive income (loss)
Net change in fair value of derivatives 2.4 .3 (2.6)Reclassification of unrealized gains and losses on derivatives from
other comprehensive income (loss) into net income .1 .9 .4Other (.6) – –
Net other comprehensive income (loss) 1.9 1.2 (2.2)Total comprehensive income $104.7 $109.5 $57.1
The components of the accumulated other comprehensive loss section of stockholders’ equity at December 31, 2004 and2003, are as follows (in millions):
2004 2003
Cumulative translation adjustment $1.1 $ 1.1Net unrealized losses on derivatives, net of tax 7.9 9.8
Total accumulated other comprehensive loss $9.0 $10.9
10. STOCKHOLDERS’ EQUITY
The Company initiated the payment of a $.025 per share quarterly cash dividend on its common stock during the thirdquarter of 1997. Cash dividends of $.10 per share were paid in each of the years in the three-year period ended December 31,2004. On August 7, 2002, the Company issued 13.3 million shares of its common stock, valued at $33.65 per share, or$449.1 million, in connection with the acquisition of Chiles. At December 31, 2004 and 2003, the outstanding shares of theCompany’s common stock, net of treasury shares, were 151.1 million and 150.5 million, respectively.

ENSCO International Incorporated 2004 Annual Report> 46
A summary of activity in the various stockholders’ equity accounts for each of the years in the three-year period endedDecember 31, 2004 is as follows (shares in thousands, dollars in millions):
Restricted AccumulatedAdditional Stock Other
Common Stock Paid-In Retained (Unearned Comprehensive TreasuryShares Amounts Capital Earnings Compensation) Loss Stock
BALANCE, December 31, 2001 157,841 $15.8 $ 888.6 $ 790.2 $ (5.4) $ (9.9) $(239.1)Net income – – – 59.3 – – –Cash dividends paid – – – (14.2) – – –Common stock issued under
employee and director incentive plans, net 1,459 .1 31.7 – (1.3) – (12.0)
Amortization of unearned stock compensation – – – – 1.1 – –
Common stock issued in Chiles acquisition 13,345 1.3 459.2 – (.2) – –
Tax benefit from stock compensation – – 4.0 – – – –Net other comprehensive loss – – – – – (2.2) –
BALANCE, December 31, 2002 172,645 17.2 1,383.5 835.3 (5.8) (12.1) (251.1)Net income – – – 108.3 – – –Cash dividends paid – – – (15.0) – – –Common stock issued under
employee and director incentive plans, net 1,269 .2 18.9 – (8.4) – 1.1
Amortization of unearned stock compensation – – – – 1.2 – –
Tax benefit from stock compensation – – 6.6 – – – –Net other comprehensive income – – – – – 1.2 –
BALANCE, December 31, 2003 173,914 17.4 1,409.0 928.6 (13.0) (10.9) (250.0)Net income – – – 102.8 – – –Cash dividends paid – – – (15.1) – – –Common stock issued under
employee and director incentive plans, net 628 .1 8.9 – (1.2) – (.4)
Amortization of unearned stock compensation – – – – 1.7 – –
Tax benefit from stock compensation – – 2.1 – – – –Net other comprehensive income – – – – – 1.9 –
BALANCE, December 31, 2004 174,542 $17.5 $1,420.0 $1,016.3 $(12.5) $ (9.0) $(250.4)
11. EMPLOYEE BENEFIT PLANS
Stock OptionsIn May 1998, the stockholders approved the ENSCO International Incorporated 1998 Incentive Plan (the “1998 Plan”).Under the 1998 Plan, a maximum of 11.3 million shares are reserved for issuance as awards of stock options and restrictedstock. Stock options generally become exercisable in 25% increments over a four-year period and to the extent not exercised,expire on the fifth anniversary of the date of grant.
In May 1996, the stockholders approved the ENSCO International Incorporated 1996 Non-Employee Directors’ StockOption Plan (the “Directors’ Plan”). Under the Directors’ Plan, a maximum of 600,000 shares are reserved for issuance asawards of stock options. Options granted under the Directors’ Plan become exercisable six months after the date of grant andexpire, if not exercised, five years thereafter.

ENSCO International Incorporated 2004 Annual Report > 47
The exercise price of stock options granted under the 1998 Plan and the Directors’ Plan is the market value of the stockat the date the option is granted.
In connection with the acquisition of Chiles on August 7, 2002, the Company assumed Chiles’ stock option plan andthe outstanding stock options there under. The plan was renamed the ENSCO International Incorporated 2000 Stock OptionPlan (the “2000 Plan”) and the option awards have been converted to ENSCO common stock equivalents in terms of exerciseprices and number of shares exercisable. At the August 7, 2002 plan assumption date, exercise prices of the assumed optionsranged from $10.74 per share to $25.48 per share with various expiration dates through February 2012 (6.2 years weightedaverage remaining contractual life). No further options will be granted under the 2000 Plan and it will be terminated uponthe exercise or expiration date of the last outstanding option. At December 31, 2004, options to purchase 38,525 shares ofthe Company’s common stock remained outstanding under the 2000 Plan.
A summary of stock option transactions under the 1998 Plan, Directors’ Plan and 2000 Plan is as follows (shares inthousands):
2004 2003 2002
Weighted Weighted WeightedAverage Average AverageExercise Exercise Exercise
Shares Price Shares Price Shares Price
Outstanding at beginning of year 4,749 $29.23 5,241 $25.44 4,845 $23.57Granted 1,381 27.49 1,292 29.16 1,464 30.74Assumed in Chiles acquisition – – – – 490 17.91Exercised (591) 13.12 (1,202) 10.71 (1,395) 21.61Forfeited (315) 32.34 (582) 33.16 (163) 27.63
Outstanding at end of year 5,224 $30.41 4,749 $29.23 5,241 $25.44
Exercisable at end of year 2,095 $32.19 1,791 $26.63 1,886 $19.15Weighted average fair value of
options granted during the year $ 9.71 $10.17 $13.98
The following table summarizes information about stock options outstanding under the 1998 Plan, Directors’ Planand 2000 Plan at December 31, 2004 (shares in thousands):
Options Outstanding Options Exercisable
Number Weighted Average NumberOutstanding Remaining Weighted Average Exercisable Weighted Average
Exercise Prices at 12/31/04 Contractual Life Exercise Price at 12/31/04 Exercise Price
$10.74 - $20.91 12 5.5 years $15.53 12 $15.5321.59 - 26.92 407 3.6 years 25.44 122 25.6527.03 - 30.66 2,413 4.0 years 28.55 395 29.5331.22 - 33.89 2,238 1.9 years 33.01 1,417 33.2535.19 - 37.86 154 1.3 years 35.92 149 35.86
5,224 3.0 years $30.41 2,095 $32.19
At December 31, 2004, 3.5 million shares were available for grant as stock options or incentive grants under the 1998Plan and 258,000 shares were available for grant as options under the Directors’ Plan.
Incentive Stock GrantsKey employees, who are in a position to contribute materially to the Company’s growth and development and to its long-term success, are eligible for incentive stock grants under the 1998 Plan. Shares of common stock subject to incentive grantsgenerally vest at a rate of 10% per year, as determined by a committee of the Board of Directors. Compensation expense ismeasured using the market value of the common stock on the date of grant and is recognized on a straight-line basis over thevesting period. A maximum of 1.1 million shares may be issued as incentive stock grants under the 1998 Plan.

ENSCO International Incorporated 2004 Annual Report> 48
Incentive stock grants issued during each of the years in the three-year period ended December 31, 2004, were asfollows: 60,000 shares at a weighted average fair value of $28.61 per share in 2004, 345,000 shares at a weighted average fairvalue of $26.50 per share in 2003 and 60,000 shares at a weighted average fair value of $26.82 per share in 2002. AtDecember 31, 2004, there were 502,500 shares of common stock available for incentive stock grants under the 1998 Plan.Incentive stock grants for an aggregate 492,500 shares of common stock issued under the 1998 Plan and a predecessor planwere outstanding at December 31, 2004, and vest as follows: 71,500 shares in 2005, 65,500 shares in 2006, 62,500 shares in2007, 56,500 shares in 2008, 49,000 shares in 2009, 49,000 shares in 2010, 48,000 shares in 2011, 45,000 shares in 2012,40,000 shares in 2013 and 5,500 shares in 2014.
Savings PlanThe Company has a profit sharing plan (the “ENSCO Savings Plan”) which covers eligible employees with more than oneyear of service, as defined. Profit sharing contributions require Board of Directors approval and may be in cash or grants ofthe Company’s common stock. The Company recorded profit sharing contribution provisions of $3.1 million, $1.6 millionand $3.6 million for the years ended December 31, 2004, 2003 and 2002, respectively.
The ENSCO Savings Plan includes a 401(k) savings plan feature which allows eligible employees to make tax deferredcontributions to the plan. The Company makes matching contributions based on the amount of employee contributions andrates set by the Company’s Board of Directors. Matching contributions totaled $4.3 million, $4.9 million and $4.8 millionin 2004, 2003 and 2002, respectively. The Company has reserved 1.0 million shares of common stock for issuance asmatching contributions under the ENSCO Savings Plan.
Supplemental Executive Retirement PlanThe ENSCO Supplemental Executive Retirement Plan (the “SERP”) provides a tax deferred savings plan for certain highlycompensated employees whose participation in the profit sharing and 401(k) savings plan features of the ENSCO SavingsPlan is restricted due to funding and contribution limitations of the Internal Revenue Code. The SERP is a non-qualifiedplan and eligibility for participation is determined by the Company’s Board of Directors. The contribution and Companymatching provisions of the SERP are identical to the ENSCO Savings Plan, except that each participant’s contributions andmatching contributions under the SERP are further limited by contribution amounts under the 401(k) savings plan featureof the ENSCO Savings Plan. Matching contributions totaled $51,000 in 2004, $40,000 in 2003 and $205,000 in 2002. ASERP liability of $6.7 million and $5.1 million is included in other liabilities at December 31, 2004 and 2003, respectively.
12. INCOME TAXES
The Company had income of $64.6 million, $79.4 million and $52.5 million from its continuing operations before incometaxes in the U.S. and income of $74.9 million, $72.8 million and $37.5 million from its continuing operations beforeincome taxes in foreign countries for the years ended December 31, 2004, 2003 and 2002, respectively.
The components of the provision for income taxes from continuing operations for each of the years in the three-yearperiod ended December 31, 2004 are as follows (in millions):
2004 2003 2002
Current income tax expense (benefit):Federal $ (2.7) $ (3.9) $ (8.1)State .4 .2 .7Foreign 14.4 17.7 26.3
12.1 14.0 18.9Deferred income tax expense (benefit):
Federal 23.4 27.5 24.4Foreign .5 1.6 (14.5)
23.9 29.1 9.9Total income tax expense $36.0 $43.1 $ 28.8

ENSCO International Incorporated 2004 Annual Report > 49
Significant components of deferred income tax assets (liabilities) as of December 31, 2004 and 2003 are comprised of the following (in millions):
2004 2003
Deferred tax assets:Net operating loss carryforwards $ 3.9 $ 1.4Foreign tax credit carryforwards 2.7 20.5Alternative minimum tax credit carryforwards 2.6 2.6Liabilities not deductible for tax purposes 9.4 7.1Impaired property – .9Other 3.3 2.7Gross deferred tax assets 21.9 35.2Less: Valuation allowance – (.9)Deferred tax assets, net of valuation allowance 21.9 34.3
Deferred tax liabilities:Property (361.5) (344.1)Intercompany transfers of property (15.3) (20.2)Maritime capital construction fund – (1.1)Derivative financial instrument (1.9) (2.8)Other (2.7) (2.3)Total deferred tax liabilities (381.4) (370.5)
Net deferred tax liabilities $(359.5) $(336.2)
Net current deferred tax asset $ 12.6 $ 9.7Net noncurrent deferred tax liability (372.1) (345.9)
Net deferred tax liability $(359.5) $(336.2)
In the fourth quarter of 2002, the Company recognized an impairment charge related to the carrying value of its bargerigs located in Venezuela. As a result of the impairment, the tax basis of the barge rigs located in Venezuela exceeded thecorresponding financial statement basis, resulting in a deferred tax asset of $900,000 at December 31, 2003. Due to thesevere deterioration of the economic and political environment in Venezuela and the uncertainty relative to a recovery ofdrilling activity, the Company did not expect to realize the benefit of the deferred tax asset and had established a valuationallowance for the full amount of the associated deferred tax asset. The valuation allowance decreased $900,000 fromDecember 31, 2003 to December 31, 2004 as a result of an equal amount of decrease in the associated deferred tax asset.
The income tax rates imposed in the taxing jurisdictions in which the Company’s foreign subsidiaries conduct operationsvary, as does the tax base to which the rates are applied. In some cases, tax rates may be applicable to gross revenue, statutoryor negotiated deemed profits, or other bases utilized under local tax laws, rather than to net income. In addition, theCompany’s drilling rigs are frequently moved from one taxing jurisdiction to another. As a result, the Company’sconsolidated effective income tax rate may vary substantially from year to year, depending on the relative components of theCompany’s earnings generated in taxing jurisdictions with higher tax rates and lower tax rates. The consolidated effectiveincome tax rate on continuing operations for each of the years in the three-year period ended December 31, 2004, differsfrom the U.S. statutory income tax rate as follows:
2004 2003 2002
Statutory income tax rate 35.0% 35.0% 35.0%Foreign taxes (8.9) (4.0) (6.7)Change in valuation allowance (.7) (1.2) 2.9Other .4 (1.5) .8Effective income tax rate 25.8% 28.3% 32.0%
At December 31, 2004, the Company had non-expiring foreign net operating loss carryforwards of $10.8 million and$2.3 million in Denmark and Trinidad and Tobago, respectively. In addition, the Company had foreign tax creditcarryforwards of $2.7 million available at December 31, 2004. If not utilized, the foreign tax credit carryforwards expire from2011 through 2014.

ENSCO International Incorporated 2004 Annual Report> 50
Undistributed earnings of the Company’s foreign subsidiaries, which are permanently reinvested, totaled $900,000 atDecember 31, 2004. A U.S. deferred tax liability has not been recognized for these undistributed earnings because it is notpracticable to estimate. Should the Company make a distribution of these foreign earnings in the form of dividends orotherwise, it may be subject to additional U.S. income taxes.
The “American Jobs Creation Act of 2004” became law effective October 22, 2004 and provides for a special one-timedividends received tax deduction on the repatriation of certain foreign earnings to a U.S. tax payer, provided certain criteriaare met. The Company is currently analyzing this tax legislation to determine its impact, if any, on the Company’s futureincome tax accounting and consolidated financial statements.
13. COMMITMENTS AND CONTINGENCIES
LeasesThe Company is obligated under leases for certain of its offices and equipment. Rental expense relating to operating leaseswas $5.4 million in 2004, $4.6 million in 2003 and $5.6 million in 2002. Future minimum rental payments under theCompany’s noncancellable operating lease obligations having initial or remaining lease terms in excess of one year are as follows: $5.1 million in 2005; $2.4 million in 2006; $1.8 million in 2007; $700,000 in 2008 and $100,000 in 2009.
Hurricane DamageTwo of the Company’s drilling rigs, the ENSCO 64 jackup rig and ENSCO 25 platform rig, sustained considerable damageduring Hurricane Ivan in September 2004. The physical damage to the rigs, as well as the related removal and recovery costs,are covered by insurance, subject to an aggregate escalating deductible of up to $5.5 million.
Damage to ENSCO 64 is substantial and an analysis to determine the full extent of such damage has not been completed.It is possible ENSCO 64 will be declared a constructive total loss, as defined by the Company’s insurance policies. If this isthe case, the loss will not be subject to a deductible and the Company will receive the total rig insured value of $65.0 million,which will result in the recognition of a gain, as the insurance proceeds exceed the $52.8 million carrying value of the rig. If ENSCO 64 is not declared a constructive total loss, the net proceeds received in connection with the insurance claim willlikely exceed the net book value of the portion of the rig that is determined to be impaired, which will result in therecognition of a gain equal to the amount of such excess.
Repair of the damage to ENSCO 25 is expected to be completed in late February 2005 and a determination of the totaldamage sustained will be finalized at that time.
Due to the uncertainties involved and the amount of time and effort that will be required to fully estimate the damagesustained by the two rigs, the Company has recognized a $5.5 million loss, representing its aggregate insurance deductible.The loss is included in “Other, net” in the consolidated statement of income for the year ended December 31, 2004. Accountsreceivable, net at December 31, 2004, includes a $15.5 million insurance receivable for costs incurred in connection with therecovery of ENSCO 64 and the associated analysis of damages.
Arbitration and civil litigation are pending in relation to a contract entered into with Titan Maritime LLC (the“contractor”) relating to the salvage of the ENSCO 64 legs, major portions of which were imbedded in the sea floor in theaftermath of Hurricane Ivan. The disputes with the contractor arose following termination of the salvage contract by the Company due to various equipment breakdowns, inadequacies and asserted breaches of contract. The contractor seekspayment in full while the Company seeks recovery of unspecified monetary damages from the contractor in such amount as may be established during the proceedings. The Company believes it has meritorious claims against the contractor. Thedecisions to award the contract for the salvage, to terminate the contract, and pursue claims against the contractor were made with the consent and participation of the loss adjuster for the Company’s insurance underwriters, and it is envisionedthat any ultimate liability to the contractor or recovery from the contractor, including associated attorneys’ fees, will be partand parcel of the Company’s insurance claim arising out of the damage sustained to the ENSCO 64 during Hurricane Ivan.Accordingly, the ultimate resolution of the dispute is not anticipated to have any impact on the Company’s results ofoperations. The contractor has invoiced an aggregate $17.1 million, including $13.5 million for services rendered throughDecember 31, 2004 and $3.6 million for services rendered in January 2005 prior to contract termination. The Company haspaid the contractor $9.9 million ($4.6 million through December 31, 2004) and is withholding further payment pendingresolution of disputes.

ENSCO International Incorporated 2004 Annual Report > 51
Other ContingenciesThe Company has been notified that it may be subjected to criminal liability under the U.K. Heath and Safety Executive Actin connection with a fatal injury suffered by an employee on one of its rigs during May 2003. The matter is currently underreview by U.K. authorities and the Company has not formally been charged with an offense. Should the Company be chargedand criminal liability be established, the Company is subject to a monetary fine. The Company currently believes it hasestablished a sufficient reserve in relation to this matter.
In August 2004, the Company and certain subsidiaries were named as defendants in three multi-party lawsuits filed inMississippi State courts involving numerous other companies as co-defendants. The lawsuits seek an unspecified amount of monetary damages on behalf of approximately 120 named individuals alleging personal injury or death, including claimsunder the Jones Act, purportedly resulting from exposure to asbestos on drilling rigs and associated facilities during theperiod 1965 through 1986. The lawsuits are in very preliminary stages and the Company has not determined the number of plaintiffs that were employed by the Company or its subsidiaries or otherwise associated with its drilling operations during the relevant period. The Company intends to vigorously defend against the litigation and, based on informationcurrently available, the Company cannot reasonably estimate a range of possible loss. However, the Company does not expectthe resolution of these lawsuits to have a material adverse effect on its financial position, results of operations or cash flows.However, there can be no assurance as to the ultimate outcome of these lawsuits.
Legislation known as the U.K. Working Time Directive was introduced in August 2003 and may be applicable toemployees of the Company and other drilling contractors that work offshore in U.K. territorial waters or in the U.K. sectorof the North Sea. Certain unions representing offshore employees have claimed that drilling contractors are not in compliancewith the U.K. Working Time Directive in respect of paid time off (vacation time) for employees working offshore on arotational basis (equal time working and off). Based on the information available at this time, the Company does not expectthe resolution of this matter to have a material adverse effect on its financial position, results of operations or cash flows.
The Company and its subsidiaries are named defendants in certain lawsuits and are involved from time to time as partiesto governmental proceedings, including matters related to taxation, all arising in the ordinary course of business. Althoughthe outcome of lawsuits or other proceedings involving the Company and its subsidiaries cannot be predicted with certaintyand the amount of any liability that could arise with respect to such lawsuits or other proceedings cannot be predictedaccurately, management does not expect these matters to have a material effect on the financial position, results of operationsor cash flows of the Company.
14. SEGMENT INFORMATION
In April 2003, the Company completed the sale of its marine transportation fleet (see Note 3 “Discontinued Operations”).The operating results and net carrying value of the marine transportation fleet represent the entire marine transportationservices segment as previously reported by the Company. Accordingly, the Company’s continuing operations now consist ofone reportable segment: contract drilling services. At December 31, 2004, the Company’s contract drilling segment owned and operated a fleet of 53 offshore drilling rigs, including 42 jackup rigs, seven barge rigs, three platform rigs andone semisubmersible rig.
The Company’s operations are concentrated in four geographic regions: North America, Europe/Africa, Asia Pacific and South America/Caribbean. At December 31, 2004, the Company’s North America operations consisted of 18 jackup rigs, three platform rigs and one semisubmersible rig, all located in the U.S. waters of the Gulf of Mexico. The Company’sEurope/Africa operations consist of eight jackup rigs, seven of which are currently deployed in various territorial waters of the North Sea and one is located offshore Nigeria. In Asia Pacific, the Company’s operations currently consist of 15 jackuprigs and one barge rig deployed in various locations. In South America/Caribbean, the Company’s operations consist of sixbarge rigs located in Lake Maracaibo, Venezuela and one jackup rig located offshore Trinidad and Tobago.

ENSCO International Incorporated 2004 Annual Report> 52
The Company attributes revenues to the geographic location where such revenue is earned and assets to the geographiclocation of the drilling rig at December 31 of the applicable year. For new construction projects, assets are attributed to thelocation of future operation if known or to the location of construction if the ultimate location of operation is undetermined.Information by country for those countries that account for more than 10% of total revenues or 10% of the Company’s long-lived assets is as follows (in millions):
Revenues Long-lived Assets
2004 2003 2002 2004 2003 2002
United States $290.0 $298.1 $247.3 $1,014.7 $1,050.0 $1,063.8Denmark 70.8 71.8 98.6 192.7 202.1 206.5United Kingdom 35.7 54.2 70.5 102.8 112.9 117.6Qatar 92.5 48.5 58.8 201.5 25.3 115.2Other foreign countries 279.0 308.6 166.4 919.6 826.9 754.9
Total $768.0 $781.2 $641.6 $2,431.3 $2,217.2 $2,258.0
15. SUPPLEMENTAL FINANCIAL INFORMATION
Consolidated Balance Sheet InformationAccounts receivable, net at December 31, 2004 and 2003 consists of the following (in millions):
2004 2003
Trade $164.0 $146.6Insurance receivable 15.5 –Other 6.4 5.2
185.9 151.8Allowance for doubtful accounts (2.9) (2.4)
$183.0 $149.4
Prepaid expenses and other current assets at December 31, 2004 and 2003 consists of the following (in millions):
2004 2003
Prepaid expenses $17.7 $17.3Inventory 2.7 4.3Deferred tax asset 12.5 9.7Deferred regulatory certification and compliance costs 4.0 3.8Other 6.8 4.8
$43.7 $39.9
Other assets, net at December 31, 2004 and 2003 consists of the following (in millions):
2004 2003
Investment in joint ventures $23.2 $53.8Deferred finance costs 6.7 8.1Prepaid taxes on intercompany transfers of property 12.9 8.2Deferred regulatory certification and compliance costs 3.0 4.2Deferred tax asset 3.2 –Other 7.0 5.5
$56.0 $79.8

ENSCO International Incorporated 2004 Annual Report > 53
Accrued liabilities at December 31, 2004 and 2003 consists of the following (in millions):
2004 2003
Personnel $ 21.6 $ 22.9Taxes 62.4 64.7Other operating expense 35.2 36.6Capital additions 30.7 13.1Interest 5.9 6.0Deferred and prepaid revenue 6.3 2.4ENSCO 64 salvage and damage assessment 10.3 –Other 4.8 2.9
$177.2 $148.6
Consolidated Statement of Income InformationMaintenance and repairs expense related to continuing operations for each of the years in the three-year period endedDecember 31, 2004 is as follows (in millions):
2004 2003 2002
Maintenance and repairs $51.6 $58.2 $45.9
Consolidated Statement of Cash Flows InformationCash paid for interest and income taxes for each of the years in the three-year period ended December 31, 2004 is as follows(in millions):
2004 2003 2002
Interest, net of amounts capitalized $33.4 $33.8 $27.7Income taxes 18.0 10.9 7.2
Capitalized interest totaled $3.9 million in 2004, $2.0 million in 2003 and $5.1 million in 2002.In connection with the acquisition of Chiles on August 7, 2002, the Company recorded current assets of $29.8 million,
property and equipment of $547.9 million, goodwill of $246.5 million, current liabilities of $38.7 million, long-term debt of $153.0 million, other long-term liabilities of $64.6 million, and common stock and additional paid-in capital of$461.8 million. During 2004 and 2003, the Company recorded purchase price adjustments reducing goodwill by $1.7 millionand $7.5 million, respectively, primarily related to deferred taxes.
Financial InstrumentsThe carrying amounts and estimated fair values of the Company’s debt instruments at December 31, 2004 and 2003 are asfollows (in millions):
2004 2003
Estimated EstimatedCarrying Fair Carrying FairAmount Value Amount Value
6.75% Notes $149.7 $161.6 $149.6 $166.57.20% Debentures 148.5 174.7 148.5 166.84.65% Bonds, including current maturities 72.0 65.3 76.5 73.86.36% Bonds, including current maturities 139.4 153.1 152.0 170.85.63% Bonds, including current maturities 40.5 43.2 46.3 50.6
The estimated fair values of the Company’s debt instruments was determined using quoted market prices. The estimatedfair value of the Company’s cash and cash equivalents, receivables, trade payables and other liabilities approximated theircarrying values at December 31, 2004 and 2003. The Company has cash, receivables and payables denominated in currenciesother than functional currencies. These financial assets and liabilities create exposure to foreign currency exchange risk.

ENSCO International Incorporated 2004 Annual Report> 54
When warranted, the Company hedges such risk by entering into purchase options or futures contracts. The Company doesnot enter into such contracts for trading purposes or to engage in speculation. The net fair value of such contracts outstandingat December 31, 2004 and 2003 was $4.0 million and $2.0 million, respectively.
Concentration of Credit RiskThe Company is exposed to credit risk relating to its receivables from customers, its cash and cash equivalents and its useof derivative instruments in connection with the management of interest rate risk and foreign currency risk. The Companyminimizes its credit risk relating to receivables from customers, which consist primarily of major and independent oil andgas producers as well as government-owned oil companies, by performing ongoing credit evaluations. The Company alsomaintains reserves for potential credit losses, which to date have been within management’s expectations. The Companyminimizes its credit risk relating to cash and investments by focusing on diversification and quality of instruments. Cashbalances are maintained in major, highly-capitalized commercial banks. Cash equivalents and investments consist of aportfolio of high-grade instruments. Custody of cash equivalents and investments is maintained at several major financialinstitutions and the Company monitors the financial condition of those financial institutions. The Company minimizes itscredit risk relating to the counterparties to its derivative instruments by transacting with multiple, high-quality counterparties,thereby limiting exposure to individual counterparties, and by monitoring the financial condition of those counterparties.
During 2004, no customer provided more than 10% of consolidated revenues. Revenues from one customer exceeded10% of consolidated revenues in both 2003 and 2002 and were $100.4 million, or 13% of consolidated revenues in 2003,and $90.8 million, or 14% of consolidated revenues in 2002. Revenues from a second customer were $85.6 million, or 11% of consolidated revenues, in 2003.
16. UNAUDITED QUARTERLY FINANCIAL DATA
A summary of unaudited quarterly consolidated income statement data for the years ended December 31, 2004 and 2003, isas follows (in millions, except per share amounts):
First Second Third Fourth2004(1) Quarter Quarter Quarter Quarter Year
Operating revenues $186.5 $181.4 $190.9 $209.2 $768.0Operating expenses
Contract drilling 107.4 107.0 105.4 105.7 425.5Depreciation and amortization 35.6 36.0 36.0 36.5 144.1General and administrative 5.7 7.4 6.8 6.4 26.3
Operating income 37.8 31.0 42.7 60.6 172.1Interest income .8 .8 .9 1.2 3.7Interest expense, net (10.0) (9.7) (8.7) (8.2) (36.6)Other income (expense), net .5 1.0 (1.2) 0.0 .3Income from continuing operations before income taxes 29.1 23.1 33.7 53.6 139.5Provision for income taxes 7.8 5.1 8.0 15.1 36.0Income from continuing operations 21.3 18.0 25.7 38.5 103.5Income (loss) from discontinued operations (.3) (.5) .1 – (.7)Net income $ 21.0 $ 17.5 $ 25.8 $ 38.5 $102.8
Earnings (loss) per share – basicContinuing operations $ .14 $ .12 $ .17 $ .26 $ .69Discontinued operations (.00) (.00) .00 – (.01)
$ .14 $ .12 $ .17 $ .26 $ .68
Earnings (loss) per share – dilutedContinuing operations $ .14 $ .12 $ .17 $ .26 $ .69Discontinued operations (.00) (.00) .00 – (.01)
$ .14 $ .12 $ .17 $ .26 $ .68

ENSCO International Incorporated 2004 Annual Report > 55
First Second Third Fourth2003(1) (2) Quarter Quarter Quarter Quarter Year
Operating revenues $192.9 $194.3 $197.3 $196.7 $781.2Operating expenses
Contract drilling 109.5 109.0 112.8 113.9 445.2Depreciation and amortization 31.8 32.6 32.6 33.2 130.2General and administrative 5.9 4.8 5.2 6.1 22.0
Operating income 45.7 47.9 46.7 43.5 183.8Interest income .7 .9 .9 .9 3.4Interest expense, net (9.2) (9.1) (8.9) (9.5) (36.7)Other income (expense), net .2 (1.4) .8 2.1 1.7Income from continuing operations before income taxes 37.4 38.3 39.5 37.0 152.2Provision for income taxes 10.7 10.9 11.3 10.2 43.1Income from continuing operations 26.7 27.4 28.2 26.8 109.1Income (loss) from discontinued operations (3.8) 3.7 (.4) (.3) (.8)Net income $ 22.9 $ 31.1 $ 27.8 $ 26.5 $108.3
Earnings (loss) per share – basicContinuing operations $ .18 $ .18 $ .19 $ .18 $ .73Discontinued operations (.03) .03 (.00) (.00) (.01)
$ .15 $ .21 $ .19 $ .18 $ .72
Earnings (loss) per share – dilutedContinuing operations $ .18 $ .18 $ .19 $ .18 $ .73Discontinued operations (.03) .03 (.00) (.00) (.01)
$ .15 $ .21 $ .19 $ .18 $ .72
(1) In May 2004, the Company transferred three rigs (ENSCO 23, ENSCO 24 and ENSCO 55) to KFELS as partial payment for the construction of a new highperformance premium jackup rig to be named ENSCO 107. The results of operations of ENSCO 23, ENSCO 24 and ENSCO 55 have been reclassified as discontinuedoperations for the unaudited quarterly consolidated income statement data for 2004 and 2003.
(2) In April 2003, the Company sold its 27-vessel marine transportation fleet, which represented the entire marine transportation services segment previously reported by theCompany. The results of operations of the marine transportation services segment have been reclassified as discontinued operations for the unaudited quarterly consolidatedincome statement data for 2003.
17. SUBSEQUENT EVENTS
In February 2005, the Company exercised its option and acquired ENSCO 106 from EEL II for a net payment of $79.6 million(see Note 6 “Investment in Joint Ventures”).

ENSCO International Incorporated 2004 Annual Report> 56
Selected Consolidated Financial Data
The selected consolidated statement of income data set forth below for each of the years in the five-year period endedDecember 31, 2004 has been derived from the Company’s audited consolidated financial statements. This information shouldbe read in conjunction with the audited consolidated financial statements and notes thereto.
Year Ended December 31,
(in millions, except per share amounts) 2004(1) 2003(2) 2002(3) 2001 2000
Consolidated Statement of Income DataRevenues $ 768.0 $ 781.2 $ 641.6 $ 731.0 $ 473.7Operating expenses
Contract drilling 425.5 445.2 341.5 309.3 249.5Depreciation and amortization 144.1 130.2 112.0 103.6 88.4Impairment of assets – – 59.9 9.2 –General and administrative 26.3 22.0 18.6 16.8 13.3
Operating income 172.1 183.8 109.6 292.1 122.5Other expense, net (32.6) (31.6) (19.6) (25.4) (6.6)Income from continuing operations before
income taxes 139.5 152.2 90.0 266.7 115.9Provision for income taxes 36.0 43.1 28.8 75.1 36.6Income from continuing operations 103.5 109.1 61.2 191.6 79.3Income (loss) from discontinued operations (.7) (.8) (1.9) 15.7 6.1Net income $ 102.8 $ 108.3 $ 59.3 $ 207.3 $ 85.4
Earnings (loss) per share – basicContinuing operations $ .69 $ .73 $ .43 $ 1.40 $ .58Discontinued operations (.01) (.01) (.01) .11 .04
$ .68 $ .72 $ .42 $ 1.51 $ .62
Earnings (loss) per share – dilutedContinuing operations $ .69 $ .73 $ .43 $ 1.39 $ .57Discontinued operations (.01) (.01) (.01) .11 .04
$ .68 $ .72 $ .42 $ 1.50 $ .61
Weighted average common shares outstanding:Basic 150.5 149.6 140.7 136.9 137.6Diluted 150.6 150.1 141.4 137.9 139.3
Cash dividends per common share $ .10 $ .10 $ .10 $ .10 $ .10
Consolidated Balance Sheet DataWorking capital $ 277.9 $ 355.9 $ 189.2 $ 312.0 $ 171.6Total assets 3,322.0 3,183.0 3,061.5 2,323.8 2,108.0Long-term debt, net of current portion 527.1 549.9 547.5 462.4 422.2Stockholders’ equity 2,181.9 2,081.1 1,967.0 1,440.2 1,328.9
(1) During 2004, the Company transferred three rigs (ENSCO 23, ENSCO 24 and ENSCO 55) to a shipyard as partial payment for the construction of a new highperformance premium jackup rig to be named ENSCO 107. The results of operations of ENSCO 23, ENSCO 24 and ENSCO 55 have been reclassified as discontinuedoperations for each of the years in the five-year period ended December 31, 2004.
(2) During 2003, the Company sold its 27-vessel marine transportation fleet, which represented the entire marine transportation services segment previously reported by theCompany. The results of operations of the marine transportation services segment have been reclassified as discontinued operations for each of the years in the four-year periodended December 31, 2003.
(3) The Company acquired Chiles on August 7, 2002. Consolidated Statement of Income Data includes the results of Chiles from the acquisition date.

ENSCO International Incorporated 2004 Annual Report > 57
Forward-Looking Statements
This Annual Report contains forward-looking statements by management and the Company that are subject to a number ofrisks and uncertainties. The forward-looking statements contained in the report are based on information as of the date ofthis report. The Company assumes no obligation to update these statements based on information from and after the date ofthis report. Generally, forward-looking statements include words or phrases such as “anticipates,” “believes,” “estimates,”“expects,” “intends,” “plans,” “projects,” “could,” “may,” “might,” “should,” “will” and words and phrases of similar impact.The forward-looking statements include, but are not limited to, statements regarding future operations, future oil and gasdemand or production, industry trends or conditions, or the business environment; statements regarding future levels of, ortrends in, day rates, utilization, revenues, operating expenses, capital expenditures, financing and funding; and statementsregarding future construction, enhancement or upgrade of rigs, future mobilization, relocation or other movement of rigs,and future rig demand, availability or suitability. The forward-looking statements are made pursuant to safe harborprovisions of the Private Securities Litigation Reform Act of 1995. Numerous factors could cause actual results to differmaterially from those in the forward-looking statements, including the following: (i) industry conditions and competition,(ii) fluctuations in the price of oil and natural gas, (iii) regional and worldwide expenditures for oil and gas drilling, (iv)demand for oil and gas, (v) operational risks, contractual indemnities and insurance, (vi) risks associated with operating inforeign jurisdictions, (vii) environmental liabilities that may arise in the future that are not covered by insurance orindemnity, (viii) the impact of current and future laws and government regulation, as well as repeal or modification of same,affecting the oil and gas industry, the environment, taxes or the Company’s operations in particular, (ix) changes in costsassociated with rig construction or enhancement, as well as changes in dates rigs being constructed or undergoingenhancement will enter a shipyard, be delivered from a shipyard, or enter service, (x) renegotiations, nullification, or breachesof contracts with customers, vendors, subcontractors or other parties, (xi) unionization or similar collective actions by theCompany’s employees, (xii) consolidation among the Company’s competitors or customers, (xiii) changes in worldwide andregional supplies of drilling rigs, (xiv) the determination of whether ENSCO 64 will be repaired or declared a constructivetotal loss and (xv) the risks described elsewhere herein and from time to time in the Company’s reports to the Securities andExchange Commission.

ENSCO International Incorporated 2004 Annual Report> 58
Stockholder Information
QUARTERLY HIGH/LOW STOCK PRICE
2003 High Low
First $30.75 $24.24Second $31.10 $24.32Third $28.43 $23.58Fourth $29.00 $24.49Year $31.10 $23.58
2004 High Low
First $30.79 $26.35Second $29.16 $24.95Third $33.15 $26.95Fourth $34.15 $28.25Year $34.15 $24.95
The Company’s Common Stock (“ESV”) is traded on theNew York Stock Exchange (NYSE). At February 1, 2005,there were approximately 1,280 stockholders of record of the Company’s Common Stock.
EXECUTIVE OFFICES
ENSCO International Incorporated500 North Akard Street, Suite 4300Dallas, Texas 75201-3331(214) 397-3000www.enscous.com
INVESTOR RELATIONS DEPARTMENT
ENSCO International Incorporated500 North Akard Street, Suite 4300Dallas, Texas 75201-3331(214) 397-3000
STOCK DIVIDENDS
The Company paid four quarterly cash dividends of $.025 per share during 2004.
INDEPENDENT ACCOUNTANTS
KPMG LLP Dallas, Texas
TRANSFER AGENT
American Stock Transfer and Trust Company40 Wall StreetNew York, New York 10005-2392(718) 921-8200(800) 937-5449
NOTICE OF ANNUAL MEETING
The Annual Meeting of Stockholders will be held at 10:00 a.m. C.D.T., May 3, 2005, at the Fairmont Hotel,1717 N. Akard Street, Dallas, Texas 75201-2344.
FORM 10-K AND ADDITIONAL INFORMATION
The Company’s Annual Report on Form 10-K filed with the Securities Exchange Commission is available in the SEC Filings section of the Company’s website and may beobtained without charge by contacting ENSCO’s InvestorRelations Department.
Analysts requesting additional information should contactENSCO’s Investor Relations Department. Communicationsconcerning transfer requirements, lost certificates andchanges of address should be directed to the Transfer Agent.
CORPORATE GOVERNANCE, BOARD AND
BOARD COMMITTEES, WEBSITE DATA
The Corporate Governance section of the Company’s website,www.enscous.com/CorpGov.asp, contains informationregarding (i) the composition of the Company’s Board ofDirectors and Board Committees, (ii) Corporate Governancein general, (iii) Shareholder communications with the Board,(iv) the ENSCO Code of Business Conduct Policy, (v) theENSCO Corporate Governance Policy, (vi) “whistleblower”reporting provisions, and (vii) the charters of the committeesof the Company’s Board of Directors. Copies of foregoingdocuments may be obtained without charge by contactingENSCO’s Investor Relations Department. The Company’swebsite contains a direct link to the Company’s SEC filings,including reports required under Section 16 of theSecurities Exchange Act of 1934.
CEO AND CFO CERTIFICATIONS
The Annual CEO Certification pursuant to the New YorkStock Exchange (NYSE) Listed Company Manual (Section303A.12(a)) was filed with the NYSE on May 14, 2004.Additionally, certifications of the CEO and CFO pursuantto Rule 13a-14 or 15d-14 of the Securities Exchange Act of1934, as adopted pursuant to Section 302 of the Sarbanes-OxleyAct of 2002, were filed with the SEC as exhibits in theCompany’s 2004 Form 10-K. All of the aforementionedcertifications were fully compliant and without qualification.

ENSCO International Incorporated 2004 Annual Report > 59
Officers
Carl F. ThorneChairman of the Board and Chief Executive Officer
William S. Chadwick, Jr.Senior Vice President – Operations
Jon C. ColeSenior Vice President – Business Development and Safety,Health, Environment
P.J. SailePresident – ENSCO Offshore International Company
J.W. SwentSenior Vice President – Chief Financial Officer
Richard A. LeBlancVice President – Investor Relations
H.E. Malone, Jr.Vice President – Finance
Paul MarsVice President – Engineering
Charles A. MillsVice President – Human Resources and Security
Cary A. Moomjian, Jr.Vice President, General Counsel and Secretary
David A. ArmourController
Ramon YiTreasurer

ENSCO International Incorporated 2004 Annual Report> 60
Board of Directors
Carl F. ThorneChairman of the Board and Chief Executive Officer
David M. Carmichael(2)
Private Investor
Gerald W. Haddock(1)
Private Investor
Thomas L. Kelly II (2)
General Partner,CHB Capital Partners
Morton H. Meyerson(2)
Chairman and Chief Executive Officer,2M Companies, Inc.
Rita M. Rodriguez(1)
Senior Fellow at Woodstock Theological Center ofGeorgetown University
Paul E. Rowsey, III (1)
Managing DirectorE2M Partners, LLC
Joel V. Staff (2)
Chairman and Chief Executive Officer, Reliant Energy, Inc.
(1) Audit Committee
(2) Nominating, Governance and Compensation Committee

E N S C O B O A R D O F D I R E C T O R S (from left to right):
David M. Carmichael, Thomas L. Kelly II, Gerald W. Haddock, Joel V. Staff, Paul E. Rowsey, III,
Morton H. Meyerson, Rita M. Rodriguez, and Carl F. Thorne
This photograph was taken during a recent Board of Directors’ meeting which was held at our
Europe & Africa Business Unit in Aberdeen, Scotland.
Total Assets$ in millions
2,108.0
E N S C O I N T E R N A T I O N A L I N C O R P O R A T E D I S A P R E M I E R G L O B A L O F F S H O R E O I L A N D G A S
D R I L L I N G C O N T R A C T O R . Our modern fleet of 54 offshore drilling rigs serves most of the major oil and
gas provinces of the world through our three major business units, including North & South America, Europe
& Africa, and Asia & Pacific Rim. The Company is headquartered in Dallas, Texas, and is publicly traded on
the New York Stock Exchange under the symbol of ESV.
2,323.8
3,061.53,183.0
3,322.0
Stockholders’ Equity$ in millions
1,328.91,440.2
1,967.02,081.1
2,181.9
00 01 02 03 04
Net Income$ in millions
85.4
207.3
59.3
108.3 102.8
FINANCIAL HIGHLIGHTS
2004 2003 2002 2001 2000(in millions, except per share amounts and ratios)
Revenues * $ 768.0 $ 781.2 $ 641.6 $ 731.0 $ 473.7Net Income 102.8 108.3 59.3 207.3 85.4Diluted Earnings Per Share 0.68 0.72 0.42 1.50 0.61Working Capital 277.9 355.9 189.2 312.0 171.6Total Assets 3,322.0 3,183.0 3,061.5 2,323.8 2,108.0Long-Term Debt 527.1 549.9 547.5 462.4 422.2Stockholders’ Equity 2,181.9 2,081.1 1,967.0 1,440.2 1,328.9Current Ratio 2.3 2.9 2.0 3.1 2.5Long-Term Debt to Total Capital 0.19 0.21 0.22 0.24 0.24
* During 2004, the Company transferred three rigs (ENSCO 23, ENSCO 24 and ENSCO 55) to a shipyard as partial payment for the construction of a new high performancepremium jackup rig to be named ENSCO 107. The Company’s revenues for each of the years in the five-year period ended December 31, 2004 have been restated to reclassify theoperating results of the ENSCO 23, ENSCO 24 and ENSCO 55 as discontinued operations. During 2003, the Company sold its 27-vessel marine transportation fleet, whichrepresented the entire marine transportation services segment previously reported by the Company. The Company’s revenues for each of the years in the four-year period endedDecember 31, 2003 have been restated to reclassify the operating results of the Company’s marine transportation services segment as discontinued operations.
00 01 02 03 04 00 01 02 03 04

>> R I G H T T I M E >> R I G H T P L A C E >> R I G H T C O M P A N Y
EN
SC
O
IN
TE
RN
AT
IO
NA
L
IN
CO
RP
OR
AT
ED
2004 An
nu
al R
ep
ort
ENSCO International Incorporated
500 North Akard Street
Suite 4300
Dallas, TX 75201-3331
www.enscous.com
2004 Annual Report
E N S C O I N T E R N A T I O N A L I N C O R P O R A T E D