Enron Corporation and Using EVA to Consolidate Special Purpose Entities ... · 1 Enron Corporation...
20
1 Enron Corporation and Using EVA to Consolidate Special Purpose Entities Neal M. Stoughton Graduate School of Management University of California at Irvine February, 2003 ABSTRACT Beginning with the downfall of the Enron Corporation in 2001 extraordinary attention has been focused on the use of special purpose entities (SPEs), structured finance and other methods of managing earnings for the purpose of artificially inflating stock prices of American companies. This paper shows that the principles of shareholder value, when properly applied, can resolve these difficulties. Economic Value Added ® (EVA) along with modern risk management techniques can be used to design an appropriate method of accounting for and consolidating special purpose entities into the financial statements of parent firms. The basic idea is to include an additional liability for the credit risk deficiency of the SPE on the balance sheet of the parent. The method is illustrated with numerical examples from several of the infamous Enron SPEs. The authors web site is http://www.gsm.uci.edu/stoughton , on which updated versions of the paper may be obtained.
Transcript of Enron Corporation and Using EVA to Consolidate Special Purpose Entities ... · 1 Enron Corporation...

1
Enron Corporation and Using EVA to Consolidate Special Purpose Entities
Neal M. Stoughton Graduate School of Management University of California at Irvine
February, 2003
ABSTRACT
Beginning with the downfall of the Enron Corporation in 2001 extraordinary attention has been focused on the use of special purpose entities (SPEs), structured finance and other methods of managing earnings for the purpose of artificially inflating stock prices of American companies. This paper shows that the principles of shareholder value, when properly applied, can resolve these difficulties. Economic Value Added ® (EVA) along with modern risk management techniques can be used to design an appropriate method of accounting for and consolidating special purpose entities into the financial statements of parent firms. The basic idea is to include an additional liability for the credit risk deficiency of the SPE on the balance sheet of the parent. The method is illustrated with numerical examples from several of the infamous Enron SPEs.
The authors web site is http://www.gsm.uci.edu/stoughton, on which updated versions of the paper may be obtained.

2
“We would have a very strange accounting standard that was focused on the outcome that is a 1-in-a-100 chance, as opposed to the outcome that is a 99-out-of-100 chance.”
- J. Kravitt at 1996 FASB hearings supporting nonconsolidation of special purpose entities.
Beginning with the downfall of the Enron Corporation in 2001 extraordinary attention has been
focused on the use of special purpose entities (SPEs), structured finance and other methods of
managing earnings for the purpose of artificially inflating stock prices of American companies.
Corporate scandals were the top general news story in 2002.1 As a consequence, top executives
have been indicted, one of the big-five accounting firms (Arthur Anderson) was forced into
liquidation, firms have been forced into bankruptcy protection and major new regulatory
initiatives were enacted by the congress of the United States. All of this poses the greatest
challenge ever faced by proponents of the shareholder value movement.
The purpose of this paper is to show instead that the principles of shareholder value,
when properly applied, can resolve these difficulties. Indeed Economic Value Added ® (EVA)
along with modern risk management techniques can be used to design an appropriate method of
accounting for and consolidating special purpose entities into the financial statements of parent
firms. That is, instead of abandoning shareholder value concepts, or instead relying on
overbearing legalistic regulations, it is possible to design a consolidation method that is both
practical and also provides an economically meaningful measure of the risk impact involved in
special purpose entities. In order to illustrate the method proposed here, we apply it to the well-
known special purpose entities created by Enron to manage its earnings in 1999 and 2000.
Recently the Financial Accounting Standards Board (FASB) of the U.S. has produced an
interpretation of Accounting Research Bulletin No. 51 involving the consolidation of business 1 Three female ‘whistleblowers’ were named as Persons of the Year by Time Magazine for 2002.

3
statements.2 This interpretation of longstanding regulations from the 1950s increases the equity
requirement for nonconsolidation to 10% from 3% and also attempts to introduce a risk-based
test. This test, however, is based on expected losses rather than a true measure of risk as applied
in other contexts at financial institutions. Moreover, the only possible outcomes are either 100%
consolidation or 0% consolidation – which can exaggerate attempts to game the regulations. The
approach detailed here is based on market principles of internalizing the appropriate level of risk
within the parent company. The approach we document is capable of internalizing decisions to
utilize SPEs within optimal risk management principles.
Background
The genesis of the problems at the Enron Corporation arose relatively quickly and involved a
volatile mixture of two key ingredients. The first ingredient was the issuance of FAS statement
No. 133 in 1998, Accounting for Derivative Instruments and Hedging Activities, which applied
beginning in 1999. This statement required firms such as Enron to attempt to use so-called fair-
value accounting treatments to mark-to-market all of their energy contracts and positions in
merchant assets. For instance, if Enron had a long term energy contract it would have to attempt
to value the future cash flows from such a contract and then to value this stream and include all
of the gains or losses into earnings in the current year. This created a new source of income
statement volatility, and dealing with it became a major concern of the Enron executives.
The second key ingredient for disaster was the fact that Enron as well as many other
firms were utilizing earnings management practices. Earnings management occurs when firms
use accounting ‘interpretations’ to make decisions that effectively shift earnings from one period
to another. There are many legitimate differences in interpretations that make this feasible.
2 FASB Interpretation No. 46, Consolidation of Variable Interest Entites, an interpretation of ARB No. 51, January 2003.

4
However, Enron was so driven to ‘hedge’ their income statement volatility that they felt it was
necessary to do this regardless of the cost or potential calamity involved. Initially they
approached a number of financial institutions attempting to get them to hedge their holdings.
But after this proved futile, they decided to set up their own hedging vehicle – the SPE. As a
result, in June 1999 they enlisted Andrew Fastow their CFO to set up the LJM1 partnership and
create an SPE that was designed to hedge the equity interest that Enron had in a newly public
firm called Rhythms Netconnections. The rest is history.
There is a large literature in both the theoretical as well as empirical area that documents
possible reasons for earnings management. Theoretical models inevitably require some element
of market inefficiency in which shareholders are unable to ‘reverse engineer’ the earnings
management (Stein 1989). For instance Titman and Trueman (1988) developed a model in
which earnings management signals a lower variance of cash flows and therefore this results in a
higher valuation of the firm. Another explanation is that managerial compensation is based on
nominal contracts which are dynamically updated over time. If there is a ‘ratchet-effect’ in
which past performance establishes a benchmark for future performance then a risk averse
manager will want to smooth performance measures over time.
There is strong evidence of earnings management provided in the empirical literature.
Most remarkably Hayn (1995) shows that small increases in earnings are unusually common
whilst small increases in losses are unusually rare. This is not consistent with a symmetric
distribution of changes in earnings. Degeorge et al (1999) find that there is a hierarchy in
management techniques: firms first attempt to avoid losses, then they increase earnings and
finally try to meet analysts expectations. Barth et al (1999) find that firms reporting continuous
growth in earnings are priced at a premium relative to other firms with otherwise similar

5
characteristics. Teoh et al (1998) show that reported earnings are unusually high at the time of
secondary equity offerings. Finally Dechow et al (1996) consider governance principles and find
that these are weaker for firms practicing greater degrees of earnings management.
Consolidation
At the time of the Enron debacle, the major issue that regulators, the U.S. congress and the U.S.
Justice Department were concerned about concerned the question of whether Enron should have
consolidated their SPEs into the parent company. Indeed the restatements that occurred and
triggered the sharp stock price selloff were due to ex post consolidation. FAS No. 51 originating
in 1959 states that “there is a presumption that consolidated statements are more meaningful than
separate statements and that they are usually necessary for a fair presentation when one of the
companies in the group directly or indirectly has a controlling financial interest in the other
companies…”. This seems to imply that SPEs ought to have been consolidated. However two
conditions were employed to overcome this conclusion. If an independent owner makes a
substantive capital investment (judged to be 3% of total capital) or if an independent owner
exercises control over the SPE then consolidation would not be required.
Newly issued regulations continue to focus on the whether the SPE should be
consolidated or not, i.e., ‘all or nothing’. In FASB Interpretation No. 46, again the presumption
is in favor of consolidation. Now the outside equity requirement has been raised to 10% from
3%, but an additional test has been proposed based on ‘expected losses’. Expected losses are
defined as the difference between the mean cash flow and expected cash flows conditional on
being below the mean cash flow. If the outside equity in the SPE (or variable interest entity as it
has been redefined) is greater than these expected losses, then it is possible that the 10%
requirement could be waived. Conversely if the equity were judged to be insufficient based on

6
these expected losses, the SPE would need to be consolidated even if the 10% outside equity
requirement was met. There are two potential difficulties with this approach: (1) the notion of
expected losses is arbitrary and does not correspond to any risk measure used in risk
management practices at modern financial institutions; (2) the result of the regulations is either
no consolidation or 100% consolidation with no middle ground. The incentive will be for firms
to go to extraordinary lengths to minimally satisfy the constraints since the final consequences
are so disparate.
Optimal Risk Management
The method we propose here involves a variable amount of consolidation, depending on the
amount of risk that is imposed on the parent firm. This method is rooted in the literature on risk
management for financial institutions. Indeed, corporations such as Enron that were engaged in
an extraordinary amount of financial contracting adopt many of the characteristics of large
multinational banks, with their many disparate activities, organized in different divisions. The
use of EVA on a divisional level was considered in Stoughton and Zechner (1999) who derived
the optimal amount of economic capital to be allocated to divisions under conditions of both
symmetric as well as asymmetric information. They showed that the amount of equity capital, E,
allocated to a division must be augmented by the economic or risk capital taken up when a firm
satisfies a capital structure constraint that ties its equity to the overall risk of the firm. In
particular they demonstrated that if the overall firm equity satisfies a value at risk (VaR)
criterion, then the amount of economic capital should be directly related to the incremental value
at risk of the division in question.3 The use of VaR in bank capital regulation is now standard.
In 1996 the Bank of International Settlements adopted the amendment to the Basel accord
3 The VaR is the maximum unexpected loss that occurs with a given confidence level (probability) for a given horizon. The incremental VaR is the marginal change in the overall firm VaR with respect to the change in risk of an individual division.

7
covering market risk; now banks have been able to apply their own internal models to measure
VaR.4 In this case the economic capital is equal to a multiple of the VaR calculated using a
probability of solvency equal to 99% over a 10 day window.
When divisional managers are compensated based on EVA they will have incentives to
adopt the level of risk-taking that is consistent with the overall firm optimum. In this case EVA
is implemented via the following equation:
ErNIEVA E−= ,
where NI is the net income of the division, rE, is the cost of equity capital and E is the amount of
economic capital allocation. We now show how this procedure can be adapted for the case of
SPEs.
Step One
The first step is to develop of quantitative model of the net income of the SPE in the form of a
probability distribution of flows at a future point in time. For the types of contracts involved in
the Enron situation, the cash flows are often dependent on some type of underlying asset. Thus
the tools of derivatives analysis may be used to derive the probability distribution. In this respect
payoff diagrams that have been often applied to options pricing can be utilized.
Step Two
The next step is to determine the (incremental) VaR of this probability distribution. While
optimality across multiple SPEs could conceivably utilize the incremental concept, it is
obviously easier to ignore cross-correlations and use unadjusted VaR for each SPE. In doing so,
this would represent a conservative approach.
Step Three
4 This method is being extended to credit risks in the new Basel II accord to be finalized in 2003.

8
Next, the VaR for the SPE is compared with the amount of equity capital as of the time of
assessment. If for instance, the SPE is being initiated, then the equity capital would be the
original book value. If the equity capital is greater than the VaR then there is no risk imposition
on the parent firm and therefore no consolidation would be necessary. However, in the more
interesting scenario where the VaR exceeded the equity capital, then the difference or deficiency
would be transferred back to the parent. When the parent owns a partial fraction of equity, then
this fraction times the deficiency would be transferred back to the parent.
Step Four
This is the final stage in the consolidation process. The amount of the deficiency attributable to
the parent is placed on the balance sheet of the parent as an additional liability. This additional
liability will be larger the more risk is undertaken by the SPE relative to its own equity capital
and the lower is the amount of outside equity or guarantees provided by investors other than the
parent firm. It therefore satisfies the basic requirement that consolidation be related to both risks
as well as outside equity capital. However it is far from an all-or-nothing criterion leading either
to no consolidation or 100% consolidation.
In order to assure that the decision of the parent to utilize an SPE is optimal, it is crucial
that managers are given incentives by the EVA compensation schedule. The net income of the
SPE is also proportioned according to equity ownership and allocated back to the parent. Then
the risk capital deficiency entered onto the parents liabilities is multiplied times the cost of equity
capital and compared to the net income to see whether the EVA is positive. This then provides
the ex post criterion for determining whether optimality has been achieved.
Examples

9
We now illustrate the above method using two of the most prominent SPEs of the Enron
Corporation. The major source of information about the structure of the SPEs is the Powers
(2002) report.
Rhythms Netconnections
The Rhythms transaction was the first attempt by Enron to hedge their income statement risk.
Rhythms was a DSL provider for business that went public on April 7, 1999 at a price of $21. In
March 1998 Enron had purchased a stake in the firm worth $10 million by purchasing stock at
$1.85. Immediately after the IPO, the price of Rhythms had gone up to $69 implying that Enrons
stake was now worth approximately $300; but it was subject to the ‘lockup’ restriction.
Nevertheless this stake had to be marked to market. Because of the inability to hedge through
more conventional means, Enron solicited assistance from their CFO, Andrew Fastow, who put
together a consortium of investors called LJM1. Enron capitalized the Rhythms with $80 million
of Enron restricted stock obtained from restructuring forward contracts that they had purchased
earlier. The partners in LJM1 put up $15 million of cash of which $3.75 was given to the
Rhythms SPE representing the minimal 3% equity requirement. The Rhythms SPE then wrote
put options to Enron on Rhythms stock in order to insure Enron against price declines. The
structure of the deal appears in Figure 1.

10
Figure 1: Rhythms Transaction
Based on the transactions illustrated in Figure 1: Rhythms Transaction, the cash flow
implications to Enron can be illustrated on a 3-dimensional graph as a function of the Enron and
Rhythms stock prices. Figure 2: Rhythms Payoff Diagram illustrates payoff to Enron.
0 6
12 18 24 30 36 42 48 54 60 66 72 78 84 90 96
0
12
24
36
48
60
728496
-$300,000,000
-$250,000,000
-$200,000,000
-$150,000,000
-$100,000,000
-$50,000,000
$0
$50,000,000
$100,000,000
$150,000,000
$200,000,000
Rhythms Stock Price
Enron Stock Price
Put options on 5.4mm Rhythms stock
LJM1
LJM Swap Sub
(SPE)
ENE Shares 3.4 mm
$64 mm note
$3.75 mm cash 1.6 mm ENE shares
Figure 2: Rhythms Payoff Diagram

11
As can be seen above the consequences to Enron are very dire when Enrons stock price and the
Rhythms stock price simultaneously decline. In this case the potential loss is $300 million. We
performed a Monte Carlo simulation using the parameter values in Table 1: Rhythms Simulation
Parameters
Time Horizon 1 year Solvency Probability 97% ENE stock mean 20% ENE stock standard deviation 40% ENE initial stock price $81 Rhythms stock mean 0% Rhythms stock standard deviation 200% Rhythms price $56 Rhythms put exercise price $56 Correlation coefficient between Rhythms and Enron
0.50
Table 1: Rhythms Simulation Parameters
The probability distribution of cash flows from the SPE back to Enron is illustrated in Figure 3:
Rhythms Cash Flow Distribution
Figure 3: Rhythms Cash Flow Distribution
Frequency Chart
Certainty is 96.80% from -204,357,755.64 to +Infinity
.000
.009
.018
.026
.035
0
8.75
17.5
26.25
35
-243,519,544.70 -59,948,658.48 123,622,227.73 307,193,113.94 490,764,000.16
1,000 Trials 996 Displayed
Forecast: Rhythms Payoff
12
As can be seen above, the VaR for the Rhythms transaction is about $200 million. This is the
amount that would need to be added as a liability for Enron just for this single SPE.
Unfortunately for Enron the ‘hedge’ did not function as anticipated. The put had one
sided volatility and time volatility. After adding 4 more derivative zero-cost transactions, the
SPE was wound up in March 2000, after the expiration of the lockup on the Rhythms stock. At
the time, the risk analysis group of Enron had estimated the probability of default of the SPE at
68%. The unwinding transaction was of questionable value for Enron as the valuation of the put
was suspect. Nevertheless the Rhythms transaction did not lead to the greatest impact in the
eventual restatement of Enrons financials.
The Raptors
Of somewhat greater consequence for the downfall of Enron were the four Raptors transactions.
We provide an analysis based on the risk management principles of the first of these. The basic
idea was similar in concept to Rhythms. Enron had appreciated value in terms of forward
contracts on its stock. However it was subject to income statement volatility by needing to mark
to market the various merchant investments.5 Enron utilized the four Raptors vehicles between
the third quarter of 2000 and the third quarter of 2001. During this period Enron reported $1.5
billion of earnings, whilst avoiding $1 billion of losses due to the merchant investments. Raptor
I was consummated on May 2, 2000. The SPE associated with Raptor I was called Talon and
was designed to facilitate derivative transactions amongst many merchant investments. Most of
these derivative transactions were of the form of total return swaps (forward contracts where the
SPE would pay losses and Enron would pay gains). Talon was capitalized with Enron stock, a
$50 million note and a tiny amount of cash. For this purpose Fastow again organized a new
5 Merchant investments are investments in various activities, firms and partnerships, often not publicly traded.

13
partnership called LJM2 and arranged a $30 million equity capital injection into Talon.
However before undertaking the derivative transactions, LJM2 insisted on a return on capital
equal to $41 million. As a result, Enron purchased a put option on its own stock, thereby
effectively betting on a decline in its share price. Figure 4: Raptor I Structure indicates the
structure of the Raptor I transaction.
Figure 4: Raptor I Structure
To further illustrate the method, we compare the risk deficiency imparted to Enron by Raptor I at
three stages during the process. The payoff to Enron as a function of the Enron stock price is
illustrated in Figure 5: Initial Raptor I Payoff prior to the use of the put option. Also, this figure
represents the payoff before any derivative transactions are implemented.
LJM2
Talon (SPE)
$30mm cash
ENE stock Contingent Forwards $50 mm note $1K cash $400 mm note
Share settled put
Derivative Transactions
$41 mm put prem.
14
-$400,000,000
-$300,000,000
-$200,000,000
-$100,000,000
$0
$100,000,000
$200,000,000
$300,000,000
$400,000,000
$500,000,000
0 10 20 30 40 50 60 70 80 90 100
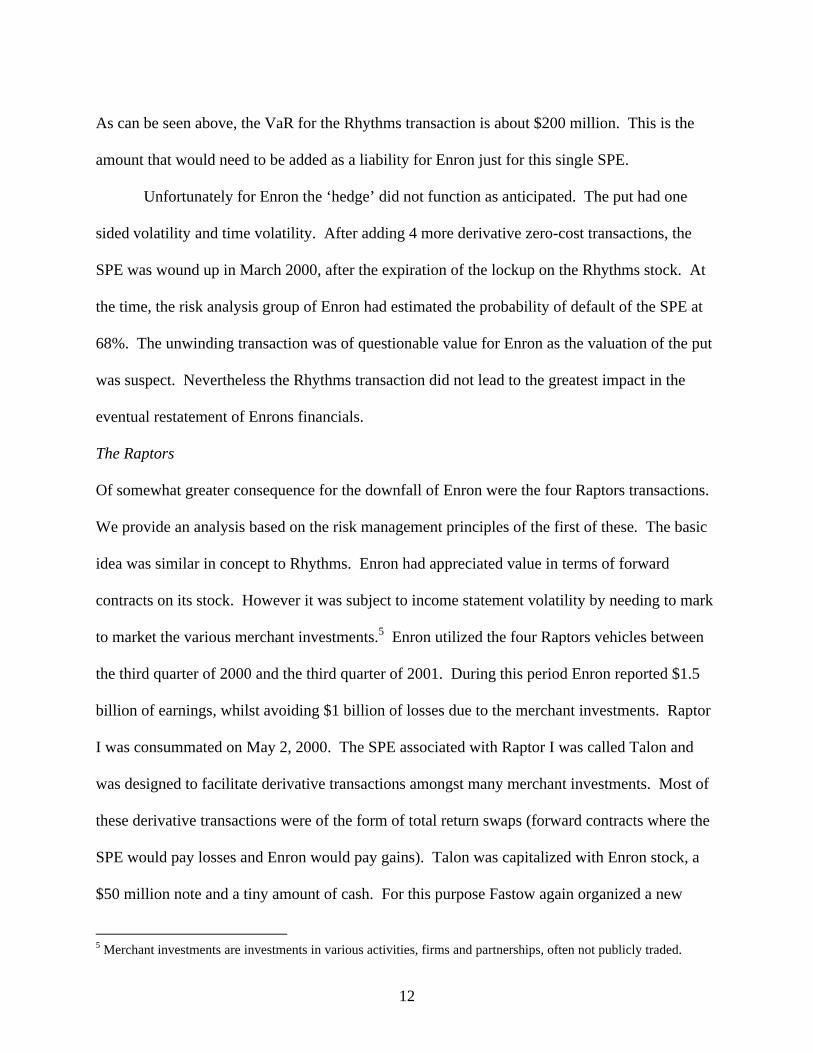
The effect of the contingent forwards on Enron stock created a sharp ‘kink’ in the payoff
diagram around the price of $50 per share. Below this price the SPE would have negative
capitalization and would require a subsidy in order to provide loss protection. The numerical
simulation of the VaR of Raptor I is based on the data in Table 2: Raptor I Data
Time Horizon 1 year Solvency Probability 97% ENE stock mean 20% ENE stock standard deviation 40% ENE stock prices Actual at the time of events
Table 2: Raptor I Data
The VaR simulation of the initial structure of Raptor I is depicted in Figure 6: Raptor I Initial
VaR
Figure 5: Initial Raptor I Payoff

15
Figure 6: Raptor I Initial VaR
The consequences of the sharp kink are evident as there is a concentration of probability mass in
the left tail. In this case the negative credit deficiency is computed as $162 million impact to
Enron.
Following the put option the situation changes rather dramatically. Figure 7: Raptor I
After Put now shows the impact. Although the fall off around $50 is similar, there is essentially
a ‘doubling’ of the risk on the downside. The impact on VaR is illustrated in Figure 8: Raptor I
VaR after put wherein we see that the magnitude of the losses in the left tail are virtually doubled
from the initial situation. As a result the VaR now grows to more than $320 million.

16
-$1,000,000,000
-$800,000,000
-$600,000,000
-$400,000,000
-$200,000,000
$0
$200,000,000
$400,000,000
$600,000,000
0 10 20 30 40 50 60 70 80 90 100
Figure 7: Raptor I After Put
Frequency Chart
Certainty is 97.00% from -324,699,651.91 to +Infinity
.000
.009
.018
.027
.036
0
9
18
27
36
-537,647,677.17 -117,355,522.04 302,936,633.09 723,228,788.22 1,143,520,943.36
1,000 Trials 985 Displayed
Forecast: Raptor 1 payoff after put
After the Raptor I SPE was put in place and the derivatives transactions ensued, losses mounted
rapidly. One merchant asset in particular, Avici Systems, lost $75 million during the third
Figure 8: Raptor I VaR after put

17
quarter of 2000; all of which was eliminated from the income statement of Enron due to the
Raptor I SPE. On October 30, 2000, because of the sharp losses, Enron added another derivative
collar to Raptor I to protect against further undercapitalization. This collar would require Enron
to pay Talon if the Enron stock price declined below $81; on the other hand Talon would pay
Enron if the stock price rose above $116. Otherwise there would be no cash transaction. As can
be seen from Figure 9: Raptor I After Collar and Figure 10: Raptor I VaR After Collar, the
collar effectively ‘froze’ the economics of Raptor I and for all intents completely eliminated the
credit deficiency. Of course it is worth pointing out that this is the credit deficiency of the SPE
itself; now Enron has an additional liability due to the downside risk of insuring the SPE on the
collar. Once this is accounted for, the net effect of the collar on Enrons risk position is not
necessarily positive.
-$200,000,000
-$100,000,000
$0
$100,000,000
$200,000,000
$300,000,000
$400,000,000
$500,000,000
$600,000,000
0 20 40 60 80 100 120
Figure 9: Raptor I After Collar

18
Figure 10: Raptor I VaR After Collar
Raptors II and IV were similar in nature to Raptor I and are omitted from the discussion here.
Raptor III was created to hedge a large investment in The New Power Company (TNPC), which
was privately held and subject to a planned IPO in the fall of 2000. In a stunning extrapolation
of the stock capitalization strategy, the Raptor III SPE (Porcupine) was capitalized with shares of
the very stock it was designed to hedge (TNPC)! For the sake of brevity we have not provided
the graphical illustration for this SPE; however the credit deficiency created by this one structure
was more than $460 million.6
As the first quarter of 2001 began, there was a significant credit shortfall in Raptors I and
III calculated at $500 million. As a result, a cross-guarantee between all four of the Raptors was
implemented along with an infusion of additional stock contracts in Enron. But this only
exacerbated the problem as the dependence on Enron stock was further leveraged. In the
meantime Enrons stock price had declined from $81 at the initiation of the Raptors to $55.
6 Details are available from the author upon request.
Frequency Chart
.000
.090
.179
.269
.358
0
89.5
179
268.5
358
10,570,043.91 140,827,782.93 271,085,521.95 401,343,260.98 531,601,000.00
1,000 Trials 960 Displayed
Forecast: Raptor I payoff after collar

19
October 15, 2001 was the date of the fateful announcement of the unwinding of the Raptors
SPEs. The consequence was an unexpected after-tax charge of $544 million and a write-down of
equity equal to $1.2 billion. In view of the enormous credit risk deficiency imparted to Enron, it
is doubtful that these SPEs would have ever been conceived if this huge liability had been
recorded on Enrons balance sheet.
Conclusion
The demise of the Enron Corporation in late 2001 triggered one of the most turbulent periods in
U.S. corporate history. Executives were vilified, congressional hearings were called, new
regulatory legislation was passed by Congress, DAs filed criminal charges, U.S. attorneys filed
civil charges, firms declared bankruptcy and were liquidated, and the notion of shareholder value
was ridiculed.
This paper has demonstrated that the use of EVA as a management incentive device can
be applied to the key issue of consolidation of SPEs. The essential idea is to record an additional
liability on the balance sheet of the parent related to its implicit responsibility for the risk of the
SPE. If the method is applied rigorously firms can be assured that the decision to utilize an SPE
makes sense from the standpoint of shareholder value creation. We have illustrated the method
by applying it to several of the SPEs of the Enron Corporation. Just the few transactions
included here could have accounted for much more than a billion of risk capital dissipation.
Although the FASB has already proposed new changes in the regulations considering
consolidation of SPEs, it is our hope that the methods documented herein can be applied to
internal management practices and thereby avoid ever having to go through such a catastrophic
period again.

20
References
Barth, M.E., J.A. Elliot and M.W. Finn (1999), “Market Rewards Associated with Patterns of Increasing Earnings,” Journal of Accounting Research 37, 387-413.
Degeorge, F., J. Patel and R. Zeckhauser (1999), “Earnings Management to Exceed Thresholds,”
Journal of Business 72, 1-33. Dechow, P.J., R.G. Sloan and A.P. Sweeney (1996), “Causes and Consequences of Earnings
Manipulation” An Analysis of Firms Subject to Enforcement Actions by the SEC,” Contemporary Accounting Research 13, 1-36.
FASB (2003), Interpretation No. 46, Consolidation of Variable Interest Entites, an
interpretation of ARB No. 51, January. Hayn, C. (1995), “The Information Content of Losses,” Journal of Accounting and Economics
20, 125-153. Powers, W.C., R.S. Troubh and H.S. Winokur (2002), Report of Investigation by the Special
Investigative Committee of the Board of Directors of Enron Corporation, mimeo. Stein, J. (1989), “Efficient Capital Markets, Inefficient Firms: A Model of Myopic Corporate
Behavior,” Quarterly Journal of Economics 104, 655-559. Stoughton, N.M. and J. Zechner (1999), “Optimal Capital Allocation Using RAROC™ and
EVA®,” working paper available at http://papers.ssrn.com/sol3/papers.cfm?abstract_id=118208.
Teoh, S.H., I. Welch and T.J. Wong (1998), “Earnings Management and the Underperformance
of Seasoned Equity Offerings,” Journal of Financial Economics 50, 63-99. Trueman, B. and S. Titman (1988), “An Explanation for Accounting Income Smoothing,”
Journal of Accounting Research 25 (Supplement), 127-139.