ENROLLMENT MANAGEMENT ACTION PLAN - University of Hawaii · ENROLLMENT MANAGEMENT ACTION PLAN...
36
ENROLLMENT MANAGEMENT ACTION PLAN 2017-2020 Targets and Strategies for Enrollment, Retention & Completion Success This University of Hawai‘i Enrollment Management Plan describes the goals, strategies, and tactics of the University of Hawai‘i campuses to shape their enrollments over the next five years. It is a framework to guide our overall enrollment, retention and degree completion efforts. The integrated plan represents an intentional, comprehensive, and collective process that will require annual predictive updates and modifications as data analyses are conducted and new information becomes available. Date: 8/31/17
Transcript of ENROLLMENT MANAGEMENT ACTION PLAN - University of Hawaii · ENROLLMENT MANAGEMENT ACTION PLAN...

ENROLLMENTMANAGEMENTACTION PLAN
2017-2020 Targets and Strategies for
Enrollment, Retention & Completion Success
This University of Hawai‘i Enrollment Management Plan describes the goals, strategies, and tactics of the University of Hawai‘i campuses to shape their enrollments over the next five years. It is a framework to guide our overall enrollment, retention and degree completion efforts.
The integrated plan represents an intentional, comprehensive, and collective process that will require annual predictive updates and modifications as data analyses are conducted and new information becomes available.
Date: 8/31/17

Enrollment Management ACTION plan
Page 1
Introduction Comprehensive enrollment management requires establishing an analytic strategy designed to optimize student enrollment to achieve institutional goals. It encompasses the complete enrollment cycle of students from recruitment to initial enrollment through the first year retention, and persistence through graduation and/or transfer, and ultimately engagement as alumni. Strategic enrollment management leverages institutional analysis and predictive modeling in an inherently action-oriented process. It recognizes internal and external factors associated with higher education and the connection between enrollment and fiscal management, human resources, student services, strategic planning, technologies, policies, procedures, academic offerings, marketing, and alumni relations. This system-wide integrated approach responds to higher education enrollment challenges with proactive approaches and innovative solutions. Enrollment at UH campuses peaked in 2011 (60,330) during the last economic recession and declined 11.5% to 54,183 by Fall 2016 as the economy has improved. The largest gains and losses in enrollment were at the UH Community Colleges as students commonly attend college during a recession and enter the job market with the improved economy. The reduction in enrollment has several important implications. First, as the largest provider of higher education in the state, it makes it more difficult for UH to make the contributions necessary to reach the state goal of 55 by 25, a target to have 55 percent of 25–64 years old adults having a two- or four-year degree by the year 2025. Second, declining enrollments affects UH’s financial health as tuition revenues account for a growing proportion of University’s total revenues. Declining tuition revenues may result in decreased programmatic offerings, and a reduction in opportunities and services offered by the various campuses. This University of Hawai‘i enrollment management plan sets five year targets for campuses and identifies their strategies to meet these targets. The plan also includes the role of the UH system in guiding and supporting the campuses. Background For the past few years, significant economic and political events in both Hawai‘i as well as the United States have affected the public higher education landscape. Like other universities, the University of Hawai‘i System campuses have faced the challenges of reduced fiscal resources, declining enrollments, increasing public expectations and needs, and rapid innovation. In response to these challenges, the University of Hawai‘i System campuses are developing campus level enrollment management targets and strategies to better align their resources and opportunities. These efforts will provide ongoing guidance for enrollment policies, procedures, and practices. The UH System office is providing data analytics, coordination and facilitation to support campuses in their enrollment efforts, as well as identifying possible new strategies and innovative approaches. The UH System office will monitor and report on campuses’ progress annually.

Enrollment Management ACTION plan
Page 2
The principles for enrollment planning support the mission and vision for the State’s only public university system. Enrollment management in this new context focuses on what is best for students and how to ensure their success while addressing all aspects of each campus’s mission. It is an institution-wide responsibility and the central focus of each institution’s overall strategic directions. The strategies for enrollment, retention, and completion success that guide our comprehensive enrollment management efforts embody the following beliefs: ● All qualified individuals throughout the State of Hawai‘i must be provided with opportunities
for high quality college and university education and training; ● Strategies promoting UH distinctive pathways to excellence that differentially emphasize
instruction, research and/or service while fostering a cohesive response to state needs, and participation in the global community help to identify the distinctiveness and value of a UH education;
● University of Hawai‘i embraces its responsibilities to the indigenous people of Hawai‘i and
to Hawai‘i’s indigenous language and culture; ● A variety of entry points into a comprehensive set of postsecondary educational offerings
allows for flexibility of students to move within the system to meet their individual educational and professional goals;
● To promote the long term economic vitality of the state, the University of Hawai‘i will
contribute to the statewide goal to increase the number of degree holders in the state from the current 44% to 55% by 2025 (55 by 25).
Student success will continue to be a priority for the university. The record number of degrees and certificates earned and the increase in on-time graduation rates are the result of concerted efforts by the campuses and the system. However, improvement in on-time graduation rates has had an unexpected impact on enrollment. As more students complete, without an increase in new enrollments or an improvement in overall retention, enrollments counts are negatively impacted. Thus it is clear that an on-time graduation strategy must be combined with tactics to grow enrollment by focusing on recruitment and retention within a comprehensive enrollment management plan. Enrollment Overview Headcount enrollment for the University of Hawai‘i dropped 4.2% in fall 2016 from the previous year with an improved economy. This decline marked the fifth consecutive decrease in fall semester enrollment, which fell by 6,912 students (11.5%) from the peak enrollment of 60,330 measured in fall 2011 to 53,418 in fall 2916. UH West O‘ahu is the only campus which has increased student headcount, growing from 1,662 in fall 2011 to 2,939 in fall 2016, a 77% increase.

Enrollment Management ACTION plan
Page 3
The UH system Institutional Research and Analysis Office (IRAO) prepares annual enrollment projections which are used for budgeting purposes. The projections are statistical extrapolations of current trends, including projections of high school seniors and graduates and consider economic variables. The projections do not take into consideration planned changes in University policies, and can be considered to be what is likely to occur if past trends were to prevail and no intervening actions taken. (See http://www.hawaii.edu/offices/aa/aapp/enrollment_management.html for a description of the methodology). According to the 2017 projections, if the recent trends continue, the UH system will continue to see a decline (1.9%) for fall 2017 to 52,415, with subsequent moderate declines through fall 2022 (see http://www.hawaii.edu/cgi-bin/iro/maps?Epuhf17.pdf). The Hawai‘i Department of Education forecast of public high school seniors estimates a 5.4% decline in school year 2016-17 (http://www.hawaii.edu/cgi-bin/iro/maps?Hbuhf16.pdf) followed by an increase, surpassing 9,900 in 2017-18. The outlook for private high school graduates, as forecast by the Western Interstate Commission for Higher Education (WICHE), is for private high school graduates to increase 3.4% in academic year 2016-17, then to increase through academic year 2018-19. In neither case is the number of high school seniors /graduates expected to change dramatically. Despite the relative stability in the numbers of high school seniors, the number of first time students from Hawai‘i high schools entering a UH campus has declined from 5,347 in 2010 to 4,489 in 2016. The overall college going rate for Hawai‘i high school graduates has increased from 50% in 2010 to 56% in 2016 (http://www.p20hawaii.org/resources/college-and-career-readiness-indicators-reports/2015-ccri-data/). However, the going rate (college participation rate) of Hawai‘i public high school graduates into the UH system has declined from 39% in fall 2010 to 35% in fall 2016. The going rate of private high school graduates into the UH system has declined from 33% in fall 2010 to 24% in fall 2016. Thus while there are more Hawai‘i high school graduates attending college, fewer are enrolling in a UH campus. Classified undergraduate enrollment as determined by credit hours and academic program level for the UH system peaked in fall 2012 at 45,544 students. Since then declines have occurred in all student types: first-time (-17.1%); transfer (-16.0%) returning (-12.6%) and continuing (-12.2%). Unclassified students have declined less as a whole (-0.8%), primarily due to increases in early admit students (high school students enrolled in college courses), which have increased from 566 in fall 2012 to 1,866 in fall 2016 (+230%). Other unclassified students have declined: undergraduate (-14.1%); graduate (-20.3%) and students attending campuses other than their home campus (-14.7%). With the admission of lower division students at UH-West O‘ahu in fall 2007, enrollment growth at UH-West O‘ahu has been strong. Double digit growth realized from fall 2008 through fall 2014 slowed to 1.2% in fall 2015, but picked up again in to +9.2% in fall 2016 to reach 2,939 in fall 2016. New campus facilities, which opened in fall 2012, plus forecasted increases in Leeward district public high school seniors, should sustain continued growth through the projection period for UH-West O‘ahu. The rate of growth is projected to be an

Enrollment Management ACTION plan
Page 4
average annual rate of 2.4% if no intervening measures are taken. Headcount enrollment at the University of Hawai‘i at Hilo peaked in fall 2012 at 4,157 but since has declined by 11.8% to 3,666 in fall 2016. Enrollment in the professional practice program in pharmacy reached capacity in 2010 and is not expected to provide the enrollment boost going forward that it has in prior years. Overall, enrollment is expected to remain relatively flat over the next several years. At UH Mānoa, headcount enrollment dipped to below 20,000 in fall 2014 for the first time in more than ten years. Classified graduate enrollment led this decline, decreasing from 5,726 in fall 2010 to 4,636 in fall 2016, a 19.0% decrease (-1,090 students). Most of this decline has been in Master’s and Research Doctorate (PhD) programs. In contrast, classified undergraduates have declined 7.0% (-954 students). Overall, further decline in total enrollment is anticipated, though enrollment is projected to remain above 17,000. As was typical in community colleges nationwide, enrollment at the UH Community Colleges grew rapidly during the recent economic downturn, increasing by more than 32% from 25,911 in fall 2007 to 34,203 in fall 2010. Since fall 2010, enrollment at the UHCC system has declined 15.9% to 28,757 in Fall 2016. Declines have been measured at all campuses and across all student types. One area of recent enrollment increase has been in early admit students, which have grown 293% (1,293 students) since fall 2010. UH System Role The role of the UH System in enrollment management is multifold. First, the System provides ongoing data reporting, monitors progress, supports the campuses, and maintains existing strategies that involve several campuses or involve external entities. Additionally, the UH system office provides coordination, facilitation, and leadership for initiatives and strategies across campuses. And finally, the UH System has identified new innovative areas in which to establish additional support mechanisms for campuses enrollment management strategies.
Data Analytics, Reporting and Monitoring: Given the declining share of Hawaiʻi high school graduates who attend a UH campus, it is essential that we successfully recruit, admit, and matriculate students as they graduate from high school in Hawaii. Therefore, UH system will work to optimize recruitment and enrollment efforts in cooperation with campuses using analytic strategies, including predictive modeling, targeted direct mailings, and targeted financial aid. Visualization tools provided by system showing the flow of high school graduates will also help campuses work more effectively on targeted groups. The most relevant metrics pertaining to enrollment management are admission, enrollment, and retention statistics. IRAO provides daily enrollment figures once registration begins until census (5 weeks after classes start). The Opening Enrollment reports show headcounts and FTE, with breakouts for ethnicity, major, and residency. New reports also show tuition dollars paid and due. Admissions and enrollment reports are published at census every semester. Detailed student characteristics are reported.

Enrollment Management ACTION plan
Page 5
Retention rates are published after the close of the fall semester and graduation rates are published after the academic year for full-time, part-time, and transfer-in cohorts. For the community colleges, success rates, which include graduation and transfer-out rates, are available at the end of the academic year. IRAO also produces annual enrollment projections, which are based on historic trends. The enrollment trends are broken out by student type (first time, transfer, continuing, etc.) and by college. In addition to the basic data, IRAO provides annual updates to metrics tracked by the system. These include the Strategic Direction and Performance funding metrics are focused on final outcomes, degrees and certificates earned and graduation and success rates for overall and for targeted groups. Also included are measures that indicate our success in closing degree gaps for these targeted groups. Finally, performance funding also includes transfer out and transfer in rates which reflect both student success and our ability to act as a system. In addition, the HGI Campus Scorecards starts with the outcome measures described above, and then adds indicators that research shows positively affect retention and graduation success. These include taking 15 credits a semester, completing college-level English and Math in the first year, receiving at least 6 early college credits before enrollment, and so on. The focus for the system level metrics is the on the final outcomes: graduation, degrees, and transfer, and making sure that targeted populations are also successful. By setting goals for these outcomes, campuses are free to develop their own strategies to achieve the goals.
Coordination, Facilitation and Leadership: The Office for the Vice President for Policy and Planning monitors policies and processes in order to facilitate movement through their college experience and to remove barriers for students from enrollment through graduation. These efforts regularly result in new, or revised, policies and processes. UH System office will develop new or revise existing policies regarding relevant aspects of enrollment management in support of more effective strategies to meet units’ enrollment targets. In addition to policy development and revision, the UH System Office provides leadership and facilitation related to the following enrollment-related areas:
• Hawai‘i P-20 Partnerships for Education is a statewide collaboration with the
Executive Office on Early Learning, the Hawai‘i Department of Education and the University of Hawai‘i to align the education pipeline so all students in Hawai‘i have access to attend college in order to build stronger careers that are connected with community involvement. The office works closely with UH campuses to provide multiple college success opportunities for students, focusing on low-income, underrepresented students who attend public schools. P-20 partners with UH Faculty and Hawai’i DOE on initiatives that increase the college going rate for Hawai’i high school grads and increases the chances of success when they matriculate. Examples of current collaborations are the analysis of longitudinal data across the education pipeline through workforce initiatives, grant-funded projects, and dual credit/early college initiatives.

Enrollment Management ACTION plan
Page 6
• The Hawai‘i P-20 Council, in 2007, articulated a statewide goal that 55% of working age adults would have a 2-year or 4-year college degree by the year 2025. This major enrollment initiative, known as the “55 by ‘25” campaign (both by the media and by the schools) has framed an audacious goal that is galvanizing public and private educational entities across the entire P through 20 pipeline to prepare and graduate more students so that they can be ready for the workforce.
• Transfer out of a UH CC, and transfer into a UH four year campus between our
two reflects both student success and our ability to act as a system. The community colleges as a whole have increased the number of transfers to four year campuses over the past 5 years but transfers to UH four years have remained flat, despite increased articulation agreements and other efforts.
• Hawai‘i P-20 Partnerships for Education is coordinating the partnerships
between UH and the Hawai‘i Department of Education (Hawai‘i DOE) to offer dual credit programs for Hawai‘i high school students. Dual credit programs provide high school students with the opportunity to take college-level courses and earn both high school and college credits at the same time. Hawai‘i students and their families are seeing significant gains in college enrollments and college persistence as a result of this initiative. Two programs, Running Start and Jump Start, offer courses on UH campuses, while a third program, Early College, offers courses on high school campuses. Between the Hawai‘i DOE Class of 2015, the percentage of Hawai‘i high school graduates with dual credits has doubled from 5% to 10%. National data indicates that high school students with dual credits are more likely to be academically prepared for college, enter and stay in college, and graduate.
• Headcount for international students has fallen or remained flat at UH, although
international students as a percentage of total enrollment is stable due to overall lower enrollments. The drop in international enrollment is in contrast to national trends which show dramatic increases in the number of international students attending institutions of higher education
• in the U.S. The system Office of International and Strategic Initiatives will
continue to convene the system wide international education committee, and work with campuses to establish and track international student enrollment metrics.
Innovation and New Strategies: Convened by the VP for Academic Planning and Policy, the Enrollment Management Oversight Committee will provide data to campuses, monitor progress toward enrollment management targets, provide support/guidance to campuses; and identify and implement system appropriate systemwide enrollment management strategies. This committee will meet twice annually to measure, discuss and report on the units’ progress toward their targets.

Enrollment Management ACTION plan
Page 7
Retention efforts must become a key focus for enrollment management initiatives throughout the system. Actions at the system level include strategies such as using analytics to identify leading indicators for retention, providing and monitoring retention data, use of financial aid to support retention, exploring the use of retention targets in performance funding, exploring system wide retention strategies (exit interviews, PR campaign, Purpose First initiative) and supporting the campuses, as appropriate, in retention efforts.
Financial aid policies and strategies will be created or modified as necessary to support campus financial aid operations and improve system processes, as well as impact student retention and persistence behavior. The system financial aid office will work with campuses and University of Hawai’i Foundation to facilitate financial aid processes and maximize the use of financial aid with an eye toward student success.
One of the most powerful efforts we can make both in increasing enrollment and achieving the “55 by ‘25” goal, is to recruit “non-traditional” student populations such as veterans, returning adults, and other non-traditional students. The UH system office will work with campuses to identify target populations and to develop system level initiatives to successfully recruit and graduate students from these populations.
Campus Targets and Plans UH campuses have differing missions and serve distinct geographical areas and students. As a result, the enrollment management targets and strategies will differ across the system. Keeping in mind differences among campuses, UH system will identify, monitor and share best practices so successes can be leveraged to achieve broader impact by campuses throughout the State. Each campus has selected targeted populations based on their own specific areas of potential growth and strategic priorities. This was accomplished by adjusting the historical projections in certain areas to include expected enrollment impact from action plan tactics that will be implemented each year of the enrollment management plan. Enrollment targets and strategies for each of the units, Mānoa, UH Hilo, UH West O‘ahu and UH Community Colleges are described below.

Enrollment Management ACTION plan
Page 8
UH MᾹNOA
Overview
As a land, space, and sea grant University Mānoa, provides unique opportunities for students unavailable elsewhere in the state. Mānoa is the principal provider of bachelor-level education on O‘ahu. In addition to its almost 100 undergraduate degrees, Mānoa is the only provider of graduate education, including the only provider of the PhD, with a few exceptions. Additionally, Mānoa offers advanced professional education in agriculture, medicine, law, architecture, engineering, business, education, nursing, social work, and tourism. Enrollment Numbers From 2004-2012, total headcount enrollment at UH Mānoa had hovered around 20,000, with the highest enrollment in 2004 at 20,549. The University slipped below 20,000 in 2014 (19,507), declined another 3.3% in 2015, with a total enrollment of 18,865 and declined 3.3% in 2016, with a total enrollment of 18,056. This continuous decline in overall enrollment mandates that UH Mānoa determines the most effective strategies and interventions to manage retention and persistence rates and new student enrollment to balance out the number of students graduating. Our success in graduating more students has contributed to our enrollment decline. The 4-year graduation rate has increased rapidly, moving from 17.5% to 27.9% in five years. Presuming this progress will continue, we have set a four-year graduation goal of 35% by 2021. Such a target is an increase of 7.1% over where we are now (over 1% per annum) and would represent a doubling of the graduation rate in a decade. The 6-year undergraduate graduation rate has increased from a low of 48.2% in 2009 to 57.1% for the most recent cohort in 2015. For the six-year graduation rate, we seek to increase the rate of graduation .5% per annum, which will allow us to reach a 60% 6-year graduation rate by 2021. UH Mānoa’s average first-year retention rate is 78% with declines in the last two years. We are targeting at a 1% increase per annum from around 76% now to an 81% first year retention rate by 2021. To achieve the goal we will develop a more nuanced understanding of why students leave, fail to graduate, or are not successful. Some of this work is already underway as MIRO uses the data gleaned from the NSSE process to understand what students think about UHM, as well as working with Eduventures to conduct annual leavers’ surveys. Mānoa must first, stabilize enrollment by reversing the declines, and then rebuild enrollment with both undergraduate and graduate students. It will take time to fully realize many of the changes that need to take place, such as reputation building, cultural attitudinal changes, increased scholarships and improved retention and persistence rates which are key elements to increase enrollment. This will take meticulous and consistent strategies over time to yield results.

Enrollment Management ACTION plan
Page 9
Current EM Practices at Mānoa (2017-2020)
Interim Chancellor Lassner issued two challenges to Mānoa:
1. Short-term: stop the enrollment decline fall 2017 and 2. Return enrollment to 20,000 by 2020
The strategies we are utilizing to address these challenges include:
• The formation of the Strategic Enrollment Management Committee (SEMC) with a focus on immediate implementation of new and innovative initiatives
• Mid-term strategy focused on assessment of all initiatives launched this year • An external evaluation • Unified strategic plan including a plan for coordinated financial aid, improved use of
analytics and technology and comprehensive advising • Longer term action to include consideration of campus-wide reorganization and
integration Mānoa has been engaged in a variety of initiatives to improve recruitment, graduation and retention rates. We provide here a brief list of current practices. It is important to note that developing new initiatives to address issues of recruitment, graduation and retention is an on-going process In spring 2015, the University charged the Student Engagement, Retention and Graduation Retention Committee (SERG) and the Strategic Planning for Admission and Recruitment Committee (SPARC) with developing plans that ensure the University meets and maintains optimal undergraduate and graduate enrollment through strategic and data driven recruitment, admission and retention practices. In spring 2017, the University combined the efforts of these two committees by forming a small working group, made up of leadership from both groups, as well as the leadership from Ka Ho‘okō Kuleana, to implement the plans. This working group has evolved into the Strategic Enrollment Management Committee (SEMC) SPARC developed five major categories with specific objectives and strategies. There are over 160 different strategies, with 47% either started, ongoing or completed:
1. Enrollment Targets and Projections a. Determine the institution’s optimal enrollment b. Complete 5-year enrollment projections
2. Branding, Imaging and Marketing a. Create and implement a strategic media plan for print and digital markets b. Improve the reputational image of the University to the local community c. Create a cohesive look for Mānoa in undergraduate and graduate recruitment
and admissions marketing and publications d. Update the admissions and graduate program websites
3. Recruitment a. Increase local constituencies campus engagement

Enrollment Management ACTION plan
Page 10
b. Increase local student enrollment c. Increase Native Hawaiian, Filipino, Samoan/Pacific Islander enrollment d. Increase international student enrollment e. Increase mainland non-resident and WUE enrollment f. Increase transfer/non-traditional student enrollment g. Increase graduate student enrollment h. Increase active duty military, veteran and dependent student enrollment i. Increase faculty and departmental involvement in recruitment j. Develop prospective student database k. Increase yield (percentage of student who enroll who were admitted) l. Decrease melt (the percentage of students who pay a deposit, who do not enroll
in the fall) 4. Affordability
a. Strategic use of financial aid for optimal enrollment b. Develop more first-year scholarships for recruitment c. Use a percentage of departmental scholarship for transfer student recruitment d. Develop financial aid literacy workshops
5. Infrastructure a. UH Mānoa must look and act like a selective, research 1, flagship institution b. Improve enrollment processes for efficiency and effectiveness c. Improve the physical plant and landscaping
Prior to the most recent strategic planning initiative, Mānoa was already engaged in efforts to improve the undergraduate experience. The following programs can be attributed to aiding in the increased 4 and 6 year graduation rates over the last few years. It should be noted that many successful system-wide programs originated in Mānoa over the last ten years.
1. STAR Degree Audit System (2007) 2. First Year Programs (2007) 3. Student Success Center (2008) 4. Kaʻieʻie Transfer Degree Pathways (2008) 5. Mandatory Advising (2008) 6. Do it in 4! (2009) 7. 4 year Program Sheets Academic Plans (2010) 8. Peer Mentor Program (2010) 9. English 100 First Year Experience (2010) 10. Registration Management Course Pressure Points (2011) 11. Academic Actions Policy Review (2011) 12. Financial Literacy Program (2011) 13. Exploratory Student Initiative (2014) 14. Come Home to Mānoa (2014) 15. Mandatory Mānoa Academic Planning (2014) 16. At Risk Initiative (2015) 17. Ad Astra Course Scheduling (2016) 18. Expansion of Kaʻieʻie (2016)

Enrollment Management ACTION plan
Page 11
In addition to our ongoing efforts, there are also a series of new strategies that have been initiated as part of our strategic planning process. First, we have implemented a Leaver study to identify why students do not return to UHM. In spring of 2017, we sent students who did not return a brief survey. We also completed an intensive analysis of their student records to identify how we might intervene appropriately in the decision not to return earlier. Mānoa will implement this leaver study for both fall and spring semesters in future years by contracting with Eduventures. Second, in spring of 2017, we implemented a new scholarship program using data analytics to extend a scholarship offer to students most likely not to return. This scholarship is available to students in good academic standing that fit the predictive model of those students who will leave. This pilot test will, we hope, help with our first year retention numbers. Third, we have begun to rethink programming for the New Student Orientation in an effort to build better community with our first year students upon arrival. These are just three of the initiatives we are moving from planning to practice. We have identified and prioritized numerous other plans to improve retention and graduation.

Enrollment Management ACTION plan
Page 12
UH Mānoa Enrollment Targets, 2017–20 Priority Measure
Actual Past 3-Year
Average Growth
Targeted Enrollment Count 2020
Fall 2016 4-Year Total
Enrollment 4-Year % Change Change
Total Enrollment 18,056 -3.5% 20,019 10.9% 1,963
Total enrollment of targeted groups 8,590 -3.5% 10,522 22.5% 1,932
1 Targeted Undergraduates 3,666 -3.0% 5,067 38.2% 1,401
1a First time Freshmen 1,972 3.5% 2,152 9.1% 180
1b Transfer 1,694 -8.2% 1,844 8.9% 150
1c Retention (increase from 76.6% to 79.6%) 1/ 0 -3.0% 171 NA 171
1d Persistence (increase from 67.2% to 68.7%) 1/ 0 -0.4% 900 NA 900
2 Graduate 4,924 -3.8% 5,455 10.8% 531
Priority Fall 2017 % Change
from Previous
Year Fall 2018
% Change from
Previous Year
Fall 2019 % Change
from Previous
Year Fall 2020
% Change from
Previous Year
Total Enrollment 18,056 0.00% 18,688 3.5% 19,342 3.5% 20,019 3.5% Total
enrollment of targeted group (sum of 1 and
2 below)
8,590 0.00% 9,214 7.3% 9,511 3.2% 9,808 3.1%
1 3,666 0.00% 4,113 12.2% 4,233 2.9% 4,353 2.8%
1a 1,972 0.00% 2,032 3.0% 2,092 3.0% 2,152 2.9%
1b 1,694 0.00% 1,724 1.8% 1,784 3.5% 1,844 3.4%
1c 2/ 0 NA 57 NA 57 NA 57 NA
1d 2/ 0 NA 300 NA 300 NA 300 NA
2 4,924 0.00% 5,101 3.6% 5,278 3.5% 5,455 3.4%
1/ The counts in the 4-Year Total Enrollment column are cumulative (Fall 2017 through Fall 2020). 2/ The counts shown are annual counts.

Enrollment Management ACTION plan
Page 13
Tactics/Actions to Take to Achieve Targets Above: Recruitment
1. Increase transfer student enrollment a. Create a task force to address administrative hurdles that prevent a seamless
transfer process between UHCCs and UHM b. Engage a transfer consultant to review UHM’s transfer policies and procedures c. Create an UHM Assistant Director of Transfer Admission and Recruitment
position with a team within the undergraduate admission’s office d. Develop online degree completion and full on-line programs for adult and
working students e. Academic departmental open houses for transfer students f. Develop a unified transfer student website g. Develop transfer days at UHM h. Continue to encourage academic departments to award some of their
scholarships to transfer students who have declared a major i. Develop a targeted transfer publication
2. Continue targeted recruitment strategies to increase new student enrollment a. Develop a more robust communication plan with prospective students via the
CRM to increase applications, yield and decrease summer melt b. Expand international recruitment and admissions team c. Hire in-location recruitment specialists in California and China d. Develop short-term international programs e. Expand recruitment reach further into the West, Texas and parts of the south f. Expand UHM reach on military installations with advertising, visits and course
offering on the bases g. Develop Hispanic/Latino recruitment plan in anticipation of growing population
growth within this demographic in Hawai‘i h. Hire O‘ahu/Neighbor Island road warriors i. Expand Early High School options j. Create via the UHF Alumni Engagement Office, an official UHAA Recruitment
Club 3. Implement technological solutions for more effective and efficient prospective student
communication and application processing a. Migrate data from third-party vendors into Banner (test scores, CRM etc.) b. Implement both the Common Application and the Coalition for Access,
Affordability and Success Application c. Secure software and technology needed for quicker and easier transfer
evaluations and articulation of courses d. Develop and implement a predictive model for recruitment and admission
4. Implement affordability initiatives a. Centralized scholarship awarding and processing b. Require the FAFSA for all scholarships for more efficient use of limited
scholarship funds c. Continuously review awarding philosophy for new students for recruitment
purposes

Enrollment Management ACTION plan
Page 14
d. Increase the number of departments that award new transfer scholarships e. Work with the University of Hawai‘i Foundation (UHF) to generate more giving
for first-time freshmen scholarships 5. Improve reputational image of UHM with local, international and mainland students with
strategic marketing and consistent messaging of the Mānoa brand a. Establish partnerships with internal and external units for strategic
communication and use of funds b. Purchase advertising space at the Daniel Inouye International Airport in
Honolulu c. Continue targeted recruitment/marketing efforts with “Make Mānoa Yours”
messaging d. Update social media plan e. Create departmental templates with the UHM admissions brand elements f. Produce an academic reputational publication and web campaign highlighting
ranking, departments, faculty and student research g. Produce an outcomes publication and web campaign highlighting alumni
achievements 6. Continue to build school counselors partnerships
a. Develop local counselor free professional development opportunities b. Expand counselor breakfast program to neighbor islands c. Partner with other Hawai‘i higher education institutions to host joint U.S.
continent counselor receptions 7. Web Presence
a. Update UHM website b. Continue to update UHM admissions website c. Implement an interactive online campus tour and map d. Implement an online welcome center e. Implement a parent portal
Retention and Graduation
1. With Eduventures create and implement an annual leavers survey 2. Scholarships designed as incentives for resident and non-resident students to continue
to UHM to graduation 3. Expand first-year learning community program to all incoming freshmen 4. Implement early alert systems for students in academic jeopardy 5. Expand registration dates 6. Enhance exploratory programming 7. Expand sophomore year program 8. Complete development of the Guided Pathway System (GPS) and Velocity Analyses
for all academic majors 9. Expand Kaʻieʻie 10. New Student Orientation (NSO) College Style 11. Establish student service benchmarks with customer service surveys
Finally, there are larger goals that we would like to implement to continue to improve graduation and retention rates. First is the Mānoa Graduation Commitment. This

Enrollment Management ACTION plan
Page 15
commitment, that all freshmen entering Mānoa in fall 2018 will have available all the courses they need to graduate and will graduate in a timely manner if they:
• Attend full-time and complete 30 credits each year • Meet regularly with their major and college/school academic advisors and • Remain in good academic standing, and follow and successfully complete the plan they
create with their advisor(s). Second, we would like to expand the current learning community program for non-resident students, expand our successful Sophomore Experience (MSE) to include the second semester of the first year, fund GAs to support academic advising, expand business hours for major campus services, and improve learning in low success rate courses. We will also engage in a date-focused retention effort of first year students to encourage them to return to Mānoa for their sophomore year. Assessment (plans to review data/targets and strategies):
• Develop benchmarks o Number of applications for new freshmen and transfer students o Numbers of deposits for new freshmen and transfer students o Number of enrolled for new freshmen and transfer students o Yield and melt rates o Retention o Graduation rates o Overall enrollment o Consumption metrics for Website and social media o Visitors to campus o Eduventures Survey of Admitted Students website ratings from fall 2015 survey o Student Service rating
• Increase retention to 80% • Increase applications by 3% each year for 4 years (12% by 2020) • Increase yield by 2% each year for 4 years (8% by 2020) • Decrease melt by 2% each year for 4 years (8% by 2020) • Increased numbers of visitors to campus • Improve Eduventures Survey of Admitted Students website ratings • Continuously review of new student enrollment with weekly point-in-time admissions
reports, making year to year comparisons • Year 2 - Improve student service ratings (year 1 establish benchmarks) • Increase scholarships amounts • By year 4 - Decrease student indebtedness by 5%

Enrollment Management ACTION plan
Page 16
UH HILO
Overview UH Hilo is characterized as a comprehensive, regional university. The primary focus of the campus is on providing high quality baccalaureate and select postgraduate education. In carrying out this mission, UH Hilo offers programs that take advantage of the unique physical and social characteristics of the island, attracting and serving students who are qualified for baccalaureate entry and seek opportunities for highly engaging and experiential learning. This includes first-generation and non-traditional students, some of whom attend part-time. Scholarship and research are an important part of faculty work and enhance student engagement in the unique learning environment of Hawaiʻi island. While a primary target for UH Hilo is residents of Hawai‘i Island, the quality programs are attractive to prospective students from other islands, the Pacific, the mainland U.S. and other countries. University-bound students from Oʻahu in particular may select UH Hilo not only for its distinctive undergraduate programs but also for its more rural setting, affordability, intimate character, and/or to leave home without leaving the state. In addition to its undergraduate programs, UH Hilo currently offers 7 masters and 4 doctoral degree programs, 3 of each are not offered elsewhere in the state. UH Hilo is known for its distinctive role in advancing Hawaiian language immersion education and continues to prepare teachers for service in immersion schools. For the purposes of this enrollment management plan, we will focus on undergraduate programs only. Separately, UH Hilo efforts at the postgraduate level will focus on ensuring the quality, relevance and enrollment level of its current graduate programs, including providing professional opportunity for residents of Hawaiʻi island. Enrollment Trends Over the 2012-2016 period, the total headcount enrollment at UH Hilo has declined steadily from 4157 to 3666, representing 2.5%-4.3% decreases each year. This decline is attributable to both recruitment and retention. Spring 2017 marked the first increase in new classified students since Spring 2012. The first to second year retention rate has fluctuated over the last decade with a recent significant gain from 63.2% in 2014 to 70.9% in 2015. We have identified majors with the most significant attrition after the first year, and initiated focused advising efforts to address them. The DFIW rate of first year courses have been variable over the same period with notable gains in key classes such as MATH103 (up by 36.8%) and CHEM141 (up by 41.5%). Analysis of the Spring 2017 data indicated that attrition of freshmen and seniors is currently equal, with sophomores and juniors being 50% better. The 4-year graduation rate improved from 12.2% in 2009 to 18.7% in 2016, whereas the 6-year graduation rate saw a slight decrease from 36.9% in 2011 to 24.9% in 2016.

Enrollment Management ACTION plan
Page 17
UH Hilo Historical Enrollment Fall 2007 to Fall 2016
Current EM Practices
Recruitment: UH Hilo has developed a new brand focused on our unique academic and cultural setting, the quality of our academic and research experiences, and our commitment to access to higher education and student success. We have shifted recruitment efforts by strengthening our impacts in social media and piloting text messaging to students. Several initiatives out of our Enrollment Services unit have reduced the number of barriers that students face between the time of application to the University and registration into classes. For the past two years, we have provided and plan to continue providing a PREP event to help new students register into classes using the GPS-STAR registration system.
Retention: We have made some significant strides in advising efforts across campus. The Advising Center has taken the lead in making advising to freshmen and declaring a major after 60 credits mandatory. Advising beyond the freshman year done in academic units includes some new initiatives. As a pilot, the College of Arts and Sciences (CAS) has dedicated academic advisors and/or peer-advisors in the areas of Psychology/Kinesiology, Pre-Nursing, and Marine Science. Further, we have begun a multipronged approach with early engagement of students through University 101 and embedded peer tutors in key first year courses.
Overall, we have ramped up communications to current students. The CAS Associate Dean has reached out to individual students on academic warning and probation to
3,2583,447
3,6733,848 3,941 4,011 3,907 3,828 3,701 3,649
3,5733,773
3,974 4,079 4,139 4,157 4,043 3,924 3,829 3,666
0
500
1,000
1,500
2,000
2,500
3,000
3,500
4,000
4,500
2007 2008 2009 2010 2011 2012 2013 2014 2015 2016
Enro
llmen
t Cou
nt
Academic Year
Spring Fall

Enrollment Management ACTION plan
Page 18
assist them in connecting with resources such as special population support programs. Utilizing a new listserv process, Financial Aid has increased its communication to students through weekly email reminders to students about requirements and deadlines and increased notifications to students regarding their financial aid academic progress status. Graduation: Several colleges are streamlining curricula. College of Business and Economics is developing “Journey to Success”, a cohort-based matriculation model that connects each student with a career mentor from the business community. College of Agriculture, Forestry, and Natural Resource Management is allowing reasonable academic modifications to major requirements to graduate students in a timely manner. College of Arts and Sciences have created two new tracks in liberal studies, Health Care Administration and Community Health Education, to service pre-nursing students unable to gain acceptance to the BSN program. The recently hired curriculum and catalog coordinator has made significant improvements in resolving curricular glitches by working with faculty, which has been helpful for transitioning to the new GPS-STAR.
Enrollment Targets
IRAO projections point to a gradual decline in overall enrollment that begins to flatten in Fall 2021. However, proactive implementation of new actions and strategies are anticipated to create gains in new student recruitment and retention. These are projected to result in enrollment growth beginning in Fall 2018, after a 1.2% decline in Fall 2017. Starting from 2017-2018, we have a goal of a 2% increase for new students. We are focusing on Hawai‘i Island and Hawai‘i State freshmen and transfers from UH Community Colleges. From Fall 2018, we plan to hold steady on the goal of an average 2% increase each year. With focused initiatives across the campus starting in Fall 2017, we have a goal of increasing retention from 70.9% to 75% starting from 2018-2019. We are using the IPEDS definition of retention for four-year institutions, which is the percentage of first-time bachelors (or equivalent) degree-seeking undergraduates from the previous fall who are again enrolled in the current fall.

Enrollment Management ACTION plan
Page 19
UH Hilo Enrollment Targets, 2017–20 Priority Measure
Actual Past 3-Year
Average Growth
Targeted Enrollment Count 2020
Fall 2016 4-Year Total
Enrollment 4-Year % Change Change
Total Enrollment 3,666 -3.2% 3,905 6.5% 239
Total enrollment of targeted groups 1,095 6.1% 1,465 3.4% 370
1 Targeted Undergraduates 902 -7.3% 1,272 41.0% 370
1a First time Freshmen 369 -9.3% 440 19.2% 71
1b Transfer 533 -5.8% 547 2.6% 14
1c 1/ Retention (increase from 70.9% to 75%) 0 -4.1% 285 NA 285
2 Graduate 193 1.0% 193 0% 0
Priority Fall 2017 % Change
from Previous
Year Fall 2018
% Change from
Previous Year
Fall 2019 % Change
from Previous
Year Fall 2020
% Change from
Previous Year
Total Enrollment 3,620 -1.3% 3,710 2.5% 3,805 2.6% 3,905 2.6%
Total enrollment of targeted group
1,117 2.0% 1,232 10.3% 1,253 1.7% 1,280 2.2%
1 924 2.4% 1,039 12.4% 1,060 2.0% 1,087 2.5%
1a 400 8.4% 422 5.5% 428 1.4% 440 2.8%
1b 524 -1.7% 527 0.6% 537 1.9% 547 1.9%
1c 2/ 0 NA 90 NA 95 NA 100 NA
2 193 0% 193 0% 193 0% 193 0%
1/ The count in the 4-Year Total Enrollment column is cumulative (Fall 2017 through Fall 2020). 2/ The counts shown are annual counts.

Enrollment Management ACTION plan
Page 20
Tactics/Actions to be Taken to Achieve Targets Above:
UH Hilo has identified the following strategies and tactics to aid in achieving the proposed targets.
1. Increase enrollment of first time students
a. Streamline recruitment efforts, especially on Hawai‘i Island b. Strengthen partnerships with Department of Education and local high schools c. Revise recruiting materials and outreach d. Refine financial aid strategy e. Revise New Student Orientation
2. Increase enrollment of transfer students
a. Streamline recruitment efforts, especially with UH Community Colleges b. Increase the number of 2+2 pathways with Hawai‘i Community College in strategic
majors c. Identify specific majors and regions for targeted, enhanced recruiting efforts on
other islands d. Coordinate recruitment efforts targeting West Coast Community Colleges
3. Increase retention of students in their first year; increase from 70% to 80% for both first-
time freshmen and first year transfer students a. Implement early alert measures b. Expand peer mentoring to additional high-demand majors c. Develop a coordinated First Year Experience Program, including a Transfer
Success Center d. Offer summer-bridge programs to better prepare incoming students for success e. Increase the number of residential and non-residential living learning communities
for first-time freshmen 4. Increase engagement of students with their major and with the island community to
enhance retention after their first year a. Establish peer tutoring programs in key gateway courses (ENG100, ENG100T,
MATH103, and MATH135) and prepare majors to serve as paid tutors b. Expand community service and internship projects as part of curricula to
contextualize lesson content c. Engage students in career pathways through exploratory classes (SOC 200, UNIV
102) and career advising 5. Develop new sources of students
a. Recruit stopped-out and other adult learners to finish degrees at UH Hilo b. Identify one or two new interdisciplinary majors that can be implemented without
significant new resources that will attract and retain undergraduate students c. Develop attractive hybrid online courses or degree programs

Enrollment Management ACTION plan
Page 21
Assessment The University of Hawaii at Hilo is in the process of hiring an Associate Vice Chancellor for Academic Affairs and Associate Vice Chancellor for Student Affairs, whose roles will include facilitating implementation and assessment of our enrollment management plan. We are committed to working in partnership as we strengthen our capacity for recruitment, retention and graduation across the campus. With guidance from the two AVC’s, we plan to regularly review data targets, practices, and strategies. Adjustments to implementation and strategies will be made as appropriate based on analysis of outcomes.
Enrollment Management ACTION plan
Page 22
UH WEST O‘AHU Overview
In 2012, the University moved to a permanent campus after nearly four decades in temporary facilities. The youngest of the University of Hawai‘i System’s three baccalaureate campuses, UH West Oʻahu primarily serves Central, Leeward and West O‘ahu. Located in the city of Kapolei on the island of Oʻahu, the campus services a geographic area whose population is booming, giving the campus an opportunity to grow with it. Four of the five largest public schools in the State of Hawaiʻi are located in close proximity to UH West Oʻahu – Kapolei High School, Campbell High School, Waipahu High School, and Mililani High School.
Na Kākou e Hoʻomālamalama, the strategic plan for 2015- 2020, provides the foundation for the next academic years through which UH West Oʻahu will continue to offer a student-centered environment and maintain its unique and critical position as the undergraduate and career orientated university within the UH System and broader community. The themes identified in the strategic plan are areas of focus that further establish UH West Oʻahu’s identity and develop its distinctiveness. These themes afford potential to achieve strategic advantages in higher education, and are to be used as reference points in establishing, prioritizing and or balancing the enrollment goals and strategies.
• Kākoʻo ʻOiwi (Indigenous Serving) • Holomua A Hoʻokō (Student Success) • Aʻo aku, Aʻo Mai (Teaching and Learning) • Ke Ala Kaiao (Career and Life Learning) • Hui Hoʻonaʻauao (Partnerships and Collaboration)
Institutional Mission
“The University of Hawai‘i – West O‘ahu offers a distinct, student-centered baccalaureate education that integrates the liberal arts with professional and applied fields. We develop life-long learners enriched and informed by career competencies and educational opportunities that address state, regional, and international needs. As a diverse and inclusive indigenous-serving institution, UH West Oʻahu embraces Native Hawaiian culture and traditions while simultaneously providing an environment where students of all ethnic backgrounds are valued, respected, and supported. Our campus fosters excellence in teaching and learning and serves the community of Hawai‘i by providing an accessible and affordable college experience.”
The Mission, combined with the Strategic Plan, shall provide a sense of purpose to the institution’s deliberate actions to shape the physical, social, intellectual and fiscal realities in order to achieve the institutional objectives. Companion and interdependent plans also include the Academic Development Plan and the evolving Long Range Development Plan, both of which will help provide more concrete details regarding the academic and physical constructs in the institutional environment.

Enrollment Management ACTION plan
Page 23
Historical Enrollment
Enrollment is slowly entering a modest growth phase after experiencing explosive enrollment numbers beginning in the fall of 2012 with the opening of the new campus in Kapolei. The excitement of the new campus, in one of the fastest growing districts of Hawai‘i, brought increased awareness and subsequent enrollment growth over a relatively short period of time. Adding to the equation was the earlier conversion from an upper division transfer institution to a four year campus with the first freshmen class in 2007 of 30 students. The university now has close to 3,000 students in six majors. Future growth is possible but may be constrained due to limitations in physical space, available majors and tuition revenue.
Over the last three years, UH West Oʻahu’s enrollment has increased over 10% - and over a 5 year period it has increased 47%. This increase is particularly noteworthy considering the institution continues to offer just six majors. As evidenced by the numbers below, first time new freshmen and transfer students entering the University have begun to taper off after the initial surge to the new campus in 2012. All enrollment numbers are based on enrollment after census and are retrieved from the UH System IRAO data files.
2012 2013 2014 2015 2016 3 Year Change
Total Enrollment 1997 2361 2661 2692 2939 up 278 10.45%
Academic Majors 6 6 6 6 6 same 0.00%
Freshmen Retention 66.7 67.7 61.2 66.8 70.3 up 9.1 14.87%
6 Year Graduation Rate NA 25 40 29.3 tbd tbd 31.43
ave
Freshmen Entering Class 301 291 266 254 292 up 26 9.77%
Transfer Entering Class 506 551 583 557 599 up 16 2.74%
Tuition Revenue $13,147,691 $13,576,921 $15,238,449 $2,090,758 15.9%
● Total Enrollment refers to all students taking one or more credits from UH West Oʻahu to include unclassified non-degree seeking students and those with a home campus elsewhere in the UH system.
● Academic Majors are Applied Science, Business Administration, Education, Humanities, Public Administration and Social Sciences.
● Freshmen Retention of full-time first-time freshmen who enrolled the prior year. This is a standard population group consistently tracked by accreditation boards and the federal government.
● 6 Year Graduation Rate is based on full-time, first-time freshmen class enrolled 6 years
Enrollment Management ACTION plan
Page 24
prior. This is a standard population group consistently tracked by accreditation boards and the federal government. (West Oʻahu cohorts were less than 41 students each year from 2007 – 2011)
● Freshmen Entering Class are students who graduated high school and did not attend college prior to UH West Oʻahu. Within this population includes potential target populations which include high schools in the Leeward District, Native Hawaiian, Pell, etc.
● Transfer Entering Class refers to students who attended college within the period after graduating high school and before UH West Oʻahu. Within this population includes target populations which include direct UH system transfers from specific campuses and/or programs, distance education students, most military personnel and working adult students.
● Tuition Revenue includes tuition collected within the fall/spring/summer academic year.
Enrollment Vision
The enrollment vision culminates in a vibrant, interactive and engaged community, in person and online, where members of the community learn, teach and discover with the purpose to generate the next generation of leaders that will transform the community, provide opportunities and build capacity for prosperity. To reach this, members shall build kauhale, and shall learn from each other and themselves about what is done well and what is needed to improve to better move forward as a collective body.
The educational experience is one that is both demanding in expectation yet personally satisfying and immensely rewarding. Students choose to enroll, persist and graduate from UH West Oʻahu because the major is offered, they feel personally connected to the campus, and they have a meaningful relationship with faculty, staff and other students.
The hallmark of success is measured in the success of student achievement. Retaining and graduating students is therefore of utmost concern since these students ultimately become the face and voice of the campus. Their stories are what attract future generations of students - it is their actions that shape the public’s perception of the institution, and it is their attainment of a baccalaureate degree which can change the quality of life for this community, island and state.
Since UH West Oʻahu is established as one of only three public 4-year universities in Hawai‘i, there is a responsibility and commitment to providing educational opportunities to the residents of the State especially those in underserved regions. While tuition revenue is a goal, it does not supplant the obligation and responsibility to promote the intellectual capital of the community, to help foster an informed citizenry and to ultimately improve the health and vitality of the community for future generations. The educational needs of the community will help contribute to the Academic Development Plan, as well as help prioritize new majors and educational opportunities into the future.
Enrollment Management ACTION plan
Page 25
The enrollment vision also strives to achieve optimal enrollment in order to meet operational expenses, sustain consistent program growth to meet resident needs, and provide funding for future repair and maintenance. According to Administrative Affairs, UH West Oʻahu will require an additional 4 million dollars in the 17-18 academic year to adequately meet expenses for the year. Increases in enrollment are required in order to increase revenue collected through tuition. Sustained increases in revenue in subsequent years will be required as new programs are developed, more personnel are hired and new buildings are constructed.
The goals and strategies presented will be evaluated each year and adjusted accordingly, but it is important to understand that regardless of what the institution does to actively recruit, admit, enroll, matriculate, and graduate the student, the decision always rests with the student on their course of action to apply, enroll, matriculate and to graduate. Their choice, as a consumer, is to attend UH West Oʻahu or elect to pursue something else. The student’s choice to select UH West Oʻahu, as a product, is different for every student, but will revolve around variables such as academic offerings, institutional image, word-of-mouth stories, price, location and other factors of importance to the individual student. It is the collection of all these variables which compose the institutional brand, and the strength of the brand is measured in the ability to attract new students as well as building loyalty and satisfaction with current students. (Han 2014, Pampaloni 2010, Stephenson 2015, Chapman, 1981). UH West Oʻahu cannot be all things to all people, so it is understood some students will have to elect a different path. UH West Oʻahu will focus on excelling at its core function as an undergraduate learning institution with the goal to offer an exceptional educational experience to all its students. Ultimately, it is the exceptional educational experience which will attract, enroll and graduate students.
Enrollment Goals
1. Increase the number of freshmen and transfer students entering the institution. 2. Obtain an optimal enrollment which satisfies the fiscal obligations of the institution and
provides for reasonable and sustained growth. 3. Build the institution’s academic reputation by promoting, diversifying and expanding
academic opportunities for residents of Hawai‘i. 4. Improve retention, persistence and graduation rates of UH West Oʻahu students.
Enrollment Projections
The IRAO Enrollment projections provide a useful tool to anticipate future enrollment based on existing conditions. Historical data uses the number of entering students each year, continuing students, retention and persistence rates, as well as high school and community college enrollment, to project potential enrollment into the future. There are unknown

Enrollment Management ACTION plan
Page 26
variables such as new buildings, retention interventions, advertising efforts, additional majors, etc., that are not included in these projections.
The IRAO projection shows modest growth for the next 5 years which is consistent with current space and program offerings.
IRAO Projections
2017 2018 2019 2020 2021 2022
Total 3,030 3,134 3,210 3,268 3,329 3,383
Freshmen 290 300 290 291 300 302
Transfer 612 623 635 645 655 665

Enrollment Management ACTION plan
Page 27
UH West O‘ahu Enrollment Targets, 2017–20
Priority Measure Actual Past 3-
Year Average Growth
Targeted Enrollment Count 2020
Fall 2016
4-Year Total
Enrollment
4-Year %
Change Change
Total Enrollment 2,939 10.5% 3,990 35.8% 1,051
Total enrollment of targeted groups 1,159 1,393 20.2% 234
1 First time Freshmen 292 9.1% 360 23.3% 68
2 Transfer Entering 599 2.7% 680 13.5% 81
3 1/ Retention (from 70.3% to 72% using 266 count from 2016 cohort) 168 3% 191 13.7% 23
4 1/ 3rd Year Persistence (from 51% to 61% using 266 count from 2016 cohort) 100 2% 162 62% 62
Priority Fall 2017
% Change
from Previous
Year
Fall 2018
% Change
from Previous
Year
Fall 2019 % Change
from Previous
Year
Fall 2020
% Change from
Previous Year
Total Enrollment 3,027 3.0% 3,269 8.0% 3,595 10.0% 3,990 11.0% Total
enrollment of targeted group
1,225 5.7% 1,272 3.8% 1,321 3.9% 1,393 5.5%
1 300 2.7% 320 6.7% 340 6.3% 360 5.9%
2 600 0.2% 620 3.3% 640 3.2% 680 6.3%
3 1/ 187 11.3% 189 1.1% 190 0.5% 191 0.5%
4 1/ 138 38.0% 143 3.6% 151 5.6% 162 7.3%
1/ The count in the 4-Year Total Enrollment column is cumulative (Fall 2017 through Fall 2020). 2/ The counts shown are annual counts.
Enrollment Management ACTION plan
Page 28
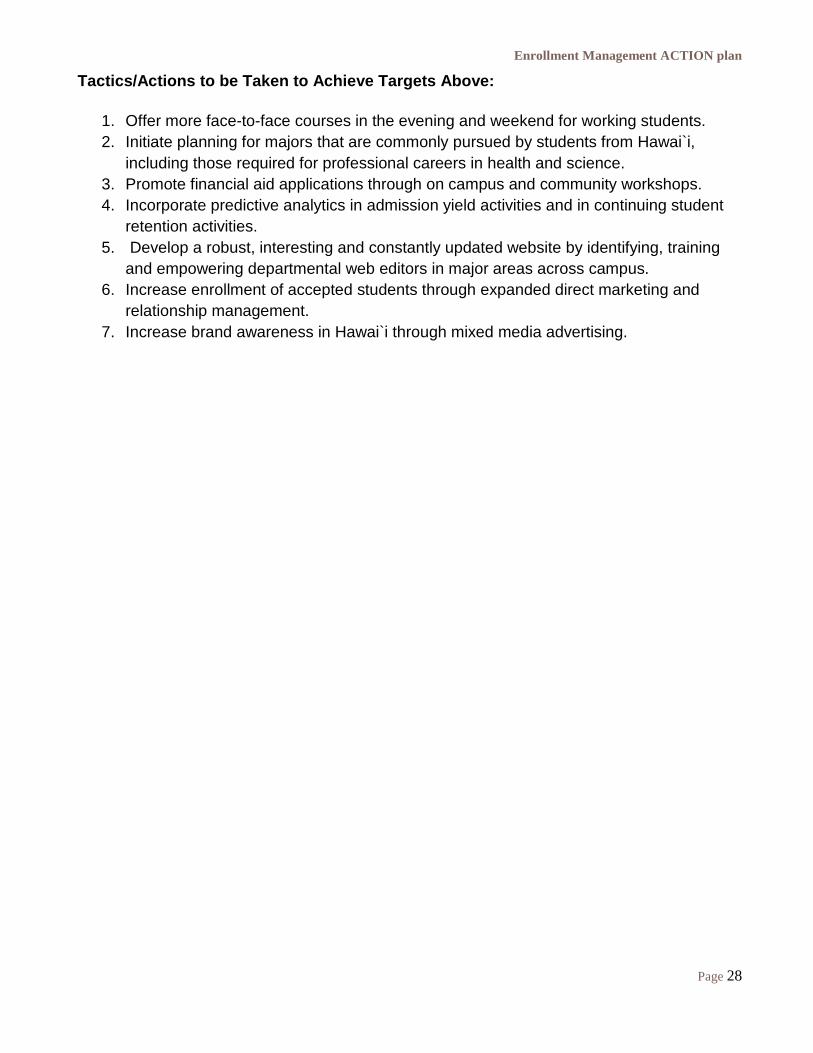
Tactics/Actions to be Taken to Achieve Targets Above:
1. Offer more face-to-face courses in the evening and weekend for working students. 2. Initiate planning for majors that are commonly pursued by students from Hawai`i,
including those required for professional careers in health and science. 3. Promote financial aid applications through on campus and community workshops. 4. Incorporate predictive analytics in admission yield activities and in continuing student
retention activities. 5. Develop a robust, interesting and constantly updated website by identifying, training
and empowering departmental web editors in major areas across campus. 6. Increase enrollment of accepted students through expanded direct marketing and
relationship management. 7. Increase brand awareness in Hawai`i through mixed media advertising.

Enrollment Management ACTION plan
Page 29
UH COMMUNITY COLLEGES Overview The University of Hawai‘i Community Colleges (UHCC) play a critical role in expanding access and increasing the educational capital of the state for Hawai‘i residents. Comprised of 7 campuses and 4 educational centers across the Hawaiian Islands, UHCC was officially established in 1964 with the Honolulu, Kapi‘olani, Kaua‘i, and Maui campuses, followed by Leeward in 1968, Hawai‘i in 1970, and Windward in 1972. In 2015, Hawai‘i Community College opened the Pālamanui site in North Kona. UHCC is a vital and viable option for anyone seeking post-secondary education. Open admissions policies, affordable costs, easy geographic access, diverse program offerings, and academic and student support programs are designed to address any readiness issues students may have. The UHCCs have a significant impact on UH System undergraduate and Native Hawaiian degree attainment. In 2016, 89% of Native Hawaiian degrees and certificates were home-based at a UHCC. In the same year, UHCC exceeded the degree and certificate awarding goal of 4,940 with actual conferrals of 5,209. The baccalaureate pathway for community college students is well articulated and several policies across educational systems exist to support student success. Among them are common General Education requirements, dual enrollment with high schools, reverse transfer, automated conferral, articulated major pathways with the three UH baccalaureate campuses, and guaranteed admissions for qualified students to the baccalaureate campuses. Additionally, UHCC has specific initiatives which encourage students to actively engage with their baccalaureate peers and faculty while enrolled at the community college to ease the transfer process. UHCC impacts Hawaiʻi’s workforce by providing associate’s degrees and certificate programs in liberal arts and multiple career and technical fields. UHCC provides lower-division courses which prepare students for university transfer. As well as offers non-credit short term training and professional development opportunities to allow students to earn credentials preparing them for immediate employment, and meeting state workforce needs. Enrollment Trends Enrollment at UHCC has fluctuated from 2007-2016. UHCC experienced a 32% enrollment increase during the recession. That enrollment increase has slowly eroded to approximately 20% above pre-recession levels. In 2010, 34,203 students were enrolled for fall. In contrast, in 2016, 28,757 students were enrolled for fall, equating to a 15.9% total decline in enrollment at all campuses for all student types except for early admit students which have grown 293%, 1,293 students, since fall 2010. Fluctuations and losses are attributed to changing student demographics and economic and workforce changes. Overall enrollment fluctuations are consistent with national community college enrollment trends. Current enrollments are similar to 2008 enrollment numbers.

Enrollment Management ACTION plan
Page 30
UHCC Historical Enrollment Fall 2007 to Fall 2016
Current UHCC EM practices UHCC currently employs multiple enrollment management strategies across campuses. Along with targeted enrollment goals for underrepresented demographic populations, the community colleges welcome collaborative opportunities that support student connection. Partnerships and collaboration with Hawai‘i P-20 and GEAR UP, has been instrumental in the development and proliferation of the Early College High School movement. Other dual credit opportunities such as Jump Start, Running Start, and Early Admit are also supported at community college campuses. Highlighting accessibility and opportunity, these partnerships emphasizes support for low-income, first-generation students while highlighting accessibility and opportunity. As part of ongoing enrollment management practices, campuses conduct recruitment and outreach to multiple populations. Enrollment practices include the use of technology to support retention, just-in-time intervention, and completion. Specific strategies include application events, financial aid workshops, college and career fairs, and campus visit opportunities and programs for prospective students and their families. Outreach efforts begin in elementary school and extend throughout intermediate and high school and beyond. Recruitment activities also target community groups and adult learners. UHCC Strategic Directions - Enrollment Targets The UHCC Strategic Directions 2015-2021 is a robust plan that identifies aggressive enrollment, transfer and graduation targets for each of the campuses. In 2016, Native Hawaiian enrollment numbers surpassed goals, Filipino enrollment met two of the four success goals (surpassing in enrollment and degrees and certificates earned), and Pacific Islanders achieved the enrollment goal in earned degrees and certificates. Pell recipients reached two of the four gap goals in enrollment and degrees and certificates. Goals have been set for fall to spring persistence (75%) and fall to spring persistence (65%) based on the Fall 2015 cohort.

Enrollment Management ACTION plan
Page 31
Target enrollments were determined for five different student categories as displayed in the following chart:
Student Category Base Enrollment Targeted Increase 2021 Target Enrollment
High school graduates direct entry 3,507 1,013 4,520
GED recipients 1,779 265 2,044
Pacific Islanders 617 232 849
Working age (25-44) Adults 9,058 5,410 14,468
International Students 1,030 200 1,230 Note: A compounded growth model of 5% was set as the expected target leading us to a goal of 6,305 degrees and certificates awarded by 2021. These goals were determined given that graduation outcomes of degrees and certificates have increased over 95% between FY 2008-2016, from 2,662 to 5,209 due in-part to STAR Reverse Transfer and Auto Conferral. Degree and certificate targets for the strategic period 2015-2021 were also created using a baseline average degree and certificate awards of 4,705 students, derived using average degree and certificate awards for FY 2013-2015. Additional graduation and transfer targets, strive to eliminate the achievement gap for Native Hawaiians, Filipino, Pacific Islander and Pell recipients, going beyond the US Census-identified success gaps in four areas: enrollment, degrees and certificates, STEM degrees, and transfer rates to 4-year institutions. Graduation and Transfer Targets 2021:
Target Population Baseline 2021 Goal
Native Hawaiian Students 1,165 1,559
Pell Recipients 2,362 3,166
STEM CC Graduates 261 348
STEM Overall Graduates 564 757
Transfer to UH (4-year) 2,149 3,617
Transfer to all BA institutions 4,328 5,088 Note: UHCC also considers IPEDS success rates (percent of fall first-time, full-time, degree seeking students completing a degree or CA and/or transferring to an external institution within 3 years-150%) with a goal to reach 50% by 2021 by each of the community colleges. Current UHCC system rates range from 27.4% (HAW) to 36.6% (KAP).

UHCC Enrollment Targets, 2017-20
Priority Measure
Actual Past 3- Year
Average Growth
Targeted Enrollment Count
2016 4-Year Total
Enrollment
4-Year % Change
Total Enrollment 28,757 -4.0% 36,909 28.3%
Total enrollment of targeted group 14,138 -5.6% 22,219 58.0%
1 High School Graduates Direct Entry 2,725 -6.3 4,405 61.7%
2 GED Recipients 1,490 -8.0% 2,003 34.4%
3 Pacific Islanders 604 -7.4% 816 35.1%
4 Working Age (25-44) Adults 8,245 -5.4% 13,787 67.2%
5 International Students 1,074 0.4% 1,208 12.5%
Fall 2017 % Change from
Previous Year
Fall 2018 % Change
from Previous
Year
Fall 2019
% Change
from Previous
Year
Fall 2020
% Change
from Previous
Year
Total Enrollment 33,865 17.8% 35,110 3.7% 36,054 2.7% 36,909 2.4%
Total enrollment of targeted group 19,175 36.3% 20,420 6.5% 21,364 4.6% 22,219 4.0%
1 3,989 46.4% 4,133 3.6% 4,271 3.3% 4,405 3.1%
2 1,888 26.7% 1,926 2.0% 1,964 2.0% 2,003 2.0%
3 726 20.2% 755 4.0% 785 4.0% 816 3.9%
4 11,466 39.1% 12,467 8.7% 13,171 5.6% 13,787 4.7%
5 1,106 3.0% 1,139 3.0% 1,173 3.0% 1,208 3.0%
Page 33

Page 34
Tactics/Actions to be Taken to Achieve Targets Above: The UHCC’s are poised to undertake innovative and aggressive tactics to recruit and retain students based on emerging practices and on successful pilot initiatives. Current and future initiatives include, but are not limited to:
1. Development of formal campus-based comprehensive enrollment management plans to reflect current practices and recommended strategies;
2. Commitment to the Hawaiʻi Graduation Initiative; 3. Removal of costs as a barrier to higher education
a. Implementation of the Hawaii’s Promise Program in 2017 to provide scholarships for the unmet direct cost need for qualified students;
b. Development of an open educational resource (OER) initiative, leading to no cost for open educational resource textbooks;
4. Participation in Integrated Communications for Recruitment and Retention (ICRR), a systemwide approach to communicating with students in a consistent and timely manner from initial application through their first year of college. Key strategies and tactics are used to improve communications at all “touch points” along the spectrum of a student’s college experience;
5. Customized onboarding and support for identified enrollment target populations; 6. Developmental education initiatives and adaptation of the Time to Degree: Co-
Requisite Policy UHCCP 5.213, which supports completion of college level English and Math within the first year of admission to the UHCC system;
7. Adoption of the Student Success Pathway (SSP), an integrated, institution-wide framework for student success, based on research supported by numerous organizations from Achieving the Dream to Completion by Design. The SSP model is based on intentionally designed, clear and structured educational experiences that guide students from their point of entry to graduation, transfer and career;
8. Expansion of the successful STAR GPS pilot from 15 students at HON in August of 2015 to full implementation of all 50,000 UH students by April 2017;
9. In alignment with the Hawaiʻi Innovation Initiative, usage of the Industry Sector Mapping website which links the workforce and education and provides employment and wage data in Hawaiʻi;
10. For adult learners: a. Creation of a framework to expand offerings for DE and transfer programs from
an online AA portal b. Deployment of acceleration program initiatives and prior learning assessment
tools. These overarching goals and outcomes for UHCC create an opportunity for the seven community colleges to collaboratively address enrollment trends. These measures, targets, and goals help to formulate an infrastructure for enrollment management policies and practices. UHCC recognizes that enrollment management is an effort that must be supported by all campus stakeholders in order to be successful.

Enrollment Management ACTION plan
Assessment UHCC leadership is committed to working collaboratively to regularly review data targets, goals, and strategies at the end of each semester. Intentional alignment of successful strategies for all campuses, and the utilization of enrollment strategies will aid campuses in meeting enrollment targets. Performance based funding goals for UHCC campuses are tied to degree awarding. Goals are based on degree of attainment of specific metrics and weights for performance funding. The performance based measures are another form of assessment used by UHCC.
Graduates (Associate Degrees & CAs) 35%
Native Hawaiian Graduates (Associate Degrees & CAs) 10%
STEM Graduates (UHCC Associate Degrees & CAs + UH STEM baccalaureate graduates) 10%
PELL Graduates (Associate Degrees & CAs) 10%
Annual Transfers to Baccalaureate Colleges 35% As enrollment management targets and goals are refined, assessments will be developed to reflect modifications and changes. UHCC views enrollment management as an ongoing process that requires active input and commitment from all campus stakeholders.
References
Chapman, D. (1981). “A Model of Student Choice” Journal of Higher Education, 52.5,490-505
Han, P. (2014). “A Literature Review on College Choice and Marketing Strategies for Recruitment” Family and Consumer Sciences Research Journal, 43.2,120-130
Joseph, M., Mullen, E. and Spake D. (2012). “University branding: Understanding student’s choice of an educational institution” Journal of Brand Management 20.1, 1-12
Nguyen, N. and LeBlanc, G. (2001). “Image and reputation of higher education institutions in students’ retention decisions”, The International Journal of Educational Management, 15.6,303-311
Pampaloni, A. (2010). “The influence of organizational image on college selection: what students seek in institution of higher education”, Journal of Marketing for Higher Education 20.1,19-48
Paulsen, M. and John, E. (1997). “The Financial Nexus Between College Choice and Persistence”, New Directions of Institutional Research 95,65-82
Paulsen, M. (1990). College Choice, Understanding Student Enrollment Behavior. ASHE-
Page 35

Enrollment Management ACTION plan
ERIC Higher Education Report No. 6, Washington, DC
Pope, M. and Fermin B. (2003). “The Perceptions of College Students Regarding the Factors Most Influential in Their Decision to Attend Postsecondary Education”, C&U Journal 19-25
Siegfried, J. and Getz, M. (2006). “Where do the children of professors attend college?”, Economics of Education Review 25,201-210 Stephenson, A., and Yerger, D. (2015). “College choice and the university brand: exploring the consumer decision framework”, Higher Education 71,489-503
Page 36