ENOS: a Holistic Framework for Conducting Scientific Evaluations of ...
ENOS D6.7 | March 2020
D6.7 Report: Towards a strategic development plan for
CO2-EOR in the Vienna Basin
Date 27.03.2020
Author(s)
Tom Mikunda*, TNO
Juraj Franců, CGS
Miroslav Pereszlényi, CGS
Vít Hladík, CGS
Vladimír Kolejka, CGS
Jakob Kulich, GBA
Gregor Götzl, GBA
Lars Kollbotn, NORCE
Michal Jankulár, SGIDS
* - corresponding author contact: [email protected]
Number of pages 93
Number of appendices 0
Project name ENOS
Project website http://www.enos-project.eu
Project number Grant Agreement No 653718
This project has received funding from the European Union’s Horizon 2020
research and innovation programme under grant agreement No 653718
A CO2GeoNet
Initiative

ENOS D6.7 | Towards a strategic development plan for CO2-EOR in the Vienna Basin
2 / 93
Page intentionally left blank

ENOS D6.7 | Towards a strategic development plan for CO2-EOR in the Vienna Basin
3/ 93
3/ 93
Contents
Contents ...................................................................................................................................................... 3
List of Figures ............................................................................................................................................ 5
List of Tables .............................................................................................................................................. 7
Executive Summary ................................................................................................................................... 8
1 Introduction .................................................................................................................................... 10 Objective ........................................................................................................................................ 10 Approach ........................................................................................................................................ 10
2 Geology and hydrocarbon fields of the Vienna Basin ............................................................... 12 General geological description and evolution of the Vienna Basin ............................................... 12
2.1.1 Introduction ................................................................................................................................ 12 2.1.2 Basin formation and evolution stages ........................................................................................ 13 2.1.3 Pre-Neogene floor ..................................................................................................................... 15 2.1.4 Vienna Basin sedimentary fill .................................................................................................... 15 2.1.5 Main tectonic elements of the Vienna Basin.............................................................................. 20
Oil and gas in the Vienna Basin ..................................................................................................... 22 2.2.1 Oil and gas occurrences ............................................................................................................ 22 2.2.2 History of oil and gas exploration and production ..................................................................... 24 2.2.3 CO2-EOR potential .................................................................................................................... 27
Oil fields in the Czech part of the Vienna Basin ............................................................................ 28 Oil fields in the Slovak part of the Vienna Basin ............................................................................ 32 Oil fields in the Austrian part of the Vienna Basin ......................................................................... 36
3 Stakeholder mapping and assessment of regional industries and organizations ................. 43 Introduction to stakeholder mapping and analysis ........................................................................ 43 Austria ............................................................................................................................................ 43 Czech Republic .............................................................................................................................. 45 Slovakia ......................................................................................................................................... 47
4 EOR potential by CO2 injection in the Vienna Basin reservoirs ............................................... 49 Introduction .................................................................................................................................... 49 Data collection ............................................................................................................................... 49 Reservoir information overview ..................................................................................................... 51 Recovery process .......................................................................................................................... 51 Screening process ......................................................................................................................... 52 Simulation premises....................................................................................................................... 53 EOR scoring ................................................................................................................................... 54 CO2 storage ................................................................................................................................... 55 EOR production profiles ................................................................................................................. 56
CO2 injection and storage profiles ................................................................................................. 56 Preparation of results ..................................................................................................................... 58 Screening results ........................................................................................................................... 58
5 Analysis of CO2 point sources in the region ............................................................................... 60 Potential suitable CO2 point sources in the Vienna Basin ............................................................. 60

ENOS D6.7 | Towards a strategic development plan for CO2-EOR in the Vienna Basin
4/ 93
Short-listing CO2 sources for source-sink matching ...................................................................... 60
6 Regional CO2 source-sink matching ............................................................................................ 64 Development of GIS database ....................................................................................................... 64 Source-sink matching case studies ............................................................................................... 65
6.2.1 Case study 1 – OMV Refinery / Lafarge cement plant / Matzen cluster ................................... 67 6.2.2 Case study 2 – Mokrá cement plant / cluster CZ III .................................................................. 69
7 Identification of regulatory, technical and conflicting interest challenges ............................. 76 Regulatory challenges ................................................................................................................... 76
7.1.1 The Czech Republic .................................................................................................................. 76 7.1.2 Slovakia ..................................................................................................................................... 77 7.1.3 Austria ........................................................................................................................................ 78
Competitive use of the subsurface ................................................................................................ 79 7.2.1 The Czech Republic .................................................................................................................. 80 7.2.2 Slovakia ..................................................................................................................................... 80 7.2.3 Austria ........................................................................................................................................ 80
Conflicts of interest ........................................................................................................................ 81 7.3.1 The Czech Republic .................................................................................................................. 81 7.3.2 Slovakia ..................................................................................................................................... 82 7.3.3 Austria ........................................................................................................................................ 82
Technical challenges related to CO2-EOR and CO2 storage ........................................................ 83 7.4.1 Supercritical conditions .............................................................................................................. 83 7.4.2 Miscibility ................................................................................................................................... 83 7.4.3 Maximum injection pressure (attainable rates) .......................................................................... 84 7.4.4 Injectivity issues ......................................................................................................................... 84 7.4.5 Productivity and flow assurance ................................................................................................ 84 7.4.6 Corrosion ................................................................................................................................... 85 7.4.7 Leakage ..................................................................................................................................... 85
Technical challenges related to CO2 capture ................................................................................ 85
8 Conclusions and recommendations ............................................................................................ 86 Conclusions ................................................................................................................................... 86
8.1.1 Technical aspects ...................................................................................................................... 86 8.1.2 Regulatory aspects .................................................................................................................... 86 8.1.3 Economic aspects ...................................................................................................................... 87
Recommendations ......................................................................................................................... 87
References ................................................................................................................................................ 89

ENOS D6.7 | Towards a strategic development plan for CO2-EOR in the Vienna Basin
5/ 93
List of Figures
Figure 1. Location of the Vienna Basin within the Alpine-Carpathian thrust belt (Prochác et al. 2012).
....................................................................................................................................................... 12 Figure 2. Stages of the Vienna Basin evolution (Arzmüller et al. 2006) ............................................... 14 Figure 3. Example of an unconformity in the sedimentary fill of the Vienna Basin between the Lower
and Middle Miocene on the Hodonín - Gbely Horst in the Northern part of the VB - Czech
Republic (Prochác et al. 2012). ..................................................................................................... 14 Figure 4. Geological Sketch Map – pre-Neogene Alpine-Carpathian connection in the Vienna Basin
(Arzmüller et al. 2006).................................................................................................................... 16 Figure 5. Geological sections through the Vienna Basin and its pre-Neogene floor (Arzmüller et al.
2006). Location of the sections is shown in Figure 4. .................................................................... 17 Figure 6. Stratigraphy and evolution of the Vienna Basin in the Miocene (Lee and Wagreich 2018) .. 18 Figure 7. Stratigraphy of the Vienna Basin in the Neogene (Jiricek and Seifert 1990) ........................ 19 Figure 8. Geological subsurface map of the Vienna Basin shows the main fault systems, depressions,
horsts and related structural blocks (Arzmüller et al.2006). .......................................................... 21 Figure 9. Seismic sections across northern and central part of the Vienna Basin (Lee and Wagreich
2018) .............................................................................................................................................. 22 Figure 10. Oil and gas fields in the Vienna Basin (Arzmüller et al. 2006) ............................................ 23 Figure 11. Drilling rig Trauzl-Rapid and oil rig crew from 1913 – 1914. First production well in the
Vienna Basin: Gbely – Old Field – Slovakia (Bednaříková and Thon 1984). ................................ 25 Figure 12. Panorama of the Nesyt oil field (Hodonin – Czech Republic) in the 1920s with old derricks
and drilling rig on the left (Bednaříková & Thon, 1984). ................................................................ 26 Figure 13. Share of Austria (AT), the Czech Republic (CZ) and Slovakia (SK) in total oil and gas
production in the Vienna Basin until 2018 ..................................................................................... 27 Figure 14. Share of Austria (AT), the Czech Republic (CZ) and Slovakia (SK) in oil and gas production
in the Vienna Basin in 2018. .......................................................................................................... 27 Figure 15. Oil fields in the Czech part of the Vienna Basin: clusters are outlined by purple lines, oil
fields by hatched areas. ................................................................................................................. 29 Figure 16. Example of SP and RAG well logs showing typical properties of the Láb horizon – low SP
values and high resistivity .............................................................................................................. 29 Figure 17.The Vienna Basin - Czech Republic - oil and gas field Poddvorov - West – depth-structure
map of the top of the Láb horizon (Middle Badenian). The field consists of four blocks (basic
units): PO-1, PO-2, PO-3 and PO-4 .............................................................................................. 30 Figure 18.The Vienna Basin - Czech Republic - oil and gas field Hrušky, block (basic unit) HR-4 –
depth-structure map of the top of the 7th Badenian horizon (Upper Badenian) (Ďurica et al. 2010).
....................................................................................................................................................... 31 Figure 19. Oil and gas field Hrušky – geological cross section 1 – 1’ (Buchta et al. 1984). The location
of the section is shown in Fig. 18. .................................................................................................. 32 Figure 20. Oil fields in the Slovak part of the Vienna Basin: clusters are outlined by purple lines, oil
fields by hatched areas. ................................................................................................................. 33 Figure 21. The Vienna Basin - Slovak Republic – Gbely – Old Field; the oldest oil field in the Vienna
Basin; depth-structure map of the top of basal Sarmatian horizon; block (basic unit) G1 (Buchta
et al. 1984). .................................................................................................................................... 34 Figure 22. Gbely – Old Field and Gbely – New Field; geological cross section 2 – 2’ (Buchta et al.
1984). The location of the section is shown in Figure 20. ............................................................. 35 Figure 23.The Vienna Basin - Slovak Republic – Láb oil and gas field; depth-structure map of the top
of the Middle Badenian Láb horizon (Buchta et al. 1984)............................................................. 35 Figure 24. Oil and gas field Lab; geological cross section 3 – 3’ (Buchta et al. 1984). The location of
the section is shown in Figure 22. ................................................................................................. 36

ENOS D6.7 | Towards a strategic development plan for CO2-EOR in the Vienna Basin
6/ 93
Figure 25. Clusters of oil fields in the Austrian part of the Vienna Basin. Oil fields are marked in dark
green. Black circles mark the position of wells. Map adopted from Wessely (1993). ................... 37 Figure 26. Geological cross-section through the oil field Muehlberg (Kreutzer 1993) .......................... 38 Figure 27. Geological cross-section through the oil field Goesting (Kreutzer 1993) ............................ 39 Figure 28. Geological cross-section through the oil field Gaiselberg (Kreutzer 1993) ......................... 40 Figure 29. Cross-section through the Second Floor of the Matzen field (Kreutzer 1993). ................... 41 Figure 30. Geological cross-section through the oil field Hochleiten (Kreutzer 1993). ......................... 42 Figure 31. Map of clusters of oil fields in the Vienna Basin used for CO2-EOR screening ................... 50 Figure 32. Base case model layout (initial condition) ........................................................................... 53 Figure 33. Reservoir model, prior to CO2 injection ............................................................................... 54 Figure 34. Example recovery profiles exhibited by the concept models. .............................................. 54 Figure 35. Incremental oil recovery from CO2-WAG flooding (exerted from Azzolina & et al. 2015) ... 55 Figure 36. EOR efficiency vs CO2 injection rate ................................................................................... 57 Figure 37. Normalized CO2-EOR profiles ............................................................................................. 58 Figure 38. Industrial emissions in the Vienna Basin by sector (in 2017) .............................................. 60 Figure 39. Ranges of estimated cost of CO2 capture from different industrial processes. ‘High purity’
includes natural gas processing, hydrogen production and ethylene oxide production (IEA 2011)
....................................................................................................................................................... 61 Figure 40. Map of identified CO2 sources in the survey area. The red dots mark the further evaluated
sources for CCS and CO2-EOR applications, triangles mark other sources. ................................ 62 Figure 41. Cost function based on land use and slope of the survey area. Red regions indicate high
costs, green areas low costs. ........................................................................................................ 64 Figure 42. Results of source sink matching showing the locations of the selected sources (the Czech
HeidelbergCement plant, the OMV refinery and the Lafarge cement plant in Austria), as well as
the oil fields clusters. Green lines depict the calculated indicative pipelines based on
considerations explained in Chapter 6.1. Note that pathways might differ for the case study No. 2
as existing pipeline networks were not evaluated in Chapter 6.1. ................................................. 66 Figure 43. Annual CO2 emissions from the Lafarge cement plant and OMV refinery between 2013 and
2018 ............................................................................................................................................... 67 Figure 44. Possible CO2 transport routes between the Mokrá cement plant and cluster CZ III. .......... 72 Figure 45. Minimum miscibility pressure for CO2 in oil (reproduced from (Bachu, 2016) ..................... 84
ENOS D6.7 | Towards a strategic development plan for CO2-EOR in the Vienna Basin
7/ 93
List of Tables
Table 1. Total oil and gas production until 2018 and production in 2018 in the Vienna Basin. Source:
Balance of Mineral Resources of the Czech Republic and Slovakia, Annual Reports of OMV,
MND a.s. and NAFTA. ................................................................................................................... 26 Table 2. A simple stakeholder analysis for CO2-EOR activities in the Austrian part of the Vienna
Basin. Green = governmental bodies, grey = private companies, blue = non-governmental
bodies. ........................................................................................................................................... 44 Table 3. A simple stakeholder analysis for CO2-EOR activities in the Czech part of the Vienna Basin.
....................................................................................................................................................... 46 Table 4. A simple stakeholder analysis for CO2-EOR activities in the Slovak part of the Vienna Basin.
....................................................................................................................................................... 48 Table 5. Overview of input data provided for CO2-EOR screening ....................................................... 49 Table 6. Data collection form (example) ............................................................................................... 51 Table 7. Results of CO2-EOR screening ............................................................................................... 59 Table 8. Best suitable emitters for CCS application in the Vienna Basin. CO2 emissions are extracted
from ETS or E-PRTR database and given in tonnes. See next figure for the location of the
facilities. ......................................................................................................................................... 63 Table 9. Overview of CO2 pipeline projects (Pelitri et al. 2018) ............................................................ 65 Table 10. Overview of the Case Study - Lafarge cement plant / OMV refinery / Cluster Matzen ........ 69 Table 11. Fuels used for clinker production in the rotary kiln3 .............................................................. 70 Table 12. Annual CO2 emissions and allowances in allocation; emissions excluding biomass
according to the European Union Transaction Log1; emissions including biomass according to the
Integrated Register of Polluters2. ................................................................................................... 70 Table 13. Expected incremental oil production and CO2 storage capacity ........................................... 71 Table 14. Rough estimation of CCS costs (in EUR) for the Mokrá – CZ III case study........................ 74 Table 15. Overview of the Case Study - Mokrá cement plant – cluster CZ III ...................................... 75
ENOS D6.7 | Towards a strategic development plan for CO2-EOR in the Vienna Basin
8/ 93
Executive Summary
Within the framework of the H2020 ENOS project an assessment of the CO2 enhanced oil recovery
(EOR) potential of the oil fields of the Vienna Basin was conducted. Earlier studies have been completed
on the use of various techniques to maximize the production of individual mature oil fields in the Vienna
Basin, spread across Austria, the Czech Republic, and Slovakia. Data on oil field properties, collected
from both national geological surveys and oil companies, were analysed using a bespoke model in order
to derive potential incremental recovery rates based on CO2 injection. The potential additional
recoverable amounts are monetized in order to provide insights on the economic feasibility of the activity.
Furthermore, in order to approximate the environmental benefits of the activity, the total amount of CO2
that could be stored in the activity is also provided.
In order to provide the foundations for a strategic development plan for the region, this study provides the
first overview of the relevant geological, operational, economic and organizational aspects of CO2-EOR
and CO2 storage in the Vienna Basin. In addition to the analysis of the incremental recovery rates due to
CO2-EOR in the oil fields of the Vienna Basin, an inventory is made of industrial CO2 sources within 70
km of the oil field clusters, and pipeline routes connecting selected sources with sinks are proposed. This
process has resulted in the development of two case studies, one in Austria and one in the Czech
Republic. Furthermore, a stakeholder analysis and detailed regulatory assessment of CO2-EOR and
CCS in the three countries of the Vienna Basin are made.
All the three countries of the Vienna Basin have potential for both CO2-EOR and CO2 storage. By far the
greatest potential for both EOR and CO2 storage can be found in the Austrian part of the Vienna Basin,
in the large Matzen cluster. For the entire basin, the theoretical incremental recovery of additional oil due
to CO2 injection has been calculated as of 21 million Sm3 (130 million barrels), which, using the current
(February, 2020) oil price of 40 USD per barrel of oil represents (if produced) a gross value of 5,200
million USD. The amount of CO2 that would be needed to perform the related CO2-EOR operations and
thereafter stored in the depleted fields is estimated to nearly 140 million tonnes. Therefore, from this
initial analysis, at least from a theoretical perspective, the potential for CO2-EOR combined with CO2
storage warrants further investigation.
Despite this theoretical potential, there are a number of technical, regulatory and economic aspects that
need to be highlighted. Some of these challenges are specific to the region, others are applicable to all
CCS and CO2-EOR projects. Regarding EOR, there are some technical questions regarding the ability to
achieve fully miscible CO2 flooding conditions in the fields of the Vienna Basin, which is considered most
favourable for maximum enhanced oil recovery. The presence of many legacy wells across many of the
fields can lead to risk management issues that have to be dealt with during permitting. Regarding CO2
capture, there are few sources of potentially ‘low-cost’ CO2 in the region. The bulk of the emissions are
either from oil refineries or cements plants, which are generally considered to have high CO2 capture
costs.
From a regulatory point of view, although CO2-EOR as an industrial activity, and in combination with CO2
storage, is fully legal within EU legislations, there are a few country-specific challenges. A key
showstopper is the current prohibition of CO2 storage in Austria. Furthermore, there is little experience in
regulating the combined activities of CO2-EOR and CO2 storage under the EU CCS Directive.

ENOS D6.7 | Towards a strategic development plan for CO2-EOR in the Vienna Basin
9/ 93
In order to take the concept of CO2-EOR and CO2 storage in the Vienna Basin further, it is recommended
to raise awareness amongst public and private stakeholders regarding the economic and environmental
benefits of this concept. By advancing the two case studies developed within this analysis, using site-
specific data, a better understanding of the technical and financial aspects of potential projects can be
developed. Finally it is recommended to evaluate the suitability of European policy support mechanisms
to bridge the current financing gap between the cost of CCS and the incentives given by the EU
Emission Trading Scheme.
ENOS D6.7 | Towards a strategic development plan for CO2-EOR in the Vienna Basin
10/ 93
1 Introduction
Leading from the exploratory work completed for the Czech LBr-1 CO2-EOR pilot site, this deliverable
conducts an assessment of the CO2-EOR potential of the oil fields of the Vienna Basin. Earlier studies
have been completed on the use of various techniques to maximize the production of individual mature
oil fields in the Vienna Basin, spread across Austria, the Czech Republic, and Slovakia. Information has
been published within European projects (Šliaupa 2013, EU GeoCapacity 2008), and by commercial
parties (Potsch 2004). From this information it is clear that potential exists for enhancing oil recovery in
the region through CO2 injection, however commercial projects have yet to take place. A strategic,
regional dialogue involving both emitters, potential storage operators and governing bodies on the
potential for CO2-EOR and storage synergies can have considerable value for understanding the barriers
and drivers for moving this concept forward.
Objective
The objective of this study is to explore the potential drivers and barriers to the development of CO2-EOR
in the Vienna Basin region of Austria, the Czech Republic, and Slovakia. Data on oil field properties,
collected from both national geological surveys and oil companies, is analysed using a bespoke model in
order to derive potential incremental recovery rates based on CO2 injection. The potential additional
recoverable amounts are monetized in order to provide insights on the economic feasibility of the activity.
Furthermore, in order to approximate the environmental benefits of the activity, the total amount of CO2
that could be stored in the activity is also provided. To provide a picture of the economic feasibility, the
cost of capturing CO2 from existing point sources, and the costs of building CO2 pipelines are reviewed.
Approach
In order to provide the foundations for a strategic development plan for the region, this deliverable
provides the first overview of the relevant geological, operational, economic and organizational aspects
related to the realization of a strategic development plan. This approach includes a number of steps:,
which are treated in Chapters 2 to 7 of this report, respectively:
1 Collection of background information on the geology of the Vienna Basin and its suitability
for CO2-EOR
This section uses existing literature to provide a background on the geology of the area,
including an overview of existing oil production activities and trends in production rates.
Information has been gathered from the project partners – the national Geological Surveys of
Austria (GBA), the Czech Republic (CGS) and Slovakia (SGIDS).
2 Stakeholder mapping and assessment of regional industries and organizations that can play
a role in the strategic development plan
An important part of the regional plan will be to provide recommendations to relevant
stakeholders in the region. These stakeholders will be primarily investors, such as oil
companies, gas transport companies and CO2 emitters, but also governments and regional
development organisations who may have an interest in the economic and environmental
benefits that CO2-EOR could provide.

ENOS D6.7 | Towards a strategic development plan for CO2-EOR in the Vienna Basin
11/ 93
3 Screening of oil fields for CO2-EOR potential using a conceptual numerical simulation model
Using data collected in step 1, a conceptual numerical simulation model, developed by NORCE
was used to screen a large number of oil fields in the Vienna Basin region in order to identify
sites which are particularly suitable for CO2-EOR. Key parameters including field depth,
permeability, pressure depletion, original oil in place and the oil zone thickness were used to
estimate the potential additional recovery factors.
4 Quick-scan of CO2 point sources in the region of potential EOR sites
In order to be able to construct possible regional CO2-EOR projects, potential CO2 sources are
identified and examined. Data from national emissions inventories were gathered, and the
sources were assessed for their suitability for CO2 capture. Here the type of energy
production/industrial process, the amount of CO2 emitted and inclusion in the EU Emissions
Trading Scheme were important aspects.
5 Completing a regional source-sink matching exercise to identify possible business-cases
Data gathered from steps 3 and 4 were incorporated into GIS mapping software in order to
facilitate regional source-sink matching, as the basis for potential business-case identification.
The CO2 sources, potential EOR-sites and transport routes are described. Suggestions for
potential business cases are highlighted.
6 Identification of regulatory, technical and conflicting interest challenges to be addressed in a
strategic development plan for EOR in the Vienna Basin
This section provides the key findings of this exercise, and where appropriate, provides
recommendations to address challenges for CO2-EOR but also CO2 storage activities in the
region.

ENOS D6.7 | Towards a strategic development plan for CO2-EOR in the Vienna Basin
12/ 93
2 Geology and hydrocarbon fields of the Vienna Basin
General geological description and evolution of the Vienna Basin
2.1.1 Introduction
The Vienna Basin (VB) is a NW promontory of the Pannonian Basin System (PB). It has several features,
which make it a very unique basin described in the textbooks by well-known scientists. The VB is
situated in Austria, Czech Republic and Slovakia and has a rich petroleum exploration and production
history starting in the early 20th century. The VB is a SW-NE oriented rhomboid shaped body, ca. 200 km
long and 55 to 60 km broad (Figure 1) in the contact zone of the Bohemian Massif, the Eastern Alps and
the West Carpathians. The evolution is closely associated with the final phase of Alpine-Carpathian
thrusting during the Miocene.
Figure 1. Location of the Vienna Basin within the Alpine-Carpathian thrust belt (Prochác et al. 2012).
ENOS D6.7 | Towards a strategic development plan for CO2-EOR in the Vienna Basin
13/ 93
The remaining hydrocarbon potential of the VB is rather low due to the long production history based on
high level exploration in all three countries. Yet, there are still unexplored hydrocarbon reserves in
lithological traps in Lower Miocene and in pre-Neogene units. Most of the known oil and gas fields are
either exploited and abandoned, or in the final phase of production. A number of fields with sufficient
capacity and good petrophysical properties, such as porosity and permeability, have been converted to
underground gas storages. The high number of abandoned oil-and-gas fields provides an opportunity for
application of enhanced oil recovery techniques using CO2 followed by CO2 storage.
2.1.2 Basin formation and evolution stages
The Vienna Basin formed during the late phase of Alpine-Carpathian thrusting and collision with the
North-European platform associated with growth of an accretion prism in the orogenic front built by the
nappe units of the Outer and Inner West Carpathians and Eastern Alps (Figure 2). During the past 60
years, geologists working in the area of the VB collected a large piece of information on the detailed
internal structure and developed geodynamic concepts describing the basin evolution (for review see
Buday & Cícha 1967; Jiricek & Seifert 1990; Wessely 1993; Arzmüller et al. 2006).
Royden et al. (1983) and Royden (1985) introduced a new concept of two phases of geodynamic
evolution of the VB. During the first phase the “piggyback” basin was carried on thrust sheets
approaching the Bohemian Massif. The Vienna Basin Alpine “Molasse Zone” and the Carpathian
Foredeep formed a continuous depositional space by that time. At the end of the Karpatian age (ca. 16.5
Ma), the Alpine and Carpathian nappes collided with the Bohemian Massif and a new stress field formed
associated with uplift in the North and subsidence in the South and generation of angle discordance of
Karpatian/Badenian strata boundary (Figure 3). The obvious rhombohedral shape of the Vienna Basin,
the left-stepping pattern of en-echelon faults within the basin, and the southward migration of basin
extension through time strongly suggest that this basin is a pull-apart feature formed during middle
Miocene left slip along a northeast-trending fault system. The papers by Royden were revolutionary and
serve as a model for interpretation of numerous sedimentary basins world-wide. Geologists in Austria,
the Czech Republic and Slovakia further developed the understanding of basin evolution, for review see
Kováč et al. (1993), Lankreijer et al. (1995) and Arzmüller et al. (2006).
Reflection seismic lines show that the autochthonous European-plate basement continues beneath the
allochthonous Carpathian nappes and beneath the Vienna Basin, and that in general the European plate
is not significantly disrupted by the normal faults that bound the basin. Thus both the normal faults and
the associated strike-slip faults appear to merge into a gently southeast-dipping detachment at depth. In
this way, extension of the Vienna Basin appears to have been restricted mainly to shallow crustal levels
above that detachment (that is, restricted mainly to the allochthonous nappes of the Carpathians).
Detailed analyses of subsidence and heat-flow data indicate that little or no heating of the lithosphere
occurred during extension of the Vienna Basin, and support the interpretation that extension was
confined to shallow crustal levels. This interpretation explains why hydrocarbons mature at much greater
depths in the Vienna Basin (>5 km) than in the neighbouring Pannonian Basin (Ladwein 1986; Franců et
al. 1996).
There are several phenomena which make the VB different from typical “pull-apart” basins:
- the “thin-skinned” VB subsidence was controlled by relatively shallow faults;
- low heat flow density appears in most of the VB;
- there are no volcanic centres in the VB;
- in the pre-Neogene basin substratum there are no exotic units, only those known from the
outcrops next to the VB (Vass 2002).

ENOS D6.7 | Towards a strategic development plan for CO2-EOR in the Vienna Basin
14/ 93
Figure 2. Stages of the Vienna Basin evolution (Arzmüller et al. 2006)
Figure 3. Example of an unconformity in the sedimentary fill of the Vienna Basin between the Lower and Middle Miocene on
the Hodonín - Gbely Horst in the Northern part of the VB - Czech Republic (Prochác et al. 2012).

ENOS D6.7 | Towards a strategic development plan for CO2-EOR in the Vienna Basin
15/ 93
The given phenomena support the “thin-skinned” tectonics that does not involve extension of the entire lithosphere.
2.1.3 Pre-Neogene floor
The pre-Neogene floor of the VB was a part of an uplifted and eroded crystalline complex of the
Bohemian Massif. Subsidence occurred during Devonian, Carboniferous and Jurassic, when the
extensional passive margin formed of the Tethys Ocean in the South. In the Cretaceous and mainly in
the Paleogene, a compressional regime developed due to Alpine and Carpathian thrusting. Jiricek
(1979), Arzmüller et al (2006) and references therein identified three structural levels (Figure 2, 3, 4
and 5):
1. Lower autochthonous level is built by crystalline of the North-European platform, SE margin of the
Bohemian Massif covered by Palaeozoic, Mesozoic and Tertiary sediments.
2. Middle allochthonous level is built by the direct pre-Neogene floor which consists of the nappe units of
the Eastern Alps and Central West Carpathians:
- Waschberg-Ždánice unit of Jurassic to Lower Miocene age, Flysch zone with Rača, Greifenstein,
Kahlberg and Laab units (Lower Cretaceous to Eocene), built by rhythmically alternating
sandstones, shales, partly conglomerates and carbonates;
- narrow Klippenberg unit of Jurassic-Cretaceous age built by limestones, marls, shales with
sandstone, conglomerate and limestone horizons;
- nappe complex of Mesozoic to Upper Paleozoic sediments (Figure 4) of the Eastern Alps
(Bajuvaricum, Tirolicum, Juvavicum) and Central West Carpathians with tectonic fragments of
Cretaceous and Paleogene sediments of the Gossau unit, built by limestones, dolomites
(dominant lithologies), shales, sandstones, marls, conglomerates and anhydrite layers;
- Crystalline, partly Upper Paleozoic and Mesozoic sediments of Tatric and Grauwacken zone.
3. The upper level consists of Neogene sediments, such as shales, sandstones, a few conglomerates
and organodetritic Lithotamnium limestones. The basin geometry is controlled by a trans-tensional
system of faults.
2.1.4 Vienna Basin sedimentary fill
Neogene sediments in the VB reach a thickness of over 5 km in the basin centre (Figure 5) and
represent an almost complete set of strata with a few hiatuses, e.g. Eger or Roman (Figure 6, Figure 7).
Lower Miocene was deposited on the eroded surface of the moving tectonic units of the Alps and
Carpathians (“piggy-back basin”). Eggenburgian succession was deposited in a marine environment in
the North and in a brackish and lacustrine-deltaic environment in the central basin. The southern part of
the VB area was dry land by that time. Sedimentary profile of the Eggenburgian starts with basal
conglomerates and sandstones followed by “schlier”-type laminated calcareous shales and silts. The
Ottnangian consists of basal sandstones overlain by typical “schlier”.
The Karpatian is developed in two cycles, each of them starts in the North with thick sandstones, which
pinch-out towards South and change laterally and vertically to “schlier”. During the Lower Miocene, the
northern part of VB was more marine and the southern part was emerged. In contrast, by the end of
Karpatian and during Badenian, the most striking tectonic event, associated with sea bottom topography
inversion, occurred in the area of the VB due to the late phase of Alpine and Carpathian plate collision
with the Bohemian Massif. The Carpathian nappes north of the VB were uplifted while the central part of
the VB subsided (Royden 1985, Jiříček 1988).
ENOS D6.7 | Towards a strategic development plan for CO2-EOR in the Vienna Basin
16/ 93
Figure 4. Geological Sketch Map – pre-Neogene Alpine-Carpathian connection in the Vienna Basin (Arzmüller et al. 2006).

ENOS D6.7 | Towards a strategic development plan for CO2-EOR in the Vienna Basin
17/ 93
Figure 5. Geological sections through the Vienna Basin and its pre-Neogene floor (Arzmüller et al. 2006). Location of the
sections is shown in Figure 4.
During the Middle and Upper Miocene, a large river delta brought significant amount of material from the
West into the rapidly subsiding central VB. Two other deltas developed in the southern and northern
parts. The Lower Badenian is built by two facial types of lithology: (1) thick sandstones of the palaeodelta
in the western and central VB and (2) basal sandstones followed by overlying “Tegl” shales in the rest of
the VB.
ENOS D6.7 | Towards a strategic development plan for CO2-EOR in the Vienna Basin
18/ 93
Figure 6. Stratigraphy and evolution of the Vienna Basin in the Miocene (Lee and Wagreich 2018)

ENOS D6.7 | Towards a strategic development plan for CO2-EOR in the Vienna Basin
19/ 93
Figure 7. Stratigraphy of the Vienna Basin in the Neogene (Jiricek and Seifert 1990)
The Middle Badenian is built by shales and sandstone bodies, blanket sandstones and terminal shale
known for its significant seal properties for hydrocarbon accumulations. The Upper Badenian is
characteristic by interfingered sandstones and shales.
The Lower Sarmatian deposits consist of marine with grey sandy shales, siltstones and sandstones while
the Middle and Upper Sarmatian sequence comprises brackish with greenish-grey calcareous shales,
sandstones and sandy limestones. Brackish depositional conditions prevailed during the Pannonian with
deposition of a sandy delta body in the central VB surrounded by marls and shales overlain by
alternating sandstones and shales. In the Lower Pontian, coal seams were deposited with sandstones,
dark calcareous shales in lacustrine environment. During the Dacian, the lake environment gradually
changed to a fluvial environment.

ENOS D6.7 | Towards a strategic development plan for CO2-EOR in the Vienna Basin
20/ 93
2.1.5 Main tectonic elements of the Vienna Basin
During the early phase of evolution, the VB formed on moving thrusts, which have the typical Alpine
tectonic structure. That is why all the pre-Neogene floor of the VB is tectonically deformed, expressed in
a stacked set of many thrust sheets. All the units are uplifted and partially eroded (Figure 8).
Due to the collision of the Alpine thrust sheets with Bohemian Massif, Lower Miocene sediments were
deformed and partly eroded by the end of Karpatian, especially in the northern part of the VB. Normal
faults are typical for the early phase of the VB evolution. An angular unconformity developed between the
sediments of the Lower and Middle Miocene.
The seismic sections show Middle Miocene and Pliocene strata in subhorizontal position (Figure 3) with
little or no deformation. During the second phase of tectonic evolution, synsedimentary flexural faults
formed and divided the basin into elevated horst structures and subsided deeper blocks with similar
stratigraphy. Some faults terminate at the Badenian-Sarmatian boundary while others reach up to the
Pliocene.
Based on the identified fault geometry, the VB is subdivided into a number of structural blocks (Figure 8),
such as elevations (horsts) and depressions oriented in the longitudinal direction, e.g. Moravian Central
Depression, Gbely-Hodonín Horst, Zistersdorf depression, or transverse direction, e.g. Kúty Trough,
Matzen Elevation, Suchohrad Depression and Lakšáry elevation.
The leading fault systems comprise the Steinberg, Bisamberg, Leopoldsdorf, Lanžhot-Hrušky, Farské,
Lakšáry, Little Carpathian, etc., where the vertical throw at the base of the Badenian is up to several
thousand meters. The smaller associated fault systems show throw of several hundred meters (Figure 8
and Figure 9). Syntectonic deposition during post-Lower Miocene time produced considerable
differences in sediment thickness on the footwall and hanging wall blocks. In this way, several thousand
meters thick layer in the subsided block corresponds to a few hundred m thick condensed strata of the
same age on the footwall block. Facial patterns follow the same areal diversification, e.g. Lithothamnium
Limestones of the Middle Badenian on the elevated blocks correlate in age with clay-silt layers in the
depressions.

ENOS D6.7 | Towards a strategic development plan for CO2-EOR in the Vienna Basin
21/ 93
Figure 8. Geological subsurface map of the Vienna Basin shows the main fault systems, depressions, horsts and related
structural blocks (Arzmüller et al.2006).
ENOS D6.7 | Towards a strategic development plan for CO2-EOR in the Vienna Basin
22/ 93
Figure 9. Seismic sections across northern and central part of the Vienna Basin (Lee and Wagreich 2018)
The faults create new traps controlled by discontinuity of lithological horizons. “Open” faults occur, where
sands are present on both sides of the fault, while “closed” faults have sand on one side and shale on
the other. Many of the oil and gas fields in the VB are tectonically bounded by closed faults, which
prevent fluid movement from the lower (hanging wall) to the upper (footwall) block. Tectonic closures of
reservoirs are usually combined with additional lithological pinch-outs.
Oil and gas in the Vienna Basin
2.2.1 Oil and gas occurrences
The occurrence of oil and gas accumulations in the VB reflects the most striking structural elements
(Figure 10Erreur ! Source du renvoi introuvable.). They are mostly concentrated along the depocentre
of the buried Jurassic sediments, especially the Mikulov marls of the Malm age situated in the W and NW
part of the basin. The marls are considered to be the main source rock of the VB hydrocarbons. Other
potential source rocks, e.g. deeply buried Neogene sediments, Palaeogene, Triassic or Cretaceous of
the Alpine thrusts, are only of secondary importance for hydrocarbon formation.
Hydrocarbon accumulations in Neogene sediments are often bound to tectonic traps in sandy layers
attached to big fault systems (see above). The transgression-regression cycles in various periods of the
Neogene led to deposition of numerous sandy horizons on top of each other, which caused the creation
of complex hydrocarbon fields with several production zones. In some cases (e.g. the Matzen, Hrušky or
Láb fields), even tens of productive horizons are situated on top of each other. In addition to the tectonic
traps, anticline-type traps also occur, bound to elevation structures where faults play only a minor role, as
well as lithologically isolated sand lenses.

ENOS D6.7 | Towards a strategic development plan for CO2-EOR in the Vienna Basin
23/ 93
Figure 10. Oil and gas fields in the Vienna Basin (Arzmüller et al. 2006)

ENOS D6.7 | Towards a strategic development plan for CO2-EOR in the Vienna Basin
24/ 93
From the stratigraphic point of view, oil and gas reservoirs occur from Eggenburgian up to Lower
Pannonian. No hydrocarbon accumulation has been discovered in older sediments so far. Most of the
fields are located in Badenian and Lower Sarmatian sediments. In the Northern part of the VB, small oil
and gas fields can be found in the Flysch basement, bounded by Paleocene and Eocene turbidite
sandstones close to the Steinberg fault system. Relatively big hydrocarbon fields can be found in the
basement of the central part of the VB, notably in Triassic dolomites of Northern Limestone Alps. Oil and
gas accumulates in the so called “buried hills” (e.g. oil fields Schönkirchen Tief and Prottes Tief or gas
fields Aderklaa, Baumgarten, Závod and Borský Jur) and in the inner structure of the Flysch nappes (e.g.
gas fields Schönkirchen Übertief, Reyersdorf or Aderklaa Tief) that have formed in the imbricated system
(Arzmüller et al. 2006).
The caprock of the hydrocarbon reservoirs consists mostly of Neogene claystones. In case of the fields
located in the internal structure of the nappes the sealing rocks are clayey shales of Cretaceous and
Paleogene age. The oil and gas in the Northern and central parts of the VB are mostly of thermogenic
origin while fields with biogenic gas prevail in the Southern and SE part.
2.2.2 History of oil and gas exploration and production
Surface oil-and-gas seeps in the Vienna Basin were known more than hundred years ago. Oil seeps in
the Morava River close to Hodonín inspired E. Tietze, a geologist from Vienna, to dig a 6 m deep
exploration hole in 1901, which was later filled with oil. In 1901-1902 the first well was drilled ca. 1 km
West off the Nesyt farm near Hodonín. Oil shows were encountered at depths of 10 m, 150 m and oil and
gas at 192 – 203 m. The total well depth was 217 m but the well did not result in an economic discovery
(Bednaříková 1984).
Based on the negative assessment by E. Tietze the area was abandoned for some time. Private
explorationists focused at oil impregnations in Quaternary gravels and dug a number of 4-14 m deep
holes and collected several litres of oil from the ground water level per day. The beginning of oil industry
in the VB is usually associated with the year 1913, when the first exploration well was drilled in the
vicinity of Gbely in Slovakia (Figure 11). In 1914, this well produced economically profitable amount of oil
from the first oil field in the Vienna Basin, the Gbely (Egbell) Staré Pole. The daily production from
Neogene strata at depth of 164 m reached 15 metric tons/day (Bednaříková 1984). In the Czech
Republic, the commercial oil production began in 1920 from the Nesyt field (Figure 12) at a depth of 313–
338 m. The commercial production in Austria began in 1934 with Gösting–2 well located close to the
Steinberg fault near Zistersdorf (Janoschek et al. 1996).

ENOS D6.7 | Towards a strategic development plan for CO2-EOR in the Vienna Basin
25/ 93
Figure 11. Drilling rig Trauzl-Rapid and oil rig crew from 1913 – 1914. First production well in the Vienna Basin: Gbely – Old
Field – Slovakia (Bednaříková and Thon 1984).

ENOS D6.7 | Towards a strategic development plan for CO2-EOR in the Vienna Basin
26/ 93
Figure 12. Panorama of the Nesyt oil field (Hodonin – Czech Republic) in the 1920s with old derricks and drilling rig on the
left (Bednaříková & Thon, 1984).
Extensive geological exploration in the Vienna Basin has been going on for about 150 years, bringing
thus a deep insight in the subsurface structure by the early geologists. The knowledge has rapidly grown
as about 6000 wells have been drilled and 2D seismic lines and 3D cubes have been acquired. The
deepest Zistersdorf UT 2A well was drilled in Austria down to a final depth of 8,553 m (Janoschek et al.
1996). The cumulative oil-and-gas production up to 2018 and in 2018 is shown in Table 1. Figure 13 and
Figure 14 show the shares of the three countries in the total production. It is evident that both the
historical and current production of hydrocarbons in the Austrian part of the VB is one order of magnitude
higher than the production in the two other countries.
Table 1. Total oil and gas production until 2018 and production in 2018 in the Vienna Basin. Source: Balance of Mineral
Resources of the Czech Republic and Slovakia, Annual Reports of OMV, MND a.s. and NAFTA.
Country
Total production Production in 2018
Oil production (million tons)
Gas production (billion m3)
Oil production (thousand tons)
Gas production (million m3)
Austria 111.0 75.0 587.0 875.0
Czech Republic 4.1 4.5 28.9 82.2
Slovakia 4.2 26.5 6.3 47.5
Vienna Basin 119.3 106 622.2 1004.7

ENOS D6.7 | Towards a strategic development plan for CO2-EOR in the Vienna Basin
27/ 93
Figure 13. Share of Austria (AT), the Czech Republic (CZ) and Slovakia (SK) in total oil and gas production in the Vienna
Basin until 2018.
Figure 14. Share of Austria (AT), the Czech Republic (CZ) and Slovakia (SK) in oil and gas production in the Vienna Basin
in 2018.
2.2.3 CO2-EOR potential
The big number of mature, nearly depleted and depleted oil fields in the Vienna Basin represents an
interesting potential for CO2-driven enhanced oil recovery (CO2-EOR), combined with subsequent CO2
geological storage. To assess this potential, the characteristics of the oil fields1 in all three national parts
of the Vienna Basin were studied. A brief description of the fields in each country is provided in Chapters
2.3 – 2.5. For the purposes of the study, the oil fields were grouped into geographical clusters (see
Chapter 4.2 for more details). Altogether, nine oil field clusters were studied: 3 in the Czech Republic, 3
in Slovakia and 3 in Austria.
1 Oil fields and combined oil & gas fields were studied; pure gas fields were excluded due to the non-existence of CO2-EOR
potential.

ENOS D6.7 | Towards a strategic development plan for CO2-EOR in the Vienna Basin
28/ 93
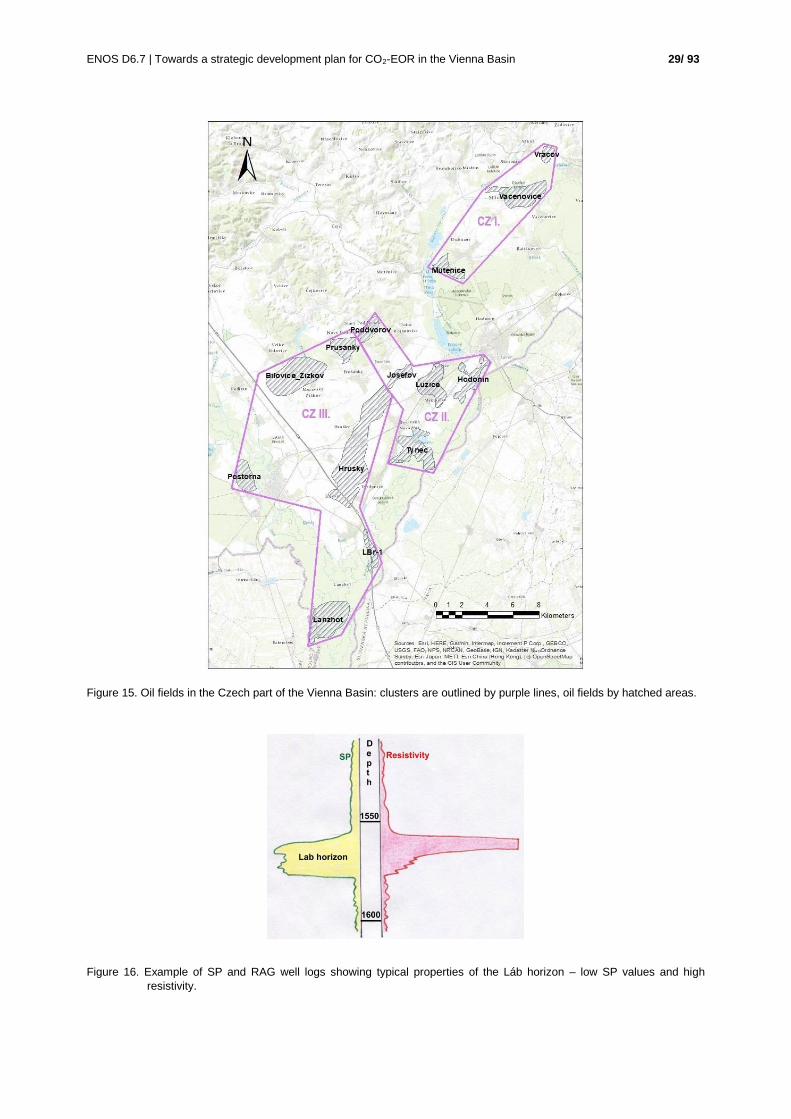
Oil fields in the Czech part of the Vienna Basin
The Czech part of the VB is the smallest one of the three national parts, and also the remaining oil
reserves are relatively limited. Its 14 oil and gas fields can be grouped into three geographical clusters
(Figure 15):
Cluster CZ I: includes Vracov, Vacenovice and Mutěnice oil fields located on the west flank of
the Moravian Central depression (MCD).
Cluster CZ II: includes Poddvorov on the west of MCD, Josefov, east of MCD, and Lužice,
Hodonín and Týnec located on the Hodonín-Gbely horst.
Cluster CZ III: consists of the most important oil and gas fields in the region: Prušánky, Bílovice
Žižkov and Poštorná west of MCD, Hrušky and Lanžhot east of MCD, and LBr-1 located on the
Hodonín-Gbely horst.
The areal distribution of the fields is controlled by block tectonics, which is expressed in a set of major
faults including Schrattenberg, Steinberg, Lanžhot-Hrušky, Hodonín-Gbely, Farské and Brodské. Oil and
gas have been produced from the Eggenburgian through Sarmatian, less important oil fields are located
in the underlying nappes of the Flysch Belt. Badenian reservoirs, mainly the Middle Badenian Láb
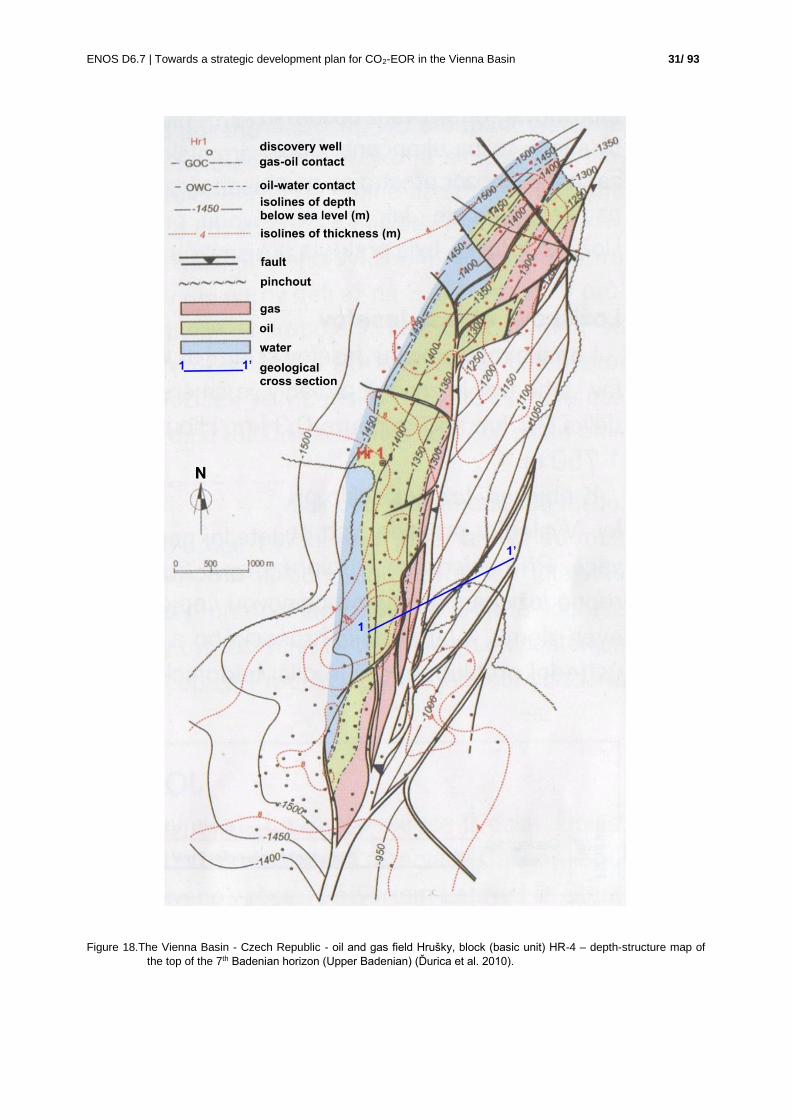
horizon (Fig. 16, 17 and 18) have produced the highest amounts of oil and gas. Hrušky is the largest oil
and gas field with over 20 producing Eggenburgian to Badenian horizons with recoverable reserves of 2
Mt oil and 2 BCM gas (Fig. 18 and 19). Sarmatian reservoirs contain only gas accumulations.
Most of the fields are mature to exploited, some fields (Poddvorov and Hrušky) were partly converted to
underground gas storages. EOR (other methods than CO2-EOR) was applied to a few of these oil fields.
ENOS D6.7 | Towards a strategic development plan for CO2-EOR in the Vienna Basin
29/ 93
Figure 15. Oil fields in the Czech part of the Vienna Basin: clusters are outlined by purple lines, oil fields by hatched areas.
Figure 16. Example of SP and RAG well logs showing typical properties of the Láb horizon – low SP values and high
resistivity.

ENOS D6.7 | Towards a strategic development plan for CO2-EOR in the Vienna Basin
30/ 93
Figure 17.The Vienna Basin - Czech Republic - oil and gas field Poddvorov - West – depth-structure map of the top of the
Láb horizon (Middle Badenian). The field consists of four blocks (basic units): PO-1, PO-2, PO-3 and PO-4.
ENOS D6.7 | Towards a strategic development plan for CO2-EOR in the Vienna Basin
31/ 93
Figure 18.The Vienna Basin - Czech Republic - oil and gas field Hrušky, block (basic unit) HR-4 – depth-structure map of
the top of the 7th Badenian horizon (Upper Badenian) (Ďurica et al. 2010).

ENOS D6.7 | Towards a strategic development plan for CO2-EOR in the Vienna Basin
32/ 93
Figure 19. Oil and gas field Hrušky – geological cross section 1 – 1’ (Buchta et al. 1984). The location of the section is
shown in Fig. 18.
Oil fields in the Slovak part of the Vienna Basin
Three clusters of oil and gas fields can be delimited in the Slovak part of the Vienna Basin (Figure 20),
covering 10 oil fields relevant for the purposes of this study. In the North (cluster SK I.) the fields occur
on the Hodonín-Gbely Horst and in the eastern part of the Farské fault system in the pre-Neogene Flysch
unit. In the central part, i.e. in the Závod – Šaštín Block, oil and gas fields occur in the Neogene (cluster
SK II.) and gas-condensate fields are located in the pre-Neogene Mesozoic dolomite reservoirs of the
North-Eastern Calcareous Alps. In the South of the Slovak part of the VB gas fields prevail, many of
them were converted to underground gas storages. Only a few oil fields occur (cluster SK III.)
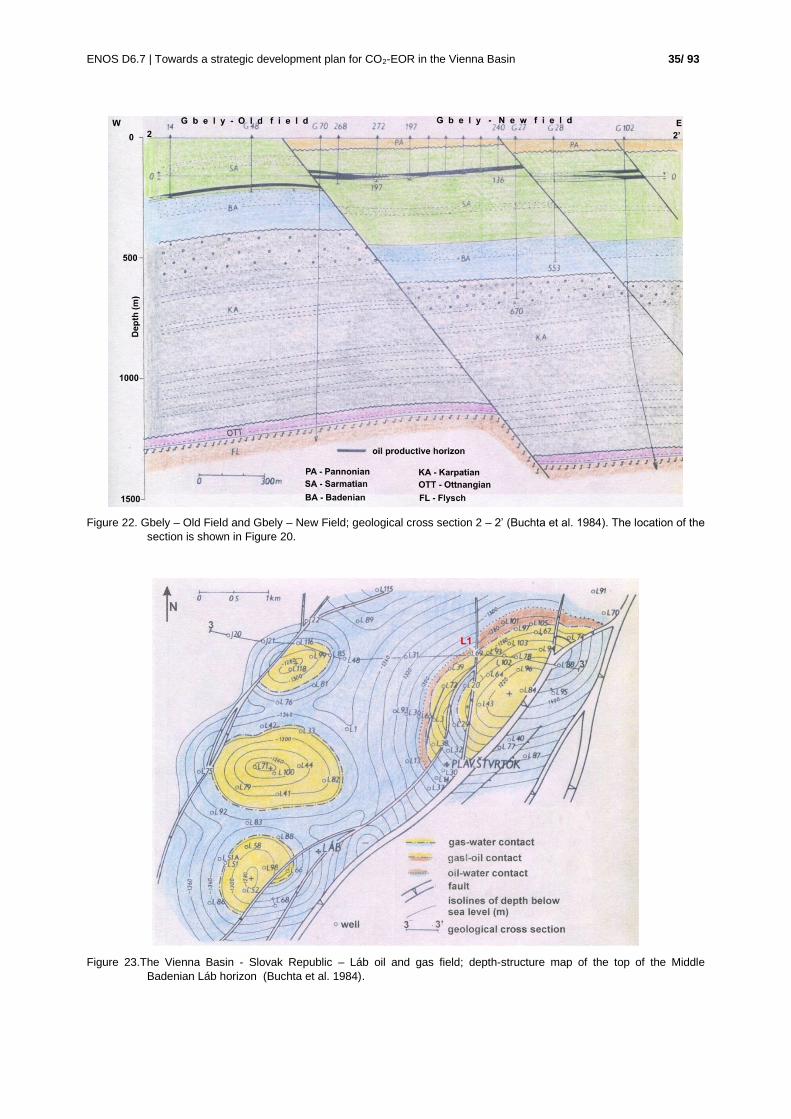
Gbely – Stare pole (“Old Field”, cluster SK I.) is the historically first oil field discovered in the Vienna
Basin (Figure 20 and Figure 21). Here the basal sand of the Sarmatian at a depth of ca. 170-230 m
represents the main oil reservoir. The largest field is the joint Austrian-Slovak Vysoká-Zwerndorf gas
field with total recoverable reserves of ca. 27 Mm3 of gas (9 Mm3 on the Slovak side). The second major
field is Láb (cluster SK III.), where most of the gas horizons were converted to underground gas storage
(Figure 23 and 24). Further fields are divided into 17 partial regions with recoverable reserves in
Eggenburgian to Pannonian reservoirs. Only microbial gas is accumulated in the Pannonian. Smaller oil
fields occur in the Cunín pre-Neogene reservoirs (cluster SK I.) and gas accumulations were found in the
Mesozoic floor (Závod and Borský Jur). The most productive stratigraphic unit is the Badenian, mainly

ENOS D6.7 | Towards a strategic development plan for CO2-EOR in the Vienna Basin
33/ 93
the Middle Badenian Láb horizon. The fields are in general mature or in final phase of production. Limited
EOR was applied in some of the fields.
Figure 20. Oil fields in the Slovak part of the Vienna Basin: clusters are outlined by purple lines, oil fields by hatched areas.

ENOS D6.7 | Towards a strategic development plan for CO2-EOR in the Vienna Basin
34/ 93
Figure 21. The Vienna Basin - Slovak Republic – Gbely – Old Field; the oldest oil field in the Vienna Basin; depth-structure
map of the top of basal Sarmatian horizon; block (basic unit) G1 (Buchta et al. 1984).
ENOS D6.7 | Towards a strategic development plan for CO2-EOR in the Vienna Basin
35/ 93
Figure 22. Gbely – Old Field and Gbely – New Field; geological cross section 2 – 2’ (Buchta et al. 1984). The location of the
section is shown in Figure 20.
Figure 23.The Vienna Basin - Slovak Republic – Láb oil and gas field; depth-structure map of the top of the Middle
Badenian Láb horizon (Buchta et al. 1984).

ENOS D6.7 | Towards a strategic development plan for CO2-EOR in the Vienna Basin
36/ 93
Figure 24. Oil and gas field Lab; geological cross section 3 – 3’ (Buchta et al. 1984). The location of the section is shown in
Figure 22.
Oil fields in the Austrian part of the Vienna Basin
The Austrian part of the VB comprises more than 20 separate oil fields relevant for our research. Some
fields are very small; therefore, they were merged with larger neighbouring fields, which resulted in the
number of 16 project-relevant fields. Three geographical clusters have been determined (Figure 25).
Cluster 1 North
The oil fields of Cluster 1 are arranged along the Steinberg fault system in the northern part of the
Austrian Vienna Basin. Cluster 1 consists of the oil fields Goesting, Van Sickle, Maustrenk, St. Ulrich-
Hauskirchen, Scharfeneck, Neulichtenwarth, Altlichtenwarth, Muehlberg, Bernhardsthal, Rabensburg,
Windisch-Baumgarten, Gaiselberg and Paasdorf as well as the field RAG. Neulichtenwarth, Paasdorf
and Scharfeneck each contain only small amounts of oil in place and are therefore not included in this
project.

ENOS D6.7 | Towards a strategic development plan for CO2-EOR in the Vienna Basin
37/ 93
Figure 25. Clusters of oil fields in the Austrian part of the Vienna Basin. Oil fields are marked in dark green. Black circles
mark the position of wells. Map adopted from Wessely (1993).
The northernmost oil field is Bernhardsthal, which is located near the Austrian-Czech border. Oil has
been produced from Badenian sediments (1,200-1,500 m and 2,000-2,100 m) of a flat dome structure in
the downthrown block of the Steinberg fault system (Zistersdorfer Depression) in 1960-1986. In 1986 oil
production started in the Eggenburgian strata of the Mistelbacher high, at a depth of 1,750 m. The total
cumulative production is less than 1 million tonnes of oil.
Following the south-eastward dipping Steinberg normal fault to the South, the next oil field is Muehlberg
(Figure 26). It is heavily fragmented by the SW-NE-striking Steinberg fault system with both north-
westward and south-eastward dipping fault planes. Oil reservoirs were found in the Badenian at a depth
of 1,000-1,700 m, mostly present in structural traps. Minor oil horizons occur in the so-called Lageniden
zone at a depth 1,800-1,900 m.

ENOS D6.7 | Towards a strategic development plan for CO2-EOR in the Vienna Basin
38/ 93
Altlichtenwarth (formerly Altlithenwarth-Neuberg) is an oil field located to the southwest of Muehlberg.
The oil-bearing horizons in Altlichtenwarth are situated in a shallow anticline in the Sarmatian (1,000 m)
and in numerous blocks of the Badenian (1,400-1,900 m).
Ever further to the southwest are the oil fields St.Ulrich-Hauskirchen and Van Sickle-Plattwald. Both
fields share a similar geological setting. Oil in the area of St.Ulrich is found within doming structures in
the hanging wall block of the Steinberg fault. The sedimentary succession is split into several blocks.
Reservoir horizons in this area start in the lowermost Pannonian (from 450 m) and are found throughout
nearly the whole Sarmatian sequence (500-1,000 m) as well as in the upper Badenian (1,000-1,500 m).
West of the Steinberg fault system, at the Mistelbach high block, oil production is derived from the Flysch
beneath the Neogene basin infill. The oil of this so-called Second Floor reservoir spreads across several
fields, reaching from the field St.Ulrich-Hauskirchen throughout RAG, Gaiselberg, Maustrenk, Neusiedl to
Windisch-Baumgarten. Fractured Palaeocene glauconite sandstones and the highly porous Eocene
Steinberg flysch are underlain by Upper Cretaceous rocks (Altlengbacher Unit). The whole series
belongs to the Greifenstein Nappe, which is tectonically separated into the lower Goesting Unit and the
higher Zistersdorf Unit. Regarding the fields St.Ulrich-Hauskirchen and Van Sickle-Plattwald, oil is
produced from the glauconite sandstone series (900-1,200 m) and the Steinberg flysch series (up to
1,300 m), both part of the Goesting Unit, as well as from the sandstones and conglomerates associated
Figure 26. Geological cross-section through the oil field Muehlberg (Kreutzer 1993)

ENOS D6.7 | Towards a strategic development plan for CO2-EOR in the Vienna Basin
39/ 93
with the “Schlier” base (“Luschitzer series”; 700-1,050 m). The eastern part of the latter is divided into a
northern and a southern depositional environment, separated by a zone of W-E striking marls.
South of St.Ulrich-Hauskirchen and along the Steinberg fault system of Cluster 1 are the oil fields
Goesting (Figure 27), Neusiedl and RAG. Doming structures in the downthrown block of the Steinberg
fault host oil-bearing horizons from the lowermost Pannonian (from 550 m), throughout the whole
Sarmatian (800-1,650 m) and in case of the RAG field down to the upper Badenian (1,850-2,305 m). A
minor oil reservoir was also found at a depth of 3,145-3,193 m in the so-called Sandschaler zone
(Badenian). The Mistelbach high block, directly east of the Steinberg fault, bears oil in the Steinberg
flysch series (950-1,150 m) and the glauconite sandstones (1,170-1,700 m) of the Goesting Unit.
Figure 27. Geological cross-section through the oil field Goesting (Kreutzer 1993).
Maustrenk, formerly called Maustrenk-Kreuzfeld is an oil field associated with the Goesting field. It is
located in the block of the Mistelbach high. The main horizon in this area is the aforementioned
Luschitzer series of the Ottnangian-Eggenburgian, here found at a depth of 820-1,020 m. It comprises
sandstone and conglomerate packages with clay interfingering that generate structural-stratigraphic
traps. A thin horizon of so-called “Leitsand” at the base of the Karpartian bears oil too. Further production

ENOS D6.7 | Towards a strategic development plan for CO2-EOR in the Vienna Basin
40/ 93
is derived from the Steinberg flysch and the glauconite sandstones of the Zistersdorfer Unit (tectonically
higher part of the Greifenstein Nappe; 900-1,050 m).
The southernmost oil fields of Cluster 1 are Windisch-Baumgarten and Gaiselberg (Figure 28).
Sarmatian (930-1,600 m) and Badenian (1,400-2,320 m) sediments of a doming structure in the
downthrown block of the Steinberg fault system are oil bearing but they are heavily fragmented. The
Steinberg flysch and the glauconite sandstones of the Zistersdorfer Unit of the Mistelbach high block host
oil reservoirs as well (500-1,650 m).
Figure 28. Geological cross-section through the oil field Gaiselberg (Kreutzer 1993).
Cluster 2 Matzen
The only oil field relevant to this study in Cluster 2 is the field Matzen. It is the largest oil field not only in
the Vienna Basin but also in all Central Europe. Matzen has a size of approximately 100 km² and more
than 200 million tt of initial oil in place. It belongs to the so-called Middle High Zone of the Vienna Basin,
a local tectonic high block. To the west, Matzen is bordered by the N-S striking, westward dipping
Bockfließer (or Aderklaaer) fault system. It was active during deposition whereas other structures such
as the Matzener fault system in the North or the Schönkirchener fault system in the South formed after
sedimentation.
Oil and gas in the Matzen field have been produced from 25 important horizons at depths of 900-3,300
m. 10 oil bearing horizons are found in the Badenian (1,100-1,700 m), 2 in the Karpatian (Gänserndorf
Unit; 1,900-2,850 m), and 4 in the Ottnangian (Bockfließ Unit; 1,800-2,900 m). Hydrocarbons traps in the
Miocene sediments are mostly combined tectonic (due to the three different fault systems) and
stratigraphic (local clay accumulations in the sand). The 16th-horizon of the first floor covers around half
of the total production of the whole oil field. It is also called “Matzener Sand” and it is the most important
oil bearing horizon in the VB.
The reservoirs of the Second Floor (Figure 29) are found in Triassic Hauptdolomites at depths of 2,800-
6,000 m, depending on their tectonic setting. Despite their scattered locations and varying oil/water-
contact depths, they share a common aquifer and therefore form a coherent hydraulic system. The most

ENOS D6.7 | Towards a strategic development plan for CO2-EOR in the Vienna Basin
41/ 93
important accumulation is the oil reservoir Schönkirchen Tief, which was discovered in 1960. Its initial oil
content is about 17.59 million tonnes (Scharf and Clemens, 2006).
Figure 29. Cross-section through the Second Floor of the Matzen field (Kreutzer 1993).
Cluster 3 Hochleiten
This cluster comprises three oil fields, namely Hohenruppersdorf, Hochleiten, and Pirawarth.
Although still located along the Steinberg fault, the field Hohenruppersdorf (including the field Erdpress)
is attributed to Cluster 3 in this study. In this area at the end of the southern Steinberg fault system, the
Pirawarth-Hochleiten fault system starts to evolve towards the south-west. Oil-bearing horizons in the
downthrown block of the Steinberg fault are found in the Sarmatian (1,050-1,700 m), as well as on the
Mistelbach high block (at 750 m) and in one intermediate block (1,300-1,500 m) in the Badenian. Minor
production was also derived from the upper Cretaceous Flysch of the Kahlenberg Nappe (1,000 m).
Starting from the upper Badenian, the SW-NE striking Pirawarth-Hochleiten fault system was syn-
sedimentary active. A number of tectonic blocks formed, building a sort of stairway toward the Mistelbach
high block. The north-easternmost field of this system is Pirawarth. Beginning at the lower Pannonian
(480 m) oil is found throughout the whole Neogene sedimentary sequence down to the lower Lageniden
zone of the Badenian.
The oil field Hochleiten (Figure 30) is situated just to the south-west of the field Pirawarth, separated by
the Hochleiten fault. It is the last oil field of the SE-ward dipping Pirawarth-Hochleiten fault system.
Miocene reservoirs are located almost exclusively in the downthrown block of the main Pirawarth fault
though on the high block of the eastward dipping Hochleiten fault. Oil is found in the Sarmatian (880-
1,140 m), in the Upper Badenian (1,070-1,320 m) and in the Upper Lageniden Zone (885-895 m in
intermediate block; 1,450-1,560 m in downthrown block). Below the Neogene sediments, the Second
Floor produced some oil from the Upper Cretaceous and Eocene Flysch of the Kahlenberg Nappe (800-
2,200 m).

ENOS D6.7 | Towards a strategic development plan for CO2-EOR in the Vienna Basin
42/ 93
Figure 30. Geological cross-section through the oil field Hochleiten (Kreutzer 1993).

ENOS D6.7 | Towards a strategic development plan for CO2-EOR in the Vienna Basin
43/ 93
3 Stakeholder mapping and assessment of regional industries and organizations
Introduction to stakeholder mapping and analysis
In addition to assessing the geological and technical potential for CO2-EOR in the Vienna Basin, it’s also
important to understand the broader societal and economic framework of the region. Conducting a
stakeholder mapping and analysis is important to identify the organizations that can have an interest in or
influence the outcome of a project, in this case realization of a CO2-EOR project in the Vienna Basin.
These regional actors, such as potential investors, government and non-governmental stakeholders can
assist in the development of focused recommendations for the development of CO2-EOR in the Vienna
Basin. Stakeholder mapping and analysis have been completed for the Austrian, Czech and Slovakian
sectors of the Vienna Basin.
In the following Chapters the results of a simple stakeholder mapping and assessment process for the
three regions are presented. In addition to identifying the stakeholders, their interests and possible
influence or impact on the potential development of CO2-EOR in the region is briefly described.
Austria
In December 2019 Austria presented its long-term strategy on how to reach its climate goals, following
up to EU regulation 2018/1999. The strategy comprises several scenarios, where CCS and CCU play an
important role to meet Austria’s climate obligations. Nevertheless, the underground storage of CO2 is
currently forbidden and the ban is re-evaluated every 5 years (next evaluation in 2023). Research on
storage capacity has so far only been carried out for oil and gas reservoirs. The overall capacity is about
500 million tonnes CO2, of which more than 80 % could be stored in the Vienna Basin. Alternatively, it
would also be possible to transport the captured CO2 to a different country and store it in e.g. large-scale
offshore storage sites.
Table 2 presents a broader stakeholder analysis for CO2-EOR activities in the Austrian part of the Vienna
Basin.
We have asked three important industrial stakeholders for an interview and summarized their positions
on CCS and CCU.
- VÖZ
The VÖZ (Vereinigung Österreichischer Zementindustrie) forms a lobby for the Austrian cement
industry. Its shareholders are CRH, Holcim, Lafarge, Leube, Rohrdorfer, Schretter & Cie, w&p and
Baumit. EU ETS CO2 pricing has a strong influence on the cement industry. A big part of the produced
emissions comes from the CO2 that is released from the carbonates during cement production.
Increasing the efficiency by clinker substitution and by using substitute fuels has brought a CO2
reduction of 25 % in the last 30 years in Austria. According to VÖZ the potential for CO2 reduction by
further efficiency increase is almost exhausted. CCS and CCU would enable a further reduction in
accordance with the European Union’s objectives. Currently there is no carbon capture project
supported by the cement industry in Austria. The implementation of capture technology requires long-
term planning and substantial financial investments. So far, research on CCS has only been done by
partners in Germany. Should the ban on CCS in Austria continue, then transportation to and storage
of CO2 in other countries could help to achieve the climate goals for the Austrian cement industry.

ENOS D6.7 | Towards a strategic development plan for CO2-EOR in the Vienna Basin
44/ 93
Table 2. A simple stakeholder analysis for CO2-EOR activities in the Austrian part of the Vienna Basin. Green =
governmental bodies, grey = private companies, blue = non-governmental bodies.
Stakeholder
name
Type of
organisation Interests Influence/impact
Ministry of Agriculture, Regions and Tourism
Governmental body - Ministry
Developing and implementing policies and regulations concerning the use of geological structure
Responsible for the provision of exploration, production and storage licenses of hydrocarbons. Evaluating the CCS ban in Austria every 5 years.
Environmental Agency Austria
Governmental body - independent
Transformation of the economy and society to ensure sustainable living
Recommendations for decision-makers in politics, administration and business in Austria and the EU
OMV Oil and gas company – partly nationalized
Production of hydrocarbons
Potential CO2-EOR user and CCS operator, biggest CO2 producer in the Vienna Basin and potential investor
RAG Austria AG Oil and gas company
Providing secure, sustainable, competitive and affordable energy
Runs currently power-to-gas system in upper Austria, Experiences with underground CO2 injection
Wien Energie Energy supplier Power plant operator CO2 emitter and potential investor
Vereinigung Österreichischer Zementindustrie
Association of the cement industry in Austria
Mining and production of cement CO2 emitter and potential investor
EVN Energy supplier Power plant operator CO2 emitter and potential investor
Agrana Zucker GmbH
Sugar producing company
Production of sugar and sugar products
CO2 emitter and potential investor
Trans Austria Gasleitung GmbH
Transmission system operator in Austria
Transportation of natural gas via pipeline
CO2 emitter and potential investor
FCC Zistersdorf Abfall Service GmbH
Waste combustion company
Production of electricity from waste combustion
CO2 emitter and potential investor
Jungbunzlauer Austria AG
Producer of biodegradable ingredients
Production of biodegradable ingredients of natural origin
CO2 emitter and potential investor
Fritz Egger GmbH & Co KG
Producer of wood products
Producing wooden construction materials & furniture
CO2 emitter and potential investor
W. Hamburger GmbH
Paper producing company
Producing paper products CO2 emitter and potential investor
Professor Reinhard Sachsenhofer
Montanuniversity Leoben
Research on petroleum geology Experienced in geology of the Vienna Basin
Professor Holger Ott
Montanuniversity Leoben
Research on CCS and CO2-EOR Experienced in CO2-EOR and underground gas storage
Greenpeace Austria
Non-governmental organization (NGO)
Greenpeace is an independent and international environmental organization.
Holds a negative sentiment regarding the use of hydrocarbons and CCS. Likely to create social and political resistance to a CO2-EOR project.
Local community next to storage sites
Might lead to public campaign against CCS projects
- Wien Energie
Wien Energie is Austria’s biggest energy supplier and one of the biggest CO2 emitters in the Austrian
Vienna Basin. There has been no research on CCS so far, but research on carbon capture with solid
sorbents was carried out in the ViennaGreenCO2 project. Energy suppliers, in contrast to other
industrial sectors cannot move to foreign countries and bypass CO2 pricing. To fulfil its ETS emission
reduction goals, Wien Energie will further invest in geothermal energy and perhaps CCU projects.
According to Wien Energie, carbon capture technology for thermal power plants or waste incineration

ENOS D6.7 | Towards a strategic development plan for CO2-EOR in the Vienna Basin
45/ 93
is currently not sufficiently developed, as no large-scale systems have been in operation for the entire
life cycle of a plant. CCS investments are not planned and won’t be considered unless the legal
framework changes and capture technology gets economic.
- OMV
OMV is Austria’s biggest oil & gas company and its refinery in Schwechat is the biggest single CO2
emitting facility in the Vienna Basin. OMV is the most important industrial stakeholder for CCS and
CO2-EOR operations in Austria. On the one hand they are a big CO2 emitter, on the other hand, if the
legal framework should change, they have the necessary technology to realize CCS applications in
Austria. Unfortunately, there is currently no clear position on CCS from OMV. A stakeholder interview
for the ENOS project could not be realized, as the topic is currently under internal evaluation.
According to our research, EOR activities in the Vienna Basin (by OMV) are currently focusing on
polymer injection. Whether OMV change their approach to CO2-EOR if the EU ETS prices rise, is
unknown.
Czech Republic
CCUS does not belong to prioritised climate change mitigation technologies in the Czech Republic, and
no national support programmes nor measures have been prepared so far, except for some (limited)
support of research and development. Nevertheless, some of the national strategic documents take this
technology into account.
The State Energy Policy of the Czech Republic (MPO, 2014) mentions CCS as a technology that may
contribute to fulfilling of national climate protection commitments after 2040. It also counts geological
storage of carbon dioxide among the basic priorities of energy research and innovation.
The Climate Protection Policy of the Czech Republic (MŽP, 2017) provides three scenarios of achieving
80% GHG emissions reduction by 2050. One of them relies on massive development of CCS in the
energy sector, which, unfortunately, cannot be considered realistic any more due to the recent trends of
abating fossil fuels combustion in the EU. No considerations of possible role of CCUS in decarbonisation
of emission-intensive industries are included.
The National Energy and Climate Plan (NECP) of the Czech Republic for the period 2021-2030 (MPO,
2019) mentions CCS and CCU in combination with possible future utilisation of natural gas for energy
and transport purposes, which generally means production of “blue” hydrogen. No concrete plans or
measures are suggested. Oil is still considered an important primary energy source up to 2030, with
relatively stable input energy value of ca. 370 PJ throughout the period. This would correspond to a 20.5
% share in the mix of primary energy sources in 2030. In this respect, increasing the domestic oil
production, including utilisation of CO2-EOR, can be considered desirable.
Table 3 presents a broader stakeholder analysis for CO2-EOR activities in the Czech part of the Vienna Basin.
CGS organised a series of meetings and consultations with key stakeholders representing the group of
policy makers and regulators to discuss the current national political and regulatory framework of CCUS,
including utilisation of CO2 for EOR. Meetings were held with Ministry of Industry of Trade, Ministry of the
Environment – Dept. of Geology and Dept. of Energy and climate protection, and the District Mining
Authority in Brno (responsible for the Vienna Basin area in the Czech Republic).
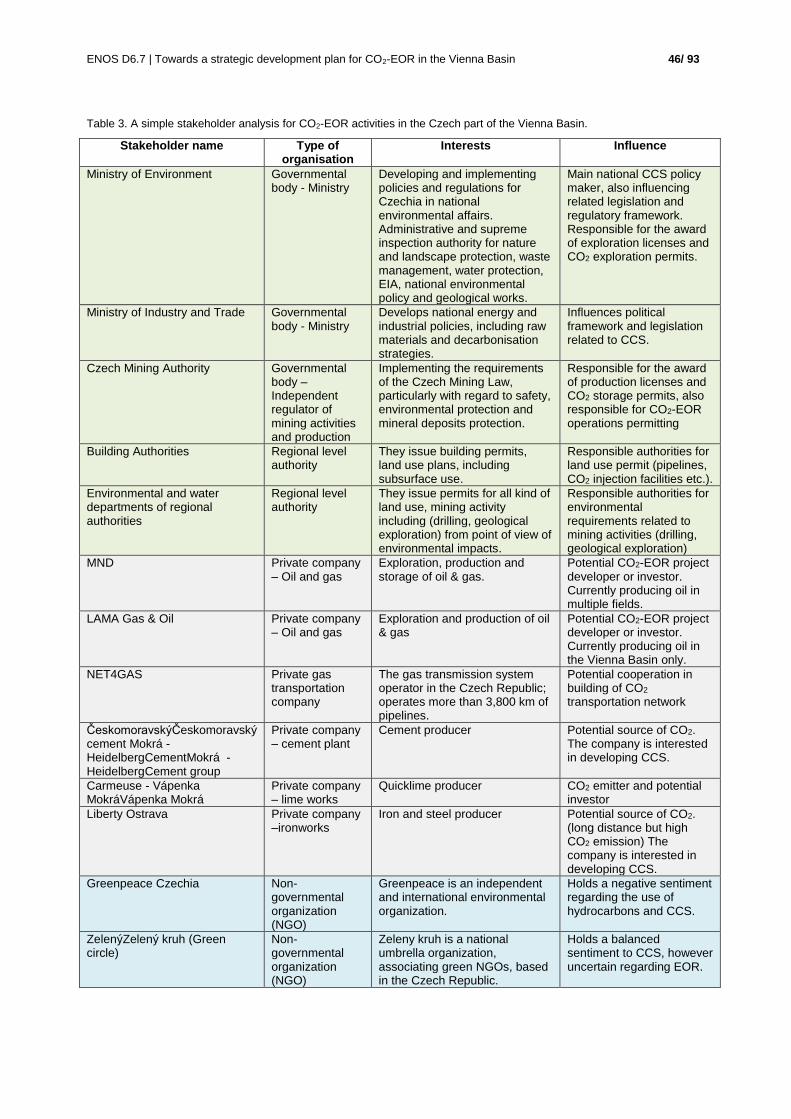
ENOS D6.7 | Towards a strategic development plan for CO2-EOR in the Vienna Basin
46/ 93
Table 3. A simple stakeholder analysis for CO2-EOR activities in the Czech part of the Vienna Basin.
Stakeholder name Type of organisation
Interests Influence
Ministry of Environment Governmental body - Ministry
Developing and implementing policies and regulations for Czechia in national environmental affairs. Administrative and supreme inspection authority for nature and landscape protection, waste management, water protection, EIA, national environmental policy and geological works.
Main national CCS policy maker, also influencing related legislation and regulatory framework. Responsible for the award of exploration licenses and CO2 exploration permits.
Ministry of Industry and Trade Governmental body - Ministry
Develops national energy and industrial policies, including raw materials and decarbonisation strategies.
Influences political framework and legislation related to CCS.
Czech Mining Authority Governmental body – Independent regulator of mining activities and production
Implementing the requirements of the Czech Mining Law, particularly with regard to safety, environmental protection and mineral deposits protection.
Responsible for the award of production licenses and CO2 storage permits, also responsible for CO2-EOR operations permitting
Building Authorities Regional level authority
They issue building permits, land use plans, including subsurface use.
Responsible authorities for land use permit (pipelines, CO2 injection facilities etc.).
Environmental and water departments of regional authorities
Regional level authority
They issue permits for all kind of land use, mining activity including (drilling, geological exploration) from point of view of environmental impacts.
Responsible authorities for environmental requirements related to mining activities (drilling, geological exploration)
MND Private company – Oil and gas
Exploration, production and storage of oil & gas.
Potential CO2-EOR project developer or investor. Currently producing oil in multiple fields.
LAMA Gas & Oil Private company – Oil and gas
Exploration and production of oil & gas
Potential CO2-EOR project developer or investor. Currently producing oil in the Vienna Basin only.
NET4GAS Private gas transportation company
The gas transmission system operator in the Czech Republic; operates more than 3,800 km of pipelines.
Potential cooperation in building of CO2 transportation network
ČeskomoravskýČeskomoravský cement Mokrá - HeidelbergCementMokrá - HeidelbergCement group
Private company – cement plant
Cement producer Potential source of CO2. The company is interested in developing CCS.
Carmeuse - Vápenka MokráVápenka Mokrá
Private company – lime works
Quicklime producer CO2 emitter and potential investor
Liberty Ostrava Private company –ironworks
Iron and steel producer Potential source of CO2. (long distance but high CO2 emission) The company is interested in developing CCS.
Greenpeace Czechia Non-governmental organization (NGO)
Greenpeace is an independent and international environmental organization.
Holds a negative sentiment regarding the use of hydrocarbons and CCS.
ZelenýZelený kruh (Green circle)
Non-governmental organization (NGO)
Zeleny kruh is a national umbrella organization, associating green NGOs, based in the Czech Republic.
Holds a balanced sentiment to CCS, however uncertain regarding EOR.
ENOS D6.7 | Towards a strategic development plan for CO2-EOR in the Vienna Basin
47/ 93
The position of the Ministries towards CO2-EOR is rather ambivalent because this technology is
considered just a special kind of oil production, fully within the competence of the Mining Authority.
Utilisation of depleted hydrocarbon reservoirs for CO2 storage is acknowledged as the primary
opportunity for deployment of the technology in the country because of the higher level of knowledge in
comparison with deep saline aquifers. All the consulted authorities are aware of the gaps in the
regulatory framework (see chapter 7.1 for details) but are not planning any immediate actions to improve
the situation at the moment. They also register the increased interest of the emission-intensive industries
in CCUS (see below). The Chairman of the District Mining Authority in Brno is supportive of development
of CO2-EOR with subsequent CO2 storage in Czechia and does not see any serious regulatory obstacles
that should hinder this development.
Consultations were also held with two potential CO2-EOR project developers – the oil companies MND
a.s. and LAMA Gas & Oil s.r.o. MND is a long-term partner of CGS, supporting a number of CO2-EOR
and CCS-related studies in the past and present. MND is member of ENOS End-User Committee and
supported ENOS, including this study, by provision of data from the oil fields it has been operating. MND
is interested in developing CO2-EOR projects possibly combined with subsequent CO2 storage. LAMA
Gas & Oil is a smaller operator of two oil fields in the Vienna Basin and their interest in CO2-EOR
remains reserved.
Last but not least, a series of meetings was organised with representatives of CO2-emission-intensive
industries – Liberty Ostrava (iron and steel producer), Českomoravský cement (cement manufacturer)
and C-Energy Planá (energy producer). All of them are currently considering CCUS as an option for
reduction of their greenhouse gas emissions and are highly interested in concrete possibilities of using
hydrocarbon fields (not only in the Vienna Basin) as possible CO2 storage sites, looking for a competent
partner as storage site operator at the same time.
From the geographical point of view, the most interesting partner would be Českomoravský cement,
member of the HeidelbergCement Group, operating one of the biggest Czech cement plants at Mokrá, in
a distance of ca. 50 km from the oil fields in the Czech part of the Vienna Basin. This facility has been
selected for one of the case studies of ENOS Task 6.5 (see chapter 6.2.2) and the information obtained
in the meeting were used for elaboration of the study.
Slovakia
The organisations in Slovakia responsible for granting of provisions for CO2 storage and CO2-EOR
exploitation fall within Ministry of Environment and Ministry of Economy of the Slovak Republic. Granting
of permissions is based on expertise and opinion of the government body Main Mining Authority, as an
independent regulator of mining activities in the Slovak Republic.
SGIDS and CGS held a meeting with NAFTA, the private oil and gas exploration and production
company, on various topics related to the ENOS project. Regarding CO2-EOR, NAFTA top management
considers the technology currently not relevant and unprofitable.
Potential stakeholders owning sources of CO2 haven´t been approached. The largest emitters in the
region, are Slovnaft a.s., an oil refinery, and cement factories. Only a limited amount of public information
on their CO2 emissions are available. The opinion of non-governmental organisations regarding CCUS
and CO2-EOR is generally unknown; these organisations might, however, have a strong influence on
public attitude.

ENOS D6.7 | Towards a strategic development plan for CO2-EOR in the Vienna Basin
48/ 93
Table 4 presents a broader stakeholder analysis for CO2-EOR activities in the Slovak part of the Vienna
Basin.
Table 4. A simple stakeholder analysis for CO2-EOR activities in the Slovak part of the Vienna Basin.
Stakeholder name
Type of organisation
Interests Influence
Ministry of Environment of the Slovak Republic
Governmental body - Ministry
Developing and implementing policies and regulations for Slovak in national environmental affairs. Administrative and supreme inspection authority for nature and landscape protection, waste management, water protection, EIA, geological works, GMOs, national environmental policy
Responsible for the provision of mining area and CO2 storage permits needed for CO2-EOR. Also responsible for the provision of subsidies to facilitate possible CCS projects
Ministry of Economy of the Slovak Republic
Governmental body - Ministry
Developing and implementing policies and regulations for Slovak enterprises, energy, agriculture and climate. Central body of state administration for power engineering and nuclear waste storage, heat and gas manufacture, exploitation of natural resources
Responsible for the provision of CO2 exploitation permits needed for CO2-EOR
Main Mining Authority
Government body – Independent regulator of mining activities
Providing and administrating of international and national mining activities and supervision of the Mining Act of the Slovak Republic
Will provide expertise and opinion to the Ministry of Environment and to Ministry of Economy regarding the provision of licenses for CO2-EOR operations.
NAFTA Private company – Oil and gas
Exploration, production and storage of oil & gas.
Potential CO2-EOR project developer or investor. Currently producing oil in multiple fields.
SLOVNAFT Private company – Oil refining plant
Production and storage of petroleum and chemicals.
CO2 emitter and potential investor
Duslo Private company – Chemical industry and fertilisers
Chemical production of fertilisers and other technical chemicals
CO2 emitter and potential investor
CEMMAC Private company – cement factory
Cement producer CO2 emitter and potential investor
CRH (Slovakia) Private company – cement factory
Cement producer CO2 emitter and potential investor
Považská cementáreň, Ladce
Private company – cement factory
Cement producer CO2 emitter and potential investor
SPP/Eustream Private company - gas transportation
Responsible for the transportation of natural gas in the Slovak Republic.
CO2 emitter and potential investor
Greenpeace Slovakia
Non-governmental organization (NGO)
Greenpeace is an independent and international environmental organization.
Holds a negative sentiment regarding the use of hydrocarbons and CCS.
ENOS D6.7 | Towards a strategic development plan for CO2-EOR in the Vienna Basin
49/ 93
4 EOR potential by CO2 injection in the Vienna Basin reservoirs
Introduction
This section outlines the methodology used and results of a screening of depleted and partially depleted
reservoirs in the Vienna Basin in view of investigate the potential for CO2 based EOR, and subsequent
CO2 storage. This assessment is essential to gain an initial picture of the favourability in economic terms,
of the additional oil that could be recovered through the injection of CO2. Furthermore, given that storing
CO2 in geological formations can have an economic value due to participation in the EU Emission
Trading Scheme, the total amount of CO2 that can be stored after the EOR operations can also be a
deciding factor in establishing a business case.
In addition to literature search and some reviews into use of analytical tools, the investigations were
primarily based on use of conceptual reservoir simulation models, using compositional, Equation of State
(EOS) based reservoir fluid descriptions.
Data collection
GBA, CGS and SGIDS collected the necessary data from the Austrian, Czech and Slovak oil fields
identified in Chapter 2. Where necessary, the fields were subdivided into several “basic units”,
corresponding to a part of the field (block or horizon) that can be characterized by a single set of
parameters needed for CO2-EOR suitability screening as described below. The threshold for inclusion of
a basic unit in the screening process was the amount of 100,000 Sm3 OOIP (original oil in place).
In total, input data were prepared for 74 basic units representing 40 oil fields, both producing and
abandoned, in all three national parts of the Vienna Basin (see Table 5). For the purposes of the study,
and to enable presentation of results under the data confidentiality constraints (see below), the oil fields
were grouped into geographical clusters. Three clusters were created in every country, each of them
including several oil fields. An overview map of the clusters is provided in Figure 31.
Table 5. Overview of input data provided for CO2-EOR screening.
Country No. of clusters No. of oil fields No. of basic units
Austria 3 16 24
Czech Republic 3 14 31
Slovakia 3 10 19
Two main data sources were used to collect the necessary input data: (i) national archives and geological databases maintained by the three project partners (GBA,
CGS and SGIDS) within their performance of the duties as national geological surveys, and
(ii) data and information provided by the operators of the fields, i.e. the national oil companies in
the three countries concerned – OMV, MND and NAFTA.
The data provided by the oil companies to the project were partly or fully in confidential regime. Due to
this, an agreement had to be reached concerning the level of detail to be revealed in the present report
which is a public deliverable of the ENOS project. According to this agreement, neither input data for the
screening process, nor individual screening results on the basic unit or field levels can be published. It
was confirmed that the results will be published on the aggregated cluster level, which in itself is
sufficient for the study purposes.

ENOS D6.7 | Towards a strategic development plan for CO2-EOR in the Vienna Basin
50/ 93
Figure 31. Map of clusters of oil fields in the Vienna Basin used for CO2-EOR screening.
The collection of information on potential CO2-EOR candidate reservoirs was done on basic unit level
through a questionnaire form (Table 6). In designing the questionnaire, care was taken of balancing the
need for data precision versus the field operators need or desire to protect confidential information. The
data were therefore asked for within specific intervals or ranges rather than more exact values. This
should ease the data confidentiality constraints as well as minimizing the workload for the partners and
field operators, while still providing enough information to enable a proper screening of the EOR
potential. For many of the reservoirs, particularly in the Czech and Slovak regions, more precise
information was nevertheless made available.

ENOS D6.7 | Towards a strategic development plan for CO2-EOR in the Vienna Basin
51/ 93
Table 6. Data collection form (example).
Only a minimum set of parameters was requested. Parameters for which the values, with sufficient
precision, could be derived from the values of other parameters, were omitted. Typical examples would
be reservoir temperature to be estimated from depth using a common temperature gradient, or in-situ
fluid viscosity determined through standard correlations with API gravity, solution GOR (Rs) and
temperature.
Reservoir information overview
Data from 74 reservoir basic units were collected, 24 in Austria, 31 in the Czech Republic and 19 in
Slovakia (see Table 5). The units span quite a wide range in reservoir characteristics such as original in-
place hydrocarbon volumes, reservoir quality, fluid properties, formation depth etc. Common to most of
them where on the other side that all (but one) are sandstone reservoirs, containing saturated oil, mostly
with gas cap, and were originally at hydrostatic or moderately over-pressured condition.
A common denominator for these reservoirs, in particular those in the Czech and Slovak regions, also
seems to be that the primary recovery has taken place through natural depletion, where the drive
mechanism has been natural aquifer support combined with gas cap expansion. Based on the indicated
primary recovery factors, ranging from 20 to 40 percent, it appears that this strategy has worked quite
well, despite the relatively thin oil zones found in many of these reservoirs.
A drawback of this primary recovery process might be that the reservoir pressure in some cases has
fallen below the supercritical level for CO2 (74 bar), which means that initial CO2 injection will be in gas-
phase condition. This might have negative consequences, both in handling of the injection process, as
well as by reducing the EOR efficiency. In such cases it might be necessary to increase the reservoir
pressure by water injection or wait for the aquifer to re-charge the reservoir prior to start-up of the CO2
flooding.
Recovery process
The CO2-EOR process foreseen for the candidate reservoirs in the Vienna Basin will primarily be a form
of solution gas drive. Due to the generally fairly shallow reservoirs and ditto pressure limitation, fully
miscible displacement cannot be expected. However, both the Equation-of-State (EOS) based
compositional simulations as well as the correlations for CO2 solubility in oil presented in (Emera &
Sarma, 2007), suggest that significant dissolution of CO2 into the oil phase, probably in the order of 50 to
70 % should be possible. This will lead to important swelling of the oil in place, as well as considerable
reduction in its viscosity.
Parameter
More presice
value if available
Rock type Sandstone Carbonate/Chalk
Depth (metres to water/oil contact) < 1000 1000 - 1500 1500 - 2500 > 2500 1560
Effective permeability (mD) Tight (< 1 md) Poor (1 - 30 md) Intermediate (30 - 300) Good (300 - 3000) Excellent (3000+) 360 - 860
Permeability variation (max/min) 10 (Homogenious) 100 1000 (Heterogenious)
Average anisothrophy (kv/kh) < 0.001 0.001 - 0.01 0.01 - 0.1 > 0.1
Faults/compartimentalization Heavy Intermediate Fairly open
Dip angle < 5 % 5 - 10 % > 10 %
Oil zone thickness (m) < 10 10 - 50 50 - 100 > 100 20
Oil quality (API gravity) 10 - 30 30 - 40 > 40 (volatile) 26
Solution GOR (Rs) (Sm3/Sm3) < 10 10 - 30 30 - 100 > 100 77
Initial pressure Hydrostatic Overpressured < 20 % Overpressured < 50 % Overpressured > 50 % 16
Depletion (from initial pressure - %) < 10 10 - 20 20 - 50 > 50 ca 40
Original oil in place (1000 Sm3) < 100 100 - 500 500 - 1000 1000 - 5000 > 5000 240
Current recovery factor (%) < 20 20 - 30 30 - 40 > 40 31
Reservoir oil condition Saturated Saturated w/gas cap Undersaturated
Parameter range selection
ENOS D6.7 | Towards a strategic development plan for CO2-EOR in the Vienna Basin
52/ 93
The initial simulation experiments convincingly indicate that the best EOR strategy will be to inject CO2 at
a low position relative to the oil zone, probably at the original WOC or even somewhat deeper to ensure
good dispersion of the CO2 and maximizing the contact with the remaining oil. The CO2 will thus have
maximum opportunity to percolate into and through the oil zone and enhance the mixing process.
Injecting CO2 below the oil zone should also be limiting further influx of water from the aquifer, thus
leading to reduced water cut and ditto water production. This effect is clearly demonstrated by the
simulation results.
Screening process
Analytical modelling (e.g. SWARD) and literature search were initially thought to be paramount in this
screening exercise. However, most of the examples presented in the literature or serving as data basis
for the analytical modelling are founded on the CO2-EOR experiences from the US and generally subject
to the following constraints:
The CO2 has come at a cost, both for purchase and transport (rather than being a potential
income through the ETS), thus encouraging optimization and minimization of CO2 usage.
As a consequence, CO2-EOR are normally performed through a WAG process, and not as a
clean, continuous CO2 injection.
Full miscibility has often been considered as a prerequisite for a successful CO2 flood.
Except for a few reservoirs which could attain full miscibility, none of these conditions apply for the
potential projects in the Vienna Basin. The EOR screening process has therefor primarily been based on
conceptual modelling, using an 8-component, Equation-of-State (EOS) compositional simulation
approach. Literature data have been consulted for qualification and verification purposes.
The base-case concept model is illustrated in Figure 32. The configuration was to some extent based on
the experience from modelling of the Lbr-1 reservoir (ENOS D4.5: Reservoir models of novel CO2-EOR
concepts at LBr-1). The grid cell size was set to 50 m by 50 m laterally with 2 m thickness. The model
was given 25 layers, resulting in a total formation thickness of 50 m. An alternative model with 25m by 25
m grid cells was established to handle cases with low permeability and/or heavy oil.
Porosity and permeability distribution were somewhat randomised in order to create some basic
heterogeneity. In addition, the permeability field could be tailored to meet criteria of heterogeneity in
terms of max/min value and Dykstra Parson coefficients.
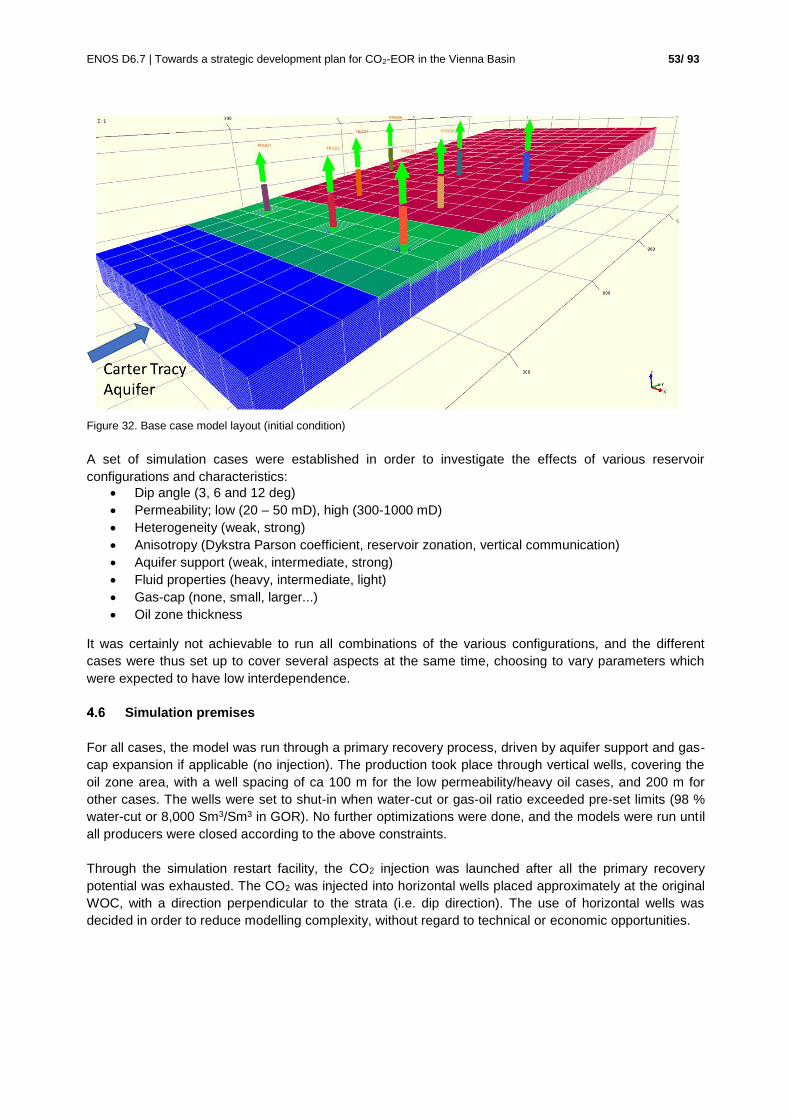
ENOS D6.7 | Towards a strategic development plan for CO2-EOR in the Vienna Basin
53/ 93
Figure 32. Base case model layout (initial condition)
A set of simulation cases were established in order to investigate the effects of various reservoir
configurations and characteristics:
Dip angle (3, 6 and 12 deg)
Permeability; low (20 – 50 mD), high (300-1000 mD)
Heterogeneity (weak, strong)
Anisotropy (Dykstra Parson coefficient, reservoir zonation, vertical communication)
Aquifer support (weak, intermediate, strong)
Fluid properties (heavy, intermediate, light)
Gas-cap (none, small, larger...)
Oil zone thickness
It was certainly not achievable to run all combinations of the various configurations, and the different
cases were thus set up to cover several aspects at the same time, choosing to vary parameters which
were expected to have low interdependence.
Simulation premises
For all cases, the model was run through a primary recovery process, driven by aquifer support and gas-
cap expansion if applicable (no injection). The production took place through vertical wells, covering the
oil zone area, with a well spacing of ca 100 m for the low permeability/heavy oil cases, and 200 m for
other cases. The wells were set to shut-in when water-cut or gas-oil ratio exceeded pre-set limits (98 %
water-cut or 8,000 Sm3/Sm3 in GOR). No further optimizations were done, and the models were run until
all producers were closed according to the above constraints.
Through the simulation restart facility, the CO2 injection was launched after all the primary recovery
potential was exhausted. The CO2 was injected into horizontal wells placed approximately at the original
WOC, with a direction perpendicular to the strata (i.e. dip direction). The use of horizontal wells was
decided in order to reduce modelling complexity, without regard to technical or economic opportunities.

ENOS D6.7 | Towards a strategic development plan for CO2-EOR in the Vienna Basin
54/ 93
Figure 33. Reservoir model, prior to CO2 injection.
Figure 34 illustrates a typical model output recovery profile, combining the primary depletion and the
CO2-EOR periods.
Figure 34. Example recovery profiles exhibited by the concept models.
EOR scoring
Each reservoir unit was compared with relevant concept models and valuated with respect to some key
reservoir parameters, which based on the ensemble of simulation results appeared to be the most
influential regarding CO2-EOR efficiency. These were dip angle, gas cap, anisotropy, oil zone thickness,
API gravity, original oil in place (OOIP), faulting, depth and potential for miscibility. Each parameter was

ENOS D6.7 | Towards a strategic development plan for CO2-EOR in the Vienna Basin
55/ 93
given a whole number score value, ranging from -3 to +2, dependent on how it was considered that the
parameter value would promote or impede the EOR process.
The scores for the individual parameters were summed-up and normalized (0 – 1) based on the
maximum and minimum value for the total score. Further based on the simulation results, literature
search (in particular (Azzolina & et al., 37 (2015)) see Figure 35), and general concern with respect to
“safety factor” a potential incremental recovery factor span was decided, ranging from 4% to 21% for the
Czech and Slovak reservoirs, and 5% to 15% for the Austrian fields (difference mainly due to lesser
precision and variation in the Austrian reservoir data). The EOR factor for each reservoir was then
decided based on the normalized score value (e.g. 0 = 4%, 1 = 21%). These factors are typically within
the range reported in literature (Azzolina & et al., 37 (2015)), (Perera & et al., 2016), (U.S. Geological
Survey, 2017).
Figure 35. Incremental oil recovery from CO2-WAG flooding (exerted from Azzolina & et al. 2015).
CO2 storage
Estimating the CO2 storage or retention factor (fraction of the injected CO2 that will remain in the
reservoir) was trickier, as there are more, often unknown factors involved, such as aquifer size and
strength, gas-cap volume, and the overall pressure distribution before and during the injection. There is
also a question whether the amount of net CO2 injection should be subject to reservoir pressure
constraints only, or if other considerations, such as potential spill points should be taken into account.
The CO2 storage results presented here are again based on the conceptual simulations, however
through a less rigorous approach than those for the EOR estimations. The ensemble of modelling results
was evaluated in view of which reservoir and/or fluid characteristics could govern the CO2 storage
potential, and the capacity of each reservoir was judged according to these characteristics. The results
are presented in terms of tonnes of CO2 retained per Sm3 of Original Oil in Place (OOIP). The OOIP may
not be the best scaling parameter for CO2 storage capacity, but for the current screening process, it is
the only volumetric parameter available.
For many cases, the indicated storage quantities far exceed the original hydrocarbon pore volume
(HCPV) of the original oil zone. This implies that a lot of CO2 would be located either in the original gas-

ENOS D6.7 | Towards a strategic development plan for CO2-EOR in the Vienna Basin
56/ 93
cap volumes (as a plume on top of the oil zone) and/or in the underlaying water zone, in addition to the
CO2 in solution with the remaining oil.
EOR production profiles
The EOR production profiles will naturally vary from reservoir to reservoir, based on actual geology,
petrophysical properties, fluid properties and other qualities provided by nature, as well as well spacing,
production operations and other man-made constraints. Trying to generate individual profiles for the
various reservoirs can thus not be justified and would anyhow have limited credibility and value.
However, based on modelling results, a set of five generic profiles were established (Figure 37). These
take into account dip-angle, reservoir quality, fluid quality, heterogeneity (Dykstra Parson coefficient) and
gas-cap (with or without). The profiles have the general characteristics of an early period of peak or
plateau production followed by later decline, but the length of the plateau and shape of decline may vary.
CO2 injection and storage profiles
The CO2 injection has two important aspects; the total injection rates, which includes imported as well as
re-circulated CO2, and the storage or retention rate, which over time should match the import. The total
injection may also contain some hydrocarbon gas, either free gas coned in from the gas cap, and/or
dissolved gas released from the produced oil. The overall modelling results indicate the HC gas volumes
will only constitute a minor part, i.e. less than 3 % of the re-circulation gas handling.
The total gas injection rate will to a great extent be constrained by CO2 availability (i.e. import), and
process, pumping and well capacities, i.e. parameters under human control. Based on review of various
modelling results, it seems like the total accumulated injection including re-circulation varies in the range
of 3 to 4 tons of CO2 per Sm3 of OOIP in order to realize the EOR potential. It also appears that the
ultimate EOR is not strongly affected by the injection rate, i.e. the recovery process may be faster or
slower without hampering the EOR effect (even though a slower process may be slightly more efficient
(see Figure 34 and Figure 36). It is therefore suggested to use 3.5 tons of CO2 per Sm3 of OOIP as a
standard value for gross CO2 injected for all prospects, to be distributed linearly as a yearly amount over
the anticipated EOR period – maybe with some build-up during the first year or two and some tapering
towards the end.
Establishing the CO2 storage profiles, i.e. import quantities, has been more challenging as these will be
mostly governed by the reservoir and fluid characteristics. Typical for these profiles seems however to be
an initial period of high net injection, before CO2 break-through, followed by a period dominated by CO2
re-circulation and more moderate net storage. Toward the end there could be a slight increase as the
producers start closing for economic reasons and less CO2 is returned from the reservoir, until the
injection becomes constrained by reservoir pressure build-up. This late increase may not be achievable if
a spill point constraint should apply in which case the rise in reservoir pressure probably should be
limited by the reservoirs initial pressure.

ENOS D6.7 | Towards a strategic development plan for CO2-EOR in the Vienna Basin
57/ 93
Figure 36. EOR efficiency vs CO2 injection rate.
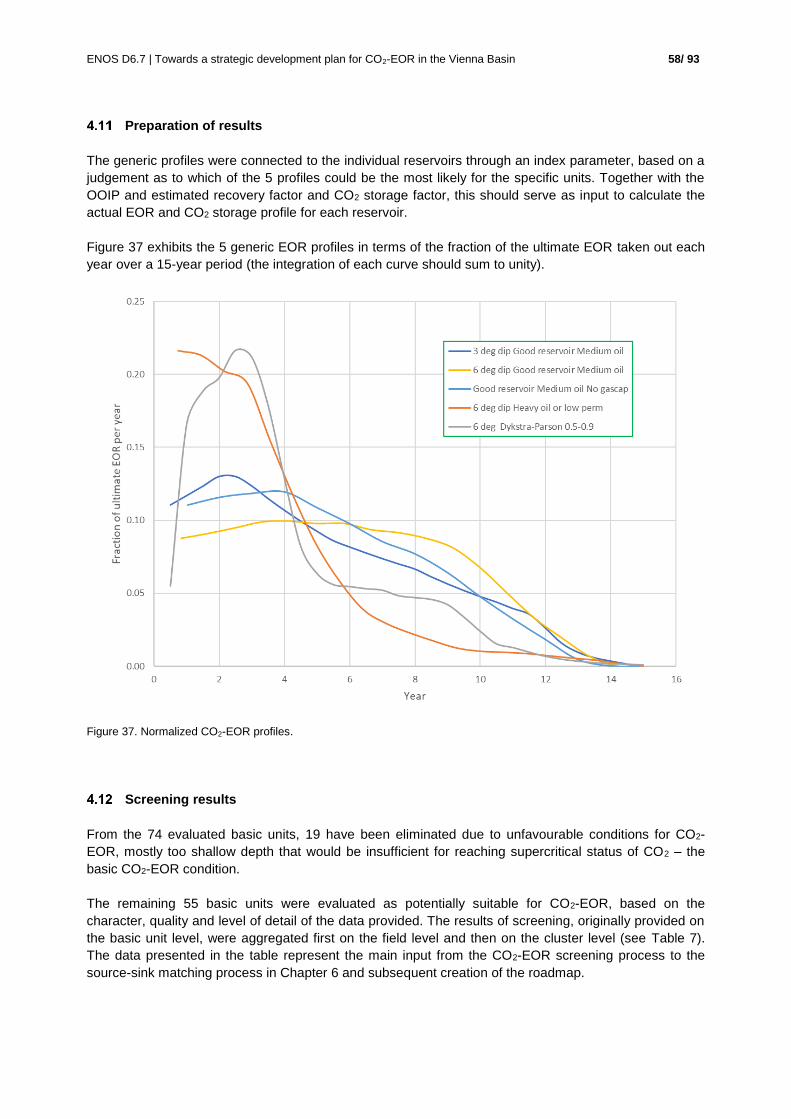
ENOS D6.7 | Towards a strategic development plan for CO2-EOR in the Vienna Basin
58/ 93
Preparation of results
The generic profiles were connected to the individual reservoirs through an index parameter, based on a
judgement as to which of the 5 profiles could be the most likely for the specific units. Together with the
OOIP and estimated recovery factor and CO2 storage factor, this should serve as input to calculate the
actual EOR and CO2 storage profile for each reservoir.
Figure 37 exhibits the 5 generic EOR profiles in terms of the fraction of the ultimate EOR taken out each
year over a 15-year period (the integration of each curve should sum to unity).
Figure 37. Normalized CO2-EOR profiles.
Screening results
From the 74 evaluated basic units, 19 have been eliminated due to unfavourable conditions for CO2-
EOR, mostly too shallow depth that would be insufficient for reaching supercritical status of CO2 – the
basic CO2-EOR condition.
The remaining 55 basic units were evaluated as potentially suitable for CO2-EOR, based on the
character, quality and level of detail of the data provided. The results of screening, originally provided on
the basic unit level, were aggregated first on the field level and then on the cluster level (see Table 7).
The data presented in the table represent the main input from the CO2-EOR screening process to the
source-sink matching process in Chapter 6 and subsequent creation of the roadmap.

ENOS D6.7 | Towards a strategic development plan for CO2-EOR in the Vienna Basin
59/ 93
Table 7. Results of CO2-EOR screening.
Cluster Original oil
in place Oil produced
so far
Incremental oil production by
CO2-EOR
CO2 used for EOR and stored
thousand Sm3 thousand Sm3 thousand Sm3 thousand tonnes
AUT I. 71 000 25 000 6 600 82 000
AUT II. 212 800 85 000 22 400 22 000
AUT III. 14 400 2 500 1 600 17 000
Total Austria 298 200 112 500 18 700 121 000
CZ I. 150 50 10 100
CZ II. 2 440 790 210 2 590
CZ III. 8 700 1 810 1 430 8 550
Total Czech Republic 11 290 2 650 1 650 11 240
SK I. 2 770 530 250 1 720
SK II. 1 820 750 240 2 060
SK III. 2 160 360 310 2 270
Total Slovakia 6 750 1 640 800 6 050
Grand total Vienna Basin 316 240 116 790 21 150 138 290
Table 7 only includes volumes for those units which have been considered applicable for CO2-EOR.
The screening results show a theoretical potential of 21 million Sm3 (130 million barrels) of incremental
oil that can be recovered in the Vienna Basin using CO2-EOR. Using the current oil price of 40 USD/bbl
this represents (if produced) a gross value of 5 200 million USD. The amount of CO2 that would be
needed to perform the related CO2-EOR operations and thereafter stored in the depleted fields is
estimated to nearly 140 million tonnes.
It should be strongly emphasized though that these results are based on a screening study, with limited
information about individual fields and reservoirs, using conceptual modelling techniques with few
possibility to adapt to actual reservoir sizes, structure, faulting and other factors important to the recovery
process. It should also be reiterated that the reservoir units included in the study, with few exceptions,
may not attain fully miscible conditions during the CO2 flooding process due to maximum pressure
constraints. The results will therefore be hampered with significant uncertainty. The miscibility issue is
further elaborated in Chapter 7 (Technical challenges).

ENOS D6.7 | Towards a strategic development plan for CO2-EOR in the Vienna Basin
60/ 93
5 Analysis of CO2 point sources in the region
Potential suitable CO2 point sources in the Vienna Basin
Of course, CO2-EOR cannot happen in the absence of a reliable and affordable CO2 supply. In order to
provide an initial insight into potential suitable anthropogenic sources of CO2 in the Vienna Basin, a
simple analysis of CO2 point sources in the region was conducted.
The analysis of point sources identified 69 CO2 emitters in a range of up to 70 km away from the closest
potential storage field. All emission data were extracted from the climate action ETS (Emissions Trading
System) database and the E-PRTR (European Pollutant Release and Transfer Register) respectively.
The cumulative CO2 emission of all facilities reached 16.6 Mt CO2 in 2017. The assessment of the
emissions in Figure 38 shows that the oil & gas industry, the cement industry and energy suppliers are
the greatest emitters, being responsible for 80 % of the emissions in the survey area.
Short-listing CO2 sources for source-sink matching
In order to select the most favourable prospective CO2 emitters to include for the source-sink matching
exercise (see Chapter 6), the long list of 69 emitters were filtered using a number of criteria. These filters
are explained below:
Figure 38. Industrial emissions in the Vienna Basin by sector (in 2017).

ENOS D6.7 | Towards a strategic development plan for CO2-EOR in the Vienna Basin
61/ 93
Total annual CO2 emissions: an initial filtering was conducted to remove smaller emitters,
sources which have annual emissions of less than 30 kt CO2. Installations with annual emissions
below this threshold were not considered favourable for large scale CCS projects.
Estimated cost of CO2 capture: The cost of capturing CO2 from energy and industrial
installations is largely dependent on the composition of the flue gas. Some industrial processes,
such as hydrogen production (for use in refineries or for ammonia synthesis), bioethanol
production or natural gas processing, result in a very concentrated ‘offgas’ of CO2. The highly
concentrated stream of CO2 can be diverted, treated, and compressed if necessary, requiring
relatively limited capital and operational expenditures. Many of the existing CCS projects
operating globally, such as Sleipner and Snohvit projects in Norway, and the Quest CCS Project
in Alberta, Canada, involve CO2 capture from such ‘high-purity’ sources.
Conversely, CO2 capture from gas or coal-fired power plants, cement kilns, or refinery boilers
results in flue gases with a relatively low concentration of CO2, often between 8-12% (vol.). In
order to capture the CO2, large investments are needed in post-combustion capture systems
which include large towers where CO2 is ‘stripped’ from the flue gas using chemical solvents.
These systems also incur significant energy penalties as the solvent needs to be heated to
release the CO2 and be regenerated.
Figure 39. Ranges of estimated cost of CO2 capture from different industrial processes. ‘High purity’ includes natural gas
processing, hydrogen production and ethylene oxide production (IEA 2011).
In light of this, all potential ‘high purity’ sources that met the quantity threshold have been
included in the short-list of emitters taken to the source-sink matching phase.
Alternative options to reduce emissions other than CCS: For many industrial processes,
emitting CO2 is largely an unavoidable part of the industrial process. Particularly for cement, CO2
is emitted both for heating the kiln, but also intrinsically during the thermal decomposition of
limestone to cement clinker. Because of this, a number of cement plants are included in the short
list, even though the cost of capturing CO2 is likely to be quite high. This justification is also
applicable to refineries where CO2 is released during the hydrocarbon cracking processes.
Inclusion in the EU ETS: All combustion installations in the EU with a capacity above 20 MW
are included in the EU Emissions Trading Scheme. Only waste incinerators above this capacity
are exempt. This means that for many power and industrial installations, emitting CO2 can have
direct financial consequences. In general, emission allowances will need to be purchased for
each tonne of CO2 emitted. The price for emission allowances is currently €25 (March 11th,
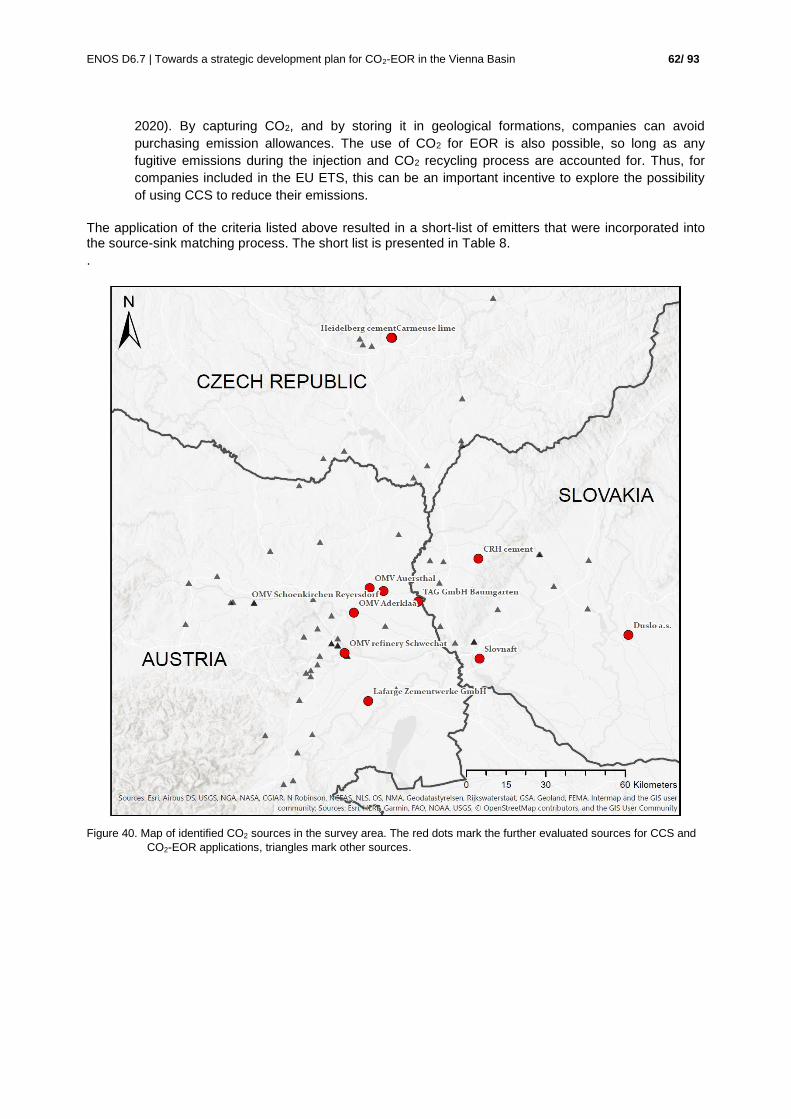
ENOS D6.7 | Towards a strategic development plan for CO2-EOR in the Vienna Basin
62/ 93
2020). By capturing CO2, and by storing it in geological formations, companies can avoid
purchasing emission allowances. The use of CO2 for EOR is also possible, so long as any
fugitive emissions during the injection and CO2 recycling process are accounted for. Thus, for
companies included in the EU ETS, this can be an important incentive to explore the possibility
of using CCS to reduce their emissions.
The application of the criteria listed above resulted in a short-list of emitters that were incorporated into the source-sink matching process. The short list is presented in Table 8.
.
Figure 40. Map of identified CO2 sources in the survey area. The red dots mark the further evaluated sources for CCS and
CO2-EOR applications, triangles mark other sources.

ENOS D6.7 | Towards a strategic development plan for CO2-EOR in the Vienna Basin
63/ 93
Table 8. Best suitable emitters for CCS application in the Vienna Basin. CO2 emissions are extracted from ETS or E-PRTR
database and given in tonnes. See next figure for the location of the facilities.
Facility Source characteristics CO2 2017 CO2 2018
OMV refinery oil and gas refinery
hydrogen: 30,000 m3/h 2,740,000 2,824,369
Au
str
ia
OMV Aderklaa
gas production from the gas fields
Schönkirchen (sour gas) and Höflein.
Emissions from combustion for
compressors
190,000
OMV Auersthal oil and gas extraction station. Emissions
from combustion for compressors 78,119 71,219
OMV Schönkirchen
Reyersdorf
gas storage (1.8 bn. m3), Emissions from
combustion for compressors 38,879 37,485
Lafarge cement factory 596,000 601,756
Trans Austria Gasleitung gas distribution centre 185,000 189,000
Slovnaft
oil and gas refinery, petrochemical plant,
heat generation
hydrogen: 37,000 m3/h
emission: 50% from refinery
30% from heating plant
20% for petrochemical usage
2,198,678 2,209234
Slo
vakia
Duslo a. s. fertilizer production
ammonia: 433,000 m3/h 1,054,051 1,241,724
CRH (Rohožník) cement factory 927,494 875,541
Carmeuse lime works
Mokrá
(same location as
HeidelbergCement)
limestone mining 119,000 141,700
Cze
ch R
ep
ub
lic
HeidelbergCement group
plant Mokrá cement factory 657,000 760,000
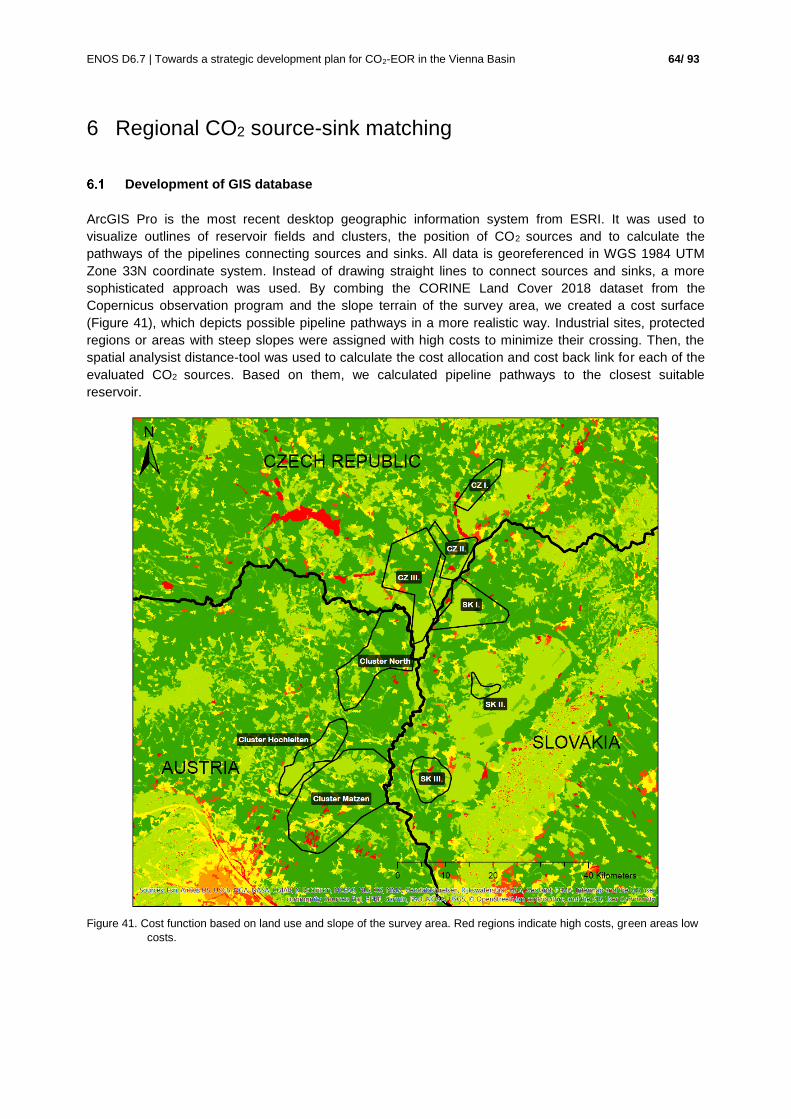
ENOS D6.7 | Towards a strategic development plan for CO2-EOR in the Vienna Basin
64/ 93
6 Regional CO2 source-sink matching
Development of GIS database
ArcGIS Pro is the most recent desktop geographic information system from ESRI. It was used to
visualize outlines of reservoir fields and clusters, the position of CO2 sources and to calculate the
pathways of the pipelines connecting sources and sinks. All data is georeferenced in WGS 1984 UTM
Zone 33N coordinate system. Instead of drawing straight lines to connect sources and sinks, a more
sophisticated approach was used. By combing the CORINE Land Cover 2018 dataset from the
Copernicus observation program and the slope terrain of the survey area, we created a cost surface
(Figure 41), which depicts possible pipeline pathways in a more realistic way. Industrial sites, protected
regions or areas with steep slopes were assigned with high costs to minimize their crossing. Then, the
spatial analysist distance-tool was used to calculate the cost allocation and cost back link for each of the
evaluated CO2 sources. Based on them, we calculated pipeline pathways to the closest suitable
reservoir.
Figure 41. Cost function based on land use and slope of the survey area. Red regions indicate high costs, green areas low
costs.
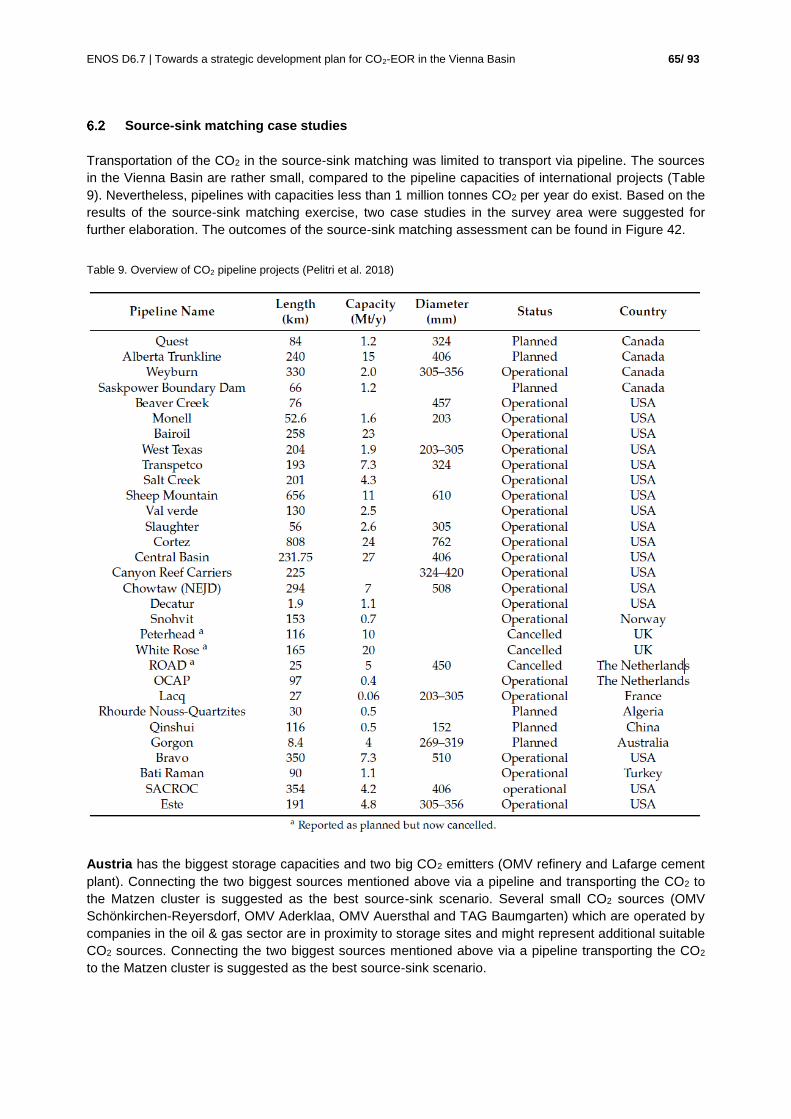
ENOS D6.7 | Towards a strategic development plan for CO2-EOR in the Vienna Basin
65/ 93
Source-sink matching case studies
Transportation of the CO2 in the source-sink matching was limited to transport via pipeline. The sources
in the Vienna Basin are rather small, compared to the pipeline capacities of international projects (Table
9). Nevertheless, pipelines with capacities less than 1 million tonnes CO2 per year do exist. Based on the
results of the source-sink matching exercise, two case studies in the survey area were suggested for
further elaboration. The outcomes of the source-sink matching assessment can be found in Figure 42.
Table 9. Overview of CO2 pipeline projects (Pelitri et al. 2018)
Austria has the biggest storage capacities and two big CO2 emitters (OMV refinery and Lafarge cement
plant). Connecting the two biggest sources mentioned above via a pipeline and transporting the CO2 to
the Matzen cluster is suggested as the best source-sink scenario. Several small CO2 sources (OMV
Schönkirchen-Reyersdorf, OMV Aderklaa, OMV Auersthal and TAG Baumgarten) which are operated by
companies in the oil & gas sector are in proximity to storage sites and might represent additional suitable
CO2 sources. Connecting the two biggest sources mentioned above via a pipeline transporting the CO2
to the Matzen cluster is suggested as the best source-sink scenario.

ENOS D6.7 | Towards a strategic development plan for CO2-EOR in the Vienna Basin
66/ 93
In terms of sources and sinks suitability, Austria has the best prerequisites out of the three Vienna Basin
countries. Unfortunately, data uncertainty regarding storage capacity and incremental oil production is
the biggest for this country.
Slovakia has three large CO2 sources in the survey area; e.g., the Duslo fertilizer plant has a very pure
CO2 emission stream but is quite far away from suitable storage sites. The oil reservoirs in Slovakia have
low CO2 storage capacities and are therefore not very suitable for CCUS application. In addition, the
potential for oil production from EOR operation seems to be minor. Nevertheless, the Slovnaft oil refinery
in Bratislava is a big and steady CO2 emitter. The refinery emissions can only be stored in a foreign
reservoir and therefore we suggest transportation to Austria. It should be noted, that the legal framework
of CO2 export or import for CCS application into foreign countries is unknown and difficult to be
estimated.
The Czech Republic has one big emission source in the survey area – the Mokrá cement plant
belonging to the HeidelbergCement Group. Its CO2 can be captured and transported via pipeline to the
oil fields of the Czech CZ III cluster. With around 8 million tonnes storage capacity, it is the only
sufficiently large storage cluster in this country. In addition, the Carmeuse lime works are located next to
the cement plant and their CO2 sources could be possibly combined with those of the cement plant to
increase the size of the CCUS project and support thus the economy-of-scale effect.
Figure 42. Results of source sink matching showing the locations of the selected sources (the Czech HeidelbergCement
plant, the OMV refinery and the Lafarge cement plant in Austria), as well as the oil fields clusters. Green lines
depict the calculated indicative pipelines based on considerations explained in Chapter 6.1. Note that pathways
might differ for the case study No. 2 as existing pipeline networks were not evaluated in Chapter 6.1.
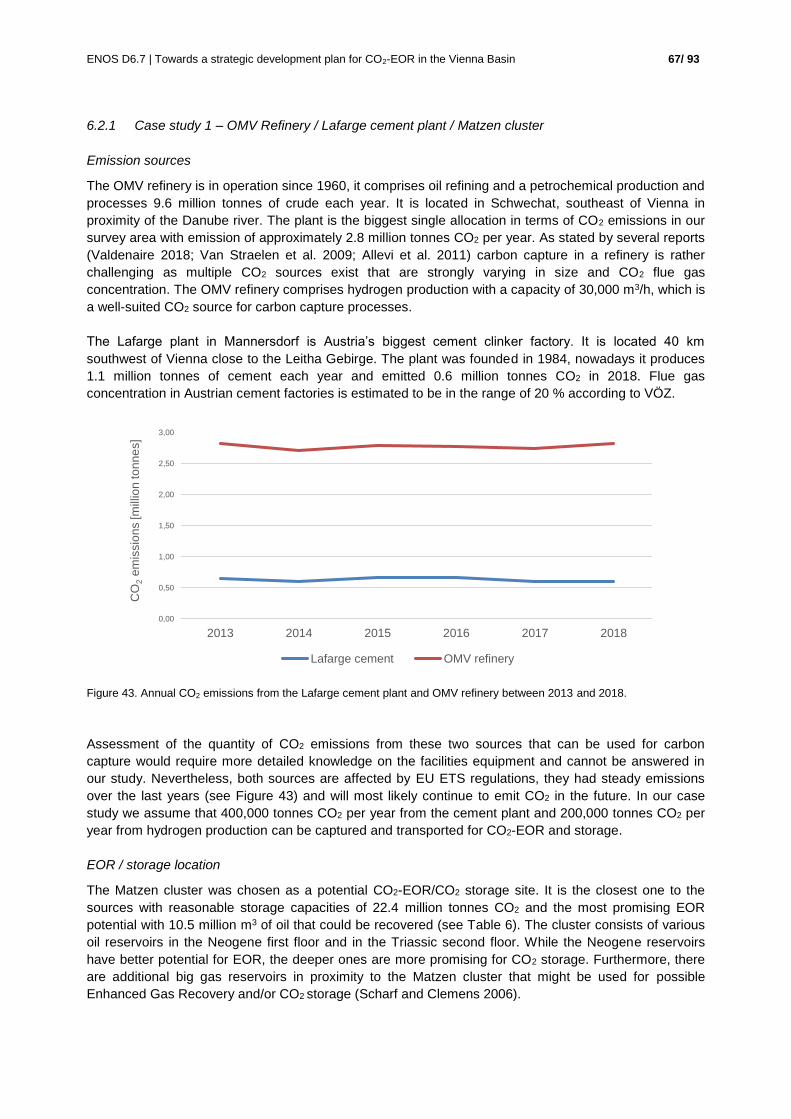
ENOS D6.7 | Towards a strategic development plan for CO2-EOR in the Vienna Basin
67/ 93
6.2.1 Case study 1 – OMV Refinery / Lafarge cement plant / Matzen cluster
Emission sources
The OMV refinery is in operation since 1960, it comprises oil refining and a petrochemical production and
processes 9.6 million tonnes of crude each year. It is located in Schwechat, southeast of Vienna in
proximity of the Danube river. The plant is the biggest single allocation in terms of CO2 emissions in our
survey area with emission of approximately 2.8 million tonnes CO2 per year. As stated by several reports
(Valdenaire 2018; Van Straelen et al. 2009; Allevi et al. 2011) carbon capture in a refinery is rather
challenging as multiple CO2 sources exist that are strongly varying in size and CO2 flue gas
concentration. The OMV refinery comprises hydrogen production with a capacity of 30,000 m3/h, which is
a well-suited CO2 source for carbon capture processes.
The Lafarge plant in Mannersdorf is Austria’s biggest cement clinker factory. It is located 40 km
southwest of Vienna close to the Leitha Gebirge. The plant was founded in 1984, nowadays it produces
1.1 million tonnes of cement each year and emitted 0.6 million tonnes CO2 in 2018. Flue gas
concentration in Austrian cement factories is estimated to be in the range of 20 % according to VÖZ.
Figure 43. Annual CO2 emissions from the Lafarge cement plant and OMV refinery between 2013 and 2018.
Assessment of the quantity of CO2 emissions from these two sources that can be used for carbon
capture would require more detailed knowledge on the facilities equipment and cannot be answered in
our study. Nevertheless, both sources are affected by EU ETS regulations, they had steady emissions
over the last years (see Figure 43) and will most likely continue to emit CO2 in the future. In our case
study we assume that 400,000 tonnes CO2 per year from the cement plant and 200,000 tonnes CO2 per
year from hydrogen production can be captured and transported for CO2-EOR and storage.
EOR / storage location
The Matzen cluster was chosen as a potential CO2-EOR/CO2 storage site. It is the closest one to the
sources with reasonable storage capacities of 22.4 million tonnes CO2 and the most promising EOR
potential with 10.5 million m3 of oil that could be recovered (see Table 6). The cluster consists of various
oil reservoirs in the Neogene first floor and in the Triassic second floor. While the Neogene reservoirs
have better potential for EOR, the deeper ones are more promising for CO2 storage. Furthermore, there
are additional big gas reservoirs in proximity to the Matzen cluster that might be used for possible
Enhanced Gas Recovery and/or CO2 storage (Scharf and Clemens 2006).
0,00
0,50
1,00
1,50
2,00
2,50
3,00
2013 2014 2015 2016 2017 2018
CO
2e
mis
sio
ns [m
illio
n to
nn
es]
Lafarge cement OMV refinery

ENOS D6.7 | Towards a strategic development plan for CO2-EOR in the Vienna Basin
68/ 93
Transport
Generally, various modes of CO2 transport means, e.g. truck load, rail cargo, ship or pipeline or a
combination of these, are possible. However, according to the European Directive 2003/87/EC,
installations that are planning to store CO2 in geological media and are covered by the EU ETS don’t
need to surrender CO2 credits for carbon capture only in the case that the transport is realized via
pipelines. This law might be changed in the future as currently developed CCS projects in Europe plan to
transport their emissions by ships. Nevertheless, transport via trucks puts additional burden on the local
infrastructure. We therefore suggest pipeline transportation for this case study. A pipeline from the
cement factory to the refinery would be 21.8 km long (Figure 42). The additional pipeline from the
refinery to one of the oil reservoirs in the Matzen cluster would need to have a length of about 25.3 km.
The pipeline pathway is flat without any major crossing of big cities or additional industrial sites except for
the crossing of the Danube river between the refinery and the storage site.
Economic evaluation
A detailed economic evaluation for this case study would require further research and will not be
presented in this project. Nevertheless, the following general economic considerations can be made:
Capture costs for cement plants by traditional chemical absorption are in the order of 36$ - 101$
per tonne CO2 (IEAGHG 2018). Capture costs for refineries can strongly differ as shown in
figure 9. The costs for retrofitting CO2 capture in refineries lie between $ 160-210 per tonne CO2
(Valdenaire 2018). However, using CO2 from hydrogen production will result in much smaller
costs in the order of $ 35-45 per tonne CO2.
Pipeline transportation requires high investment in the beginning, but often outruns other
transport possibilities when accounting for longer time periods (ZEP 2011, Gao et al. 2018). The
surrounding area is non-challenging for pipeline construction. The capacity of the CO2 pipeline
would be rather small compared to international projects. According to our consideration on the
sources, an 8" diameter pipeline would have sufficient capacities for transportation in both
pipeline sections. The cost for such pipeline would be in the range of $ 5-10 per tonne CO2
(IEAGHG 2013; McCoy and Rubin 2007; Gao et al. 2018; ZEP 2011), considering a lifespan of
20 years.
Storage costs will be in the range of € 1-10 per tonne CO2 (ZEP 2011)
The calculated recoverable oil corresponds to 66 million barrels. However, revenues from EOR
application need further evaluation as existing infrastructure needs to be treated and abandoned
wells need to be monitored for CO2 leakage.
An overview of this case study is provided in Table 10. Further CO2 sources could be added to increase
efficiency and reduce transportation costs. A suitable emitter would be the Aderklaa processing plant
located next to the proposed pipeline (Figure 42). Several newspaper articles2 published in the last
couple of months mention the interest of OMV in storing CO2 from the processing plant into the depleted
Aderklaa gas reservoir next to the Matzen cluster. Additionally, emission from the Slovakian Slovnaft
refinery in Bratislava could be used to create a CO2 source cluster. Although the refinery is a bit smaller
compared to OMV, it also comprises hydrogen production and hence cheap CO2 source. As reservoirs in
Slovakia are too small for storage application, transportation and storage abroad could be one way of
meeting the refinery ETS obligations. Nevertheless, an additional 48 km pipeline would be needed to
build.
2 https://www.energate-messenger.ch/news/200261/omv-treibt-ccs-projekt-im-marchfeld-voran
https://www.derstandard.at/story/2000110803720/omv-will-co2-unter-die-erde-befoerdern

ENOS D6.7 | Towards a strategic development plan for CO2-EOR in the Vienna Basin
69/ 93
Table 10. Overview of the Case Study - Lafarge cement plant / OMV refinery / Cluster Matzen.
General details
Case study name: Lafarge cement plant – OMV refinery – Cluster
Matzen
Source details
Name of source Lafarge cement plant
OMV refinery
Country AUT
Type of industry Cement industry
Oil refinery (with hydrogen production)
Total CO2 emissions (Mt /year) 3.4
Proposed CO2 capture rate (Mt/year) 0.4 – cement plant
0.2 - refinery
High or low purity CO2 20% concentration in flue gas from cement industry
>50% for hydrogen production (high purity)
ETS applicable (yes/no) yes
Sink details
Cluster name Matzen
Additional incremental oil production
(thousand Sm3)
10,500
Total CO2-EOR/storage potential (Mt) 22.4
Transport details
Distance between source and sink 21.8 km cement plant - refinery
25.3 km refinery – oil reservoir
Geographical challenges Crossing of the Danube (~500 m)
6.2.2 Case study 2 – Mokrá cement plant / cluster CZ III
Emission source
The cement plant Mokrá (part of the company Českomoravský cement, HeidelbergCement Group
member) is the biggest cement producer in the Czech Republic. In 2018, the annual cement production
was estimated at 1.1 million tonnes while the total Czech cement production of all 5 active cement plants
was reported to be 4.4 million tonnes3.
The cement plant Mokrá is located near Brno, in the eastern part of the Czech Republic. From geological
point of view, this plant is located just on the border between the two main European geological units -
Bohemian Massif and Carpathians. The cement plant was established in 1967 and the cement
production started in 1969. As the basic raw material, the limestones (Middle Devonian age) from a
nearby (1.5 km) quarry are used for clinker and subsequent cement production; the limestones
consumption was about 1.4 million tonnes in 2018. The average fuel composition, used in the rotary kiln,
is shown in Table 11.
.
3Source: Svaz výrobců cementu ČR - Cement Producers Union of the Czech Republic, https://www.svcement.cz/ (in Czech
only)

ENOS D6.7 | Towards a strategic development plan for CO2-EOR in the Vienna Basin
70/ 93
Table 11. Fuels used for clinker production in the rotary kiln3.
Hard coal Solid alternative fuels (waste
residues) Biomass Used tyres
30 % 38 % 24 % 8 %
The average ratio between the produced amount of cement and the emitted amount of CO2 depends on
the type of reported emission – either excluding biomass as reported by European Union Transaction
Log4 or including biomass as reported by the Czech Integrated Register of Polluters (IRZ)5. If CO2
emissions are reported including the combusted biomass, about 0.67 tonnes CO2 is emitted per tonne of
produced cement; in case of emissions excluding biomass, about 0.63 tonnes CO2 is emitted per tonne
of produced cement. About 65 - 70 % of the CO2 emissions are “process -related”, i.e. from
decomposition of the carbonate mineral (limestone), and the rest is from fuel combustion. The CO2
concentration in the flue gas is estimated at 20 %6. This number fits the literature values of 14 - 33 %
(e.g. Bosoaga et al. 2009). The annual CO2 emissions and CO2 emission allowances of the plant are
shown in Table 12.
Table 12. Annual CO2 emissions and allowances in allocation; emissions excluding biomass according to the European
Union Transaction Log1; emissions including biomass according to the Integrated Register of Polluters2.
Allowances in allocation CO2 emissions excluding
biomass CO2 emissions including
biomass
tonnes tonnes tonnes
2010 657,200 593,592 660,091
2011 657,200 636,093 704,258
2012 657,200 551,237 603,207
2013 644,075 453,821 516,076
2014 632,888 511,690 582,374
2015 621,569 558,389 605,459
2016 610,133 626,166 679,837
2017 598,573 610,490 656,884
2018 586,901 708,533 759,893
The management of the Mokrá cement plant is very interested in potential CO2 capture and storage/use.
As a member of the HeidelbergCement Group, the management follows the study and research on CCS
application for the Norwegian cement plant in Brevik, which shows many similarities with the Mokrá plant
from the CO2 emissions point of view. The Brevik plant belongs to the Norcem company, which is also a
member of the HeidelbergCement Group. Norcem and Heidelberg have a vision of achieving zero
emissions from concrete production by 2030, seen from a life cycle perspective7. This vision will be
realised through the development of new types of cement, increasing the percentage of alternative fuels
and deployment of carbon capture in cement production. An essential element in the planned carbon
4https://ec.europa.eu/clima/ets/napMgt.do 5https://portal.cenia.cz/irz/ 6Information kindly provided by Českomoravský cement staff 7https://www.norcem.no/en/CCS
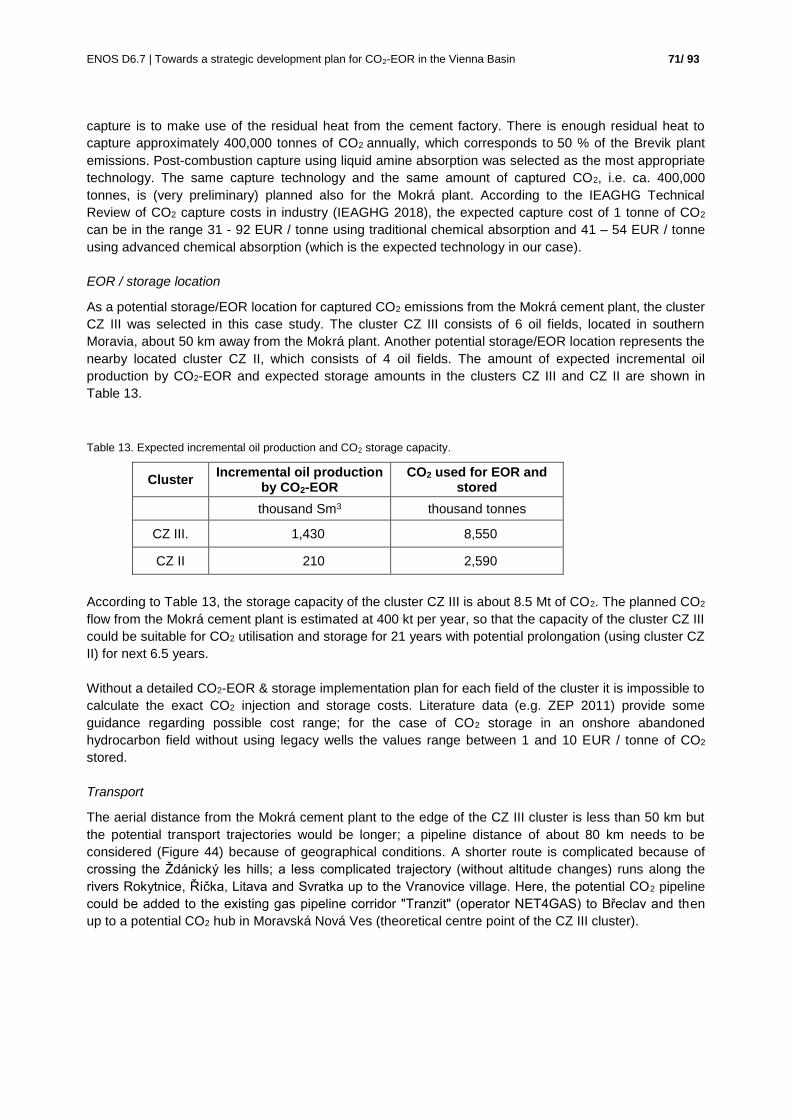
ENOS D6.7 | Towards a strategic development plan for CO2-EOR in the Vienna Basin
71/ 93
capture is to make use of the residual heat from the cement factory. There is enough residual heat to
capture approximately 400,000 tonnes of CO2 annually, which corresponds to 50 % of the Brevik plant
emissions. Post-combustion capture using liquid amine absorption was selected as the most appropriate
technology. The same capture technology and the same amount of captured CO2, i.e. ca. 400,000
tonnes, is (very preliminary) planned also for the Mokrá plant. According to the IEAGHG Technical
Review of CO2 capture costs in industry (IEAGHG 2018), the expected capture cost of 1 tonne of CO2
can be in the range 31 - 92 EUR / tonne using traditional chemical absorption and 41 – 54 EUR / tonne
using advanced chemical absorption (which is the expected technology in our case).
EOR / storage location
As a potential storage/EOR location for captured CO2 emissions from the Mokrá cement plant, the cluster
CZ III was selected in this case study. The cluster CZ III consists of 6 oil fields, located in southern
Moravia, about 50 km away from the Mokrá plant. Another potential storage/EOR location represents the
nearby located cluster CZ II, which consists of 4 oil fields. The amount of expected incremental oil
production by CO2-EOR and expected storage amounts in the clusters CZ III and CZ II are shown in
Table 13.
Table 13. Expected incremental oil production and CO2 storage capacity.
Cluster Incremental oil production
by CO2-EOR CO2 used for EOR and
stored
thousand Sm3 thousand tonnes
CZ III. 1,430 8,550
CZ II 210 2,590
According to Table 13, the storage capacity of the cluster CZ III is about 8.5 Mt of CO2. The planned CO2
flow from the Mokrá cement plant is estimated at 400 kt per year, so that the capacity of the cluster CZ III
could be suitable for CO2 utilisation and storage for 21 years with potential prolongation (using cluster CZ
II) for next 6.5 years.
Without a detailed CO2-EOR & storage implementation plan for each field of the cluster it is impossible to
calculate the exact CO2 injection and storage costs. Literature data (e.g. ZEP 2011) provide some
guidance regarding possible cost range; for the case of CO2 storage in an onshore abandoned
hydrocarbon field without using legacy wells the values range between 1 and 10 EUR / tonne of CO2
stored.
Transport
The aerial distance from the Mokrá cement plant to the edge of the CZ III cluster is less than 50 km but
the potential transport trajectories would be longer; a pipeline distance of about 80 km needs to be
considered (Figure 44) because of geographical conditions. A shorter route is complicated because of
crossing the Ždánický les hills; a less complicated trajectory (without altitude changes) runs along the
rivers Rokytnice, Říčka, Litava and Svratka up to the Vranovice village. Here, the potential CO2 pipeline
could be added to the existing gas pipeline corridor "Tranzit" (operator NET4GAS) to Břeclav and then
up to a potential CO2 hub in Moravská Nová Ves (theoretical centre point of the CZ III cluster).
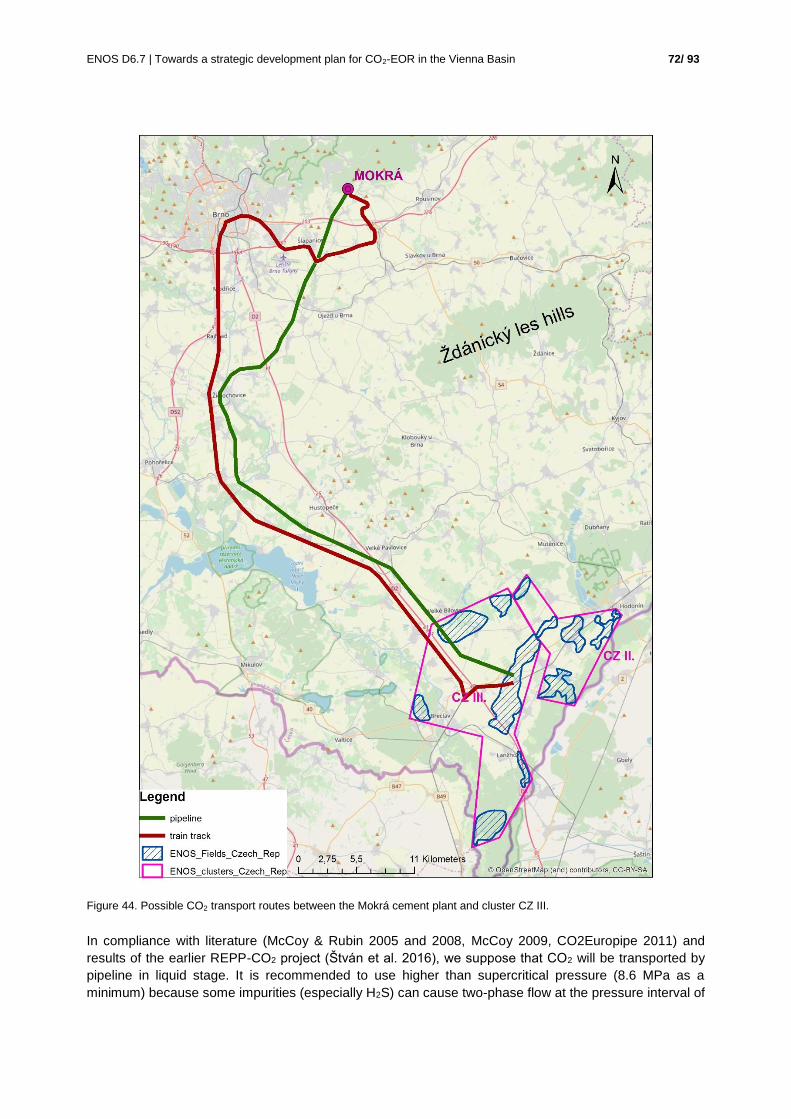
ENOS D6.7 | Towards a strategic development plan for CO2-EOR in the Vienna Basin
72/ 93
Figure 44. Possible CO2 transport routes between the Mokrá cement plant and cluster CZ III.
In compliance with literature (McCoy & Rubin 2005 and 2008, McCoy 2009, CO2Europipe 2011) and
results of the earlier REPP-CO2 project (Štván et al. 2016), we suppose that CO2 will be transported by
pipeline in liquid stage. It is recommended to use higher than supercritical pressure (8.6 MPa as a
minimum) because some impurities (especially H2S) can cause two-phase flow at the pressure interval of

ENOS D6.7 | Towards a strategic development plan for CO2-EOR in the Vienna Basin
73/ 93
7.4 - 8.6 MPa. For the supposed CO2 amount of 400,000 tonnes per year, the suitable pipe diameter is
8", i.e. 203 mm with an input pressure of 12 MPa. The output pressure (pipe length 80 km) is estimated
at 10 MPa at 10° - 12° C (average shallow subsurface temperature). Based on REPP-CO2 results, the
costs (CAPEX + 1 year OPEX) of such a pipeline come up to 3 billion CZK or 120 million EUR. If the
pipeline is active for 20 years, the cost per 1 tonne of transported CO2 is ca. 15 EUR.
In spite of the fact that CO2 transport for EU-ETS purposes is allowed only by pipeline, we also
considered potential CO2 transport by train that could be used in case the CO2 is solely used for CO2-
EOR, or if the related legislation is changed. Another reason is the favourable existing transport
infrastructure - the Mokrá plant has got its own railway connection to the state-owned railway network.
Analogously to ship-based transport, CO2 can be transported by train under divers conditions, from cold
liquid state at sub-zero temperatures and low pressures to dense phase at high pressures and ambient
temperature. Similarly to the majority of the recent studies on ship based CO2 transport (Aspelund et al.
2006, Jakobsen et al. 2016, Yara 2015, Roussanaly et al. 2013, Gao et al. 2011, Jung et al.2013), the
preferred mode of train-based CO2 transport is assumed to be in liquid form at 0.65 MPa and about -50.3
°C. While the train supply chain (including number of trains and number of wagons) can be optimised in
order to minimise the transport cost, the tank dimensions of wagon are limited. The assumed size is ca.
3 m x 3.5 m in section and 21 m in length (based on the CMGV 11-9733 model wagon8). Considering
that 90% of the transport volume is used, each wagon has an overall transport capacity of 240 tonnes of
CO2. The maximum number of wagons per train is assumed here to be 20 (i.e. 4,800 tonnes per train), in
order to have a maximum train length of 600 m including locomotive. For the annual amount of 400,000
tonnes CO2 to be stored, about 84 trains per year would be needed. The length of the railway connection
from the Mokrá plant to the potential hub close to the Moravská Nová Ves railway station represents 97
km (Figure 44), including 7 km of a private railway siding. It is difficult to calculate the costs of CO2
transport by train because of lack of data relevant to European conditions. As an exception, Roussanaly
et al. (2017) calculated the average cost of 1 tonne CO2 transported by train to a distance of 100 km to
be between 15 and 20 EUR, including conditioning.
Economic evaluation
The combination of the relatively high costs of CO2 capture in the cement industry and the limited
amount of CO2 to be captured, transported and stored annually with the currently low price of both oil
and CO2 emission allowances (EUA) make a business case based on the above-described scenario
impossible in case CO2-EOR and CO2 storage are considered separately. However, a rough estimate of
costs and revenues can be made to illustrate the basic economy of a possible project that could become
viable in case CO2-EOR and CO2 storage can be combined, or if sufficient amount of subsidies is
available, or if the value of one or more of the major cost / revenue items significantly changes. A
combination of these factors is of course also a possible option.
The estimated cost of CO2 capture at the cement plant, its conditioning, transporting to the storage site
and injection in the hydrocarbon fields of the CZ III cluster ranges between 57 and 84 EUR per tonne
(Table 14), which means that the total CCS project costs might be in the range of 488 – 719 million EUR.
6http://www.eurofire.lt/en/rail-wagons

ENOS D6.7 | Towards a strategic development plan for CO2-EOR in the Vienna Basin
74/ 93
Table 14. Rough estimation of CCS costs (in EUR) for the Mokrá – CZ III case study
Capture Transport Storage Total
Unit cost per tonne CO2 41 - 54 15 - 20 1 - 10 57 - 84
Total cost for complete amount of CO2 captured, transported,
used and stored (8.55 million tonnes)
351 – 462
million
128 – 171
million
9 – 86
million
488 – 719
million
Cost of CO2 captured, transported and used for CO2-EOR
(4.72 million tonnes)
194 – 255
million
71 – 94
million
5 – 47
million
270 – 396
million
Cost of CO2 captured, transported and stored after CO2-EOR
termination (3.83 million tonnes)
158 – 207
million
57 – 77
million
4 – 38
million
219 – 322
million
Based on the statistical CO2-EOR data published by Azzolina et al. (2015) and the suggested average
net CO2 utilisation factor of ca. 10 Mscf CO2/bbl oil, it can be estimated that ca. 55 % (4.72 million
tonnes) of the total CO2 amount that can be used and stored in the CZ III cluster would be needed for the
additional oil extraction by means of CO2-EOR, while the remaining 45 % (3.83 million tonnes) represent
CO2 that will be delivered for geological storage only. The related cost estimates are shown in Table 14.
The CCS cost estimates shown above can be compared with possible revenues. These need to be
divided into two different business models – CO2-EOR and CO2 storage – that are completely different
but – based on current interpretation of the existing legislation and regulatory framework – can possibly
be combined, depending on corresponding approval of the responsible Mining Authority.
In the pure CO2-EOR model, the revenues are represented by the value of the incremental oil produced.
For cluster CZ III, 1.43 million Sm3, i.e. ca. 9 million barrels of incremental oil production was estimated.
Using the average Brent crude oil price for 2015 – 20199, i.e. 59 USD/bbl, we can estimate the total
theoretical value of the incremental oil that can be produced from the oil fields of cluster CZ III at 531
million USD (ca. 486 million EUR10). These figures can be compared with the estimated costs of the 4.72
million tonnes CO2 needed for the CO2-EOR process, which are in the range of 270 – 396 million EUR.
The comparison shows a positive balance of 90 – 216 million EUR, corresponding to 10.93 – 26.24 USD
per barrel. This margin is definitely too low to cover the costs of oil production, separation and re-
injection of co-produced CO2, additional CO2 handling, overheads and possible profit but can rise in case
the oil price increases and/or the CCS costs decrease.
It also needs to be stated that some other studies (e.g. Stewart & Haszeldine 2014) suggest lower net
CO2 utilisation factors than those published by Azzolina et al., which would result in lower amount of CO2
needed for the production of the estimated amount of oil and, consequently, in more favourable
economic balance. To calculate a more exact value of a breakdown oil price versus amount and cost of
CO2 delivered would require performing a more detailed dedicated study.
If CO2-EOR is combined with CO2 storage perfomed in accord with the regulatory framework of the EU
CCS Directive, the revenues can be increased by the value of of EU-ETS emission allowances (EUA)
that would not need to be surrendered if the CO2 is captured, transported and stored according to the
relevant legislation. If we consider the amount of CO2 needed to perform the CO2-EOR job in cluster CZ
III (4.72 million tonnes), this additional revenues can be as high as 117 million EUR, using the estimated
EUA price for 2020 (26.50 EUR / tonne CO211). This would theoretically increase the above-mentioned
positive economic balance to 207 – 333 million EUR, corresponding to 25.15 – 40.45 USD per barrel.
9https://www.patria.cz/komodity/energie/IPE+BRENT/ipe-brent.html 10using exchange rate of 18 March 2020 - 1 USD = 0.9146 EUR; source
https://www.ecb.europa.eu/stats/policy_and_exchange_rates/euro_reference_exchange_rates/html/eurofxref-graph-usd.en.html 11https://www.spglobal.com/platts/en/market-insights/latest-news/electric-power/121819-commodities-2020-near-term-weakness-for-eu-co2-prices-but-gains-seen-in-late-2020
ENOS D6.7 | Towards a strategic development plan for CO2-EOR in the Vienna Basin
75/ 93
These values, especially those in the upper part of this interval, might possibly be close to or even
exceed the marginal oil production costs for some of the oil fields in the region12. It needs, however, to be
stressed that the EU ETS regime will introduce some additional requirements related to CO2 storage that
will reflect on increased total project costs. This especially concerns the administrative costs related to
acquisition of the storage permit, the related reporting, provision of financial security and the required
measurement, monitoring and verificatiojn of the CO2 stored. The possible emerging business case
related to this scenario can be strengthened by provision of subsidies related to CO2 emissions
reduction, increased price of oil and/or emission allowances and decrease of CCS costs.
Delivery of additional CO2 (beyond the amount that would be needed for CO2-EOR) for storage in the
depleted oil fields after cessation of the oil production would, ironically, worsen the overall economy of
the project and would need to be compensated by subsidies.
The revenues in the pure CO2 storage scenario are represented only by the value of EU-ETS emission
allowances that would not need to be surrendered if the CO2 is captured, transported and stored
according to the relevant European legislation. If the total amount of CO2 delivered from the Mokrá plant
(8.55 million tonnes) is considered, the value of the allowances in question is ca. 227 million EUR, using
the estimated EUA price for 2020 (26.50 EUR / tonne CO213). This is far below the cost of CO2 emissions
avoided by means of CCS (488 – 719 million EUR) and signals that if the project relied only on the value
of emission allowances, it would need to be heavily subsidized. A possible business case would require
a significant increase in the EUA price combined with a decreased cost of CCS. An overview of this case
study is provided in Table 15.
Table 15. Overview of the Case Study - Mokrá cement plant – cluster CZ III.
General details
Case study name: Mokrá cement plant – cluster CZ III
Source details
Name of source Mokrá cement plant (company Českomoravský
cement, HeidelbergCement Group member)
Country Czech Republic
Type of industry Cement industry
Total CO2 emissions (Mt /year) 0.76
Proposed CO2 capture rate (Mt/year) 0.4
High or low purity CO2 20 %
ETS applicable (yes/no) yes
Sink details
Cluster name CZ III
Additional incremental oil production (thousand
Sm3)
1,430
Total CO2-EOR/storage potential (Mt) 8.55
Transport details
Distance between source and sink 50 km (direct), 80 km (pipeline)
Geographical challenges Longer pipeline distance due to hilly terrain in the
direct connection line
12Exact oil prduction cost figures related to individual oilfierlds are subject of business secret protection and are hence not
avialble for the study. 13https://www.spglobal.com/platts/en/market-insights/latest-news/electric-power/121819-commodities-2020-near-term-weakness-for-eu-co2-prices-but-gains-seen-in-late-2020

ENOS D6.7 | Towards a strategic development plan for CO2-EOR in the Vienna Basin
76/ 93
7 Identification of regulatory, technical and conflicting interest challenges
Regulatory challenges
Legislation and regulations related to hydrocarbon exploration and production, CCS and emission trading
are the most important parts of the regulatory framework influencing the planning of CO2-EOR activities.
7.1.1 The Czech Republic
The hydrocarbon exploration is allowed only in the area of a valid exploration block, i.e. with a valid
exploration licence (permit). The responsible governmental body is the Ministry of Environment through
its regional Departments of State Administration; they award the exploration licences. The conditions and
requirements for exploration licence applications as well as the follow-up steps are defined by the
Geological Act No 62/1988 (in valid wording). he Geological Act does not limit the acreage of the
potential hydrocarbon exploration permit (block), the duration (expiration date) is also not limited. In the
Czech Republic, a charge is imposed on use of the exploration permit. The fee for the first year is 2,000
CZK (78 EUR) per square kilometre (km2) and each following year the fee increases by 1,000 CZK (39
EUR) per km2; i.e. the fee will be 11,000 CZK (431 EUR) per km2 in the tenth year. The revenue from this
fee is an income (100 %) of municipalities located in the area of the exploration block.
The hydrocarbon production is allowed only in the area of a valid production licence. The operator of the
production licence must be simultaneously a holder of the valid authorization for specific mining activities
(drilling, production, etc.). The responsible governmental body is the Czech Mining Authority and its
regional District Mining Authorities; they award the production licences and authorize all kinds of mining
activities. The conditions and requirements for production licence applications as well as the follow-up
steps are defined by the Mining Act No 44/1988 (in valid wording); to mining activities, the Mining Activity
Act No 61/1988 (in valid wording) is related. The Mining Act does not limit the acreage of the potential
production licence, the expiration date is not given. There are 2 kinds of payments related to the
production licence in the Czech Republic; fee per hectare of the production licence area and royalty (fee
per m3 of produced oil and/or gas). The fee per hectare (1 hectare = 10,000 m2) is 1,000 CZK (39 EUR,
minimum fee) and is still the same for each following year; the revenue from this fee is an income (100
%) of municipalities located in the area of the production licence. The royalty is defined by fixed rate in
the Czech Republic; for crude oil = 558 CZK (22 EUR) per m3 and for natural gas = 0.27 CZK (0.01 EUR)
per m3; the revenue from this fee is an income (75 %) of municipalities located in the area of the
production licence, the rest is an income of the State Environmental Fund.
There is no special legislation related to CO2-EOR in the Czech Republic. The Decree No 104/1988 of
the Czech Mining Authority contains very undetailed information about EOR in general. Simultaneously
with implementation of the EU CCS Directive (EC, 2009) into the Czech legislation framework (CO2
Storage Act No 85/2012 on storage of carbon dioxide into natural rock structures), the Mining Act has
been changed. According to the current wording of the Mining Act, it is forbidden to store CO2 in
reserved mineral deposits or anticipated reserved mineral deposits with the exception of oil and gas
fields; it is possible to allow (remit of the Mining Authority) storing CO2 in oil and gas fields according to
the CO2 Storage Act in connection with their overall enhanced oil and/or gas recovery. The CO2 injection
solely for the purposes of enhanced oil and gas recovery and carbon dioxide injection into coal seems for
enhanced coal bed methane recovery are not regarded as CO2 storage according to the Czech Storage
Act (§ 30 Economical exploitation of reserved deposits; similarly to the EU CCS Directive). The details of
combining the hydrocarbon production using CO2-driven enhanced recovery with CO2 storage according

ENOS D6.7 | Towards a strategic development plan for CO2-EOR in the Vienna Basin
77/ 93
to the CO2 Storage Act are unclear and generally almost entirely depending on the ad-hoc decisions of
the responsible Mining Authority.
The selection of storage sites as well as the exploration permits procedure for CO2 storage (in sense of
the CO2 Storage Act) are very similar to the exploration licence awarding procedure for hydrocarbons.
The Geological Act defines the procedure for CO2 site selection and awarding of CO2 storage exploration
permits (licences). Similarly to hydrocarbon exploration, the acreage of a potential CO2 exploration permit
as well as the duration (expiration date) are not limited. The licence fee is the same as in the case of
hydrocarbons.
The award of a CO2 storage permit is fully within the remit of the Czech Mining Authority. The procedure
is described in detail in the CO2 Storage Act. Unlike EU CCS Directive, the injected amount of carbon
dioxide is limited by the CO2 Storage Act; § 6 limits the amount to 1 million tonnes of CO2 per year and
per storage site. The CO2 Storage Act defines also (in § 14) the fee of 1 CZK (0.04 EUR) per tonne of
stored CO2. The revenue from this payment is an income of the municipalities in the storage site area;
the payer is the operator of the storage site.
The CO2 Storage Act includes a temporary ban of industrial-scale CO2 storage (exceeding 100,000 t)
until 1 January 2020; this has now, fortunately, expired without prolongation. Nevertheless, some pieces
of the regulatory framework are not yet in place; like, e.g., the governmental decree setting the provisions
of financial security pursuant to Article 19 of the EU CCS Directive.
A planned CO2 storage site must be evaluated by full-scale EIA (Environmental Impact Assessment)
process according to the EIA Act No 100/2001.
7.1.2 Slovakia
The Slovak legislation regulating hydrocarbon exploration, is still very similar to the Czech legislation
(even after 27 years from division). For hydrocarbon exploration, a valid exploration block is needed, i.e.
a valid exploration licence (permit) must be awarded. The Geological Act No 569/2007 limits neither the
acreage, nor the duration (expiration date). The responsible governmental body is the Ministry of
Environment. The exploration permit fee for the first four years is 100 EUR per km2 per year, for next four
years it is 200 EUR per km2 per year and for next two years 350 EUR per km2 per year; for next years
(the tenth and more), the fee is 700 EUR per km2 and year. The revenue from this fee is an income of
the Environmental Fund (50 %) and of the municipalities in the area of the exploration permit (50 %).
Similarly to the Czech legislation, the hydrocarbon production is allowed only in the area of a valid
production licence. The operator of the production licence must be simultaneously a holder of the valid
authorization for specific mining activities (drilling, production, etc.). The responsible governmental body
is the Main Mining Authority of the Slovak Republic and its regional District Mining Authorities; they
award the production licences and authorize all kinds of mining activities. The conditions and
requirements for production licence applications as well as the follow-up steps are defined by the Mining
Act No 44/1988 (the name and number of the Mining Act is the same in both Czechia and Slovakia, the
current Slovak wording slightly differs from the Czech one); to mining activities, the Mining Activity Act No
51/1988 (in valid wording) is related. The Mining Act does not limit the acreage of the production licence,
the expiration date is not given. There are two types of payments related to the production licence in
Slovakia; a fee per km2 of the production licence area and a royalty (fee from produced oil and/or gas).
The fee per km2 and per year is 600 EUR (minimum fee) and is still the same for each following year; the
revenue from this fee is an income of municipalities (80 %) located in the area of the production licence,
the rest is income of the state budget. The royalty for oil as well as natural gas is 5 % of current price of
produced oil or gas, revenue from this fee is an income (100 %) of the Environmental Fund.
ENOS D6.7 | Towards a strategic development plan for CO2-EOR in the Vienna Basin
78/ 93
There is no special legislation related to CO2-EOR in Slovakia. Simultaneously with implementation of
the EU CCS Directive (EC, 2009) into the Slovak legislation system (CO2 Storage Act No 258/2011, on
permanent storage of carbon dioxide into geological environment), the Slovak wording of the Mining Act
has been changed. According to the current wording of the Mining Act, the conversion of hydrocarbon
fields (or salt deposits) into CO2 storage sites means a changeover from hydrocarbon production or salt
extraction into utilization of these fields or deposits as permanent carbon dioxide storage site (§ 34a).
This conversion must be permitted and approved by the relevant District Mining Authority and the
operator must cope with the registered hydrocarbon or salt reserves from the point of view of their next
utilization; e.g. he can ask for the reserves write-off. It is unclear, if the operator can continue with oil
production using CO2-EOR before starting “pure” CO2 storage or can ask for writing-off the remaining
reserves.
The selection of storage sites as well as the exploration permits procedure for CO2 storage (in the sense
of the CO2 Storage Act) are very similar to the exploration licence procedure for hydrocarbons. But
according § 3 of the CO2 Storage Act, the location of a potential storage site is limited by the following
text: “…as storage site, the following structures are not considered: natural rock structure and subsurface
space, reasonably preferred for exploration, production and storage of hydrocarbons, for geothermal use,
for radioactive waste storage …”. This is in fact protection of suitable geothermal, hydrocarbon-bearing
and similar structures from setting up a CO2 storage site that has the lowest priority. The Geological Act
defines the procedure for CO2 site selection and CO2 storage exploration permits (licences). Similarly to
hydrocarbon exploration, the acreage of the potential CO2 exploration permit as well as the duration
(expiration date) is not limited. The licence fee is the same as in the case of hydrocarbons.
The award of a CO2 storage permit is fully within the remit of the Main Mining Authority of the Slovak
Republic. The procedure is described in detail in the CO2 Storage Act. Unlike EU CCS Directive, CO2
Storage Act defines (in § 9) very minutely the purity of injected CO2 stream; the carbon dioxide stream
must be dry and must contain at minimum 95 % CO2 and at maximum 0.01 % of hydrogen sulphide, 0.01
% of sulphur dioxide, 0.01 % of nitrogen oxides (NOx), 0.03 % of carbon monoxide and 0.03 % of
methane - compare with EU Directive, A 21: “A CO2 stream shall consist overwhelmingly of carbon
dioxide“. It is unclear who is responsible for checking these limitations.
A planned CO2 storage site must be evaluated by full-scale EIA (Environmental Impact Assessment)
process according to the EIA Act No 24/2006.
7.1.3 Austria
The Mining Act – MinroG (Mineralrohstoffgesetz) – defines exploration, mining and processing of
hydrocarbons, as well as the exploration and research of storage sites for hydrocarbons in geological
structures. Hydrocarbons in Austria are deemed as national resources, meaning they are exclusive
property of Austria regardless of any claims by landowners. The responsible governmental body is the
Federal Ministry of Agriculture, Regions and Tourism and its ‘Montanbehörde’ is the competent mining
authority. Mining and exploration rights can be transferred to suitable third parties according to Mining
Act §69 (1). Austria imposes a charge on exploring, mining and storing hydrocarbons based on the
amount and value of imported oil and gas into the country. The hydrocarbon production is only allowed in
the area of a valid production licence.
3 years after implementation of the EU CCS Directive (2009/31/EC) Austria has made use of its right to
ban CO2 storage according to article 4 §1. Since then, as stated by Federal Law Act No 144/2011 §2, the
underground storage of CO2 as well as the exploration for geological CO2 storage sights are forbidden
throughout the country. The only exceptions are research projects with a maximum storage capacity of
100,000 tonnes CO2 and the exploration of storage sites for development or testing of new products or

ENOS D6.7 | Towards a strategic development plan for CO2-EOR in the Vienna Basin
79/ 93
processes. This prohibition needs to be revaluated every 5 years. The following concerns that led to the
prohibition of CCS in Austria were expressed:
o CO2 capture and storage are still in development and not ready for broad-scale application.
Following technical issues should be further addressed:
- numerical simulations for prediction of underground CO2 behaviour, displacement processes,
reaction of CO2 with its surrounding, prediction of risks related to cracking and seismic
activities as well as the evaluation of long-term safety.
- borehole integrity, especially regarding the corrosion of metals and cement as well as long-
term borehole integrity.
- monitoring of the stored CO2 and its migration pathways.
- procedures and measures in case of irregularities or leakage are not sufficiently defined.
o CO2 Storage in Austria is mostly likely bound to depleted hydrocarbon fields. They have a lower
storage capacity compared to saline aquifers. Furthermore, depleted hydrocarbon reservoirs can be
used for production of oil and gas as well as storage of artificial and natural gas. Possible future
utilisations might be hydrogen storage and compressed air reservoirs. Permanent CO2 storage
represents a competitive use of the subsurface.
o Worldwide CCS storage sites, in contrast to Austria’s hydrocarbon reservoirs, are predominately
located in sparsely populated or uninhabited areas (e.g. deserts or offshore).
The last evaluation was in 2018 where the continuation of the prohibition was decided. There is no
special regulation regarding CO2-EOR in Austria. The annotation of Federal Law Act No 144/2011 as
well as the evaluation report in 2018 (III-238 d.B.) emphasize that enhanced hydrocarbon recovery with
CO2 does not count as geological storage of CO2 and is therefore not affected by the ban. Although CO2-
EOR is allowed, the combination with CCS is explicitly mentioned in the annotation and prohibited
according to Act No 144/2011 §2.
In conclusion
In general, performing of CO2-EOR to increase oil production is legal in all three countries. In Austria, the
ban of CO2 storage makes it impossible to combine CO2-EOR with CO2 storage within the meaning of
the EU CCS Directive, while the Czech and Slovak legislations in principle allow combining these two
activities, even though there is a lot of unclearness and uncertainty regarding detailed provisions and
rules for this procedure. Moreover, some parts of the regulatory framework are not yet in place. This
situation gives in fact an unlimited power to the responsible Mining Authority to decide upon all aspects
of site development, which represents a big uncertainty for possible investors and operators.
An additional, pan-European regulatory barrier has been identified concerning the provisions for CO2
transport. The Commission Decision 2010/345/EU as regards the inclusion of monitoring and reporting
guidelines for greenhouse gas emissions from the capture, transport and geological storage of carbon
dioxide (EC 2010) assumes transport by pipelines as the only way of transport compliant with the EU
ETS framework. This provision significantly limits the possibilities of flexible transport of CO2 within
capture and/or storage clusters where also other transport means like trains or trucks would need to be
applied for short-distance transport of smaller CO2 volumes.
Competitive use of the subsurface
Possible conflicts of interest regarding the use of the pore space in the subsurface include competition
between CO2 storage sites and underground gas storages, exploitation of geothermal energy, etc.

ENOS D6.7 | Towards a strategic development plan for CO2-EOR in the Vienna Basin
80/ 93
7.2.1 The Czech Republic
The preference of underground gas storages to CO2 storage sites and/or CO2-EOR is a typical conflict of
subsurface use in the Czech Republic. About 10 years ago, only pure gas fields were transformed into
gas storages; but recently, also oil fields have been used as underground gas storage sites. In such
cases, field operators (investors) usually prefer a gas storage to CO2-EOR as well as pure CO2 storage.
The reason for this practice is economic; the gas storage business is still profitable, while CO2-EOR is
still expensive (no CO2 market) and so far untested in the Czech Republic.
There have not been any conflicts of interest between CO2 storage and geothermal energy utilisation of
deep geological structures so far, mostly due to a limited development of these technologies in the
country so far. This can, however, change in future because both technologies can target similar
geological structures. There are no rules, procedures or guidelines in place to handle this type of
competitive use of the subsurface.
7.2.2 Slovakia
As stated in Chapter 8.1, there is no special legislation related to the CO2-EOR in Slovakia. According to
§ 3 of the CO2 Storage Act, the following structures cannot be considered as CO2 storage sites:
structures preferred for exploration, production and storage of hydrocarbons, for geothermal use, for
radioactive waste storage and other waste storage in subsurface space or any other utilization of the
subsurface space for energy purpose including possibilities, which are strategical for security of energy
supply or development of renewable energy sources. It means that a CO2 storage site has the lowest
priority in the whole ranking of priorities. This paragraph implies that the “contamination” of the reservoir
after CO2-EOR and before transformation into potential underground gas storage acts as a barrier for
CO2-EOR application. On the other hand, the total capacity of Slovak underground gas storages
represents currently about 4 billion m3; this number represents about 85 % of the domestic consumption
(4.7 billion m3 in 2018 according the Ministry of Economy). It seems that new underground gas storage
sites will not be needed anymore and this type of conflict will not be common in future. The main current
barrier for CO2-EOR is the limited availability and high price of CO2 and relatively low reserves of the
Slovak oil fields.
7.2.3 Austria
Until now, there is no special regulation that prioritizes the different usage possibilities of the
underground in Austria. As mentioned in the previous chapter, storage of CO2 in geological reservoirs for
economic purpose is against the regulations. Apart of safety concerns, one of the justifications for the
ban is the competitive use of the subsurface e.g. gas production or gas and hydrogen storage. Currently
there are 8 underground gas storages in Austria with a storage volume of approximately 8.4 bn m3.
Hydrogen storage is still in development and might become more important in the future.
In addition, further competitive underground uses might cover in the following order:
Geothermal energy use including underground thermal energy storage (UTES) in saline aquifers,
Power-to-gas systems14 including subsurface storage
Compressed air storage linked to wind mill farms (currently not in the focus of neither the
Austrian government nor the industry).
14 Pilots in Austria: UNDERGROUND SUN.CONVERSION project or Wind2Hydrogen project
ENOS D6.7 | Towards a strategic development plan for CO2-EOR in the Vienna Basin
81/ 93
Conflicts of interest
CO2-EOR and CO2 storage generally fall into the category of geological exploration and mining activities.
As such, the usual procedures for handling of conflicts of interest with the protection of environment,
water and infrastructure, as well as regional land-use planning, etc. need to be performed. In some
cases, these conflicts can prove difficult to handle and can represent an unsurmountable barrier for
implementation of a new project.
7.3.1 The Czech Republic
The Geological Act (No 62/1988, in valid wording) defines (§ 6) a “list” of potential conflict of interests for
exploration (geological works) and mining activities, containing names and numbers of relevant acts; the
experience of “permitmen” shows that this “list” does not fully cover all potential conflict of interests.
According to § 22, “The potential conflicts of interest have to be identified during the project preparation.
If any conflict of interest protected by another law has been identified, the project has to be prepared
according these laws”.
The most important and crucial potential conflict of interest is nature protection according to Act No
114/1992 (on Nature and Landscape Protection, in valid wording). This Act limits and/or forbids
exploration works and mining activities in the protected areas (for example National Parks, Protected
Landscape Areas, Natura 2000 etc.).The responsible authority for approval and permission of any kind of
exploration and mining activity in any area is the Environmental Department of the relevant Regional
Authority; without its approval, no geological and/or mining activity is allowed. In disputable cases, the
Ministry of Environment is the appellate authority. Other acts related to landscape protection are the
Forest Act (No 289/1995, in valid wording) and the Agriculture Land Resources Act (No 334/1991, in
valid wording). These acts limited the geological works and mining activities but do not forbid them.
The Water Act (No 254/2001, in valid wording) represents the water protection, both subsurface and
surface. This Act defines special protected areas for drinking water resources and drinking water
reservoirs, where no exploration and mining activities are allowed and protected areas for potential
drinking water resources, where exploration and mining activity are limited. Similar protection of mineral
and healing water resources is defined in the Spa Act (164/2001, in valid wording).
The Mining Act (No 44/1988, in valid wording) protects the areas of production licences. Only operator of
the production licence is authorized for exploration and mining activity in the area of the production
licence; for other investors, any activity inside the area of the production licence is forbidden.
The protective and safety areas of linear constructions (networking industry) like pipelines, motorways,
railways and high-voltage electric lines represent another limitation for geological works as well as E&P
activities. The protective and safety areas are defined by special laws and represent typical “industrial”
conflicts of interests. The protective and safety areas for electric lines and gas pipelines are defined by
Energy Act (No 458/2000, in valid wording). For electric lines, the protective area depends on voltage
and is relatively small; the largest is 30 m on both sides of line for electric lines with voltage of 400 kV.
For gas pipelines, the protective area depends on a pressure; the largest area is 4 m for the pressure 40
bars and more. The safety areas are defined for gas pipelines only, depends on both, pressures and
diameters; the largest is 160 m for pressure 40 bars and more and diameter 700 mm and more. In the
safety area, it is possible to carry out some geological exploration with a writing permission of the
pipeline operator. According the Act No 189/1999 (on Crude Oil Emergency Reserves, in valid wording),
the protective area for crude oil pipelines is 150 m. For gasoline pipelines, the protective area is 300 m
(according governmental decree No 29/1959). The largest protective area for railways is 60 m according
the Railway Act (No 266/1994, in valid wording). According the Road Act (No 13/1997, in valid wording),
the protective area for motorways is 100 m.

ENOS D6.7 | Towards a strategic development plan for CO2-EOR in the Vienna Basin
82/ 93
7.3.2 Slovakia
Similarly to the Czech legislation, the Geological Act (No 569/2007, in valid wording) defines (§ 12) a
“list” of potential conflict of interests during exploration works and mining activities. “During a project
preparation, the potential conflict of interest protected by other laws has to be identified and suitable
measures for protection of such interests has to be suggested”.
The most important and crucial potential conflict of interest is nature protection according Act No
543/2002 (on Nature and Landscape Protection, in valid wording). This Act limits (or forbids) exploration
works and mining activities in the same way as in the Czech Republic (National Parks, Protected
Landscape Areas, Natura 2000 etc.). The responsible authority for approval and permission of any kind
of exploration and mining activity is also the Environmental Department of the relevant Regional
Authority. Without its approval, no geological and/or mining activity is allowed. Other acts related to
landscape protection are the Forest Act (No 326/2005, in valid wording) and the Agriculture Land
Resources Act (No 220/2004, in valid wording). These acts limited the geological works and mining
activities but do not forbid them.
The Water Act (No 364/2004, in valid wording) represents the water protection, both subsurface and
surface. This Act defines special protected areas for drinking water resources and drinking water
reservoirs, where no exploration and mining activities are allowed and protected areas for potential
drinking water resources, where exploration and mining activity are limited. Similar protection of mineral
and healing water resources is defined in the Spa Act (538/2005, in valid wording).
The protection of production licence areas defines the same act as in the Czech Republic - the Mining
Act (No 44/1988, in valid wording).
Also in Slovakia, the protective and safety areas of linear constructions (networking industry) like
pipelines, motorways, railways and high-voltage electric lines represent a limitation for geological works
as well as mining activities. There are only small differences between the Czech and Slovak legislation.
The protective and safety areas for electric lines and gas pipelines are defined by Energy Act (No
251/2012, in valid wording). For electric lines, the protective area depends on voltage and is relatively
small; the largest is 35 m on both sides of line for electric lines with voltage of 400 kV. For gas pipelines,
the protective area depends on a diameter; the largest area is 50 m for the diameter 700 mm and more.
The safety areas are defined for gas pipelines only, depends on both, pressures and diameters; the
largest is 200 m for pressure 40 bars and more and diameter 500 mm and more. In the safety area, it is
possible to carry out some geological exploration with a writing permission of the pipeline operator. The
largest protected area for both crude oil and gasoline pipelines is 300 m according Slovak technical
standard No 650204 and governmental decree No 29/1959 of the former Czechoslovakia. According the
Railway Act No (513/2009, in valid wording), the largest protective area for railways is 60 m. For
motorways, the protective area is 100 m (according the Road Act No 135/1961, in valid wording).
7.3.3 Austria
Apart of the previously mentioned competitive use of the subsurface, carbon capture, its transportation
and storage might pose additional conflicts of interests with nature protection and local infrastructure.
Deep aquifers that comprise drinking water are under special protection in Austria and must not be
harmed or contaminated by drilling and storage operations. Carbon capture facilities with the aim of
storing CO2 in geological reservoirs or with a carbon capture volume of at least 1.5 million tonnes CO2
per year would need a full-scale Environmental Impact Assessment (Act No 697/1993 attachment 1 Z4).
The same is valid for CO2 pipelines with a length of at least 40 km and an internal diameter bigger than
300 mm (Act No 697/1993 attachment 1 Z13). Furthermore, all industrial emissions produced by carbon
capture processes underlying the European Directive 2010/75/EU need to be classified as IPPC facilities

ENOS D6.7 | Towards a strategic development plan for CO2-EOR in the Vienna Basin
83/ 93
according to Federal Law Act No 194/1994 attachment 3 (6.8). If transportation of the CO2 is realized via
truck and/or rail instead of pipelines, infrastructure will need to shoulder additional burden. According to
(Acatech, 2018), transportation of 1 million tonnes of CO2 via pipeline is equivalent to 50,000 truckloads
or 1,000 cargo trains.
Before introducing the legal ban of CO2 storage in Austria, the public opinion on CCS was very critical.
However, since then topics linked to CCS disappeared from the public discourse and lost the interest of
journalists. The raised public awareness concerning the climate crisis might lead to a turn of public
perception and to a, at least, slightly higher public acceptance. Although no public acceptance studies
have been performed in Austria in the framework of ENOS, an indication of a presumed higher public
acceptance might have been the reason for several press releases published by the Austrian
hydrocarbon producer OMV on the relevance and necessity for CO2 storage.
Technical challenges related to CO2-EOR and CO2 storage
7.4.1 Supercritical conditions
In order to work as an EOR agent, the CO2 must reach supercritical condition in the reservoir, i.e. the
general flooding and storage pressure must exceed 74 bar. Applying normal hydrostatic conditions and a
decent safety margin, this means that the reservoir depth should be at least 800-900 m sub-surface
(3000 ft is often referred to in regions where customary field units are used). If the reservoir pressure has
fallen below supercritical conditions as a result of the earlier depletion process, it may be necessary to do
water injection or wait for the reservoir to re-charge through natural aquifer influx.
7.4.2 Miscibility
CO2-EOR works best under fully miscible conditions, meaning that the CO2 and the in-situ oil can be
mixed in all propulsions with no interfacial tension between the two fluids. Historically this has often been
considered a prerequisite for a successful CO2 flooding, particularly in combination with water injection
(CO2 WAG). In many cases operators have applied extra water injection to boost pressure beyond
miscibility level prior to CO2 injection. The minimum miscibility pressure (MMP) increases when the API
gravity (related to level and distribution of heavy (C5+) components in the oil) decreases and reservoir
temperature increases as illustrated in Figure 45. Due to the oil quality (low API gravity) and the general
shallowness, with formation depths often less than 1,500 m, only a few of the Vienna Basin reservoirs
screened in this study will have potential for fully miscible CO2 flooding conditions.
However, even though full miscibility cannot be achieved, CO2 may still to a great extent be soluble in the
oil. Equation of State (EOS) modelling as well as published correlations (Emera & Sarma, 2007) indicate
that as much as 50 to 60 % CO2 may be attained in the oil on molar basis. This should lead to enhanced
recovery through swelling of the oil and reduction in in-situ oil viscosity. It should nevertheless be noted
that the general lack of fully miscibility conditions (in most reservoirs) could pose an additional
uncertainty on the results of this screening study.

ENOS D6.7 | Towards a strategic development plan for CO2-EOR in the Vienna Basin
84/ 93
Figure 45. Minimum miscibility pressure for CO2 in oil (reproduced from (Bachu, 2016).
7.4.3 Maximum injection pressure (attainable rates)
Maximum bottom hole pressure for wells injecting CO2 is usually constrained by fracturing pressure. In
most of the cases it is assumed that induced fracturing should be prevented (Hansen, et al., 2013) due to
risk of cracking of the cap rocks and possibility for the formation fluids to leak out of the target formation.
The geomechanical assessments carried out for one the Vienna basin fields in the Czech Republic, LBr-
1 (Berenblyum, et al., 2017) reported that the fracturing pressure is approximately 30% above the
hydrostatic pressure. This estimate for the LBr-1 field was however obtained with quite limited knowledge
of the regional geomechanics, the stresses and geomechanical parameters (approximated from
simplified approaches and literature) causing large uncertainty of the assessments. Studies of
geomechanics (in-situ stress distributions and geomechanical parameters) in the region are therefore of
high importance, since such parameters such as fracturing pressure determine potential injection rates
and feasibility and economics of CCUS projects.
7.4.4 Injectivity issues
Dependent on the salinity of the formation water, early time well damage may occur due to salt
precipitation in the vicinity of the CO2 injection wells. During the early injection period, CO2 will tend to dry
out the local brine, leaving salt crystals behind to reduce pore sizes. This phenomenon was clearly
observed during the sequestration of CO2 at the Snøhvit field in the Barents Sea. This damage may
however be repaired once and for all by treating the well with MEG (Mono Ethylene Glycol) injection
(Hansen, et al., 2013).
7.4.5 Productivity and flow assurance
Asphaltenes precipitation has been considered as one of the major challenges during CO2 injection to
enhance recovery. Onset of asphaltene precipitation is a function of pressure and thus prone to happen
near or in the production wells where it may cause considerable damage. Injection of solvents such as
xylene and toluene are commonly used to dissolve asphaltene deposits in both the wellbore and
formation, but these substances have recently become less attractive for environmental reasons. How
CO2 changes the asphaltene structure and thus accelerates the precipitation process is still not well

ENOS D6.7 | Towards a strategic development plan for CO2-EOR in the Vienna Basin
85/ 93
known (Golshahi et al. 2019), and further research into these mechanisms as well as quest for better
solvents should be warranted.
Paraffin wax is present in many of the oil reservoirs in the Vienna Basin. In the Czech region, up to 8.5 %
has been reported. Paraffinic waxes can precipitate when temperature decreases during oil production,
transportation through pipelines, and oil storage. In production wells, wax depositions may cause
important flow impairment, which requires frequent well interventions to rectify. Typical remedies are
injection of solvents such as methyl-ethyl ketone and toluene.
Wax precipitation may be characterized by the Wax Appearance Temperature (WAT) at which, with
falling temperature, solid wax starts to appear. The WAT is also pressure dependent. The effect of CO2
in this process does not seem to be strongly addressed in the literature and only one directly relevant
paper has been identified (Arya Hosseinipoura, 2016). This research indicates that CO2 in the well
stream will actually contribute to lower the WAT and thus help to reduce, or potentially prevent an
eventual wax problem. On the other hand, a lot of CO2 in the stream may cause a stronger Joule-
Thomson effect (adiabatic expansion), with more temperature reduction as the CO2 is released from the
oil phase when entering the well or flowing up the tubing.
7.4.6 Corrosion
CO2 and water together form carbonic acid (H2CO3) which causes aggressive corrosion in steel material
unless remedial measures are implemented. These measures may be coating of pipes and tubing and
use of stainless steel in exposed equipment.
7.4.7 Leakage
The potential for leakage of CO2 from the reservoir is not limited by induced fracturing of the reservoir
and caprock by CO2 injection as described above (Shchipanov, Kollbotn, & Berenblyum, 2019).
Uncontrolled leakage into the overburden may also happen through wells due to unsealed bounds
between the formation and the cement in the borehole and through faults that could be re-activated due
to pressure build-up and effective stress changes in the reservoir. Studies of geomechanics help in
evaluating injection conditions preventing fault reactivation (Chiaramonte et al. 2015) (Chiaramonte,
White, & Trainor-Guitton, 2015), (Choi et al. 2015) (Choi, Skurtveit, Bohloli, & Grande, 2015). Leakage
risks caused by the reasons described above have been evaluated in ENOS WP3 using data for the LBr-
1 field also mentioned above.
Technical challenges related to CO2 capture
The potential sources of CO2 capture that have been included in this study are primarily based on the
emissions data collected from the EU E-PRTR database. Some additional calculations have been made
on the potential availability of high concentration CO2 from the hydrogen production plant at the OMV
Schwechat Refinery in Austria, and some assumptions have been made regarding the capture potential
at the Mokrá cement plant in the Czech Republic. However, in order to take the business case of CO2-
EOR further, more plant specific details regarding the possible application of CO2 capture at selected
sites will be necessary. Information on the types of production processes, the age of the installation,
availability of waste heat and the availability of space for capture systems are important factors.
Experience in CO2 capture from industrial emissions, particularly cements plants, is currently limited.
ENOS D6.7 | Towards a strategic development plan for CO2-EOR in the Vienna Basin
86/ 93
8 Conclusions and recommendations
Conclusions
This report has studied a number of critical factors to assess the potential for CO2-EOR in the Vienna
Basin. All the three countries of the Vienna Basin have potential for both CO2-EOR and CO2 storage. By
far the greatest potential for these can be found in the Austrian part of the Vienna Basin, in the large
Matzen cluster. For the entire basin, the theoretical incremental recovery of additional oil due to CO2
injection has been calculated as of 21 million Sm3 (130 million barrels), which, using the current
(February 2020) oil price of 40 USD/bbl, represents (if produced) a gross value of 5,200 million USD. The
amount of CO2 that would be needed to perform the related CO2-EOR operations and thereafter stored in
the depleted fields is estimated to nearly 140 million tonnes. Therefore, from this initial analysis, at least
from a theoretical perspective, the potential for CO2-EOR combined with CO2 storage warrants further
investigation. What is also clear is that there is sufficient theoretical CO2 storage potential in the region to
accommodate many years of emissions from the CO2 sources identified. One exception here are the oil
field clusters in the Slovakian section of the Vienna Basin, which, with a total storage capacity of 6 million
tonnes CO2, are not considered large enough to store industrial scale levels of CO2.
Despite this theoretical potential, there are a number of technical, regulatory and economic challenges
that need to be highlighted. Some of these challenges are specific to the region, others are applicable to
all CCS and CO2-EOR projects. The challenges are outlined below.
8.1.1 Technical aspects
CO2-EOR works best under fully miscible conditions, meaning that the CO2 and the in-situ oil can be
mixed in all propulsions with no interfacial tension between the two fluids. Due to the oil quality (low API
gravity) and the general shallowness, with formation depths often less than 1500 m, only a few of the
Vienna Basin reservoirs screened in this study will have potential for fully miscible CO2 flooding
conditions. However, CO2-EOR can still be feasible even if full miscibility may not be achieved.
Many of the fields investigated have been perforated several hundred times during the exploration and
production phases. This is not ideal for CO2 storage operations, as this will require extensive risk
management of potential leakage through legacy wells. Although the potential for using existing wells
could reduce the capital costs of CO2 injection projects, the well infrastructure of many fields may not be
suitable for CO2 injection due to corrosion issues.
This analysis identified approximately 10 point sources of CO2 that could be considered for CO2 capture,
usage and storage, within a 70 km radius of the oil field clusters. By far the largest point sources are in
the oil refining and cement sectors. Generally speaking, the sources face relatively high costs for CO2
capture, above 60 USD / tonne CO2. One potential source of relatively low-cost CO2 has been identified,
at a hydrogen production plant at the Schwechat Refinery in Austria. This source produces
approximately 200 kt CO2 per year of potentially high-purity CO2, which could be efficiently captured for
CO2 storage. It must also be mentioned that the cement plant owners are seriously considering CCS for
reducing process emissions, as cement plants have no other options for significant CO2 reductions.
8.1.2 Regulatory aspects
CO2-EOR is permitted in all countries, however geological CO2 storage under the EU CCS Directive is
prohibited in Austria. This represents a potential showstopper for the combination of CO2-EOR with long-
term CO2 storage for the purposes of climate change mitigation. Another area that presents some
uncertainty, is the combination of CO2-EOR with CO2 storage. Although the EU CCS Directive does not

ENOS D6.7 | Towards a strategic development plan for CO2-EOR in the Vienna Basin
87/ 93
prohibit CO2-EOR with CO2 storage, the current regulatory status of this in the Czech Republic and
Slovakia is rather unclear. Furthermore, there are no examples of existing or proposed CO2 injection
projects in the EU that have developed a monitoring and reporting plan for a CO2-EOR project under the
EU CCS Directive. The monitoring and reporting guidelines of the EU ETS currently assume only
pipeline transport for CO2, which represents a barrier for implementation of CCS in small clusters which
may consider transport by train or truck. Finally, it has been identified in certain countries that CCS
developments may be hindered by various conflicts of interest, and regulatory restrictions.
8.1.3 Economic aspects
Cost estimates have been developed for Case study 2, involving CO2 capture from a cement plant for
use for EOR. The combination of the relatively high costs of CO2 capture in the cement industry and the
limited amount of CO2 to be captured, transported and stored annually with the currently low price of both
oil and CO2 emission allowances (EUA) presents challenges for the development of a sound business
case. The most favourable business model is the combination of CO2-EOR with CO2 storage performed
under EU ETS regime but without storage of additional CO2, which has a negative economic balance.
Whereas the value of the additional incremental oil produced through CO2 injection can offset the
operational costs of capturing the CO2, the costs of capturing and storing the CO2 for the sole purpose of
CO2 storage are currently far higher than the expected EU ETS price (26.50 EUR / tonne CO2 in 202015).
Therefore, either EU ETS prices must increase, or additional forms of subsidy or grant schemes must be
made available to allow CO2 capture to take place in the cement and refining industries present in the
Vienna Basin region.
Recommendations
In order to take the concept for CO2-EOR in the Vienna Basin forward, a number of recommendations
are proposed.
Awareness raising - The preliminary results of this analysis should be brought to the attention of
both policy makers and industry stakeholders, in particular oil producers and CO2 emitters, in the
Vienna Basin region. This can help to raise interests of the economic and environmental benefits
this concept could bring. Next steps could involve additional meetings with stakeholders,
organizing a series of workshops or establishing a ‘CCS in the Vienna Basin’ working group.
Removing regulatory barriers - The prohibition of CO2 storage in Austria is an obvious barrier to
the developments of CCS in the country. Austria has both the greatest potential for CO2-EOR
and CO2 storage. Dialogue with regulators needs to take place to identify why CO2 storage is
prohibited, and whether this prohibition threatens the timely decarbonization of heavy industry by
2050 as required under the Paris Agreement. In addition, the existing regulatory framework in
the Czech Republic and Slovakia should be fine-tuned to be more supportive of CCS and its
combination with CO2-EOR. Last but not least, the barrier of limiting CO2 transport options under
EU ETS to pipelines only needs to be removed to allow for other means of transport in smaller
clusters.
Feasibility studies using site-specific data - This analysis has provided an initial analysis based
on field data aggregated into clusters (due to confidentiality reasons), and publicly available data
on CO2 sources. The next step in this research could be to take the case studies identified in
15https://www.spglobal.com/platts/en/market-insights/latest-news/electric-power/121819-commodities-2020-near-term-weakness-for-eu-co2-prices-but-gains-seen-in-late-2020

ENOS D6.7 | Towards a strategic development plan for CO2-EOR in the Vienna Basin
88/ 93
chapter 6 to the next level of detail. Hereby more detailed information could be requested from
the oil operators and CO2 emitters to improve the cost estimates of the case studies and provide
a clear picture of the potential business cases.
Identifying supportive policy mechanisms - This concept, if taken forward, has the potential to
contribute to the European economy and environmental protection. However, the necessary
financial incentives are not yet in place. An inventory of potentially applicable national and
European policy mechanisms could help identify potential funding sources to advance both the
preparatory research and possible investments needed to realise CO2-EOR in the Vienna Basin.
Possibilities include the European Commission’s Cohesion Fund, Innovation Fund,
Modernisation Fund, or if a cross-border project was considered, the Connecting Europe Facility
(CEF).
Finally, it will be important for the geological surveys and R&D institutes, but also industrial stakeholders
in the countries of the Vienna Basin to gain knowledge and experience by developing partnerships (both
industrial and research) with countries with practical CO2-EOR experience (Hungary, Croatia, USA,
Canada, Turkey). Through this knowledge sharing, some of the technical challenges relating to CO2-
EOR can be addressed.
ENOS D6.7 | Towards a strategic development plan for CO2-EOR in the Vienna Basin
89/ 93
References
Acatech 2018. ”CCU and CCS – Building Blocks for Climate Protection in Industry”. Retrieved March 23, 2020 (https://www.acatech.de/wpcontent/uploads/2018/09/acatech_POSITION_CCU_CCS_engl_Web.pdf)
Allevi, C., Blew, W., Claus, G., Chevallier, F., Dinka, P., Gardzinski, W., Lichtscheidl, J., Lyde, C., Maas, W., Mahoney, L., Mendes, A., Parks, G., García, J.M.R., Rucker, S.,Sinnen, H.-D., Sopranzetti, A., Zanibelli, L., Reid, A., Bauld, J., Larivé, J.-F. 2011. ”The potential for application of CO2 capture and storage in EU oil refineries”. CONCAWE Reports.
Arzmüller, G., Buchta, Š., Ralbovský, E., Wessely, G. 2006. “The Vienna Basin.” Pp. 191–204 in The Carpathians and Their Foreland: Geology and Hydrocarbon Resources, AAPG Memoir 84, edited by J. Golonka, F. J. Picha, and F. J. Picha.
Aspelund, A., Mølnvik, M.J., De Koeijer, G. 2006. “Ship Transport of CO2: Technical Solutions and Analysis of Costs, Energy Utilization, Exergy Efficiency and CO2 Emissions.” Chemical Engineering Research and Design 84(9 A):847–55.
Azzolina, N. A. et al. 2015. “CO2 Storage Associated with CO2 Enhanced Oil Recovery: A Statistical Analysis of Historical Operations.” International Journal of Greenhouse Gas Control 37:384–97.
Bachu, S. 2016. “Identification of Oil Reservoirs Suitable for CO2-EOR and CO2 Storage (CCUS) Using Reserves Databases, with Application to Alberta, Canada.” International Journal of Greenhouse Gas Control 44:152–65.
Bednaříková, J. 1984. ”Kapitoly z historie.” In: Bednaříková, J. & Thon, A., (Eds.): Naftový průmysl na na území Československa. Knihovnička Zemního plynu a nafty, 5, Hodonín, 235 – 253.
Berenblyum, R. et al. 2018. “Integrated Approach to CO2 EOR and Storage Potential Evaluation in an Abandoned Oil Field in Czech Republic.” P. cp-511-00139 in IOR 2017 - 19th European Symposium on Improved Oil Recovery, vol. 2017. EAGE Publications BV.
Bosoaga, A. et al. 2009.” CO2 capture technologies for Cement Industry” Energy Procedia 1, GHGT-9, pp 133-140.
Buchta, Š., Čajka, R., Hlavatý, I., Jiříček, R. 1984. ”Vídeňská pánev.” In: Bednaříková, J. & Thon, A., (Eds.): Naftový průmysl na na území Československa. Knihovnička Zemního plynu a nafty, 5, Hodonín, 235 – 253.
Buday, T., Cícha, V. 1967. ”Vídeňská pánev”. In: Buday, T., (Ed.), Regionální geologie ČSSR, II – Západní Karpaty, 2. Ústřední ústav geologický, Praha, 409 – 425.
Chiaramonte, L., White, J.A., Trainor‐Guitton, W.. 2015. “Probabilistic Geomechanical Analysis of Compartmentalization at the Snøhvit CO 2 Sequestration Project.” Journal of Geophysical Research: Solid Earth 120(2):1195–1209. Retrieved March 23, 2020 (https://onlinelibrary.wiley.com/doi/abs/10.1002/2014JB011376).
CO2Europipe 2011. “D3.3.1 – WP3.3 report: Legal, Financial and Organizational Aspects of CO2 Pipeline Infrastructures “. Retrieved March 23,2020 (http://www.co2europipe.eu/Publications/D3.3.1%20-%20Legal%20financial%20organisational%20aspects.pdf)
Choi, J., Skurtveit, E., Bohloli, B., & Grande, L. 2015. ”Geomechanical Assessment of Flow Barriers Observed from 4D Time-lapse Survey for CO2 Storage in Snøhvit Field.” Fourth International Conference on Fault and Top Seals, 20-24 September. Alméria, Spain: EAGE.
Ďurica, D., Suk, M., Ciprys, V. 2010. ”Energetické zdroje – včera, dnes a zítra.” Moravské zemské múzeum, Brno, 165 p.

ENOS D6.7 | Towards a strategic development plan for CO2-EOR in the Vienna Basin
90/ 93
Emera, M. K., Sarma, H.K.. 2007. “Prediction of CO2 Solubility in Oil and the Effects on the Oil Physical Properties.” Energy Sources, Part A: Recovery, Utilization and Environmental Effects 29(13):1233–42.
ENOS D4.5: Reservoir models of novel CO2-EOR concepts at LBr-1. (n.d.).
EU GeoCapacity 2008. Economic uses of CO2. WP3 Report, D22.
Francu J., Radke M., Schaefer R.G., Poelchau H.S., Caslavsky J., Bohacek Z. 1996. ”Oil-oil and oil-source rock correlation in the northern Vienna basin and adjacent Flysch Zone.” In: Oil and Gas in Alpidic Thrustbelts and Basins of Central and Eastern Europe. G. Wessely and W. Liebl, eds., EAPG Spec. Publ. No. 5, Geological Society Publishing House, Bath, pp. 343-354.
Gao, L., Fang, M., Li, H., Hetland, J.. 2011. “Cost Analysis of CO2 Transportation: Case Study in China.” Pp. 5974–81 in Energy Procedia, vol. 4. Elsevier Ltd.
Golshahi, N. Afra, S., Samouei, H., Nasr-El-Din, H., Beraldo da Silveira Balestrin, L.. 2019. “Asphaltene Structural Changes Induced by Carbon Dioxide Injection.” in Offshore Technology Conference Brasil 2019, OTCB 2019. Offshore Technology Conference.
Hamilton, W., Wagner, L., Wessely, G. 1999. ”Oil and Gas in Austria.” Austrian Journal of Earth Sciences, 92, 235–262. Retrieved March 23, 2020 (https://www.zobodat.at/publikation_articles.php?id=169013)
Hansen, O., Gilding, D., Nazarian, B., Osdal , B., Ringrose, P., Kristoffersen, J.-B., Hansen, H. 2013. ”Snøhvit: The history of injecting and storing 1 Mt CO2 in the fluvial Tubåen Fm.” Energy Procedia, 37, 3565–3573.
Hosseinipour, A., Japper-Jaafar, A., Yusup, S.. 2016. “The Effect of CO2 on Wax Appearance Temperature of Crude Oils.” Procedia Engineering 148:1022–29. Retrieved March 23, 2020 (www.sciencedirect.com).
IEA 2011. Technology roadmap - Carbon capture and storage in industrial applications. International Energy Agency, Paris.
IEAGHG 2013. “CO2 Pipeline Infrastructure”, 2013/18, December
IEAGHG 2018. “Cost of CO2 Capture in the industrial Sector: Cement and Iron and Steel Industries”, 2018-TR03, September.
Jakobsen, J., Roussanaly, S.,Anantharaman, R.. 2016. “A Techno-Economic Case Study of CO2 Capture, Transport and Storage Chain from a Cement Plant in Norway.” Journal of Cleaner Production 144:523–39.
Janoschek, W. R., Maltzer, O., Zimmer, W. 1996. ”Hydrocarbons in Austria: past, present and future. ” In: Wessely, G. & Liebl, W., (Eds.): Oil and Gas in Alpidic Thrustbelts and Basins of Central and Eastern Europe. EAGE Special Publication No. 5, 43 – 63.
Jiricek, R. 1979. ”Tectogenetic development of the Carpathian arc in the Oligocene and Neogene.” in M. Mahel, ed., Tectonic profiles through the West Carpathians. Geologický Ústav D. Štúra, Bratislava, 203-212.
Jiříček, R., 1988. ”Stratigrafie, paleogeografie a mocnost sedimentů v neogénu Vídeňské pánve. Zemní plyn a nafta,” 33, 4, 583 – 622.
Jiricek, R., Seifert, P. 1990. ”Paleogeography of the Neogene in the Vienna basin and the adjacent part of the foredeep.” in D. Minarikova and H. Lobitzer, (Eds.): 30 years of geological cooperation between Austria and Czechoslovakia. Federal Geological Survey, Vienna, and Geological Survey, Prague, 89–105.
Jung, J. Y., Huh, Ch., Kang, S.G., Seo, Y., Chang, D.. 2013. “CO2 Transport Strategy and Its Cost Estimation for the Offshore CCS in Korea.” Applied Energy 111:1054–60.
Kováč, M. 2000. ”Geodynamický, paleogeografický a štruktúrny vývoj karpatsko-panónskeho regiónu v miocéne: Nový pohľad na neogénne panvy Slovenska.” VEDA, Bratislava, 202 p.
ENOS D6.7 | Towards a strategic development plan for CO2-EOR in the Vienna Basin
91/ 93
Krejci O., Francu J., Poelchau H.S., Müller P., Stranik Z. 1996. ”Tectonic evolution and oil and gas generation model in the contact area of the North European Platform with the West Carpathians. ” In: Oil and Gas in Alpidic Thrustbelts and Basins of Central and Eastern Europe. G. Wessely and W. Liebl, eds., EAPG Spec Publ. No. 5, Geological Society Publishing House, Bath, pp. 177-186.
Kreutzer, N. 1993 ”Lagerstätten im Neogen des Wiener Beckens und dessen Untergrund. ” In: F. Brix & Schultz, O. (Eds.): Erdöl und Erdgas in Österreich (2nd ed., pp. 403–434). Horn: Naturhistorisches Museum Wien und F. Berger.
Ladwein, H. W., Schmidt, F., Seifert, P., Wessely, G. 1991. ”Geodynamics and generation of hydrocarbons in the region of the Vienna basin, Austria.” In A. M. Spencer, (Ed.), Generation, accumulation and production of Europe’s hydrocarbons. European Association of Petroleum Geoscientists and Engineers Special Publication 1, 289–305.
Lankreijer, A., Kováč, M., Cloetingh, S., Pitoňák, P., Hlôška, M., Biermann, C. 1995. “Quantitative subsidence analysis and forward modelling of the Vienna and Danube Basins: Thin-skinned versus thick-skinned extension.” Tectonophysics, 252, 433-451.
Lee, E. Y., Wagreich, M. 2018. “Basin modelling with a MATLAB-based program, BasinVis 2.0: A case study on the southern Vienna Basin, Austria.“ Journal of the Geological Society of Korea 54, 6, 615-630.
McCoy, S. T., Rubin, E.S.. 2008. “An Engineering-Economic Model of Pipeline Transport of CO2 with Application to Carbon Capture and Storage.” International Journal of Greenhouse Gas Control 2(2):219–29.
McCoy, S.T. 2009. “The Economics of CO2 Transport by Pipeline and Storage in Saline Aquifers and Oil Reservoirs.” Retrieved March 23, 2020 (https://pdfs.semanticscholar.org/eb56/c9dd6c03456b0042a0f71fa269380519bc19.pdf).
McCoy, S.T.,Rubin, E.S. 2005. “Models of CO2 Transport and Storage Costs and Their Importance in CCS Cost Estimates.” Retrieved March 23, 2020 (https://kilthub.cmu.edu/ndownloader/files/10942655).
MPO 2015. ”State Energy Policy of the Czech Republic. ” 159 pp. Retrieved March 23, 2020 (https://www.mpo.cz/assets/en/energy/state-energy-policy/2017/11/State-Energy-Policy-_2015__EN.pdf).
MPO 2019. ”Vnitrostátní plán České republiky v oblasti energetiky a klimatu” (The National energy and climate plan of the Czech Republic). 434 pp. Retrieved March 23, 2020 (https://www.mpo.cz/assets/cz/energetika/strategicke-a-koncepcni-dokumenty/2020/1/Vnitrostani-plan-CR-v-oblasti-energetiky-a-klimatu_final.docx).
MŽP 2017. ”Politika ochrany klimatu v ČR” (Climate Protection Policy of the Czech Republic). 123 pp. Retrieved March 23, 2020 (https://www.mzp.cz/C1257458002F0DC7/cz/politika_ochrany_klimatu_2017/$FILE/OEOK-POK-20170329.pdf).
Peletiri, S., Rahmanian, N., Mujtaba, I. 2018. “CO2 Pipeline Design: A Review.” Energies 11(9):2184. Retrieved March 23, 2020 (http://www.mdpi.com/1996-1073/11/9/2184).
Perera, M. et al. 2016. “A Review of CO2-Enhanced Oil Recovery with a Simulated Sensitivity Analysis.” Energies 9(7):481. Retrieved March 23, 2020 (http://www.mdpi.com/1996-1073/9/7/481).
Potsch, K. 2004. Enhanced oil recovery of OMV in the Vienna Basin.
Prochác, R., Pereszlényi, M., Sopková, B., 2012. “Tectono-sedimentary features in 3D seismic data from the Moravian part of the Vienna Basin.” First Break, 30, 49 – 56.
Roussanaly, S., Bureau-Cauchois, G., Husebye, J.. 2013. “Costs Benchmark of CO2 Transport Technologies for a Group of Various Size Industries.” International Journal of Greenhouse Gas Control 12:341–50.
Roussanaly, S., Skaugen, G., Aasen, A., Jakobsen,J., Vesely, L.. 2017. “Techno-Economic Evaluation of CO2 Transport from a Lignite-Fired IGCC Plant in the Czech Republic.” International Journal of Greenhouse Gas Control 65:235–50.
ENOS D6.7 | Towards a strategic development plan for CO2-EOR in the Vienna Basin
92/ 93
Royden, L. H., Horváth, F., Rumpler, J. 1983. “Evolution of the Pannonian basin system: 1. Tectonics.” Tectonics, 2, 63-69.
Royden, L.H. 1985. “Vienna Basin: a thin-skinned pull-apart basin.” In: Biddle, K.T. & Christie-Blick, N., (Eds.): Strike-Slip Deformation, Basin Formation and Sedimentation. Society of Economic Paleontologists and Mineralogists, Special Publications, 37, 319–338.
Rupprecht, B. J., Sachsenhofer, R. F., Zach, C., Bechtel, A., Gratzer, R., Kucher, F. 2019: “Oil and gas in the Vienna Basin: hydrocarbon generation and alteration in a classical hydrocarbon province. Petroleum Geoscience. “25(1), 3–29.
Scharf, C., Clemens, T.. 2006. “CO2-Sequestration Potential in Austrian Oil and Gas Fields.” in SPE Europec/EAGE Annual Conference and Exhibition. Society of Petroleum Engineers. Retrieved March 23, 2020 (http://www.onepetro.org/doi/10.2118/100176-MS).
Shchipanov, A. A., Kollbotn, L., Berenblyum, R. 2019. “Characterization and Monitoring of Reservoir Flow Barriers from Pressure Transient Analysis for CO2 Injection in Saline Aquifers.” International Journal of Greenhouse Gas Control 91:102842.
Šliaupa, S., Lojka, R., Tasáryová, Z., Kolejka, V., Hladík, V., Kotulová, J., Kucharič, L., Fejdi, V., Wojcicki, A., Tarkowski, R., Uliasz-Misiak, B., Šliaupiene, R., Nulle, I., Pomeranceva, R., Ivanova, O., Šogenova, A., Šogenov, K. 2013. "CO2 storage potential of sedimentary basins of Slovakia, the Czech Republic, Poland and the Baltic States." – Geological Quarterly 57, 2, 219-232. ISSN 1641-7291. DOI 10.7306/gq.1088
Stewart, R.J,, Haszeldine, S. 2014. ”Carbon Accounting for Carbon Dioxide Enhanced Oil Recovery. Scottish Carbon Capture & Storage”, University of Edinburgh. 62 pp.
Spörker, H., 1984. „Die Entwicklung der Tiefbohrtechnik in der ÖMV Aktiengesellschaft.“ Erdöl-Erdgas Zeitschrift, 100/5, 169–179.
Štván, F., Kolejka, V., Nermoen, A., Berenblyum, R., Shchipanov, A., Skadsem, H.J., Ford, E., Kollbotn, L. 2016. “Studie scénářů pro realizaci projektu pilotního úložiště CO2 v lokalitě LBr-1 včetně ekonomického vyhodnocení” (Study of realisation scenarios of the pilot CO2 storage site in the LBr-1 locality including economic evaluation). Result V6.3 of the REPP-CO2 project, Norway Grants 2009-2014, project No. NF-CZ08-OV-1-006-2015. 65 pp.
Valdenaire, D. 2018. "The importance of carbon capture and storage technology in European refineries." CONCAWE Review. 27. 34-44.
Van Straelen, J., Geuzebroek, F., Goodchild, N., Protopapas, G., Mahony, L. 2010. "CO2 capture for refineries, a practical approach." International Journal of Greenhouse Gas Control, 4(2), 316-320.
Vass, D. 2002 „Lithostratigraphy of Western Carpathians: Neogene and Buda Paleogene.” Štátny geologický ústav Dionýza Štúra, Bratislava, 11 – 28.
Verma, M. K. 2017. Three Approaches for Estimating Recovery Factors in Carbon Dioxide Enhanced Oil Recovery: U.S. Geological Survey Scientific Investigations Report 2017–5062–A–E. Retrieved March 23, 2020 (https://doi.org/10.3133/ sir20175062).
Wessely, G. 1993. "Aufschlußaktivitäten und KW-Lagerstätten im Untergrund des Wiener Beckens." In F. Brix & Schulz, O., (Eds.): „Erdöl und Erdgas in Österreich“ (2nd ed., 434–440. Horn: Naturhistorisches Museum Wien und F. Berger.
Yara 2015. “New Liquid CO2 Ship for Yara | Yara International.” Retrieved March 23, 2020 (https://www.yara.com/news-and-media/news/archive/2015/new-liquid-co2-ship-for-yara/).
ZEP 2011: “The Cost of CO2 Capture, Transport and Storage, Post-demonstration CCS in the EU.“ European Technology Platform for Zero Emission Fossil Fuel Power Plants (ZEP), Brussels.
ENOS D6.7 | Towards a strategic development plan for CO2-EOR in the Vienna Basin
93/ 93
This deliverable is prepared as a part of ENOS project
More information about the project could be found at http://www.enos-project.eu
Be nice to the world!
Please consider to use and distribute this document electronically.
This project has received funding from the European Union’s Horizon 2020
research and innovation programme under grant agreement No 653718