Enjoying loyalty: Tel.: 514-398-4058 Fax:...
21
Enjoying loyalty: The relationship between service quality, customer satisfaction, and behavioral intentions in public transit Dea van Lierop a & Ahmed El-Geneidy a* a McGill University: School of Urban Planning, Suite 400, 815 Sherbrooke St. W. Montréal, Québec, H3A 2K6, Canada Tel.: 514-398-4058 Fax: 514-398-8376 For Citation please use: van Lierop, D., & El‐Geneidy A. (2016) Enjoying loyalty: The relationship between service quality, customer satisfaction, and behavioral intentions in public transit. Research in Transportation Economics, 59, 50‐59. Keywords: Satisfaction, loyalty, structural equation modelling, public transit, service attributes ABSTRACT The relationship between customer satisfaction and loyalty has recently received international attention as transit agencies aim to identify ways to increase ridership. Improvements in perceived service quality increase the attractiveness of transit, and therefore lead to growing patronage. The present paper examines how transit users’ perceptions of service quality and user satisfaction influence loyalty. Using information from five years of customer satisfaction questionnaires collected by two Canadian transit providers, this study attempts to better understand the complexities of several factors influencing passenger satisfaction and behavioral intentions. It uses a Structural Equation Modelling approach to develop a series of models that reflects the different groups using transit; captive riders (users who are dependent on transit), choice riders (car owners who choose to take transit), and captive-by-choice riders (users who are dependent on transit but could own a car) are accounted for. The findings from this study are used to define areas where transit agencies can develop specific strategies in order to benchmark user satisfaction with the aim of growing patronage among the different groups. Insight into the perceptions of passengers provides useful information that can help transit agencies understand what inspires customers’ perceptions of satisfaction and loyalty in general.
Transcript of Enjoying loyalty: Tel.: 514-398-4058 Fax:...

Enjoying loyalty: The relationship between service quality, customer satisfaction, and behavioral intentions in public transit Dea van Lieropa & Ahmed El-Geneidya*
aMcGill University: School of Urban Planning, Suite 400, 815 Sherbrooke St. W. Montréal, Québec, H3A 2K6, Canada Tel.: 514-398-4058 Fax: 514-398-8376 For Citation please use: van Lierop, D., & El‐Geneidy A. (2016) Enjoying loyalty: The relationship between service quality, customer satisfaction, and behavioral intentions in public transit. Research in Transportation Economics, 59, 50‐59. Keywords: Satisfaction, loyalty, structural equation modelling, public transit, service attributes
ABSTRACT The relationship between customer satisfaction and loyalty has recently received international attention as transit agencies aim to identify ways to increase ridership. Improvements in perceived service quality increase the attractiveness of transit, and therefore lead to growing patronage. The present paper examines how transit users’ perceptions of service quality and user satisfaction influence loyalty. Using information from five years of customer satisfaction questionnaires collected by two Canadian transit providers, this study attempts to better understand the complexities of several factors influencing passenger satisfaction and behavioral intentions. It uses a Structural Equation Modelling approach to develop a series of models that reflects the different groups using transit; captive riders (users who are dependent on transit), choice riders (car owners who choose to take transit), and captive-by-choice riders (users who are dependent on transit but could own a car) are accounted for. The findings from this study are used to define areas where transit agencies can develop specific strategies in order to benchmark user satisfaction with the aim of growing patronage among the different groups. Insight into the perceptions of passengers provides useful information that can help transit agencies understand what inspires customers’ perceptions of satisfaction and loyalty in general.
1
1. INTRODUCTION The relationship between transit users’ levels of satisfaction and future behavioral intentions has recently received much attention as transit agencies aim to identify ways to increase ridership and cities develop policies aimed at decreasing auto-dependency. Improvements in passengers’ satisfaction with service attributes are believed to increase the attractiveness of transit overall, and grow patronage by increasing ridership frequency and motivating long-term continued usage. Understanding what affects transit users’ levels of satisfaction is vital because it can be used to determine a person’s intention to continue using a service, to increase spending, or to promote the service through word of mouth (Dixon, Freeman, & Toman, 2010). More specifically, as customer satisfaction increases, so does customer loyalty, meaning that satisfied customers are more likely to continue using a service, and also recommend the service to others. Therefore, it is in the best interest of transit agencies to have satisfied and loyal customers as these are the users who are likely to positively affect the growth and profitability of the agency (Heskett, Jones, Loveman, Sasser, & Schlesinger, 2008; Loveman, 1998; Rigby & Ledingham, 2004). While several studies have attempted to understand the determinants of satisfaction and loyalty for particular transit agencies or geographic regions, to our knowledge, no study has attempted to develop a more generalizable framework that is broadly applicable to transit market research. To fill this gap in the literature, the present paper sets out to examine the relationship between satisfaction and loyalty in the two geographically distinct Canadian cities of Montreal, Quebec, and Vancouver, British Columbia with the goal of developing a generalizable framework. The paper begins with a discussion of the theoretical background that is based on a review of the relevant literature. Next, nine hypotheses about the relationships between satisfaction with information, cleanliness, safety, reliability, frequency, overall modal satisfaction and loyalty are presented and followed by a discussion of the data and methods used. Then, the hypotheses are tested and the results are discussed. Finally, based on the discussion of the results, this study defines areas where transit agencies can focus their attention in order to increase user loyalty with the aim of growing patronage among different groups of transit users. 2. THEORETICAL BACKGROUND In recent years, transit market researchers have begun to focus on understanding how to positively influence transit users’ behavioral intentions for the future, and thereby influence users’ loyalty (Shiftan, Barlach, & Shefer, 2015; Tyrinopoulos & Antoniou, 2008; Wen, Lan, & Cheng, 2005). Oliver (1999) defines loyalty as “a deeply held commitment to rebuy or repatronize a preferred product/service consistently in the future” (p. 34). Transit researchers are focusing on increasing their understanding of loyalty as, ultimately, the goal for transit agencies is to increase mode share through rider-retention, an objective that is more likely to be met if passenger loyalty increases. Lai and Chen (2011) reiterate the importance of understanding loyalty in the context of transportation and state that, “by better understanding the passenger behavior marketers and managers of transit systems will be better equipped to develop more appropriate marketing strategies and tailor their products and services to attract new passengers, as well as retain existing ones” (p. 319).
The Transportation Research Board’s (TRB) Transit Cooperative Research Program (TCRP) report on customer satisfaction suggests that transit agencies should analyze satisfaction and loyalty as a way to understand what makes a secure customer. To do this, the report suggests a method for defining who is a secure customer that includes combining individuals’ scores based on their levels of satisfaction, likeliness to repeat, and likeliness to recommend (Transportation Research Board, 1999). However, since this report’s publication date, few papers to our knowledge have assessed loyalty based on a construct that combines both satisfaction and loyalty as was suggested in the report (Conlon, Foote, O'Malley, & Stuart,
2
2001). Instead, the majority of studies focus specifically on understanding the causes of satisfaction in transit users. The limited research on this topic is likely due to the fact that the relationship between (perceived) service quality, customer satisfaction and loyalty can be complex in transportation research (Merkert & Pearson, 2015).
2.1 Satisfaction An early example of determining the causes of satisfaction in transit users was a study of the New York Subway system by Stuart, Mednick, and Bockman (2000) who applied structural equation modelling (SEM) techniques to demonstrate how different service attributes directly and indirectly influence customer satisfaction. These authors called for more detailed SEM analyses in the future, claiming that this method offers a more realistic assessment of customer satisfaction compared to more traditional methods. More recently, Eboli and Mazzulla (2014) analyzed how passengers of regional rail lines in Northern Italy perceive satisfaction with service quality. These authors similarly demonstrated that improving service characteristics such as reliability, frequency, and cleanliness would likely improve overall perception of service quality, thus leading to increased customer satisfaction. These results are echoed by the findings from a study in Granada, Spain, which was based on a large scale survey as well as passengers’ statements about their satisfaction with the quality of service (de Oña, de Oña, Eboli, & Mazzulla, 2013). These authors also analyzed how different service attributes influenced overall perceptions of service and found that service performance, comfort while traveling, and the behavior of the staff were the main factors explaining satisfaction with overall service quality. Other researchers have also examined trip satisfaction across modes, and found that personal characteristics and trip attributes influence overall satisfaction (St-Louis, Manaugh, van Lierop, & El-Geneidy, 2014). 2.2 Loyalty According to TCRP report 49, “customer loyalty is reflected by a combination of attitudes and behaviors. It usually is driven by customer satisfaction, yet also involves a commitment on the part of the customer to make a sustained investment in an ongoing relationship with transit service (p. 18)” (Transportation Research Board, 1999).
Recent research that analyzes customer loyalty does not have a standardized or even common way, to assess loyalty. For example, in a cross-country comparison study, Chou and Kim (2009) used SEM to measure the impact of service quality, corporate image, satisfaction, and customer complaints on loyalty. They assess loyalty through repeat business, willingness to recommend, and price tolerance. In another study, Minser and Webb (2010) used SEM to assess the factors influencing loyalty among customers of the Chicago Transit Authority. These authors defined loyalty based on likeliness to continue to use the service and willingness to recommend, and found that service quality, service value, customer satisfaction directly, as well as problems and agency image indirectly influenced their definition of loyalty. Alternatively, in a recent study assessing loyalty among bus and rail passengers in Israel, Shiftan et al. (2015) found that loyalty towards a mode was affected by how passengers felt about the mode. These authors had a unique definition of loyalty, including satisfaction with service characteristics, but did not include a variable to demonstrate intended use in the future or willingness to recommend. In our study we use a combined measure to define loyalty based on the TCRP report 49 definition above. This framework has also been used by other researchers to understand the impact of improvement strategies on user perception and loyalty (Conlon et al., 2001). Yet, there is no consensus about how loyalty should be measured; while some researchers define loyalty specifically based on users’ likeliness to recommend the service to others and intended future usage (Lai & Chen, 2011; Minser & Webb, 2010; Zhao, Webb, &
3
Shah, 2014), others, as mentioned above, additionally include overall satisfaction with the agency (Figler, Sriraj, Welch, & Yavuz, 2011; Transportation Research Board, 1999), as well as other variables (Carreira, Patrício, Jorge, & Magee, 2014; Shiftan et al., 2015) when developing loyalty constructs. For the purposes of this study, a loyal customer is defined based on his or her overall satisfaction with the service, likeliness to continue using the service in the future and, when available, the likeliness to recommend it to others. 2.3 The groups using transit While this brief review of the literature has revealed how satisfaction and loyalty have been assessed in previous studies, much of the research using SEM assumes that transit users are a homogenous group and researchers often ignore the reality that different groups exist within the larger transit market. In previous segmentation research, transit riders have been categorized into two distinct groups: captive and choice riders. Captive riders are commonly defined as individuals who do not have an alternative transportation choice, while choice riders are those who choose to use transit even though another mode, usually a car, is available to them (Beimborn, Greenwald, & Jin, 2003; Jacques, Manaugh, & El-Geneidy, 2013; Krizek & El-Geneidy, 2007; Wilson, Stevens, & Robinson, 1984). More recently, van Lierop and El-Geneidy (2015) identified an additional group which they coined “captive by choice,” based on the fact that this group does not have access to an additional mode, but financially, are not limited to transit. Acknowledging that there are different groups who use transit is important as the relationships between satisfaction and loyalty may not be consistent among all user types. This idea has been pointed out by dell’Olio, Ibeas, and Cecín (2010) who found that service quality was perceived differently by various types of users. Understanding the existence of different groups is important since it illustrates the benefit of segmenting transit markets before attempting to understand the causes of satisfaction and loyalty. 3. HYPOTHESES Based on a review of the relevant literature, the basic conceptual relationships between different aspects of customer satisfaction and loyalty are presented in Figure 1. These relationships are illustrated in their most rudimentary form and the hypotheses that are tested in this study are listed below. The factors included in the figure are based on the data discussed below and include satisfaction with information, safety, cleanliness, service quality and loyalty for users of both bus and rail. The dashed grey boxes around “satisfaction with quality of information,” “satisfaction with safety,” and “satisfaction with sense of cleanliness” demonstrate that due to data availability only two of the three are modelled for each transit agency that will be discussed in the following section. The hypotheses for each group using transit are:
H1: Transit users’ satisfaction with the quality of information have a positive effect on their satisfaction with the service quality of the bus.
H2: Transit users’ satisfaction with the quality of information have a positive effect on their satisfaction with the service quality of rail.
H3: Transit users’ satisfaction with the sense of safety have a positive effect on their satisfaction with the service quality of the bus.
H4: Transit users’ satisfaction with the sense of safety have a positive effect on their satisfaction with the service quality of the rail.
H5: Transit users’ satisfaction with cleanliness have a positive effect on their satisfaction with the service quality of the bus.

4
H6: Transit users’ satisfaction with cleanliness have a positive effect on their satisfaction with the service quality of rail.
H7: Transit users’ satisfaction with the service quality of bus has a positive effect on their loyalty to transit overall.
H8: Transit users’ satisfaction with the service quality of rail has a positive effect on their loyalty to transit overall.
------------------------------------------------------------------------------------------------ H9: The relationship between factors will vary between captive, choice, and captive by choice users.
Figure 1: General model presenting the conceptual framework of the factors influencing loyalty
4. DATA The data used for this study is obtained from two large public transit agencies in Canada: Montreal’s Société de transport de Montréal (STM) and Vancouver’s TransLink under a data sharing agreement to be used in academic research. In 2011, the population of the Montreal census metropolitan area (CMA) was 3,824,221 with a transit mode share of 22.2 percent for work trips. In Vancouver the CMA was 2,313,328 with 19.7 percent using transit for work trips (Statistics Canada, 2014). The transit agencies in both cities provided the results of ten years of customer satisfaction questionnaires that were conducted three or four times a year using telephone interviews. Because participation was voluntary, non-response bias may be present. In both regions these questionnaires are intended to evaluate how residents perceive the quality of the transit service provided by the transit agencies. They are used by the transit agencies to better understand perception of service quality and also as insight into where changes and/or improvements to service attributes can be accomplished to increase customer satisfaction and, accordingly, increase ridership. To assess customer satisfaction with the transit service, the STM asks survey participants to report their experience with transit in general over the last 30 days. TransLink, however, takes a different approach by asking participants to specifically report their experience of their last and second to last trip. Although both strategies are appropriate for collecting information concerning customer satisfaction, the STM’s approach of asking about individuals’ experiences in general may lack detail, whereas TransLink’s method of asking about the previous trip could result in some individuals reporting irregular travel behavior, which can provide a better picture of the usage of the overall system. The two questionnaires asked similar questions, included several identical ones, and the sample sizes were large, thus the

5
differences in the method of the data collection are not problematic for this study as we only include data that is consistent between the two cities and analyze each region separately.
The STM and TransLink provided data for surveys conducted between the five years of September 2009 and December 2013. Not all questions were asked every year, and therefore inconsistent questions were removed from the database and not included in the analysis. In addition, only individuals who used two transit modes (bus + metro/SkyTrain) in combination are included in the analysis, to ensure that all users experience at least one transfer. The data is not weighted as it would require the sample to have auxiliary information for all transit users in the regions and also did not contain geographic information such as origin and destination points. However, the data is a representative random sample of transit users only, and, according to the STM and TransLink, are representative of the greater population.
Additional data cleaning was required to remove entries that were missing relevant information as well as apparent mistakes in the data such as entries that were too high for the scale provided (e.g. satisfaction 11/10). The surveys asked information including, but not limited to, transit users’ socioeconomic status, personal preferences, perception of satisfaction and travel habits. After data preparations were completed, a total of 2,568 observations were found suitable for the STM analysis and 9,370 for TransLink.
To avoid analyzing all transit users as equal, this paper segments the transit markets based on the categories identified in previous research and recognizes transit users as choice, captive, or captive by choice:
Choice users: Car access Captive users: No car access, low income Captive by choice users: No car access, do not have low income (TransLink >$65,000; STM>$60,000)
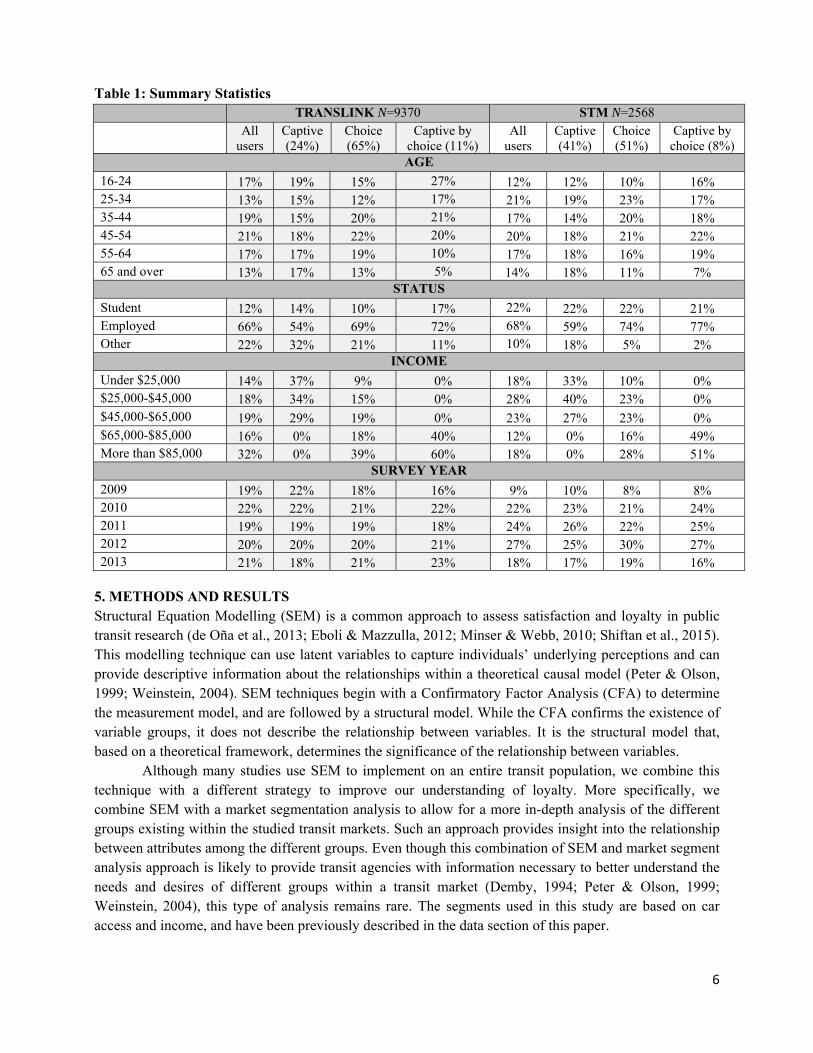
There were 1,063 (41%) captive users, 1,297 (51%) choice users, and 208 (8%) captive-by-choice users for the STM, and 2,228 (24%), 6,055 (65%), and 1,047 (11%) for TransLink respectively. Table 1 presents summary statistics for the sample populations.
6
Table 1: Summary Statistics TRANSLINK N=9370 STM N=2568
All users
Captive (24%)
Choice (65%)
Captive by choice (11%)
All users
Captive (41%)
Choice (51%)
Captive by choice (8%)
AGE
16-24 17% 19% 15% 27% 12% 12% 10% 16% 25-34 13% 15% 12% 17% 21% 19% 23% 17% 35-44 19% 15% 20% 21% 17% 14% 20% 18% 45-54 21% 18% 22% 20% 20% 18% 21% 22% 55-64 17% 17% 19% 10% 17% 18% 16% 19% 65 and over 13% 17% 13% 5% 14% 18% 11% 7%
STATUS
Student 12% 14% 10% 17% 22% 22% 22% 21% Employed 66% 54% 69% 72% 68% 59% 74% 77% Other 22% 32% 21% 11% 10% 18% 5% 2%
INCOME
Under $25,000 14% 37% 9% 0% 18% 33% 10% 0% $25,000-$45,000 18% 34% 15% 0% 28% 40% 23% 0% $45,000-$65,000 19% 29% 19% 0% 23% 27% 23% 0% $65,000-$85,000 16% 0% 18% 40% 12% 0% 16% 49% More than $85,000 32% 0% 39% 60% 18% 0% 28% 51%
SURVEY YEAR
2009 19% 22% 18% 16% 9% 10% 8% 8% 2010 22% 22% 21% 22% 22% 23% 21% 24% 2011 19% 19% 19% 18% 24% 26% 22% 25% 2012 20% 20% 20% 21% 27% 25% 30% 27% 2013 21% 18% 21% 23% 18% 17% 19% 16%
5. METHODS AND RESULTS Structural Equation Modelling (SEM) is a common approach to assess satisfaction and loyalty in public transit research (de Oña et al., 2013; Eboli & Mazzulla, 2012; Minser & Webb, 2010; Shiftan et al., 2015). This modelling technique can use latent variables to capture individuals’ underlying perceptions and can provide descriptive information about the relationships within a theoretical causal model (Peter & Olson, 1999; Weinstein, 2004). SEM techniques begin with a Confirmatory Factor Analysis (CFA) to determine the measurement model, and are followed by a structural model. While the CFA confirms the existence of variable groups, it does not describe the relationship between variables. It is the structural model that, based on a theoretical framework, determines the significance of the relationship between variables.
Although many studies use SEM to implement on an entire transit population, we combine this technique with a different strategy to improve our understanding of loyalty. More specifically, we combine SEM with a market segmentation analysis to allow for a more in-depth analysis of the different groups existing within the studied transit markets. Such an approach provides insight into the relationship between attributes among the different groups. Even though this combination of SEM and market segment analysis approach is likely to provide transit agencies with information necessary to better understand the needs and desires of different groups within a transit market (Demby, 1994; Peter & Olson, 1999; Weinstein, 2004), this type of analysis remains rare. The segments used in this study are based on car access and income, and have been previously described in the data section of this paper.
7
5.1 Exploratory Factor Analysis The first phase of the analysis involved an exploratory factor analysis (EFA) of the captive, choice, and captive by choice users present in the TransLink and STM markets. Tables 2 and 3 show the results of the factor analysis before segmentation was applied to each agency. The factors are based on eigenvalues that are greater than one and the same analysis was applied to every group using transit. Only the results for the homogenous transit markets, or unsegmented datasets, are shown here. However, identical factors with varying factor loadings were uncovered for every group. For TransLink the EFA explained 70.8 percent of the data, and for the STM it was 67.4 percent.
All of the variables included in the analysis are based on questions that were asked using a 10 point Likert-scale. The majority of the questions asked specifically about transit users’ satisfaction with particular aspects of a trip, but in the STM data several questions were answered by stating agreement instead of satisfaction. To be more specific, instead of asking about satisfaction with reliability, the STM asked “What is your level of agreement with the following statement: In the last month, the métro service on the lines that I used was reliable.” This slight difference in wording was not considered problematic for the analysis as the scale remained the same.

8
Table 2: Results from the Exploratory Factor Analysis for TransLink
TransLink Code Factor
Cronbach’s Alpha .842 .826 .820 .825
satisfaction with service quality of bus How would you rate your last/second last bus trip in terms of providing on-time reliable service? BUSRELIAB .845
How would you rate your last/second last bus trip for service overall? BUSOVERAL .805
How would you rate your last/second last bus trip in terms of frequency of service? BUSFREQ .792
How would you rate your last/second last bus trip in terms of trip duration from the time you boarded to the time you got off the bus?
BUSTRIPDUR .515
satisfaction with sense of safety How would you rate your last/second last SkyTrain trip in terms of feeling safe from crime inside the SkyTrain station? SKYSAFESTP .814
How would you rate your last/second last SkyTrain trip in terms of feeling safe from crime onboard the SkyTrain? SKYSAFEON .805
How would you rate your last/second last bus trip in terms of feeling safe from crime at the bus stop where you boarded or at the transit exchange?
BUSSAFSTP .650
How would you rate your last/second last bus trip in terms of feeling safe from crime onboard the bus? BUSSAFON .586
satisfaction with quality of information
How would you rate the transit system for providing adequate information on-board transit vehicles, starting with bus?
BUSONBORDI
NFO .922
How would you rate the transit system for providing adequate information on-board transit vehicles, starting with SkyTrain?
SKYONBORDI
NFO .723
Thinking of the transit system in Greater Vancouver, how would you rate it for providing adequate transit information at stops and stations?
INFOSTO .660
satisfaction with quality of SkyTrain
How would you rate your last/second last SkyTrain trip in terms of providing on-time reliable service? SKYRELIAB .801
How would you rate your last/second last SkyTrain trip in terms of frequency of service? SKYFREQ .801
How would you rate your last/second last trip by SkyTrain in terms of service overall? SKYOVERAL .673

9
Table 3: Results from the Exploratory Factor Analysis for the STM
STM Code Factor
Cronbach’s Alpha .801 .804 .758 .730satisfaction with sense of safety
What is your level of agreement with the following statement: "I feel that the driver drives carefully while respecting traffic regulations."
DRIVCARE
.945
What is your level of satisfaction with the way in which drivers start, drive and stop their buses on the STM bus routes that you use? SATDRIV
.753
What was your level of security at any time you were on the bus? SAFIB .603
What is your level of satisfaction with the courtesy of the drivers during your exchanges with them? SATSERVB
.452
satisfaction with service quality of bus
What is your level of general satisfaction with all aspects of the service when you travelled aboard an STM bus in the last month? SATBUS
.808
What is your level of satisfaction with the frequency or the number of buses on the routes you use? SATPOPAVB
.783
What is your level of satisfaction with the punctuality of the buses that you take? SATPUNCB
.703
satisfaction with cleanliness
What is your level of satisfaction with the cleanliness inside the metro cars? SATCLNCM
.902
What is your level of satisfaction with the cleanliness inside the stations that you use most often? SATCLNSM
.768
What is your level of satisfaction with the cleanliness inside STM buses that you have taken? SATCLNCB
.423
satisfaction with quality of metro
What is your level of general satisfaction with all aspects of the service when you travelled by metro in the past month? SATMET
.758
What is your level of agreement with the following statement: "In the last month, the metro service on the lines that I used was reliable."
RELIABM
.705
What is your level of satisfaction with the frequency or the number of trains? SATPOPAVM
.549
5.2 The Measurement Models (Confirmatory Factor Analyses) Using AMOS 22.0.0, the results of the EFA were confirmed through a Confirmatory Factor Analysis (CFA). Accordingly, the factors in Tables 2 and 3 were used to construct the latent variables present in the measurement models and identified four latent variables for each transit agencies’ data. For TransLink these were “satisfaction with quality of information”, “satisfaction with sense of safety”, “satisfaction with service quality of bus”, and “satisfaction with quality of SkyTrain.” Similarly, for the STM they included “satisfaction with cleanliness”, “satisfaction with sense of safety”, “satisfaction with service quality of

10
bus”, and “satisfaction with quality of metro.” While the service quality factors are similar for both transit agencies, variation exists in the safety variables. In addition, the results reveal that TransLink’s “satisfaction with quality of information” variable and the STM’s “satisfaction with cleanliness” variable are unique to each agency. This is an important finding for SEM research in the field of transport planning as it demonstrates the significance of the input data. For example, in the TransLink survey there were more questions about safety from crime compared to the STM which included a wider set of questions concerning a variety of aspects related to safety. In addition, while the TransLink survey asked several questions relating to information, similar questions were not included in the STM’s survey, and therefore could not be included in the analysis. The reverse is true of questions regarding cleanliness. What these differences demonstrate is that while many recent SEM studies in this field have made claims about which aspects of transit service should be improved based on SEM techniques, this finding should remind researchers that the quality and quantity of survey questions, which are often a reflection of a transit agency’s priorities, are likely lead to different results. Therefore while the findings of the studies mentioned in the literature review are different with regard to which aspects of service quality they suggest to increase loyalty, these results may be context specific, and therefore may not be transferrable to other cities.
The measurement models for each transit agency were assessed through a CFA and deemed to be good fit based on their goodness-of-fit index (GFI: TransLink (T)= .938 & STM (S)= .968), adjusted goodness-of-fit (AGFI: T=.908 & S=.951), comparative fit index (CFI: T=.940 & S=.959), Normed Fit Index (NFI: T=.939 & S=.954) standardized root mean square residual (SRMR: T=.0481 & S=.0502), and the root mean square error of approximation (RMSEA: T=.075 & S=.058) (Hoyle & Panter, 1995; Hu & Bentler, 1999; Kline, 1998; MacCallum, Browne, & Sugawara, 1996).
Item reliability is considered acceptable when all loadings are greater than 0.5 (Hair, Black, Babin, & Anderson, 2010). This criterion is met for all models. In addition, construct reliability meets the criteria to be greater than 0.6 for all models and the average variance extracted is found to have satisfactory values. In addition, all constructs showed values of Cronbach’s Alpha greater than the cut off value of 0.7 (Iacobucci & Duhachek, 2003).
5.3 The loyalty variables To generate the loyalty variable on which the latent variables are tested a loyalty score was computed using variables that were not previously included in the analysis. The previously mentioned “secure customer” framework was used to generate the loyalty variable as suggested by the TCRP report on customer satisfaction (Transportation Research Board, 1999). For TransLink this included the questions: (1) “Based on your own experience in the past [seven/thirty] days, on a scale of one to ten, where ‘10’ means ‘excellent’ and ‘one’ means ‘very poor,’ how would you rate the overall service provided by the transit system in Metro Vancouver?” and (2) “On a scale from 1 – 5 with one being ‘definitely not continue as often’ and 5 being ‘definitely continue as often as am now,’ how likely are you to continue to take transit as often as you do now in the foreseeable future?” And for the STM: (1) “Generally speaking, thinking about your experience with the STM public transit services in the 30 days, what is your level of satisfaction, out of 10, with all aspects of the STM services?”, (2) “For how long are you planning to keep using STM public transit network? A few weeks, a few months, a few years, or many years?”, and (3) “On a scale from one to ten, would you recommend STM services to your friends or your co-workers?”
As is evident, while using the STM allowed for the generation of the loyalty score as recommended by the TCRP report, the fact that TransLink did not ask a question about recommending the service to a friend or co-worker resulted in the use of loyalty score that only included information about

11
overall satisfaction with the service as well as intention to use the service in the future. In each case we first adjusted the scale of each item to be out of ten, and then generated an overall loyalty score comprised of the abovementioned questions, and again adjusted it by taking the average to ensure that this variable would also be on a ten point scale. 5.4 Structural models After assessing the results of the CFA, four structural models for each transit agency were built. This resulted in a total of eight models. For each transit agency one general model was developed using the entire sample of transit users for each transit agency. Then, each agency’s sample was divided into three groups: captive users, choice users, and captive by choice users. Each model tested the hypothetical paths on the sample data and used the maximum likelihood method of estimation to analyze the data (Chen, 2008). The models demonstrate the relationships between the latent variables and the loyalty score. For TransLink the models test how satisfaction with information and safety influence continued future use via satisfaction with the service quality of each mode. Because of the results of the factor analysis presented in Table 3, the STM model tests cleanliness instead of information.
The structural models presented in Figures 2 and 3 show good model fit. The findings for the general models are presented above, and those for the captive, choice, and captive by choice models are shown the tables below. All values exceed the recommended levels and are higher than those used by many the field (Chen, 2008; de Oña et al., 2013; Eboli & Mazzulla, 2014; Githui, Okamura, & Nakamura, 2010).
Figure 2: Structural model for TransLink

12
Figure 3: Structural model for the STM The findings presented in Tables 4 and 5 demonstrate that the nine hypotheses presented in Figure 1 are positive and significant for all models. The findings exhibit that transit users’ satisfaction with the quality of service relating to safety, information, and cleanliness have a positive effect on their satisfaction with mode specific characteristics which, in turn, have a significant positive effect on loyalty. Safety appears to be the most important, and these findings are similar to previous research (Figler et al., 2011; Lai & Chen, 2011; Minser & Webb, 2010; Zhao et al., 2014). In addition, cleanliness, information and other service characteristics such as punctuality and frequency have similarly been cited to influence satisfaction and loyalty (Carreira et al., 2014; de Oña et al., 2013; Mouwen, 2015; Tyrinopoulos & Antoniou, 2008; Weinstein, 2000).

13
Table 4: Model results: TransLink
TRANSLINK ALL USERS CAPTIVE CHOICE
CAPTIVE BY CHOICE
Estimate S.E. P
Estimate S.E. P
Estimate S.E. P
Estimate S.E. P
Am
ong
cons
truc
ts
BUS <--- INFO 0.332 0.012 *** 0.278 0.024 *** 0.346 0.015 *** 0.315 0.04 *** SKYTRAIN <--- INFO 0.203 0.009 *** 0.165 0.017 *** 0.217 0.012 *** 0.197 0.026 *** BUS <--- SAFETY 0.381 0.016 *** 0.437 0.032 *** 0.381 0.02 *** 0.308 0.049 *** SKYTRAIN <--- SAFETY 0.603 0.014 *** 0.666 0.026 *** 0.58 0.017 *** 0.58 0.037 *** LOYALTY <--- BUS 0.308 0.01 *** 0.308 0.019 *** 0.308 0.012 *** 0.285 0.027 *** LOYALTY <--- SKYTRAIN 0.365 0.012 *** 0.339 0.026 *** 0.383 0.015 *** 0.326 0.042 ***
Am
ong
item
s
and
cons
truc
ts
BUSOVERAL <--- BUS 0.82 --- --- 0.814 --- --- 0.819 --- --- 0.837 --- --- BUSTRIPDUR <--- BUS 0.635 0.011 *** 0.634 0.022 *** 0.648 0.014 *** 0.561 0.034 *** BUSFREQ <--- BUS 0.772 0.014 *** 0.798 0.027 *** 0.765 0.017 *** 0.753 0.042 *** BUSRELIAB <--- BUS 0.807 0.013 *** 0.827 0.026 *** 0.799 0.016 *** 0.811 0.041 *** SKYOVERAL <--- SKYTRAIN 0.775 --- --- 0.77 --- --- 0.785 --- --- 0.727 --- --- SKYFREQ <--- SKYTRAIN 0.77 0.014 *** 0.799 0.029 *** 0.761 0.016 *** 0.756 0.051 *** SKYRELIAB <--- SKYTRAIN 0.801 0.013 *** 0.821 0.028 *** 0.795 0.015 *** 0.796 0.049 *** SKYSAFEON <--- SAFETY 0.766 --- --- 0.778 --- --- 0.759 --- --- 0.771 --- --- BUSSAFSTP <--- SAFETY 0.729 0.014 *** 0.732 0.026 *** 0.739 0.017 *** 0.677 0.044 *** BUSSAFON <--- SAFETY 0.713 0.012 *** 0.73 0.024 *** 0.711 0.015 *** 0.694 0.039 *** SKYSAFESTP <--- SAFETY 0.741 0.014 *** 0.75 0.028 *** 0.738 0.018 *** 0.726 0.046 *** BUSONBORDINFO <--- INFO 0.841 --- --- 0.87 --- --- 0.834 --- --- 0.814 --- --- INFOSTO <--- INFO 0.73 0.012 *** 0.736 0.022 *** 0.739 0.015 *** 0.654 0.041 *** SKYONBORDINFO <--- INFO 0.766 0.012 *** 0.792 0.022 *** 0.759 0.014 *** 0.759 0.041 ***

14
Table 5: Model results: STM
STM ALL USERS CAPTIVE CHOICE
CAPTIVE BY CHOICE
Estimate S.E. P
Estimate S.E. P
Estimate S.E. P
Estimate S.E. P
Am
ong
co
nstr
ucts
BUS <--- CLEANLINESS 0.138 0.026 *** 0.129 0.04 *** 0.129 0.036 *** 0.338 0.105 ***
METRO <--- CLEANLINESS 0.334 0.023 *** 0.272 0.034 *** 0.362 0.032 *** 0.512 0.089 ***
BUS <--- SAFETY 0.566 0.03 *** 0.607 0.049 *** 0.54 0.04 *** 0.393 0.122 *** METRO <--- SAFETY 0.445 0.025 *** 0.52 0.039 *** 0.396 0.033 *** 0.362 0.098 *** LOYALTY <--- BUS 0.297 0.014 *** 0.324 0.023 *** 0.267 0.02 *** 0.349 0.051 *** LOYALTY <--- METRO 0.537 0.02 *** 0.529 0.034 *** 0.544 0.026 *** 0.507 0.062 ***
Am
ong
item
s
and
cons
truc
ts
SATBUS <--- BUS 0.817 --- --- 0.816 --- --- 0.813 --- --- 0.865 --- --- SATPOPAVB <--- BUS 0.756 0.027 *** 0.763 0.042 *** 0.76 0.039 *** 0.697 0.09 *** SATPUNCB <--- BUS 0.714 0.028 *** 0.712 0.042 *** 0.71 0.041 *** 0.739 0.093 *** SATMET <--- METRO 0.755 --- --- 0.725 --- --- 0.767 --- --- 0.799 --- --- SATPOPAVM <--- METRO 0.627 0.028 *** 0.595 0.045 *** 0.655 0.039 *** 0.59 0.087 *** RELIABM <--- METRO 0.684 0.034 *** 0.664 0.056 *** 0.685 0.046 *** 0.771 0.114 *** SATDRIV <--- SAFETY 0.773 --- --- 0.759 --- --- 0.792 --- --- 0.748 --- --- SAFIB <--- SAFETY 0.663 0.021 *** 0.685 0.034 *** 0.634 0.027 *** 0.725 0.071 *** DRIVCARE <--- SAFETY 0.798 0.024 *** 0.799 0.038 *** 0.812 0.032 *** 0.717 0.089 *** SATSERVB <--- SAFETY 0.633 0.027 *** 0.613 0.045 *** 0.641 0.035 *** 0.706 0.107 ***
SATCLNCM <--- CLEANLINESS 0.801 --- --- 0.785 --- --- 0.819 --- --- 0.791 --- ---
SATCLNCB <--- CLEANLINESS 0.557 0.024 *** 0.551 0.041 *** 0.546 0.033 *** 0.663 0.077 ***
SATCLNSM <--- CLEANLINESS 0.813 0.029 *** 0.811 0.048 *** 0.808 0.039 *** 0.838 0.089 ***
6. DISCUSSION AND POLICY RECOMMENDATIONS 6.1 General models The results demonstrate that transit users’ satisfaction with sense of safety positively influences satisfaction with the service quality of bus and SkyTrain/metro in both the general models for the STM and TransLink. However, for TransLink, the impact is higher for safety on SkyTrain than it is on bus, whereas for the STM it is the opposite. This difference is no surprise considering the variation in the items included in the safety latent constructs for each agency. For TransLink’s general model, satisfaction with the quality of information has a stronger effect on satisfaction with the service quality of bus than SkyTrain. This finding makes sense considering that bus systems generally are more complex and difficult to navigate compared to rail systems due to their size and inherent flexibility. In both the general TransLink and STM models, satisfaction with the service quality of both modes has a significant positive impact on loyalty. Most importantly, however, both models show that the impact of being satisfied with rail (SkyTrain or metro) is stronger than bus. This means that for transit users who take both modes, the quality of their experience using the SkyTrain or metro has a greater influence on their loyalty to the system compared to their experience using the bus. Therefore, service improvements are needed to increase users’ satisfaction with bus services.
15
6.2 Comparing models: Captive, choice, and captive by choice It is important for transit agencies to recognize that different factors influence the loyalty of captive, choice, and captive by choice users. Based on a comparison of the results for the different groups, the TransLink models revealed that captive users’ satisfaction with mode specific services is influenced less by the quality of information than choice and captive by choice users. In contrast, captive users’ satisfactions with mode-specific services are influenced more by safety than are the other groups. This finding is expected as captive users rely on the transit system and are likely to be familiar with it and value safety as they do not have the opportunity to switch to using an alternative mode. Another important difference between the models is that while for all groups loyalty is influenced more greatly by the service quality of the SkyTrain and the bus, this is less so for captive users. This might be because captive users in Vancouver live farther from the SkyTrain due to lower housing costs (Foth, 2010) and, therefore, may be more dependent on the bus network.
The findings for the STM are similar to those of TransLink. Firstly, the importance of safety is the highest for captive users. More specifically, satisfaction with mode specific services is influenced less by cleanliness than safety. This finding demonstrates that safety is an important issue for passengers of both transit agencies, a finding that is similar to other studies (Githui et al., 2010). Specific strategies have been suggested by Yavuz and Welch (2010) who claim that transit users’ perception of safety can be improved by increasing the presence of police, installing surveillance video cameras and by making the service more reliable. In addition, Carreira et al. (2014) find that users’ trust in bus drivers’ skills influence their perception of transit. Furthermore, the results of the present study demonstrate that captive by choice users are the least influenced by safety and while satisfaction with cleanliness has a greater impact on satisfaction with the service quality of the metro than the bus, the difference is most strongly observed for choice users. As in the TransLink sample, the STM’s sample also shows that satisfaction with the service quality of the metro has a greater influence on future use than satisfaction with the service quality of the bus. Again, this effect is not as strong for captive users who compared to choice and captive by choice riders, are the least influenced by the service quality of the metro, showing that the service quality of bus services is also important for them.
These results demonstrate that system improvement strategies which focus on a particular aspect of service quality will influence the loyalty of the groups in different ways. In addition, system improvements that are targeted at choice and captive by choice users are important not only to benefit these groups, but also to improve the experience of using transit for captive users. In other words, a service improvement targeted at a specific group could motivate ridership among others as well. 6.3 Improvement strategies Based on the results of both the general and group specific models several areas can be identified as being essential to increase loyalty among transit users. In this section we will discuss the strategies that can be adopted by transit agencies to increase user satisfaction and loyalty. Increasing loyalty is expected to increase patronage among the different groups. Table 6 provides a summary of the effectiveness of implementing strategies for the different groups using transit. 6.3.1 Service quality of bus As the models indicate (Tables 4 and 5), service quality with rail (SkyTrain/metro) is more influential than service quality with bus services when it comes to influencing future use and gaining loyal transit customers. However, because of the significant cost savings associated with developing comprehensive bus networks compared to rail, transit agencies should work to develop more enjoyable bus services by
16
attempting to integrate rail-like features. In other words, bus systems should be built to enhance travelers’ experiences over time by implementing service improvements gradually (Diab & El-Geneidy, 2015), and strategies should be developed to assess how satisfied transit users are with bus services in detail. 6.3.2 Reliability With regard to improving other aspects of service quality, the results of this study show that for both TransLink and the STM metro/SkyTrain reliability is more influential than frequency in predicting users’ overall satisfaction with the service quality of the metro. For TransLink, this is also true for all bus users. Unfortunately, since the STM assesses transit users’ satisfaction with punctuality rather than reliability, this information is unknown. However, because of the consistencies for all groups in TransLink and metro users in the STM, we assume that in general a reliable service is more important for increasing satisfaction with the service quality of a mode than is the frequency of the service. Recent research has highlighted the importance of service reliability, demonstrating that transit agencies wishing to increase their customers’ levels of satisfaction should focus on developing a consistently reliable service (Chakrabarti & Giuliano, 2015). 6.3.3 Safety The findings on safety demonstrate that transit agencies should ensure that users’ perceptions of safety should be increased in order to positively influence overall mode satisfaction and loyalty. As previously discussed in this paper, the results of this study demonstrate that satisfaction with safety is more important than satisfaction with either cleanliness or information. More specifically, for the STM the way that the driver operates the bus is the most influential aspect characterizing safety. This means that bus users value drivers who operate vehicles carefully while respecting traffic regulations, as well those who skillfully start, drive, and stop their buses. This is especially true for choice riders compared to the other groups using transit. Although for captive and captive by choice riders, the drivers’ way of operating a vehicle is also important in defining safety, compared to choice riders these groups are more influenced by the level of security inside the bus as well as the level of satisfaction with the courtesy of the driver during personal exchanges. TransLink’s customer satisfaction survey asked participants less detailed information about safety. However, the results of the analysis show that safety on the SkyTrain is most representative of the overall sense of safety of all groups. Regardless, the factor loadings associated with all aspects of safety are higher for captive users than they are for choice users, which in turn tend to be higher than those for captive by choice users. Possible interventions to increase users’ satisfaction with safety include the implementation of services such as the STM’s in between stops services for women travelling alone in the evenings and at night, the application of safety features such as automatic platform gates at rail stations, the development of dedicated lanes for safe and smooth driving conditions, as well as those previously mentioned by Yavuz and Welch (2010) that include improved surveillance measures.
6.3.4 Information Transit agencies should be aware that on board information, rather than information at transit stops, contributes more to the overall satisfaction with the quality of information. The results also demonstrate that information about transit services is not as relevant for captive users compared to other groups. Transit agencies wishing to ensure that customers feel comfortable with the system should ensure that information is both accessible and accurate for all users regardless of socioeconomic background, languages spoken, or physical and mental ability.
17
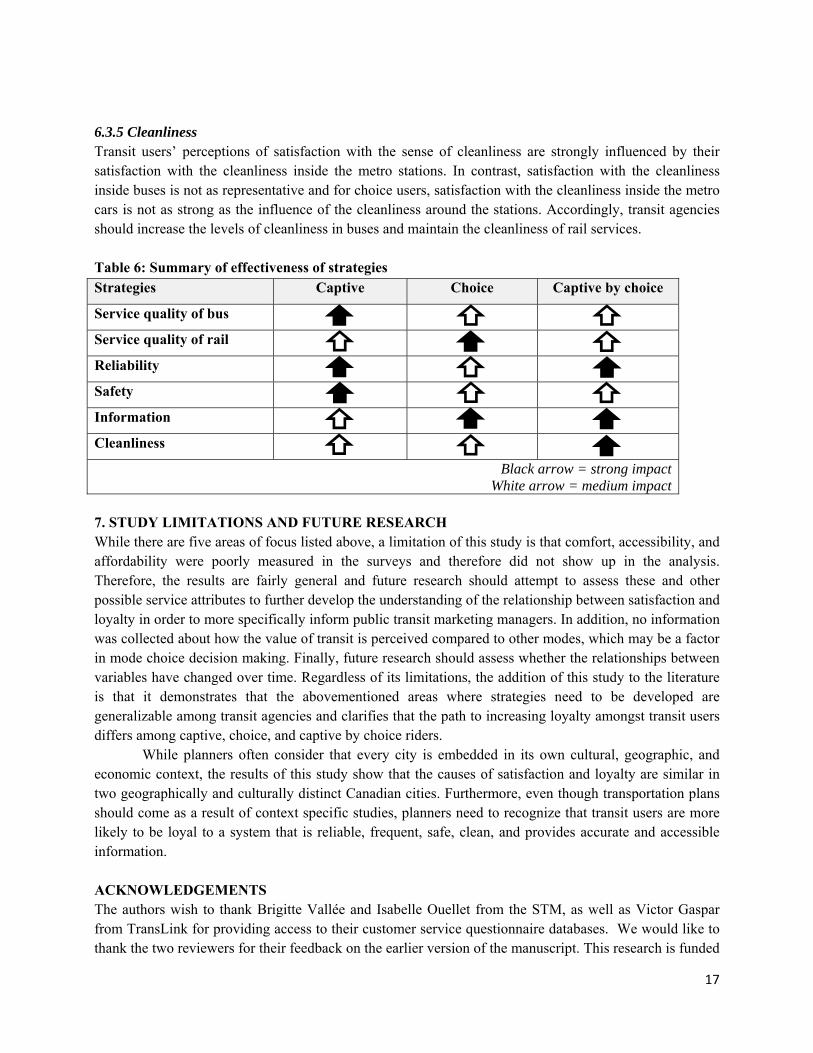
6.3.5 Cleanliness Transit users’ perceptions of satisfaction with the sense of cleanliness are strongly influenced by their satisfaction with the cleanliness inside the metro stations. In contrast, satisfaction with the cleanliness inside buses is not as representative and for choice users, satisfaction with the cleanliness inside the metro cars is not as strong as the influence of the cleanliness around the stations. Accordingly, transit agencies should increase the levels of cleanliness in buses and maintain the cleanliness of rail services. Table 6: Summary of effectiveness of strategies Strategies Captive Choice Captive by choice
Service quality of bus
Service quality of rail
Reliability
Safety
Information
Cleanliness
Black arrow = strong impact White arrow = medium impact
7. STUDY LIMITATIONS AND FUTURE RESEARCH While there are five areas of focus listed above, a limitation of this study is that comfort, accessibility, and affordability were poorly measured in the surveys and therefore did not show up in the analysis. Therefore, the results are fairly general and future research should attempt to assess these and other possible service attributes to further develop the understanding of the relationship between satisfaction and loyalty in order to more specifically inform public transit marketing managers. In addition, no information was collected about how the value of transit is perceived compared to other modes, which may be a factor in mode choice decision making. Finally, future research should assess whether the relationships between variables have changed over time. Regardless of its limitations, the addition of this study to the literature is that it demonstrates that the abovementioned areas where strategies need to be developed are generalizable among transit agencies and clarifies that the path to increasing loyalty amongst transit users differs among captive, choice, and captive by choice riders.
While planners often consider that every city is embedded in its own cultural, geographic, and economic context, the results of this study show that the causes of satisfaction and loyalty are similar in two geographically and culturally distinct Canadian cities. Furthermore, even though transportation plans should come as a result of context specific studies, planners need to recognize that transit users are more likely to be loyal to a system that is reliable, frequent, safe, clean, and provides accurate and accessible information. ACKNOWLEDGEMENTS The authors wish to thank Brigitte Vallée and Isabelle Ouellet from the STM, as well as Victor Gaspar from TransLink for providing access to their customer service questionnaire databases. We would like to thank the two reviewers for their feedback on the earlier version of the manuscript. This research is funded
18
by the Social Sciences and Humanities Research Council. Finally, the authors would like to acknowledge the members of TRAM research group for their feedback as well as the anonymous reviewers for their comments that helped to improve the study. The ideas and findings presented in this paper represent the authors’ views in an academic exercise.
REFERENCES
Beimborn, E., Greenwald, M., & Jin, X. (2003). Accessibility, connectivity, and captivity: Impacts on transit choice. Transportation Research Record: Journal of the Transportation Research Board, 1835(1), 1‐9.
Carreira, R., Patrício, L., Jorge, R., & Magee, C. (2014). Understanding the travel experience and its impact on attitudes, emotions and loyalty towards the transportation provider–A quantitative study with mid‐distance bus trips. Transport Policy, 31, 35‐46.
Chakrabarti, S., & Giuliano, G. (2015). Does service reliability determine transit patronage? Insights from the Los Angeles Metro bus system. Transport Policy, 42, 12‐20.
Chen, C. (2008). Investigating structural relationships between service quality, perceived value, satisfaction, and behavioral intentions for air passengers: Evidence from Taiwan. Transportation Research Part A: Policy and Practice, 42(4), 709‐717.
Chou, J., & Kim, C. (2009). A structural equation analysis of the QSL relationship with passenger riding experience on high speed rail: An empirical study of Taiwan and Korea. Expert Systems with Applications, 36(3), 6945‐6955.
Conlon, M., Foote, P., O'Malley, K., & Stuart, D. (2001). Successful arterial street limited‐stop express bus service in Chicago. Transportation Research Record: Journal of the Transportation Research Board(1760), 74‐80.
de Oña, J., de Oña, R., Eboli, L., & Mazzulla, G. (2013). Perceived service quality in bus transit service: A structural equation approach. Transport Policy, 29, 219‐226.
dell’Olio, L., Ibeas, A., & Cecín, P. (2010). Modelling user perception of bus transit quality. Transport Policy, 17(6), 388‐397. doi: http://dx.doi.org/10.1016/j.tranpol.2010.04.006
Demby, E. (1994). Psychographics revisited: The birth of a technique. Marketing Research, 6, 26‐26. Diab, E., & El‐Geneidy, A. (2015). Transitory optimism: Changes in passenger perception following bus
service improvement over time. Transportation Research Record, 2415, 97‐106. Dixon, M., Freeman, K., & Toman, N. (2010). Stop trying to delight your customers. Harvard Business
Review, 88(7/8), 116‐122. Eboli, L., & Mazzulla, G. (2012). Structural equation modelling for analysing passengers’ perceptions
about railway services. Procedia‐Social and Behavioral Sciences, 54, 96‐106. Eboli, L., & Mazzulla, G. (2014). Relationships between rail passengers’ satisfaction and service quality: a
framework for identifying key service factors. Public Transport, 1‐17. Figler, S., Sriraj, P., Welch, E., & Yavuz, N. (2011). Customer loyalty and Chicago, Illinois, Transit Authority
buses: Results from 2008 Customer Satisfaction Survey. Transportation Research Record: Journal of the Transportation Research Board(2216), 148‐156.
Foth, N. (2010). Long‐Term Change Around SkyTrain Stations in vancouver, Canada: A Demographic Shift‐Share Analysis. The Geographical Bulletin, 51, 37‐52.
Githui, J., Okamura, T., & Nakamura, F. (2010). The structure of users’ satisfaction on urban public transport service in developing country: The case of Nairobi. The Journal of the Eastern Asia Society for Transport Studies, 8.
Hair, J., Black, W., Babin, B., & Anderson, R. (2010). Multivariate data analysis (7th ed.). Upper Saddle River, NJ: Prentice‐Hall, Inc.
19
Heskett, J., Jones, T., Loveman, G., Sasser, W., & Schlesinger, L. (2008). Putting the service‐profit chain to work. Harvard Business Review.
Hoyle, R., & Panter, A. (1995). Writing about structural equation models. In R. Hoyle (Ed.), Structural equation modeling: Concepts, issues, and applications (pp. 158‐176). Thousand Oaks, CA: Sage Publications.
Hu, L., & Bentler, P. (1999). Cutoff criteria for fit indexes in covariance structure analysis: Conventional criteria versus new alternatives. Structural equation modeling: a multidisciplinary journal, 6(1), 1‐55.
Iacobucci, D., & Duhachek, A. (2003). Advancing alpha: Measuring reliability with confidence. Journal of consumer psychology, 13(4), 478‐487.
Jacques, C., Manaugh, K., & El‐Geneidy, A. (2013). Rescuing the captive [mode] user: An alternative approach to transport market segmentation. Transportation, 40(3), 625‐645.
Kline, R. B. (1998). Principles and practices of structural equation modeling. New York, NY: Guilford Press. Krizek, K., & El‐Geneidy, A. (2007). Segmenting preferences and habits of transit users and non‐users.
Journal of Public Transportation, 10(3), 71. Lai, W., & Chen, C. (2011). Behavioral intentions of public transit passengers—The roles of service
quality, perceived value, satisfaction and involvement. Transport Policy, 18(2), 318‐325. Loveman, G. (1998). Employee satisfaction, customer loyalty, and financial performance an empirical
examination of the service profit chain in retail banking. Journal of Service Research, 1(1), 18‐31. MacCallum, R., Browne, M., & Sugawara, H. (1996). Power analysis and determination of sample size for
covariance structure modeling. Psychological methods, 1(2), 130. Merkert, R., & Pearson, J. (2015). A non‐parametric efficiency measure incorporating perceived airline
service levels and profitability. Journal of Transport Economics and Policy, 49(2), 261‐275. Minser, J., & Webb, V. (2010). Quantifying the Benefits: Application of customer loyalty modeling in
public transportation context. Transportation Research Record: Journal of the Transportation Research Board, 2144(1), 111‐120.
Mouwen, A. (2015). Drivers of customer satisfaction with public transport services. Transportation Research Part A: Policy and Practice, 78, 1‐20.
Oliver, R. (1999). Whence consumer loyalty? the Journal of Marketing, 33‐44. Peter, J., & Olson, J. (1999). Consumer behavior and marketing strategy (Eighth ed.): McGraw‐Hill
London. Rigby, D., & Ledingham, D. (2004). CRM done right. Harvard Business Review, 82(11), 118‐130. Shiftan, Y., Barlach, Y., & Shefer, D. (2015). Measuring Passenger Loyalty to Public Transport Modes.
Journal of Public Transportation, 18(1), 7. St‐Louis, E., Manaugh, K., van Lierop, D., & El‐Geneidy, A. (2014). The happy commuter: A comparison of
commuter satisfaction across modes. Transportation research part F: traffic psychology and behaviour, 26, 160‐170.
Statistics Canada. (2014). Focus on Geography Series, 2011 Census. Retrieved 21 July 2014, 2014 Stuart, K., Mednick, M., & Bockman, J. (2000). Structural equation model of customer satisfaction for the
New York City subway system. Transportation Research Record: Journal of the Transportation Research Board(1735), 133‐137.
Transportation Research Board. (1999). A Handbook for Measuring Customer Satisfaction and Service Quality (Vol. 47). Washington, DC: Transportation Research Board: United States Federal Transit Administration.
Tyrinopoulos, Y., & Antoniou, C. (2008). Public transit user satisfaction: Variability and policy implications. Transport Policy, 15(4), 260‐272.

20
van Lierop, D., & El‐Geneidy, A. (2015). Getting committed: A new perspective on public transit market segmentation from two Canadian cities. Paper presented at the 94th Annual Meeting of the Transportation Research Board.
Weinstein, A. (2000). Customer satisfaction among transit riders: How customers rank the relative importance of various service attributes. Transportation Research Record: Journal of the Transportation Research Board(1735), 123‐132.
Weinstein, A. (2004). Handbook of market segmentation: Strategic targeting for business and technology firms: Routledge.
Wen, C., Lan, L., & Cheng, H. (2005). Structural equation modeling to determine passenger loyalty toward intercity bus services. Transportation Research Record: Journal of the Transportation Research Board, 1927(1), 249‐255.
Wilson, F., Stevens, A., & Robinson, J. (1984). Identifying mode choice constrained urban travel market segments. Canadian Journal of Civil Engineering, 11(4), 924‐932.
Yavuz, N., & Welch, E. (2010). Addressing fear of crime in public space: Gender differences in reaction to safety measures in train transit. Urban studies.
Zhao, J., Webb, V., & Shah, P. (2014). Customer loyalty differences between captive and choice transit riders. Transportation Research Record: Journal of the Transportation Research Board(2415), 80‐88.