Enhancing Underground Visual Place Recognition with ... · Enhancing Underground Visual Place...
10
Enhancing Underground Visual Place Recognition with Shannon Entropy Saliency Fan Zeng 1 , Adam Jacobson 1 , David Smith 2 , Nigel Boswell 2 , Thierry Peynot 1 , Michael Milford 1 1 Queensland University of Technology, Australia 2 Caterpillar, Inc. 1 [email protected] * Abstract Autonomous vehicles are increasingly being used in the underground mining industry, but competition and a challenging market is plac- ing pressure for further improvements in au- tonomous vehicle technology with respect to cost, infrastructure requirements, robustness in varied environments and versatility. In this pa- per we introduce several new vision-based tech- niques for visual place recognition on under- ground mining vehicles that improve on cur- rent available technologies while only requiring camera input. We present a Shannon Entropy- based salience generation approach that en- hances the performance of single image-based place recognition by selectively processing im- age regions. We then add a learning-based scheme realised by Support Vector Machines (SVMs) that filters problematic images from both the reference map databases and from live processing. We evaluate the approaches on new large real-world underground vehicle min- ing datasets, demonstrating ∼107% improve- ment in area under the precision-recall curve than a state-of-the-art place recognition algo- rithm, and demonstrate its generality on a non- mining-based benchmark dataset. Together this research serves as a step forward in de- veloping domain-appropriate improvements to existing state-of-the-art place recognition algo- rithms that will hopefully lead to improved ef- ficiencies in the mining industry. * This research was supported by an Advance Queensland Innovation Partnerships grant from the Queensland Govern- ment, Mining3, Caterpillar and the Queensland University of Technology. MM also received support from an ARC Future Fellowship FT140101229. 1 Introduction The mining industry is one of the major contributors to the Australian economy, with underground mining playing an increasingly significant part. After its ini- tial construction, the daily operation of an underground mine site typically involves workers driving heavy vehi- cles such as load-haul-dump (LHD) loaders inside un- derground mine tunnels (Fig. 1a) to perform various manoeuvres such as digging (Fig. 1b) and transporting. Automating some or all of these tasks can reduce hu- man labour and error, making the mine site safer and more productive. One of the keys to complete automa- tion is reliable localisation of the mining vehicle in the underground environment, where a commonly-adopted source of localisation information - the Global Position- ing System (GPS) is not available. Existing underground localisation technologies mostly depend on either Re- ceived Signal Strength Indicator (RSSI) [Liu et al., 2010; Rohrig and Muller, 2009] or Time of Arrival (ToA) based [Sathyan et al., 2011] trilateration systems. The widely deployed state-of-the-art, including Wireless Sensor Net- works (WSNs) [Moridi et al., 2015; Li and Liu, 2009] and Radio-Frequency IDentifications (RFIDs) [Rusu and Hayes, 2011; Kent, 2011; Zhou and Shi, 2009], can be less reliable due to interference from the rock mass, and typically require substantial initial investment in time and infrastructure, e.g., setting up mesh of beacons such as Wireless Local Area Network (WLAN) Access Points (APs), and characterizing wireless propagation param- eters such as pathloss [Forooshani et al., 2013]. The initial cost grows with the size of the mine site, eventu- ally making these localisation systems difficult and ex- pensive to maintain. In addition, for better localisation performance, the beacon density needs to be increased accordingly, as shown in the RFID-based underground mine localisation field test in [Lavigne and Marshall, 2012]. A low-cost plug-and-play localisation technology that dynamically builds up the map without asking for help from human operators is more desirable. Like in other domains, vision sensors such as cameras are at-
Transcript of Enhancing Underground Visual Place Recognition with ... · Enhancing Underground Visual Place...

Enhancing Underground Visual Place Recognition with ShannonEntropy Saliency
Fan Zeng1, Adam Jacobson1, David Smith2, Nigel Boswell2, Thierry Peynot1, Michael Milford1
1Queensland University of Technology, Australia2Caterpillar, Inc.
Abstract
Autonomous vehicles are increasingly beingused in the underground mining industry, butcompetition and a challenging market is plac-ing pressure for further improvements in au-tonomous vehicle technology with respect tocost, infrastructure requirements, robustness invaried environments and versatility. In this pa-per we introduce several new vision-based tech-niques for visual place recognition on under-ground mining vehicles that improve on cur-rent available technologies while only requiringcamera input. We present a Shannon Entropy-based salience generation approach that en-hances the performance of single image-basedplace recognition by selectively processing im-age regions. We then add a learning-basedscheme realised by Support Vector Machines(SVMs) that filters problematic images fromboth the reference map databases and fromlive processing. We evaluate the approaches onnew large real-world underground vehicle min-ing datasets, demonstrating ∼107% improve-ment in area under the precision-recall curvethan a state-of-the-art place recognition algo-rithm, and demonstrate its generality on a non-mining-based benchmark dataset. Togetherthis research serves as a step forward in de-veloping domain-appropriate improvements toexisting state-of-the-art place recognition algo-rithms that will hopefully lead to improved ef-ficiencies in the mining industry.
∗This research was supported by an Advance QueenslandInnovation Partnerships grant from the Queensland Govern-ment, Mining3, Caterpillar and the Queensland University ofTechnology. MM also received support from an ARC FutureFellowship FT140101229.
1 Introduction
The mining industry is one of the major contributorsto the Australian economy, with underground miningplaying an increasingly significant part. After its ini-tial construction, the daily operation of an undergroundmine site typically involves workers driving heavy vehi-cles such as load-haul-dump (LHD) loaders inside un-derground mine tunnels (Fig. 1a) to perform variousmanoeuvres such as digging (Fig. 1b) and transporting.Automating some or all of these tasks can reduce hu-man labour and error, making the mine site safer andmore productive. One of the keys to complete automa-tion is reliable localisation of the mining vehicle in theunderground environment, where a commonly-adoptedsource of localisation information - the Global Position-ing System (GPS) is not available. Existing undergroundlocalisation technologies mostly depend on either Re-ceived Signal Strength Indicator (RSSI) [Liu et al., 2010;Rohrig and Muller, 2009] or Time of Arrival (ToA) based[Sathyan et al., 2011] trilateration systems. The widelydeployed state-of-the-art, including Wireless Sensor Net-works (WSNs) [Moridi et al., 2015; Li and Liu, 2009]
and Radio-Frequency IDentifications (RFIDs) [Rusu andHayes, 2011; Kent, 2011; Zhou and Shi, 2009], can beless reliable due to interference from the rock mass, andtypically require substantial initial investment in timeand infrastructure, e.g., setting up mesh of beacons suchas Wireless Local Area Network (WLAN) Access Points(APs), and characterizing wireless propagation param-eters such as pathloss [Forooshani et al., 2013]. Theinitial cost grows with the size of the mine site, eventu-ally making these localisation systems difficult and ex-pensive to maintain. In addition, for better localisationperformance, the beacon density needs to be increasedaccordingly, as shown in the RFID-based undergroundmine localisation field test in [Lavigne and Marshall,2012]. A low-cost plug-and-play localisation technologythat dynamically builds up the map without asking forhelp from human operators is more desirable. Like inother domains, vision sensors such as cameras are at-

tractive because they provide rich information with highreplaceability, small foot-print and minimal disturbanceor interference to the mine site.
(a) (b) (c)
(d) (e) (f)
Figure 1: (a) A photo of a load-haul-dump (LHD) loaderon underground mine site. (Source: Caterpillar.) (b)A clear photo taken by camera mounted on an LHDloader. (c) Photo taken when LHD loader is travellingthrough dust in a tunnel. (d-f) SESAME algorithm re-moves inconspicuous image patches from query image (d)according to information entropy metric (e), like sprin-kled sesames (f).
Underground mine tunnels offer unique challenges forvisual place recognition, however. First, unlike street orindoor environments where abundant feature-rich land-marks provide useful cues for localisation, the lack of fea-ture inside the tunnels creates perceptual aliasing thatdramatically reduces the reliability of feature-based vi-sual place recognition systems. Second, inevitable dust(Fig. 1c) generation not only blocks useful landmarksbut also forms transient false features that compromiseplace recognition accuracy. Last but not least, the cam-era can occasionally be overwhelmed with partial or com-plete blockage, interference such as head-lights from an-other vehicle, sparks generated during the mining pro-cess and so on. We start to tackle these challenges bynoting that some image pixels are useful because theycorrespond to salient landmarks. Conversely, some pixelscontain little useful information (Figs. 1d to 1e). Pixelsthat correspond to transient features can even contributenegatively. In the research we show that removing suchpixels (Fig. 1f) not only saves computation resources,but also improves the performance of the undergroundplace recognition system. On a mine site dataset, ∼8.8%improvement over the holistic single-image-comparisonapproach has been observed. The generality of this tech-nique has also been demonstrated with a ∼40% improve-ment on a completely different dataset.
The paper proceeds as follows. Section II reviews pre-vious works on confined space localisation and relevant
literature on saliency-based computer vision algorithms.Section III elaborates the detailed implementations ofvarious components in our approach. Section IV givesthe configurations of experimental set-up to verify ourapproach on a mine site and a benchmark dataset, withthe results of experiments presented in Section V. A briefdiscussion on the results and future work can be foundin Section VI.
2 Literature Review
Extensive research has focused on visual mapping andlocalisation in confined spaces such as localisation of in-pipe [Lee et al., 2011; Paul et al., 2010], surgery [Tayloret al., 2016; Wang et al., 2017] and mining robots. Forthe in-pipe robot design in [Lee et al., 2011], localisationhas been accomplished using landmarks such as elbowsand branches in the pipe combined with orientation in-formation from an IMU (Inertia Measurement Unit) sen-sor. Laser scanning sensors have been used in [Paul etal., 2010] to construct an accurate map of the bridgestructure for localisation of a bridge inspection robot. Ittook 30 to 50 repetitions of scanning to produce a mapthat is accurate enough for the application. Detailedscannings like this are less feasible on the scale of under-ground mines. A laparoscopic visual tracking system hasbeen designed in [Wang et al., 2017] to “localise” the sur-gical instrument within its work space. A special markerwas embedded to provide computer vision features thatwere extracted in Hue-Saturation-Value (HSV) space forillumination invariance. However, it is less feasible to im-plement this marker approach in the underground min-ing context.
A hierarchical system called “Opportunistic Localiza-tion” has been built in [Duff et al., 2003] to localise min-ing vehicles based on wheel-odometry integrated withprediction of possible forward routes from the currentlocation belief. It was assumed that localisation accu-racy is more crucial at intersections than within a tun-nel. This assumption may not be valid in circumstanceswhere prevention of collision between pedestrian work-ers and the vehicle is required. [Gadd and Newman,2015] presents a texture-tracking visual teach and re-peat (VT&R) system for vehicles travelling in fixed in-dustrial environment; typical underground mine sites arenoisier and less controlled. SLAM++ [Salas-Moreno etal., 2013] tracks salient objects in the scene to providecrucial localisation cues, but underground mines typi-cally do not present easy-to-track objects. The clas-sic feature-based place-recognition algorithm FAB-MAP[Cummins and Newman, 2008] detects the existence of“visual words”, discarding geometric relative location in-formation of features that are crucial in underground en-vironment - for example, the same “visual words” mayappear in the field of view for a range of contiguous lo-

cations in a long tunnel. Localisation in dark environ-ments through extracting larger-scale features has beendemonstrated in [Nelson et al., 2015] and [Li et al., 2015],but their target applications were not general enough forthe techniques to be directly transferable to undergroundmine sites.
There are previous works on applying saliency crite-ria to image processing in other applications. In [Pep-perell et al., 2014], pixels corresponding to sky were re-moved before further processing, but it was done usinga dedicated technique that specifically tackled the skies.Multi-scaled saliency masks have been shown to work onobject detection [Frintrop et al., 2014], a similar idea isincorporated in our approach (Section 3.3). In [John etal., 2015], salient features such as traffic lights were ex-tracted using Convolutional Neural Network (CNN) forlocalisation on urban streets. In [Milford et al., 2014], apatch verification method was used in conjunction with“edge” and “human” saliency masks, a similar idea isadopted by our approach in the underground miningcontext. Details of our saliency-based patch filtering ap-proach is described next.
3 Approach
In this section, the holistic single-image-comparisonbased place recognition approach will be described first,followed by the concept and components of SESAME -Shannon Entropy SAliency ME thod (Figs. 1d-1f), com-plemented by an SVM classifier trained to help maintainthe quality of images in the database. SESAME on analternative deep learning technique is lastly discussed.
3.1 The Holistic Single-Image-ComparisonApproach
In the holistic single-image-comparison approach (Fig. 2with yellow boxes omitted), direct single image compar-ison (without incorporation of temporal information) isused to map a query image j to its global best matchl(j) = ibest in the database (a dictionary containingimages labelled with their ground truth location), interms of lowest Sum of Absolute Difference (SAD) scoreS(i, j) [Milford and Wyeth, 2012]. To tolerate someamount of viewing angle change, the images being com-pared are shifted w.r.t each other for offset values withina search window σ [Milford, 2013], with the minimumSAD score stored in a confusion matrix D. Apart frombeing cropped and resized to Rx × Ry pixels, queryand database images are all converted to gray-scale andpatch-normalised in the preprocessor to enhance robust-ness w.r.t lighting and other changes in environment be-fore the intensity of every pixel is compared unbiasedly.This holistic image comparison with patch normlisationhas been proposed in the SeqSLAM algorithm [Milfordand Wyeth, 2012]. Direct comparison of whole images
retains as much as possible the relative positional in-formation of objects so that perceptual aliasing can bereduced. However, in contrast to SeqSLAM, single im-age comparison without temporal information is used inthis work so that the effect of patch saliency can be em-phasized.
Figure 2: Schematic drawing of the proposed visual placerecognition approach. Intermediate result correspondingto database and query images are shown in blue andred, respectively. Modules of the holistic single-image-comparison approach are in green boxes, and the newlyproposed SESAME modules are in yellow boxes.
In the context of underground visual place recognition,SAD score S(i, j) are often found to consist of contri-butions from two kinds of intensity difference betweenquery patch pqr and database patch pdb (1): Salientpatches {ps} that are key for localisation (2) and tex-tureless patches {ps} that contain little useful informa-tion (3). Including the latter into SAD only adds noiseto the process. Intuitively, it is better to assign little orno weight in the composition of SAD scores for incon-spicuous patches in {ps} and only account for the SADcontributed by pixels in salient patches {ps}, as shownin (4).
l(j) = arg mini
S(i, j) = arg mini
[Ss(i, j) + Ss(i, j)] (1)
Ss =∑
pdb,pqr∈{ps}
(∑∑
|pqr − pdb|) (2)
Ss =∑
pdb or pqr /∈{ps}
(∑∑
|pqr − pdb|) (3)
l(j) = arg mini
Ss(i, j). (4)
For instance, one would rely more on the location la-bels written on the overhanging signs (Fig. 3a) in anunderground mine tunnel, instead of uniform-colouredpatches of walls on the two sides of the vehicle. Fur-thermore, objects like the overhanging wirings (Fig. 3a)could also be salient landmarks, just like numbers on thesigns. Computers are more capable to recognize, remem-ber and process them than human eyes.

3.2 The Shannon Entropy SAliencyMEthod (SESAME)
Our proposed method of accentuating salient objectsover monotonic image regions is to filter image patchesaccording to their Shannon Entropy H(p): After prepro-cessing steps such as gray-scale conversion and resizing,a query image is divided into small individual patchesfor which Shannon Entropy is calculated using (5):
H(p) = −255∑i=0
Pp(bi)logPp(bi), (5)
in which bi is one of the 256 possible pixel intensity valuebins for an 8-bit monocolour image, Pp(bi) = [numberof pixels with intensity = bi]/Len(p)2 is the probabil-ity for a pixel to take on such intensity value withinthe patch p, and Len(p) is the side length of patchp that is used for entropy calculation, not to be con-fused with the patch size used in patch normalisationLnorm(p). Patch size will refer to the former, if not in-dicated otherwise in the remainder of this text. A vi-sualisation of the patch-wise entropy is shown in Figure3b. The rest of the process, including patch normalisa-tion and viewing angle shift compensation, follows theholistic single-image-comparison approach, except thatthe patches with lower Shannon Entropy value are dis-carded when calculating the SAD score. The percentageof discarded patches is controlled by a data-independentparameter rthreshold ∈ (0, 1), which is the relative thresh-old to accept a patch as salient, based on its ShannonEntropy value w.r.t the patches with maximum and min-imum Shannon Entropy among all patches in the entireimage. Relative instead of absolute threshold is usedso as to discard image patches based on quality insteadquantity. There are other flavors of implementation suchas setting an absolute Shannon Entropy threshold thatmay be helpful in some cases and worth further investi-gation, though in those cases the value of optimum ab-solute threshold will have more dependency on specificapplication details, such as data quality, image colourdepth, etc.
A binary salient mask M (Fig. 3c) is used to indicatethe locations of salient pixels that should be accountedin SAD calculation. The image in Figure 3a with incon-spicuous patches removed is shown in Figure 3d. Sincethe amount of pixels removed could vary for different im-ages, the SAD value should be normalised by the numberof salient pixels that have their contribution, as shownin (6).
S = min∆x,∆y∈σ
(Iqr(y + ∆y, x+ ∆x)− Idb(y, x))
∗(M(y + ∆y, x+ ∆x))/∑i,j
M(i, j).(6)
(a) (b)
(c) (d)
Figure 3: (a) An image taken in an underground tun-nel showing salient features such as overhead signs andwirings. (b) A visualisation of the entropy value for theimage in (a) with Len(p) = 5 pixels, lighter color meanslarger entropy. (c) The binary bask M generated using(b) and rthreshold of 0.5. (d) The processed image withlower saliency patches removed, to be used for SAD com-parison.
3.3 Hierarchical SESAME
The patch size Len(p) plays an important role in decidingwhich pixels are discarded. Since salient features showup in different sizes, using a pre-defined patch size Len(p)limits the flexibility of the approach. For instance, ifLen(p) is too small, saturated pixels inside large salientfeatures which could potentially increase matching ac-curacy could be removed. On the other hand, if Len(p)is increased to enclose the larger salient features, somesalient features that happen to lie close to a plain patchcould be implicated. Therefore, it is better to imple-ment a multi-level hierarchical masking process to onlyremove pixels that are plain regardless of scale, as shownin (7), with n being the total number of saliency masksto be used. Figure 4 shows the retaining of low entropypatches that are salient on a larger scale with Hierarchi-cal SESAME.
M = MLen(p)1 ∩MLen(p)2 ∩ ... ∩MLen(p)n (7)
3.4 Saliency of Database Images
Apart from selecting an appropriate method for imagematching, the saliency of database images also plays animportant role. Problematic images sometimes can at-tract a lot of erroneous matches. For example, a mostlydark or bright database image caused by typical distur-bances on mine sites such as obstruction, dust, lens glare,head-light from other vehicles, etc., will sometimes bethe global best match for a large amount of queries (i.e.,the corresponding row in the confusion matrix D exhibita low SAD score relative to all other places), this is es-pecially harmful to Precision-recall if it happens to be abest match for an extended stationary part of the query
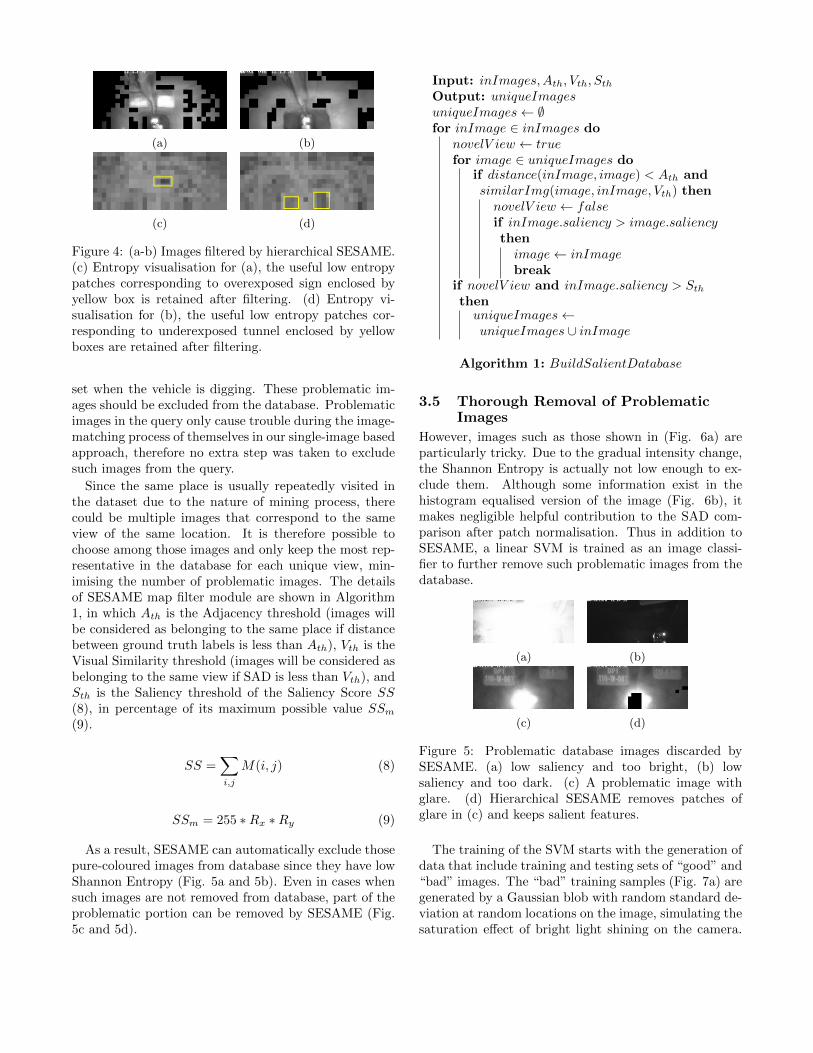
(a) (b)
(c) (d)
Figure 4: (a-b) Images filtered by hierarchical SESAME.(c) Entropy visualisation for (a), the useful low entropypatches corresponding to overexposed sign enclosed byyellow box is retained after filtering. (d) Entropy vi-sualisation for (b), the useful low entropy patches cor-responding to underexposed tunnel enclosed by yellowboxes are retained after filtering.
set when the vehicle is digging. These problematic im-ages should be excluded from the database. Problematicimages in the query only cause trouble during the image-matching process of themselves in our single-image basedapproach, therefore no extra step was taken to excludesuch images from the query.
Since the same place is usually repeatedly visited inthe dataset due to the nature of mining process, therecould be multiple images that correspond to the sameview of the same location. It is therefore possible tochoose among those images and only keep the most rep-resentative in the database for each unique view, min-imising the number of problematic images. The detailsof SESAME map filter module are shown in Algorithm1, in which Ath is the Adjacency threshold (images willbe considered as belonging to the same place if distancebetween ground truth labels is less than Ath), Vth is theVisual Similarity threshold (images will be considered asbelonging to the same view if SAD is less than Vth), andSth is the Saliency threshold of the Saliency Score SS(8), in percentage of its maximum possible value SSm(9).
SS =∑i,j
M(i, j) (8)
SSm = 255 ∗Rx ∗Ry (9)
As a result, SESAME can automatically exclude thosepure-coloured images from database since they have lowShannon Entropy (Fig. 5a and 5b). Even in cases whensuch images are not removed from database, part of theproblematic portion can be removed by SESAME (Fig.5c and 5d).
Input: inImages,Ath, Vth, SthOutput: uniqueImagesuniqueImages← ∅for inImage ∈ inImages do
novelV iew ← truefor image ∈ uniqueImages do
if distance(inImage, image) < Ath andsimilarImg(image, inImage, Vth) thennovelV iew ← falseif inImage.saliency > image.saliencythenimage← inImagebreak
if novelV iew and inImage.saliency > SththenuniqueImages←uniqueImages ∪ inImage
Algorithm 1: BuildSalientDatabase
3.5 Thorough Removal of ProblematicImages
However, images such as those shown in (Fig. 6a) areparticularly tricky. Due to the gradual intensity change,the Shannon Entropy is actually not low enough to ex-clude them. Although some information exist in thehistogram equalised version of the image (Fig. 6b), itmakes negligible helpful contribution to the SAD com-parison after patch normalisation. Thus in addition toSESAME, a linear SVM is trained as an image classi-fier to further remove such problematic images from thedatabase.
(a) (b)
(c) (d)
Figure 5: Problematic database images discarded bySESAME. (a) low saliency and too bright, (b) lowsaliency and too dark. (c) A problematic image withglare. (d) Hierarchical SESAME removes patches ofglare in (c) and keeps salient features.
The training of the SVM starts with the generation ofdata that include training and testing sets of “good” and“bad” images. The “bad” training samples (Fig. 7a) aregenerated by a Gaussian blob with random standard de-viation at random locations on the image, simulating thesaturation effect of bright light shining on the camera.

(a) (b)
Figure 6: (a) Example of a problematic image thatshould be excluded from the database. The bright lightis not a fingerprint of the place but attracts lots of falsematches. (b) A histogram-equalised version of (a).
Their “good” counter-parts (Fig. 7b) are generated bystitching together random-sized patches from randomlyselected source images that represent typical scenes inthe tunnel. In our case, 20 such images are used as shownin Figure 8, more could be used for performance enhance-ment. The patches are sampled from the neighborhood
(a) (b)
Figure 7: Examples of artificially generated (a) “bad”and (b) “good” images used to train the SVM imageclassifier.
of its corresponding location in the selected source im-age. In this way, large quantities of training data can beobtained without the need for collection of real samplesand tedious manual labelling work.
3.6 SESAME on Deep Learning NeuralNetwork
A deep learning neural network (hereafter Deep Net)[Sunderhauf et al., 2015] can help trade-off computationresources for better results. When lower speed and largememory is allowed, Deep Net may be preferred. Hencethe effectiveness of SESAME on Deep Net (that replacesthe “SAD comparator” in Fig. 2) is also evaluated in theexperiments described next.
4 Experimental Setup
The effectiveness of SESAME on both holistic single-image-comparison and Deep Net approaches was evalu-ated by running localisation experiments on an Under-ground Mine dataset. For Deep Net, the “fc6” layer in avariant of the Deep Net in [Sunderhauf et al., 2015] wasused to produce the confusion matrix for Precision-recallcurve generation. The general effectiveness of SESAMEwas evaluated with a benchmark dataset featuring acompletely different domain. The details of experimentsare covered in this section.
Figure 8: Manually selected images that are used duringartificial generation of “good” images for SVM training.
4.1 Datasets
The Underground Mine Dataset The under-ground Mine Dataset photos were taken by camerasmounted on the back of an LHD loader during itsdaily operation. The dataset contains a 104-minute-longfootage of ∼15.6 kilometers of back and forth travel in-side 2 long tunnels (Fig. 9a) and a small intersectionregion where the LHD loader dumped the load. The20,000 photos (size: 1280× 960 pixels) were sub-sampled(step length = 5) for database construction, and a non-overlapping (offset = 2) part were sub-sampled (steplength = 5) as query images. Note in this experiment,no temporal correlation is drawn upon and each image istreated independently. Therefore it is not necessary tosequentially process query images to get the same result.
The Benchmark Dataset The images of the “StLucia Multiple Times of Day” dataset [Glover et al.,2010] were taken by a front-facing camera mountedon top of the car during a ∼17.6 kilometer-travel inBrisbane, Australia (Fig. 9b). The captured videofor each traverse was converted to ∼20,000 images.Two traverses - 1009091410, 2108091210 (“DD/MM/YY24HOUR”) from the dataset were sub-sampled (steplength = 5) for database construction and another tra-verse (1109091545) was sub-sampled (step length = 10)as the query.
4.2 Ground Truth
The Underground Mine Dataset Ground truth lo-cations of the Underground Mine dataset is measured us-ing an accurately surveyed beacon-infrastructure basedtrilateration localization system.
The Benchmark Dataset The planar coordinateswere approximated by scaling the processed GPS datathat come along with the “St Lucia Multiple Times ofDay” dataset.

(a) (b)
Figure 9: Map of database ground truth location for (a)the Underground Mine dataset and (b) the “St LuciaMultiple Times of Day” dataset.
4.3 SVM Classifier Training
The training took 20 epochs of Stochastic Gradient De-scent (SGD) to converge, with mini-batch size of 20 andvariable learning rate between 0.0001 to 0.01. The train-ing continued until a 95% accuracy was reached for aseparate testing set, after which the performance of theSVM was evaluated using an evaluation set of 220 im-ages including artificially generated ones in both “good”and “bad” categories that the classifier had not seen be-fore, mixed with the 20 (“good”) images that were usedto generate the “good” training samples (Fig. 8). Thetrained SVM was then used to filter candidate databaseimages. The SVM classifier was not used on “St LuciaMultiple Times of Day” dataset because it contains fewproblematic images.
4.4 Image Pre-Processing and Comparison
In our current implementation, saliency masksM5,M10,M20 with Len(p) = 5, 10, 20 are calcu-lated, and the final saliency mask M is the intersectionof the three (10). In other words, a pixel will be removedonly when it lies simultaneously in plain patches of sizes5, 10, and 20 pixels.
M = M5 ∩M10 ∩M20 (10)
4.5 Comparison with FABMAP
In order to benchmark the performance of SESAME withFAB-MAP [Cummins and Newman, 2008], the same setof raw unfiltered camera images for both database andquery were converted to grayscale, cropped in exactlythe same way as SESAME, resized to 640×304 pixelsand converted to videos. OpenFABMAP [Glover et al.,2012] was then run with semantic vocabulary generatedwith these input videos for its best performance.
4.6 Parameters
The parameters used in the current SESAME imple-mentation for the Underground Mine dataset are sum-marised in Table 1. These parameters are heuristicallyselected but have not been optimized, neither have they
been fine-tuned to work best in the particular dataset.For instance, Rx and Ry are chosen to reduce the imagesize and speed up processing, while keeping the aspectratio unchanged; the adjacency threshold is chosen sothat different places in the resulting database exhibitvisible difference. The selection of maximum tolerancefor True Positives has taken into account the length oftravel along which similar views can be observed insidethe tunnel. The results obtained using these parametersare presented next in Section 5.
Table 1: PARAMETER LIST
Parameter Value Unit Description
Rx 160 pixel Reduced image widthRy 76 pixel Reduced image height
Lnorm(p) 5 pixel patch side length usedin patch normalisation
Ath 0.5 meter Adjacency thresholdVth 0.25 Visual Similarity
thresholdSth 50% Saliency thresholdTtp 15 meter Max. tolerance for
True Positives
5 Results
In this section, the results of the experiments are pre-sented, including the performance of the SVM classifierand a comparison of Precision-recall curves achieved byvarious methods described in the previous section.
5.1 SVM Classification Effectiveness
The accuracy of the trained SVM is first evaluated.Among all images (124 out of 220) classified by thetrained SVM to be “good”, 115 (93%) are actually“good”; Among all the images (85 out of 220) classifiedto be “bad”, 84 (99%) are actually “bad”. 11 out 220 im-ages are found to be ambiguous by the SVM, includingone of the 20 images used as “good” image patch source(the remaining 19 are all correctly classified). Whenchallenged with real-world images, the SVM could cor-rectly pick out “bad” images such as those shown inFigure 10a, along with some misclassified “good” im-ages (Fig. 10b), which is not a big problem since thereare adequate amount of images to cover the entire map.
5.2 Computational Resource Usage
The apparent computation resource usages by typicalruns of three groups of methods in our experiments havebeen recorded and shown in Figure 11.

5.3 Precision-Recall Curves
The Precision-recall curves of the holistic single-image-comparison approach, Deep Net (both with and w/o var-ious levels of SESAME), and OpenFABMAP as refer-ence, are plotted in Figure 12 for the Underground Minedataset. Results for the benchmark dataset are in Fig-ure 14. The areas under these Precision-recall curves areestimated and shown in Figures 13 and 15, respectively.Part of these localisation results can be visualized in thevideo companying this paper.
(a) (b)
Figure 10: SVM map image classification result. (a)Correctly discarded images. (b) Mistakenly discardedimages.
Figure 11: Comparison of computation resource con-sumption in our experiments by three groups of methods.
6 Discussion and Future Work
The results from the previous section demonstrated that,as a suitable approach for applications that require real-time output and small memory consumption (such as un-derground mining), the holistic single-image-comparisonmethod with a light to moderate rthreshold ∈ [0.1, 0.5]produces desirable results in terms of area under thePrecision-recall curve; while higher levels of SESAME, asexpected, converge to the extremity of all patches being
Figure 12: Precision-recall curves comparing perfor-mance of Method 0: holistic single-image-comparisonapproach (without SVM classifier), Method 1: Method0 with SVM classifier, Methods 11-18: Method 1 withvarious rthreshold levels of SESAME (with SVM classi-fier), Method 20: Deep Net, Methods 21-22: Deep Netwith SESAME, and Method 30: OpenFABMAP, for theUnderground Mine dataset.
discarded. A lower level of SESAME (relative thresholdrthreshold ∈ [0.1, 0.2]) is also effective on Deep Net, whichwould be preferable for applications that allow sloweroutput rate and large memory usage. Both methodswith SESAME enhancement significantly out-performedOpenFABMAP. Results show that SESAME, assisted by
Figure 13: Solid bars: Area under the Precision-recallcurves in Figure 12. Hollow dashed regions: Furtherimprovement when temporal information is used.
an SVM database image classifier, is an effective add-on to both holistic single-image-comparison and DeepNet approaches for accurate and reliable localisation inchallenging underground environment. The generalityof Shannon Entropy-based saliency computation tech-

nique is further demonstrated with the “St Lucia Mul-tiple Times of Day” dataset, with rthreshold ∈ [0.5, 0.7]producing better results. Although a camera-based sys-tem is used in the demonstration, there is no apparentbarrier for SESAME to be applied on images obtainedwith laser-based systems such as those in [McManus etal., 2013]. The lightweight SVM classifier used in thiswork can sometimes lower performance if no “bad” im-ages are present in the database and “good” images aretaken out by mistake, this can be improved in the futureby replacing the SVM with a more sophisticated neuralnetwork. Additionally, temporal information that hasnot been utilised in this work can be incorporated toeliminate erroneous jumps between far-away locationsthat are impossible given the vehicle speed, from the setof localisation results. A significant performance boosthas already been achieved with a primitive implementa-tion of the said temporal filter, shown as hollow dashedbars in Figure 13. Sensor fusion with IMUs, Lidar andother sources of information integrated with probabilis-tic filtering also promise potential further improvementswhen combined with SESAME.
Figure 14: Precision-recall curves comparing perfor-mance of Method 0: Holistic single-image-comparisonapproach, and Methods 11-18: Method 0 with variousrthreshold levels of SESAME, for the “St Lucia MultipleTimes of Day” dataset.
Acknowledgments
The authors would like to thank Advance Queensland In-novation Partnerships grant from the Queensland Gov-ernment, Mining3, Caterpillar, ARC Future Fellowship,and the Queensland University of Technology.
References[Cummins and Newman, 2008] M. Cummins and
P. Newman. FAB-MAP: Probabilistic Localization
Figure 15: Area under the Precision-recall curves in Fig-ure 14.
and Mapping in the Space of Appearance. Int. J.Rob. Res., 27(6):647–665, 2008.
[Duff et al., 2003] E.S. Duff, J.M. Roberts, and P.I.Corke. Automation of an underground mining vehi-cle using reactive navigation and opportunistic local-ization. IEEE Int. Conf. Intell. Robot. Syst., 4(July1998):3775–3780, 2003.
[Forooshani et al., 2013] Arghavan Emami Forooshani,Shahzad Bashir, David G. Michelson, and SimaNoghanian. A survey of wireless communications andpropagation modeling in underground mines. IEEECommun. Surv. Tutorials, 15(4):1524–1545, 2013.
[Frintrop et al., 2014] Simone Frintrop, Gm Garca, andAb Cremers. A Cognitive Approach for Object Dis-covery. In IEEE Int. Conf. Pattern Recognit., pages2329–2334, 2014.
[Gadd and Newman, 2015] Matthew Gadd and PaulNewman. A framework for infrastructure-free ware-house navigation. Proc. - IEEE Int. Conf. Robot. Au-tom., 2015-June(June):3271–3278, 2015.
[Glover et al., 2010] Arren J. Glover, William P. Mad-dern, Michael J. Milford, and Gordon F. Wyeth. FAB-MAP + RatSLAM: Appearance-based SLAM for mul-tiple times of day. In Proc. - IEEE Int. Conf. Robot.Autom., 2010.
[Glover et al., 2012] Arren Glover, William Maddern,Michael Warren, Stephanie Reid, Michael Milford,and Gordon Wyeth. OpenFABMAP: An open sourcetoolbox for appearance-based loop closure detection.Proc. - IEEE Int. Conf. Robot. Autom., pages 4730–4735, 2012.
[John et al., 2015] Vijay John, Keisuke Yoneda, ZhengLiu, and Seiichi Mita. Saliency Map Generation bythe Convolutional Neural Network for Real-Time Traf-

fic Light Detection Using Template Matching. IEEETrans. Comput. Imaging, 1(3):159–173, 2015.
[Kent, 2011] Denis Kent. Digital networks and applica-tions in underground coal mines. 11th Undergr. CoalOper. Conf., pages 181–188, 2011.
[Lavigne and Marshall, 2012] N. James Lavigne andJoshua A. Marshall. A landmark-bounded method forlarge-scale underground mine mapping. J. F. Robot.,29(6):861–879, 2012.
[Lee et al., 2011] Dong Hyuk Lee, Hyungpil Moon, andHyouk Ryeol Choi. Autonomous navigation of in-pipe working robot in unknown pipeline Environment.Proc. - IEEE Int. Conf. Robot. Autom., pages 1559–1564, 2011.
[Li and Liu, 2009] Mo Li and Yunhao Liu. Undergroundcoal mine monitoring with wireless sensor networks.ACM Trans. Sens. Networks, 5(2):1–29, 2009.
[Li et al., 2015] Jie Li, Ryan M Eustice, and MatthewJohnson-roberson. High-Level Visual Features for Un-derwater Place Recognition. Int. Conf. Robot. Autom.,pages 3652–3659, 2015.
[Liu et al., 2010] Zhigao Liu, Chunwen Li, Danchen Wu,Wenhan Dai, Shaobo Geng, and Qingqing Ding. Awireless sensor network based personnel positioningscheme in coal mines with blind areas. Sensors(Switzerland), 10(11):9891–9918, 2010.
[McManus et al., 2013] Colin McManus, Paul Furgale,and Timothy D. Barfoot. Towards lighting-invariantvisual navigation: An appearance-based approach us-ing scanning laser-rangefinders. Rob. Auton. Syst.,61(8):836–852, 2013.
[Milford and Wyeth, 2012] Michael J. Milford and Gor-don F. Wyeth. SeqSLAM: Visual route-based naviga-tion for sunny summer days and stormy winter nights.In Proc. - IEEE Int. Conf. Robot. Autom., 2012.
[Milford et al., 2014] Michael Milford, Eleonora Vig,Walter Scheirer, and David Cox. Vision-based simul-taneous localization and mapping in changing outdoorenvironments. J. F. Robot., 31(5):814–836, 2014.
[Milford, 2013] M. Milford. Vision-based place recogni-tion: how low can you go? Int. J. Rob. Res., 32(7),2013.
[Moridi et al., 2015] Mohammad Ali Moridi, YouheiKawamura, Mostafa Sharifzadeh, Emmanuel KnoxChanda, Markus Wagner, Hyongdoo Jang, and Hi-rokazu Okawa. Development of underground minemonitoring and communication system integrated Zig-Bee and GIS. Int. J. Min. Sci. Technol., 25(5):811–818, 2015.
[Nelson et al., 2015] Peter Nelson, Winston Churchill,Ingmar Posner, and Paul Newman. From dusk till
dawn: Localisation at night using artificial lightsources. Proc. - IEEE Int. Conf. Robot. Autom., 2015-June:5245–5252, 2015.
[Paul et al., 2010] G Paul, S Webb, D K Liu, and G Dis-sanayake. A Robotic System for Steel Bridge Main-tenance: Field Testing. Proc. Australas. Conf. Robot.Autom., pages 1–8, 2010.
[Pepperell et al., 2014] Edward Pepperell, Peter I.Corke, and Michael J. Milford. All-environmentvisual place recognition with SMART. In Proc. -IEEE Int. Conf. Robot. Autom., pages 1612–1618,2014.
[Rohrig and Muller, 2009] C. Rohrig and M. Muller. Lo-calization of Sensor Nodes in a Wireless Sensor Net-work Using the nanoLOC TRX Transceiver. VTCSpring 2009 - IEEE 69th Veh. Technol. Conf., pages1–5, 2009.
[Rusu and Hayes, 2011] S Radacina Rusu and M J DHayes. Localization in Large-Scale Underground En-vironments with RFID. 24th Can. Conf. Electr. Com-put. Eng., pages 1140–1143, 2011.
[Salas-Moreno et al., 2013] Renato F. Salas-Moreno,Richard A. Newcombe, Hauke Strasdat, Paul H.J.Kelly, and Andrew J. Davison. SLAM++: Simultane-ous localisation and mapping at the level of objects.Proc. IEEE Comput. Soc. Conf. Comput. Vis. PatternRecognit., pages 1352–1359, 2013.
[Sathyan et al., 2011] Thuraiappah Sathyan, DavidHumphrey, and Mark Hedley. WASP: A systemand algorithms for accurate radio localization usinglow-cost hardware. IEEE Trans. Syst. Man Cybern.Part C Appl. Rev., 41(2):211–222, 2011.
[Sunderhauf et al., 2015] Niko Sunderhauf, Sareh Shi-razi, Feras Dayoub, Ben Upcroft, and Michael Mil-ford. On the performance of ConvNet features forplace recognition. In IEEE Int. Conf. Intell. Robot.Syst., volume 2015-Decem, pages 4297–4304, 2015.
[Taylor et al., 2016] Russell H Taylor, Arianna Menci-assi, Gabor Fichtinger, Paolo Fiorini, and Paolo Dario.Medical Robotics and Computer-Integrated Surgery.Springer Handb. Robot., pages 1657–1684, 2016.
[Wang et al., 2017] Zerui Wang, Sing Chun Lee,Fangxun Zhong, David Navarro-alarcon, Yun-hui Liu,Anton Deguet, Peter Kazanzides, Russell H Taylor,and Life Fellow. Image-Based Trajectory TrackingControl of 4-DoF Laparoscopic Instruments Usinga Rotation Distinguishing Marker. IEEE Robot.Autom. Lett., 2(3):1586–1592, 2017.
[Zhou and Shi, 2009] Junyi Zhou and Jing Shi. RFIDlocalization algorithms and applications-A review. J.Intell. Manuf., 20(6):695–707, 2009.