
Enhancing the well-being of Europen mountain regions … · Enhancing the well-being of Europen...
31
Enhancing the well-being of Europen mountain regions by innovative governance models: The Carbon forestry CPR regime Tatiana Kluvankova, Michal V. Marek, Stanka Brnkalakova, Urban Kovac, ISEE Internatinal Conference Washington DC 26-29 June 2016
-
Upload
nguyenthien -
Category
Documents
-
view
219 -
download
0
Transcript of Enhancing the well-being of Europen mountain regions … · Enhancing the well-being of Europen...

Enhancing the well-being of Europen mountain regions by innovative governance models:
The Carbon forestry CPR regime
Tatiana Kluvankova, Michal V. Marek, Stanka Brnkalakova,
Urban Kovac,
ISEE Internatinal Conference Washington DC 26-29 June 2016

1) the importance of mountains to provide
climate regulation (ecosystem service) has
been overlooked long time
3) sectoral approach and lack of coordination
between global, international, national level
2) un-sustainable land use management
resulting in marginalisation of mountain areas
Climate change mitigation as challenge for well-being of mountain SES?
= the need for integrative approaches, innovations
and adaptative management of mountains is
recognized as a critical component of transition of
socio-ecological systems towards sustainability
Mountain regions as socio-ecological systems: challenges and opportunities -

Climate Regulation in European Mountain SES
• European mountains – 35% of surface
• Carbon stocks:
Figure 1: World carbon stocks in soil organic matter
(Schlessinger, 1999 adopted by Marek, 2014)Figure 2: World carbon stocks in terrestrial vegetation
(Schlessinger, 1999 adopted by Marek, 2014)

Global Change Research Centre AS CR, v.v.i
CO2
CO2
CO2
Global carbon
cycle
of the planet
Earth– crucial cycle of
our current
biosphere
This cycle
IS STRONGLY
RELATED TO THE
ASSIMILATION
ACTIVITY OF
PRIMARY
PRODUCETNTS
CO2
Global Change Research Institute AS CZ.

Opportunities of EU mountain regions?
1. Carbon forestry as technological innovation
2. Common pool resource regime as social innovation
to address climate policy objectives and
well being of mountain regions

Carbon Forestry PHILOSOPHY
Manage to conserve carbon, as well as to provide other services
Minimize carbon losses modify site preparation - ploughing, mounding, burning etc.
Prefer less invasive harversting means
preserve thinnings and harvest residues, or use for energy substitution
Maximize carbon gain develop a carbon based silvicultural system
fertilize (but be wary for N2O emissions)
preserve wind throw, encourage natural regeneration

Carbon fluxes in relation to the forest stand development
CC
CC
C
C
Ústav výzkumu globální změny AV ČR, v.v.i.Global Change Research Institute AS CR
Carbon EFFLUX
Carbon UPTAKE
1. Carbon forestry as technological innovation

CARBON FORESTRY- forest management focused on the LONG-TERM INCREASE of forest stands carbon storage
MINIMIZE CARBON LOSSES
MAXIMIZE CARBON GAIN
REGARDING FOREST STANDS POTENTIAL FOR CARBON STORAGE,
IT POSSIBLE TO IDENTIFY NEW FORM OF FOREST ECOSYSTEM SERVICE,
i.e. FOREST AS LONG-TERM DEPONIA OF CARBON
What about the basic principles of „CARBON FORESTRY„?????
1. Carbon forestry as technological innovation
Global Change Research Institute AS CR
Global Change Research Institute AS CR
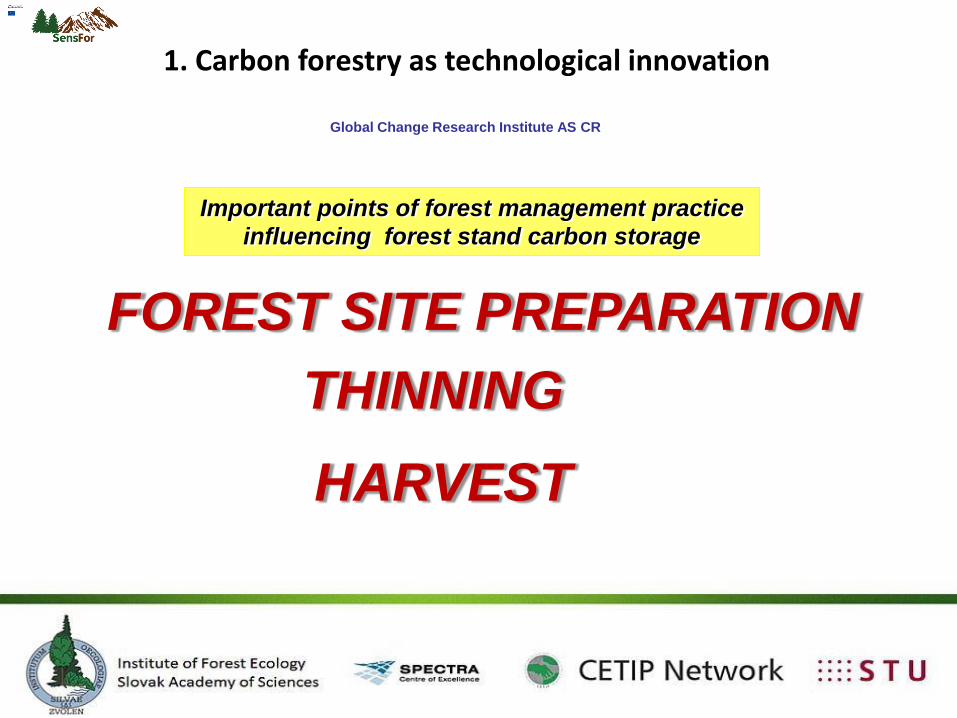
FOREST SITE PREPARATION
Important points of forest management practice
influencing forest stand carbon storage
THINNING
HARVEST
1. Carbon forestry as technological innovation

Global Change Research Institute AS CR
FOREST SITE PREPARATION
Crucial point: to use only that kind of approaches,
which are able to minimize any injury of soil surface to
prevent any effluxes of carbon from the soil.
1. Carbon forestry as technological innovation

Global Change Research Institute AS CR
Essential forest management practice which is
responsible for far-reaching impact on forest
stand carbon storage
THINNING
1. Carbon forestry as technological innovation

Global Change Research Institute AS CR
FINAL step of silvicultural management
resulting in carbon export form the stand and
cessation of carbon capture. The used harvest
approach strongly affects the time, when clear
area
is the source of the carbon
HARVEST
1. Carbon forestry as technological innovation

Common pool resource regime
• CPR – collective self-organised regimes are capable ofcrafting own rules that allow for the sustainable andequitable management of SES. Moreover, due to their self-organisation and self-management, such regimes are able tosolve the resource management problems without externalauthorities (Ostrom, 1990, 1998, 2005, 2006, 2010)
protection
benefits

• Group of rights: access, withdrawal,
management shared among
owners/users.
• Evolved historically during medieval
Europe and land use reforms or are
formed as community forest (Scotland)
• Ecosystem dynamics (forest renewal)
is considered in harvesting and
management strategies.
• Management rules are derived and
operated on self-management and
collective actions - aiming to improve
the group’s conditions (Ostrom
conditions of robust regime).
FOREST COMMONS AND COMMUNITY
FORESTRY IN EVOLUTION IN EUROPE

8 SES in 4 countries: BULGARIA - private/state regimeSLOVAKIA – state/traditional forest CPR regimeSCOTLAND – private/new forest CPR regimeSLOVENIA – traditional/state regime
KluvankovaT, Brnkalakova S, Marek M.V, Valatin G, Hopkins J, Kovac U, Nijnik M,
Udovc A, Ambrose-Oji B, Zhiyanski M, Glushova M.: CARBON SEQUESTRATION FOR THE
WELL-BEING OF EUROPEAN MOUNTAIN REGIONS, In Climate Research in review.
Potential of carbon sequestration to enhance sustainable forest management for
welll being of mountain regions and scale down global CO2 objectives from the EU to
local policy arenas
CROSS COUNTRY COMPARISON

Methodology
1: Carbon sequestration potentialBaldocchi at al. 1988, CzechGlobe – ICOS-CzeCOS network: eddy-covariance technique
2. Expert assessment of intensity of carbon forestrymanagement practices
3. Social valuation
KluvankovaT, Brnkalakova S, Marek M.V, Valatin G, Hopkins J, Kovac U, Nijnik M,
Udovc A, Ambrose-Oji B, Zhiyanski M, Glushova M.: CARBON SEQUESTRATION FOR THE
WELL-BEING OF EUROPEAN MOUNTAIN REGIONS, In Climate Research in review.
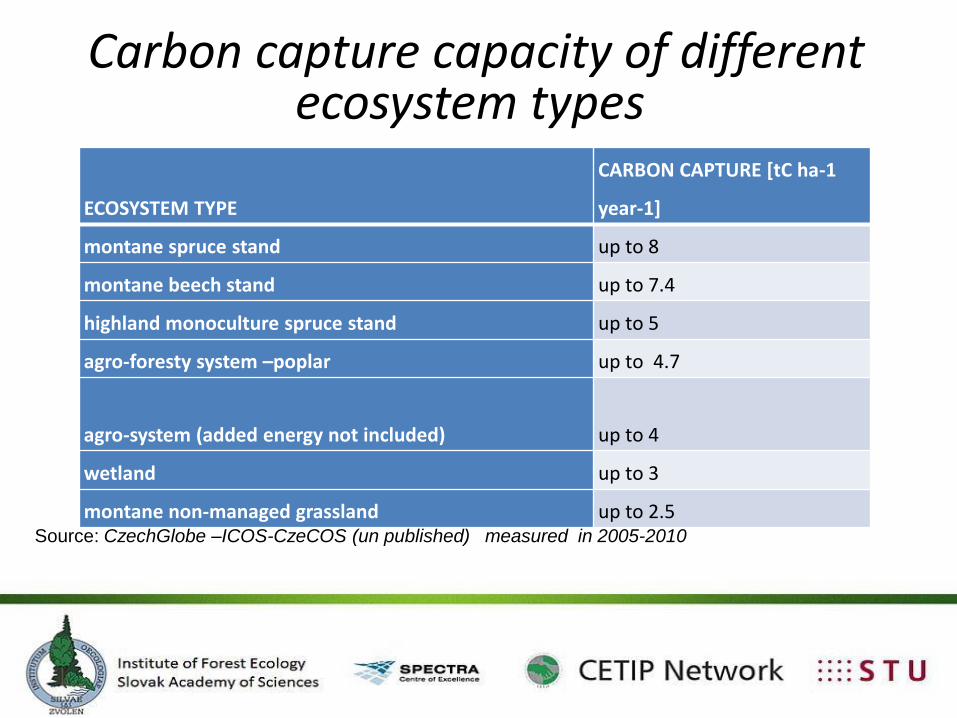
Carbon capture capacity of different ecosystem types
Source: CzechGlobe –ICOS-CzeCOS (un published) measured in 2005-2010
ECOSYSTEM TYPE
CARBON CAPTURE [tC ha-1
year-1]
montane spruce stand up to 8
montane beech stand up to 7.4
highland monoculture spruce stand up to 5
agro-foresty system –poplar up to 4.7
agro-system (added energy not included) up to 4
wetland up to 3
montane non-managed grassland up to 2.5

Expert assessment of intensity of carbon forestrymanagement practices
MANAGEMENT PRACTICES
CASE AREAS
Bulgaria Scotland Slovakia Slovenia
state
regime
private
regime
private
regime
new
forest
common
s
state
regime
tradition
al forest
common
s
state
regime
tradition
al forest
common
s
1. site preparation
burning low low low very low very low very low very low very low
planting seedlings in a regular way (digging hole and
planting bought seedling)very high very high high high very high very high very high very high
soil preparation for seeds (natural regeneration -
digging holes before winter to make good conditions
for seeds germinating )
very low low very low very low very low low very low low
2. planting management
weeding after 1-2 years, mowing weeds - biomass
from weeds is taken awayvery low low very low very low very low very low very high very high
weeding after 1-2 years, mowing weeds - biomass
from weeds stay on soilvery low low very low high very high very high very low very low
3. thinning selected cutting very high very high low high very high very high very high very high
4. harvesting
clearcuts without left organic matter very low very low very low very low very low very low very low very low
clearcuts with left organic matter very low very low high high low low very low very low
strips/squatters/cycles (specify) of trees harvested high high very low very low high high very low very low
selected cutting – harvesting very high very high low high low very low very high very high
untouched area high high high very low very low low very low low
5. timber skiddingharvestors very low very low very low high low very low low low
tractors high high high high high high very high very high
cable yarding low low very low very low very high very low low low
horses very high very high very low very low low high very low very low
Carbon gains
Carbon losses
4. Potential of carbon sequestration in European mountain regions

Case areas
Bulgaria Scotland Slovakia Slovenia
state
regime
private
regime
private
regime
new
forest
commons
state
regime
traditional
forest
commons
state
regime
traditional
forest
commons
Total area (ha) 741.8 103,989 138,106.56 675 5,410 3,831.7 4,835 2,508
Carbon
capture
(tC/ha/year) 5.74 7.42 3.31 4.78 7.98 7.88 5.11 7.69
Carbon sequestration potential in selected SES (tC/ha/year)
We calculated carbon sequestration potential (CSP) based on the prevalent
ecosystem types as a function of aggregated carbon capture (tC/ha/year) of
the respective ecosystem type multiplied by its area:
CSP = Σ (A * Cc) where
Cc is the potential magnitude of the carbon capture of a given ecosystem type
presented in table X
A is the area of each ecosystem type
Baldocchi at al. 1988, CzechGlobe – ICOS-CzeCOS network: eddy-covariance
technique
4. Potential of carbon sequestration in European mountain regions

• Statistical approaches can readily identify the influence of independent
variables, and also provide a degree of confidence regarding their
contribution.
• interpretation and understanding of spatial-temporal processes of forest
management dynamics that is provided by statistical analysis is
essential for defining the best forest managment practices as driving
forces and predicting future carbon capture depending on given forest
regime management.
• statistical purpose of this study is to understand the relations between
the forest managemnet regimes and CS. From statistical aspect, this
paper describes how the key quantitative and qualitative variables of the
given forest cases affects to carbon sequestration potential , and how
these formulas could be used in the development of statistical
exploratory model.
Statistical model

• use quantitative and categorical variables for statistical analysis to
eximine the effect of the forest management regime linked with carbon
sequestration ptential.
• Quantitative variables comprises 8 European forest case areas in which
is identified its size in ha (scale by logaritmus), its difference between
maximum and minimum elevation (scale by logaritmus), type of forest
and carbon capture.
• The first set of categorical variables represent a forest regime type
where state-centralized regime is taken as reference level, and other
regimes is represented via dummy variables.
• The otherset of categorical variables is based on previous table, in
where we create dichotomous categorical variables for each
management practice with state low (very low and low) and state high
(high and very high). Low state is set as the reference level for each
management practice.
Statistical model

• We carried out PCA analysis in three cases.
• In the first case, we analyse only quantitative variables.
• In the second case, it is accounted for both quantitative and forest
management regime dummies, and
• in the last case we added also management practices dummies based
on performance of management model.
Statistical results

Statistical results
• For each case is valid that the first two components have inertia
(eigenvalue) greater than 1, and summarize 94.83% of the total
variance in case 1, 92.29% of the total variance in case 2 and 79.84%
of the total variance in the last case.
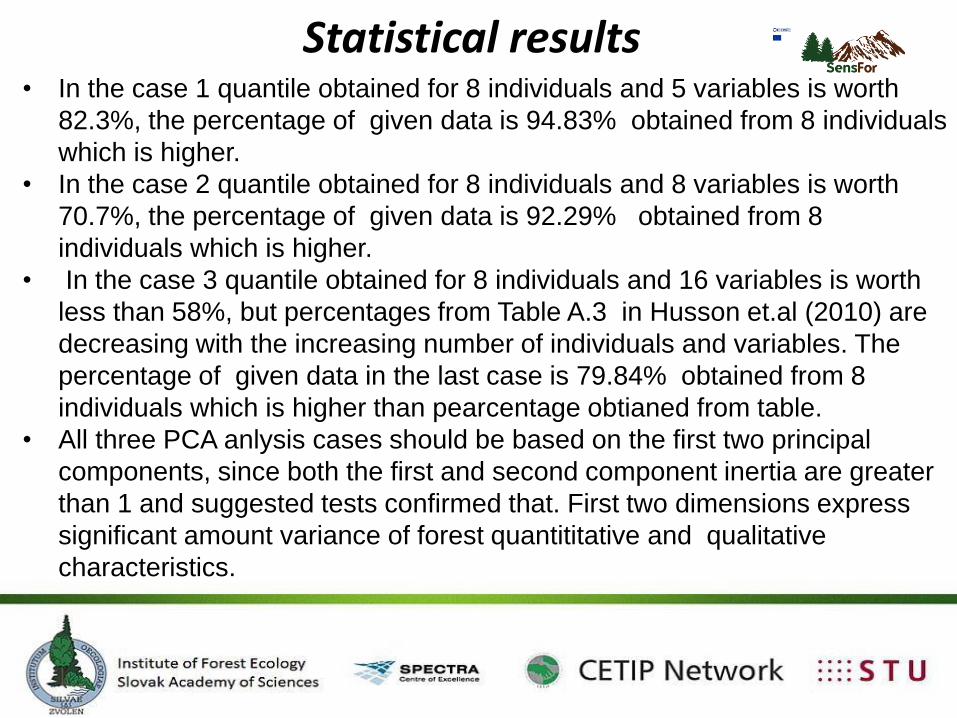
• In the case 1 quantile obtained for 8 individuals and 5 variables is worth
82.3%, the percentage of given data is 94.83% obtained from 8 individuals
which is higher.
• In the case 2 quantile obtained for 8 individuals and 8 variables is worth
70.7%, the percentage of given data is 92.29% obtained from 8
individuals which is higher.
• In the case 3 quantile obtained for 8 individuals and 16 variables is worth
less than 58%, but percentages from Table A.3 in Husson et.al (2010) are
decreasing with the increasing number of individuals and variables. The
percentage of given data in the last case is 79.84% obtained from 8
individuals which is higher than pearcentage obtianed from table.
• All three PCA anlysis cases should be based on the first two principal
components, since both the first and second component inertia are greater
than 1 and suggested tests confirmed that. First two dimensions express
significant amount variance of forest quantititative and qualitative
characteristics.
Statistical results

The scatter plot shows the
dependence of the first two
principal components. Data
points are labeled with an
assigned number for each
forest area. The scatter plot
illustrates the plane of the
first two components for the
first case
Statistical results
-0.6 -0.4 -0.2 0.0 0.2 0.4
-0.6
-0.4
-0.2
0.0
0.2
0.4
PC1
PC
2
1
2
3
4
5
6
7
8
-4 -2 0 2 4
-4-2
02
4
CC
AreaLog
ElevDiffLog
Coniferous
Broadleaves

The scatter plot shows the
dependence of the first two
principal components. Data
points are labeled with an
assigned number for each
forest area. . The scatter plot
illustrates the second PCA
case and
Statistical results
-0.6 -0.4 -0.2 0.0 0.2 0.4
-0.6
-0.4
-0.2
0.0
0.2
0.4
PC1
PC
2
1
2
3
4
5 6
7
8
-4 -2 0 2 4
-4-2
02
4
CC
AreaLogElevDiffLog
Coniferous
Broadleaves
Private
TradComm
NewComm

The scatter plot shows the
dependence of the first two
principal components. Data
points are labeled with an
assigned number for each
forest area. . The scatter plot
illustrates is the last PCA
analysis.
Statistical results
-0.4 -0.2 0.0 0.2 0.4 0.6
-0.4
-0.2
0.0
0.2
0.4
0.6
PC1
PC
2
1
2
3
4
56
7
8
-4 -2 0 2 4
-4-2
02
4
CC
AreaLog
ElevDiffLog
Coniferous
BroadleavesPrivate
TradComm
NewComm
PM2_WATAPM2_WASS
T3_SC
H4_CWITHLOM
H4_SSCTH
H4_SCH
H4_UA
TS5_CY
TS5_H
TS5_H.1

• The first figure 1 illustrates the scatter plot between the first two principal
components with numbered forest areas. The forest areas denoted with
numbers 1 and 7 representing state forest management regime and 2 and
3 representing private forest management regime have very different forest
quantitative charecteristic vectors compared with the forest areas 6 and 8
located closed to CC (carbon capture) characteristic vector.
• It indicates that traditional commons forest management regime has more
positive effect to carbon catupture while state-centrilized or private
management are not aligned with that.
• Adding also management regime dimension into model is illustrated at the
2nd Figure where the same findings are confirmed as above.
• When management practices are added into model, shown in 3rd Figure
the variables vectors orientation changed wile the distribution of 8 forest
cases points distribution follows the same patterns as in (1.) and (2.) cases.
Forest case numbered with 5 is state-centralized regime in Slovakia that
has similliar properties as traditional commons forest case numbered with 6
based on historical context.
Statistical results

1. CPR as social innovation + 2. carbon forestry as technological innovation
= carbon forestry CPR regime
that could solve:
• growing vulnerability of mountain regions and global change aspects
• social dilemmas (individual short-term interest vs. social –long-term interest) = provision of public goods (multiple ecosystem services)
• contribution to well-being of margionalized European mountain regions
Some concluding remarks

• It has been shown that exploratory statistical analysis, capable of monitoring forest management practices patterns, estimates the potential of forest management regime effect to CSP.
• The proposed statistical methodology uses the dimension reduction technique - PCA as the predictive and indicative statistical tool.
• Exploratory spatial data analysis can discover the influence of each continuous variable but not systematic ranking.
• The results of PCA analysis demonstrated that first two principal components are sufficient to represent patterns in forest management regime linked with CSP.
Some concluding remarks

Thank you for your attention!
“ Complexity is not the same as chaos.”Elinor Ostrom (2009)


