1.0 Commercial Cladding - Lightweight Precast Concrete for ...

Research ArticleEnhancing the Seismic Performance of Precast RC Frames withCladding Panels through Setting U-Shaped Dampers andRocking Walls
Qing Jiang 12 Hanqin Wang1 Yulong Feng 12 Xun Chong12 Junqi Huang12
and Yibo Liu1
1School of Civil Engineering Hefei University of Technology Hefei 230009 Anhui China2Anhui Civil Engineering Structures and Materials Laboratory Hefei 230009 Anhui China
Correspondence should be addressed to Yulong Feng feng_yulong126com
Received 21 February 2020 Revised 17 May 2020 Accepted 22 May 2020 Published 16 June 2020
Academic Editor Alfredo Reyes-Salazar
Copyright copy 2020 Qing Jiang et al is is an open access article distributed under the Creative Commons Attribution Licensewhich permits unrestricted use distribution and reproduction in any medium provided the original work is properly cited
An approach combining U-shaped dampers (USDs) and rocking walls is proposed in this paper to improve the seismic per-formance of traditional precast reinforced concrete (RC) frames with cladding panels (PRCFCPs) (1) the steel bar and USDconnectionmethods are adopted at the top and bottom of the cladding panels to use the relative deformation between the claddingpanels and the main structure and then dissipate the seismic energy and (2) rocking walls are added to the structure to control thestructural deformation profiles e USD numerical model is calibrated using the test data and a series of nonlinear pushoveranalyses dynamic time-history analyses and incremental dynamic analyses are successively performed to compare the seismicperformance and collapse capacity of the PRCFCP PRCFCP with USDs (PRCFCP-USD) and PRCFCP with USDs and rockingwalls (PRCFCP-USD-RW)e results show that the USDs in the PRCFCP-USD-RW undergo more uniform deformation alongthe structural height and higher energy dissipation efficiency and the PRCFCP-USD-RW exhibits enhanced seismic performanceand collapse capacity which verify the superiority of the proposed combined approach
1 Introduction
Precast concrete cladding panels (PCCPs) fabricated atmanufacturing plants and assembled on a supporting mainstructure at the project site have been widely used as anarchitectural external wall system during the past severaldecades [1] Losch et al [2] described the art of precastprestressed concrete sandwich wall panels and noted that theuse of this kind of PCCP has becomemore widespread in theUnited States According to the current design specification[3 4] PCCPs are primarily designed as a nonstructuralmember to bear their self-weight and out-of-plane loadsincluding seismic and wind loads
Belleri et al [5] summarized the vulnerabilities of thecladding panels following major earthquakes in the Italianterritory and noted that the interaction between the claddingpanels and the main structure was a noticeable vulnerability
of the structuree connection details between the claddingpanels and the supporting structure significantly affect theirinteraction which might reduce the performance and safetyof both panels and main structure [6 7] To mitigate theinteraction and reduce the sensitivity of the PCCP to thedeformation of the main structure the Precast ConcreteInstitute (PCI) recommends that the force transmission pathfrom the cladding panel to the main structure should bestatically determinate each cladding panel should not bemore than two gravity-bearing connections and thoseconnections should be placed in the same horizontal posi-tion [3] us the commonly used connection form is afour-point flexible connection including two gravity-bear-ing connection points and two lateral force-bearing con-nection points At present the steel bar and limiting deviceconnection methods are adopted at the top and bottom ofthe cladding panels in China [4] as shown in Figure 1(a)
HindawiShock and VibrationVolume 2020 Article ID 4182094 16 pageshttpsdoiorg10115520204182094
where the steel bars are placed at the top of the claddingpanel and protrude into the floor cast-in-place layer limitingdevices constructed by angle steel are connected with thecladding panel and main structure by long bolts e steelbar and limiting device connection can resist out-of-planedisplacement of the cladding panel and prompt the claddingpanel sliding in-plane e PCCPs with the aforementionedconnection forms will exhibit sliding or rocking deformationunder an earthquake ese deformation modes are rec-ommended to coordinate the deformation of the mainstructure and reduce the interaction between the claddingpanels and the main structure to enhance the structuralsafety [8]
Accordingly there is a relative deformation between thecladding panels and the main structure in which variousenergy dissipaters were arranged by many scholars to im-prove the seismic performance of the structures with PCCPsTyler [9] used polytetrafluoroethylene sliding joints toseparate the cladding panels from the main structure of abuilding and noted that their use enables the damping ofearthquake and wind motions Cohen and Powell [10]classified the energy-consuming connections around thecladding panels and studied the design methods of theseconnections Pinelli et al [11] connected the cladding paneland the main structure by an elliptical soft steel energydissipater e test and finite element analyses showed thatthe performance of this energy-dissipating connection formwas stable Ferrara et al [12] experimentally evaluated thebehaviour of friction dampers to be used along the edges ofthe cladding panels in precast reinforced concrete (RC)buildings Baird et al [13] installed U-shaped flexural platesat the lateral connection point of the four-point connectedcladding panel and found that the U-shaped flexural platescan effectively dissipate seismic energy and reduce the de-formation of the structure under earthquakes Negro andLamperti Tornaghi [14] investigated PCCPs with friction-based devices and the reliability was confirmed by severaltests Lago et al [15 16] proposed a steel w-shaped foldedplate dissipative connector and a multiple-slit device for thePCCPs e test results showed that the proposed devicescan be effectively used for precast RC structures withcladding panels Karadogan et al [17] arranged steelcushions that have excellent dissipation capacity between themain structure and PCCPs e test results showed that theplastic deformations accumulated on the steel cushions andno damage was observed on the PCCPs using bolts toconnect the steel cushions and PCCPs is a reliable con-nection technique
e soft-storey failure of RC frames has been mentionedby some existing studies and rocking systems have proven tobe an effective means to control the structural deformationand damage distribution [18 19] In particular the rockingsystems and the energy dissipaters have been frequentlycombined to obtain enhanced seismic performance struc-tures Deierlein et al [20] proposed an earthquake resilientrocking steel frame system with energy-dissipating fuses andconfirmed that the system can sustain extreme earthquakeground shaking without structural damage Wada et al [21]retrofitted the G3 teaching building at Tokyo Industrial
University with rocking walls and steel dampers isstructure survived the 2011 Miyagi earthquake Twigdenandand Henry [22] experimentally investigated a posttensionedrocking wall with energy-dissipating O-connectors attachedalong the vertical Zhang et al [23] combined precastrocking walls and friction dampers or buckling-restrainedbraces to form an inertial force-limiting floor anchoragesystem that is a low-damage seismic-resistant system Fenget al [24] used rocking walls to mitigate the drift concen-tration issue of buckling-restrained braced frames Rahgozaret al [25] numerically investigated the effects of soil-foundation modelling on the seismic performance ofrocking braced frames with butterfly-shaped fuses esestudies indicated that the rocking systems might make theenergy dissipaters work more effectively
In this paper in order to retrofit the existing structureof the precast RC frame with cladding panels (PRCFCPs)U-shaped dampers (USDs) that were developed in 1972 byKelly et al [26] and rocking walls are added into a PRCFCPto form a damping and damage-controlling system ispaper focuses on the effect of the USDs and rocking wallson the seismic performance of the PRCFCP through nu-merical investigations and comparative analyses A series ofnonlinear pushover analyses dynamic time-history ana-lyses and incremental dynamic analyses are performed tocompare the seismic performance and the seismic collapsecapacity of the PRCFCP PRCFCP with the USDs(PRCFCP-USD) and PRCFCP with the USDs and rockingwalls (PRCFCP-USD-RW)
2 Description of the Structural System
21 Connection Details Figure 1(b) shows a connectiondetail of the proposed damping cladding panels A precastconcrete sandwich wall panel is used as the cladding paneland connected to the main structure at each storey ecladding panel is connected to the upper and down floorsthrough a row of steel bars and USDs at the top and bottomof the cladding panel which are deemed the steel bar andUSD connection methods respectively e USDs areconnected to other members through high-strength bolts[17 27] In this steel bar connection method two layers ofsteel bars are placed at the top of the cladding panel andprotrude into the floor cast-in-place layer and then a fixedconstraint end is formed to resist out-of-plane loads usthe construction quality and earthquake safety are easilyguaranteed For the entire cladding panel that spans a singlestorey using these connection methods the deformationmode under a horizontal earthquake is dominated byhorizontal sliding deformation at the bottom of the claddingpanel us the USDs that are set in the places where USDsundergo horizontal sliding deformations can dissipate en-ergy through their own plastic deformations as shown inFigure 1(c)
22 Structural Systems Figure 2 describes the schematic ofPRCFCP-USD-RW as a retrofitting structure of PRCFCPwhich consists of a precast RC frame with the proposed
2 Shock and Vibration
cladding panels as shown in Figure 1 and some rockingwalls are attached only to beams at the middle of thestructure in the Y direction e cladding panels in thePRCFCP-USD-RW are no longer a nonstructural elementbut are a support member of the USDs Together with theUSDs a shock absorbing unit is formed to transmit theinterstorey drift generated by the earthquake to the USDsand the plastic deformation of the USDs is used to dissipate
the seismic energy to reduce the main structural damagee rocking walls can render the storey drift of the structureuniform When the storey drift is uniform the USDs at eachstorey can exert an energy dissipation capacity e col-laboration between the USDs and the rocking walls plays adual role in coordinating the interstorey drift and energydissipation to achieve a controllable damage degree anddistribution
Mainstructure
Postpouringpart
Steel bar
Precast concrete cladding panel
Insulation material
Limiting deviceLong bolts
Limiting device
Long bolt
Sliding deformation
(a)
Mainstructure
Postpouringpart
Precast concrete cladding panel
USD Steel bar
Bolt
Insulation material
(b)
Cladding panel
Main structure
USD
BoltSliding
deformation
(c)
Figure 1 Connection details and deformation mode of the proposed damping cladding panel (a) Typical cladding connection 2 in China(b) Connection details (c) Deformation mode of the proposed damping cladding panel
Claddingpanel
USD
Beam
Column
Beam
XY
Dampingcladding panel
Rocking wall
Column
USD
Claddingpanel
Rocking wallCladding
panel
Figure 2 Schematic of a PRCFCP-USD-RW system
Shock and Vibration 3
3 Contrast Models and Finite Element Models
31 Calibration of the USDModel OpenSees [28] numericalsimulation software is used for the nonlinear analysis in thispaper e definition of the USD parameters in the model isbased on the force-displacement curve obtained from a testperformed by the authors Figure 3(a) shows the USD testmodel and loading device e length width height andthickness of the USD are 276mm 70mm 174mm and12mm respectively e material of the USD is Q235 steel(GB50017-2003) [29] Figure 3(b) shows the loading pro-tocol in this test e loading amplitude displacements ofeach stage are 3mm 7mm 14mm 28mm 42mm and60mm respectively e front five stages are cycled threetimes and the last stage is cycled approximately 18 timese USD in OpenSees uses the Steel02 model and the zero-length element for the simulation [30]e Steel02 model hasa yield force Fy 1197 kN and initial elastic stiffnessE 399 kNmm e parameters controlling the transitionfrom the elastic stage to the plastic stage are as followsR0 20 CR1 0925 and CR2 015 Additionally the iso-tropic hardening parameters are a1 025 a2 5 a3 025and a4 5 e definition of these parameters can be foundin [28] Figure 3(c) shows the comparison of force-dis-placement curves between the simulations and the experi-mentse simulated results are basically consistent with theexperimental results indicating that the USD model pa-rameters are set properly
32 Contrast Models Figure 4(a) shows an 8-storey RCframe structure from [31] e 8-storey RC frame wasdesigned based on existing Chinese code for the design ofconcrete structures and seismic design of buildings How-ever the soft-storey also occurred in this baseline buildingunder horizontal earthquake loads and can be prevented bythe addition of rocking walls which is the reason to use this8-storey RC frame herein as a benchmarkmodel to constructother contrast models e structural plane is a rectangle of24m by 504m and the column spacing is 75m or 30me earthquake resisting system of the benchmark modelcomprises five and four moment-resisting frames (MRFs) atthe transverse and longitudinal directions of the structure (Xand Y directions) respectively e first and second storeyshave heights of 45m and 40m respectively and the upperstoreys have a height of 35m resulting in a total height of295m e benchmark model is designed for a seismic areawith Site Classification II and design ground Group 1classified as a zone of intensity 8 with a basic design peakground acceleration (PGA) of 02 g Two concrete strengthgrades were adopted C40 for all beams and floors and C45for all columns (ie the cubic compressive strengths of theconcrete are 40MPa and 45MPa resp) HRB 400 rein-forcement (ie hot rolled ribbed reinforcement with a yieldstrength of 400MPa) was adopted for the longitudinal mildsteel reinforcement of beams floors and columns ethickness of all floors was 100mm and the distribution steelreinforcements bilaterally distributed were allφ10200 (φ10means that the diameter of distribution steel reinforcements
is 8mm 200 means that the spaces of distribution steelreinforcement are 200mm) All columns and beams usedrigid connections More information regarding this framestructure such as the beam-column section size and rein-forcement and design dead and live loads can be found in[31]
To illustrate the performance advantages of theproposed PRCFCP-USD-RW three different contrastmodels are developed based on the benchmark modelOnly the Y direction seismic action is considered thusthe comparison model considers only the addition of therocking walls and the cladding panels in the Y directionand the earthquake resisting system in the X direction isthe same as the benchmark model e traditional anddamping cladding panels are added to the benchmarkmodel in the Y direction and the PRCFCP and PRCFCP-USD models are created as shown in Figures 4(b) and4(c) respectively e traditional cladding panels at thebottom are connected by two limiting devices that allowthe panel to slide freely under design displacement Inthe PRCFCP-USD model four USDs are arranged at thebottom of each cladding panel and the size and materialof each USD are the same as those shown in Figure 3(a)Furthermore four rocking walls are added to thePRCFCP-USD model in the Y direction and thePRCFCP-USD-RW model is formed as shown inFigure 4(d) e sectional dimension of the rocking wallsis the same as that in [31] which is 3600 mm times 150mme paper focuses on the seismic responses of threecomparison models ie PRCFCP PRCFCP-USD andPRCFCP-USD-RW
33 Finite ElementModels Figure 5 schematically shows thefinite element model of the PRCFCP-USD-RW ebenchmark PRCFCP and PRCFCP-USD finite elementmodels are modelled using the same techniques In thispaper the RC beams columns and rocking walls aremodelled via displacement-based beam-column (dis-pBeamColumn) fibre elements in which their concrete andsteel reinforcement materials use Concrete01 (because thetensile strength is less than the compressive strengthConcrete01 is used to build model) and Steel02 (the elastictangent of reinforcement is 200GPa and strain-hardeningratio is 001) respectively Some approaches have beenproposed to model the panels (or walls) such as the mul-tilayer element [32] or rigid beam element [33] with thebottom linked by a nonlinear zero-length element ecladding panels and floors are simulated by shell elementsand the material adopts an elastic model Notably the shellelements for cladding panels are not connected to the ad-jacent columns and the master nodes of rigid diaphragm ateach storey were set in the structural centroid e limitingdevices in the PRCFCP and the USDs in the PRCFCP-USDand PRCFCP-USD-RW are simulated by zero-length ele-ments which replaces the translational constraint in theloading direction by a Steel02 material defining the force-displacement relationship shown in Section 31 e finiteelement models for the PRCFCP-USD and PRCFCP-USD-
4 Shock and Vibration
XY
75
75
75
75
75 30 75
Column
Beam
(a)
75 30 75
Cladding panel
(b)
75 30 75
Dampingcladding panel
(c)
75 30 75
Rocking wall
Dampingcladding panel
(d)
Figure 4 Benchmark model and three kinds of contrast models (unit m) (a) Benchmark model (b) PRCFCP (c) PRCFCP-USD (d)PRCFCP-USD-RW
254018175
1215
012
70
Oslash18
18
(a)
Disp
lace
men
t (m
m) 18 times
ndash60ndash40ndash20
0204060
20 30 40 5010Load steps
(b)
ExperimentSimulation
ndash40 ndash20 0 20 40 60ndash60Displacement (mm)
ndash30
ndash20
ndash10
0
10
20
30
Forc
e (kN
)
(c)
Figure 3 Calibration of the USD finite element model (a) Loading device and the design of the USD (unit mm) (b) Loading protocolin thetest (c) Comparison of the simulations and experiments
Shock and Vibration 5
RW use one zero-length element to simulate two USDstherefore the stiffness and yield force are twice the one USDshown in Figure 3(c) e initial elastic stiffness in thePRCFCP is deliberately set to infinity for the purpose ofsimulating the free sliding of the cladding panels e beamcolumn and beamrocking walls joints use rigid connectionsand pinned connections respectively
e model mass is added to each storey node in the formof a concentrated mass e lateral load is an inverted tri-angle mode in nonlinear pushover analyses and the Rayleighdamping with natural damping ratio is 005 in the nonlineardynamic time-history analyses e seismic lateral loads acton the structural Y direction All nonlinear analyses considerthe P-delta effect of gravity e fundamental periods (T1) ofthe benchmark model and three contrast models are shownin Table 1
34 Ground Motions Selection e dynamic time-historyanalyses use 22 ground motions recommended in [26] asreported in Table 2 Figure 6 shows the acceleration responsespectra for 22 ground motions-adjusted acceleration peaksto 4ms2 and the acceleration design spectrum corre-sponding to the major earthquake specified by the Chinesecode (GB 50011ndash2010) [34] e average and design spec-trum accelerations (Sa) are similar is paper focuses on theaverage value of the structural responses under 22 groundmotions Since the three contrast models have a large re-sponse under the 9th ground motion (GM9) this paper alsofocuses on the performance differences of the comparison
models under the 9th ground motion and its accelerationtime-history curves are shown in Figure 7
4 Nonlinear Pushover Analyses
Figure 8 shows curves of the base shear force and the roofdisplacement for the contrast models under inverted trianglelateral load e curve slope of the PRCFCP-USD is slightlylarger than that of the PRCFCP before the structures yielderefore the PRCFCP-USD exhibits a slightly larger lateralstiffness than the PRCFCP indicating that the addition ofthe USD can improve the structural stiffness to a certainextent e lateral load-carrying capacity of the PRCFCP-USD is also slightly larger than that of the PRCFCP andtheir base shear forces show a significant downward trendafter they reach the peak lateral load-carrying capacityFigure 8 also shows that the curve slopes of the PRCFCP-USD and PRCFCP-USD-RW structures basically remainconsistent before the structures yield which is mainly be-cause the addition of rocking walls cannot change the lateralstiffness of the structures Notably the lateral load-carryingcapacity of the PRCFCP-USD-RW is unchanged and issignificantly larger than that of the PRCFCP-USD as theloading continues is result indicates that the lateral load-carrying capacity and ductility of the PRCFCP-USD areenhanced by the participation of the rocking walls
Figures 9(a)ndash9(c) show curves of the storey shear forceand the storey drift ratio of the frames in the contrast modelsunder the structural pushover Notably the interstorey shearforce is the sum of the shear forces of all frame columns
Column
Beam
Shell element (cladding panel)
Dispbeamcolumn element(rocking wall)
Dispbeamcolumn element(beam and column)Zerolength element(limiting devices in PRCFCP andUSDs in PRCFCP-USD(-RW))
Steel02 material(steel bar)
Concrete01 material(concrete)
Rigid connection
Fixed support
Pinned support
Rocking wall
Shell element (floor) Pinned connection
Beamcolumncross section
Figure 5 Numerical models used in this paper
6 Shock and Vibration
Figure 9(d) shows curves of interstorey drift ratio when thestructures arrived at the peak lateral load-carrying capacity
A drift concentration factor (DCF) was defined by [35] as(1) for the purpose of evaluating the structural lateral de-formation mode and damage concentration degree eparameter θmax is the maximum interstorey drift ratio uroof
is the structural roof displacement and H is the structuraltotal height If DCF 1 the structural interstorey drift ateach storey is identical When structures arrive at the peaklateral load-carrying capacity the DCF values of threecontrast models are also listed in Figure 9(d) where DCF1-DCF3 represent the DCF values of the PRCFCP PRCFCP-USD and PRCFCP-USD-RW respectively
DC F θmax
uroof H (1)
It can be observed in Figures 9(a) and 9(b) that whenstructures arrive at the peak lateral load-carrying ca-pacity the interstorey drift ratios of 1F and 2F are higherthan those of 3Fndash8 F in the PRCFCP and PRCFCP-USDand the interstorey shear forces of 3Fndash8 F do not reachtheir interstorey lateral load-carrying capacities
Table 1 Periods of all models (the values in brackets are the modal mass participating ratios)
Models Reference [31] Benchmark model PRCFCP PRCFCP -USD PRCFCP -USD-RWT1 (s) 1169 1118 (0825) 1051 (0840) 0915 (0861) 0910 (0951)
Table 2 22 ground motions recommended in [26]
Number Earthquake Year Component Magnitude (M) PGA (ms2)1 Friuli Italy-01 1976 A-TMZ270 650 2932 Imperial Val-06 1979 H-DLT352 653 3443 Imperial Val-06 1979 H-PTS315 653 2004 Superst Hills-02 1987 B-IVW360 654 1825 Loma Prieta 1989 G03090 693 3606 Loma Prieta 1989 HDA165 693 2077 Loma Prieta 1989 HSP000 693 3638 Landers 1992 CLW - TR 728 3049 Landers 1992 JOS090 728 27810 Landers 1992 YER270 728 16511 Northridge-01 1994 LOS270 669 47212 Northridge-01 1994 ORR090 669 55713 Northridge-01 1994 STM090 669 73814 Kobe Japan 1995 KAK090 690 33815 Kobe Japan 1995 SHI000 690 23816 Duzce Turkey 1999 BOL090 714 80617 Chichi Taiwan-05 1999 TCU029-N 762 19718 Chichi Taiwan-05 1999 TCU070-E 762 25019 Chichi Taiwan-05 1999 TCU095-E 762 33520 Wenchuan 2008 UA0097 800 45921 Wenchuan 2008 UA0103 800 27922 Wenchuan 2008 UA0196 800 323
ActualActual averageGB 50011-2010
PRCFCP-USD-RW (T1)
PRCFCP (T1)
PRCFCP-USD (T1)0
5
10
15
20
S a (m
middotsndash2)
1 2 3 40Period (s)
Figure 6 Comparison between the design spectrum and thespectra of actual ground motions
Acce
lera
tion
(mmiddotsndash2
)
ndash4
ndash2
0
2
4
10 20 30 40 500Time (s)
Figure 7 Acceleration time-history curve for GM9
Shock and Vibration 7
implying that these storeys basically maintain the elasticstatus eDCF values of the PRCFCP and PRCFCP-USDare 240 and 243 respectively which means that thedamage concentration exists After the structures arriveat the peak lateral load-carrying capacity the interstoreydrift ratios of 2F in the PRCFCP and PRCFCP-USD arecontinuously increased as the loading continues how-ever the interstorey drift ratios and shear forces of otherstoreys are slightly and considerably decreased respec-tively ese results indicate that the damage of thePRCFCP and PRCFCP-USD is concentrated on thesecond storey and that the capacities of other storeyscannot be fully used
Figure 9(c) shows that the interstorey drift ratios at eachstorey of the PRCFCP-USD-RW are basically the same andthe DCF value is only 109 when it arrives at the lateral load-carrying capacity e trends of the interstorey shear forceand the drift ratio curves are similar among the differentstoreys during the whole loading process and all storeys canenter the plastic phase at the same time e results indicatethat the capacities of all storeys can be fully used due to theaddition of rocking walls
In conclusion it is difficult to change the structuraldeformation mode by the use of USDs however the ad-dition of rocking wall is an effective way to control thedistribution of the interstorey shear force and drift
1F2F3F4F
5F6F7F8F
Peak bearingcapacity
1 2 3 40Story dri ratio ()
0
4
8
12
16
20
Shea
r for
ce (k
N times
103 )
(a)
1F2F3F4F
5F6F7F8F
Peak bearingcapacity
1 2 3 40Story dri ratio ()
0
4
8
12
16
20
Shea
r for
ce (k
N times
103 )
(b)
1F2F3F4F
5F6F7F8F
Peak bearingcapacity
1 2 3 40Story dri ratio ()
0
4
8
12
16
20Sh
ear f
orce
(kN
times 1
03 )
(c)
PRCFCPPRCFCP-USDPRCFCP-USD-RW
DCF1 = 240
DCF2 = 243
DCF3 = 109
1 2 3 4 50Interstory drift ()
1
2
3
4
5
6
7
8
Stor
y
(d)
Figure 9 Interstorey shear force and interstorey drift curves of the frame (a) PRCFCP (b) PRCFCP -USD (c) PRCFCP -USD-RW (d)Inter-storey drift
00 020
5
10
15
PRCFCPPRCFCP-USDPRCFCP-USD-RW
Peak bearing capacity
ndash05 00 05 10 15 20ndash10Roof displacement (m)
0
5
10
15
20
25
Base
shea
r (times1
03 kN
)
Figure 8 Curves of the base shear force and roof displacement
8 Shock and Vibration
5 Nonlinear Dynamic Time-History Analyses
51 Peak InterstoreyDrift Responses Figure 10 compares thedistributions of the peak interstorey drift ratios for thecontrast models under major earthquakes e peak inter-storey drift ratios of the PRCFCP and PRCFCP-USD exhibitan obvious increase at the second storey indicating that thestructures show an interstorey damage concentration eaverage interstorey drift ratio of the PRCFCP is close to theallowable limit (2) [27] A comparison of Figures 10(a) and10(b) shows that the peak interstorey drift ratios of thePRCFCP-USD are less than those of the PRCFCP whichillustrates that USDs arranged in the structure can play a rolein energy dissipation to reduce the peak interstorey driftresponse Figure 10(c) shows that the peak interstorey driftratios of the PRCFCP-USD-RW are uniformly distributedand do not exhibit obvious increase or reduction and theaverage value is far less than 2 ese results indicate thatthe USDs and rocking walls of the PRCFCP-USD-RW canwork together to render peak interstorey drifts small anduniform
Figure 11 presents the corresponding DCF results of thecontrast models under major earthquakes e DCF averagevalues for the PRCFCP PRCFCP-USD and PRCFCP-USD-RW under various ground motions are 253 250 and 119and their standard deviations are 089 049 and 009 re-spectively ese results indicate that the rocking walls cancontrol structural deformation and reduce the randomnessof the damage concentration Compared with the PRCFCPthe DCF values of the PRCFCP-USD are larger under someground motions In other words the DCF value may beincreased and the unevenness of the interstorey drift dis-tribution may be deepened when the USDs are arrangedis conclusion that the USD cannot control the structuraldeformation mode is consistent with Figures 9 and 10
52 Hysteresis Responses of the USDs For the PRCFCP-USDand PRCFCP-USD-RW structures the USDs at the sameposition of each storey are selected to check the hysteresisresponse Figure 12 shows the USDsrsquo hysteretic curves of thePRCFCP-USD and PRCFCP-USD-RW at each storey underthe 9th ground motion As shown in Figure 12(a) thehysteretic curves of the USDs arranged at 1 F and 2 F are fulland the energy dissipations are overused in which the USDsmay reach their energy limit and be destroyed e USDs at3 Fndash6 F cannot fully use the performance and the USDsarranged at 7 F and 8 F are in the elastic phase and basicallydo not dissipate any seismic energy ese results indicatethat compared to the PRCFCP-USD-RW the PRCFCP-USD is prone to the serious damage concentration in thatthe USDs yield only at less storeys
As shown in Figure 12(b) the USDs in the PRCFCP-USD-RW show uniform energy dissipation along thestructural height A comparison of Figures 12(a) and 12(b)shows that the energy dissipation of the USDs at 1 F and 2 Fin PRCFCP-USD-RW is less than that of PRCFCP-USD andthis situation is reversed at other storeys In particular theUSDs placed at 7 F and 8 F in PRCFCP-USD-RW are still
able to dissipate energy indicating that the addition ofrocking walls can enable all USDs at each storey to enter theenergy dissipation stage by coordinating each storey drift toavoid the waste of the USD performance e distributionsof the USDsrsquo displacement responses at each storey observedfrom Figures 12(a) and 12(b) are consistent withFigures 10(b) and 10(c) respectively because the defor-mation of the USDs is mainly determined by the interstoreydrift of the frameus the distribution of the USDsrsquo energydissipation at each storey is also consistent with the struc-tural interstorey drifts
53 Dispersion Coefficients A dispersion coefficient αi isdefined herein as (2) for the purpose of evaluating the level ofuneven energy dissipation of the USDs at each storey eparameter μi is the ductility coefficient of the USD at the ithstorey and μave is the average value of μi which can becalculated using (3) When αi is closer to 1 the difference inthe USDsrsquo energy dissipation at each storey is less
αi μiμave (i 1 sim 8) (2)
μave μ1 + μ2 + + μ8( 11138578 (3)
Figure 13 shows the distribution of αi for the PRCFCP-USD and PRCFCP-USD-RW under the 22 ground motionse αi of the PRCFCP-USD and PRCFCP-USD-RW falls inthe range of 05ndash25 and 08ndash13 respectively In otherwords the difference in the energy dissipation of the USDs atvarious storeys in the PRCFCP-USD-RW is less than that ofthe PRCFCP-USD erefore the addition of rocking wallscan control the USDs at various storeys to uniformly dis-sipate the seismic energy
54 EnergyDissipation Figure 14 shows a comparison of thetotal energy dissipation for contrast models under eachground motion Table 3 gives the average energy dissipationof the frame and USDs in three models under 22 groundmotions e total energy dissipation of the PRCFCP-USDand the PRCFCP-USD-RW is similar From the foregoinganalyses although the dissipated energy of the USDs at 1 Fand 2 F in the PRCFCP-USD-RW is less than that of thePRCFCP-USD the USDs at other storeys of the PRCFCP-USD-RW can fully dissipate the energy which further causesthe total energy dissipation of the USDs in the PRCFCP-USD-RW to be greater than that of the PRCFCP-USD eseismic energy dissipation by the frame in the PRCFCP ishigher than that in the others which means that the damageto the frame in the PRCFCP is more serious than that in thePRCFCP-USD and PRCFCP-USD-RW In addition theseismic energy dissipation by the frame in the PRCFCP-USD-RW is only 63 of that in the PRCFCP-USD eresult indicates that the combination of USDs and rockingwalls can effectively reduce the damage to the mainstructure
Figure 15 shows the energy dissipation at each storey ofthe three contrast models under the 9th ground motion eseismic energy in the PRCFCP and PRCFCP-USD is mainly
Shock and Vibration 9
dissipated by the members at the 1ndash2 storeys which is asignificantly uneven energy dissipation e frame at storeys1ndash2 in the PRCFCP and PRCFCP-USD exhibits severeplastic deformation while the frame at storeys 6ndash8 basicallymaintains flexibility which means that the PRCFCP-USDexhibits damage concentration In contrast the frame andUSDs in the PRCFCP-USD-RW roughly consume the sameenergy at each storeye damage of the PRCFCP-USD-RWis concentrated in the USDs and each storey of the frameevenly produces a slight plastic deformation Compared withthe PRCFCP-USD the PRCFCP-USD-RW exhibits en-hanced seismic performance and the proposed approach ofcombining the USDs and the rocking walls can protect themain frame to avoid severe destruction and damageconcentration
55 Residual Displacement Figure 16 shows the distribu-tions of the residual interstorey drift ratios of the contrastmodels under major earthquakes e largest residualinterstorey drift ratio of the PRCFCP occurs at 2F and theaverage value is 029 while the values of the PRCFCP-USDand PRCFCP-USD-RW are only 0075 and 0031 re-spectively Compared with the PRCFCP the peak residualinterstorey drift ratios of the PRCFCP-USD and PRCFCP-USD-RW are reduced by 741 and 893 respectivelyese results mean that the residual displacement can bereduced by the participation of USDs and the rocking wallscan enhance the USDsrsquo capacity of reducing the residualdisplacement e residual displacement of the PRCFCP-USD-RW is also uniformly distributed at various storeyssimilar to the peak deformation
PRCFCP
PRCFCP-USD
PRCFCP-USD-RW
Average value253 (PRCFCP)
Average value250 (PRCFCP-USD)
Average value 119 (PRCFCP-USD-RW)
4 8 12 16 200Ground motions
0
1
2
3
4
5
6
DCF
Figure 11 Comparison of the DCFs under major earthquakes
2
ActualAverage
1 2 3 4 5 6 70Interstory dri ratio ()
0
1
2
3
4
5
6
7
8
Stor
y
(a)
2
ActualAverage
1 2 3 4 5 60Interstory dri ratio ()
0
1
2
3
4
5
6
7
8
Stor
y(b)
2
ActualAverage
1 2 3 40Interstory dri ratio ()
0
1
2
3
4
5
6
7
8
Stor
y
(c)
Figure 10 Comparison of the peak interstorey drift distributions under major earthquakes (a) PRCFCP (b) PRCFCP -USD (c) PRCFCP-USD-RW
10 Shock and Vibration
6 Incremental Dynamic Analyses (IDAs)
61 IDA Curves e seismic collapse capacities of the threecontrast models are analysed via the incremental dynamicanalysis (IDA) method [36] under the 22 ground motionsshown in Section 34 e limit interstorey drift ratio of 20
specified by ASCE7-10 [37 38] is used as the sign of thecollapse e approach used to scale the 22GMs was thehuntampfill algorithm mentioned in [39] e amplitudemodulation and the increment of the step are 02 g and005 g respectively and the Sa (T1 5) (means the spectralacceleration of the ground motions at the fundamental
1F 2F 3F 4F
5F 6F 7F 8F
0 100ndash100Displacement
(mm)
0 100ndash100Displacement
(mm)
0 100ndash100Displacement
(mm)
0 100ndash100Displacement
(mm)
0 100ndash100Displacement
(mm)
0 100ndash100Displacement
(mm)
0 100ndash100Displacement
(mm)
0 100ndash100Displacement
(mm)
ndash50
0
50
Forc
e (kN
)ndash50
0
50
Forc
e (kN
)
ndash50
0
50
Forc
e (kN
)
ndash50
0
50
Forc
e (kN
)
ndash50
0
50
Forc
e (kN
)
ndash50
0
50
Forc
e (kN
)
ndash50
0
50
Forc
e (kN
)
ndash50
0
50
Forc
e (kN
)
(a)
1F 2F 3F 4F
0 100ndash100Displacement
(mm)
0 100ndash100Displacement
(mm)
0 100ndash100Displacement
(mm)
0 100ndash100Displacement
(mm)
ndash50
0
50
Forc
e (kN
)
ndash50
0
50
Forc
e (kN
)
ndash50
0
50
Forc
e (kN
)
ndash50
0
50
Forc
e (kN
)
5F 6F 7F 8F
0 100ndash100Displacement
(mm)
0 100ndash100Displacement
(mm)
0 100ndash100Displacement
(mm)
0 100ndash100Displacement
(mm)
ndash50
0
50
Forc
e (kN
)
ndash50
0
50
Forc
e (kN
)
ndash50
0
50
Forc
e (kN
)
ndash50
0
50
Forc
e (kN
)
(b)
Figure 12 Hysteresis responses of the USDs at different storeys of PRCFCP-USD and PRCFCP-USD-RW under GM9 (a) PRCFCP-USD(b) PRCFCP-USD-RW
Shock and Vibration 11
period of the structure corresponding to 5 damping ratio)of the first analysis step is 0005 ge amplitude modulationcoefficient (λi) and the inputting acceleration of 22 groundmotions used in the analyses (Sarsquo) can be calculated using (4)and (5) respectively
λi Sa(T1 5)SGT (4)
Saprime λi middot Sa (5)
where SGT is the spectral acceleration for 22 ground mo-tions-adjusted acceleration peaks to 4ms2 corresponding tothe major earthquake specified by the Chinese code (GB
50011ndash2010) and Sa is the actual acceleration of the 22ground motions (the peak Sa was modulated to 1ms2 in thispaper)
Figure 17 shows the IDA curves of the three contrastmodels corresponding to 16 50 and 84 quantilelevels e IDA curves of the PRCFCP corresponding tothree quantile levels are lower than those of the PRCFCP-USD and PRCFCP-USD-RW indicating that the additionof USDs can improve the seismic collapse capacity eIDA curve of the PRCFCP-USD-RW is significantly higherthan that of the PRCFCP-USD which reveals that therocking walls can further improve the structural seismiccollapse capacity
0 2 4 6 8 10 12 14 16 18 20 22
Frame of PRCFCP
USDs of PRCFCP-USD
Frame of PRCFCP-USD
USDs of PRCFCP-USD-RW
Frame of PRCFCP-USD-RW
Ener
gy (times
102
kNmiddotm
)
Seismic waves
0
20
40
60
80
Figure 14 Comparison of the total energy dissipation under 22 ground motions
PRCFCP-USDPRCFCP-USD-RW
Disp
ersio
n co
effici
ent
8 15 221Ground motions
ndash1
0
1
2
3
4
Figure 13 Dispersion coefficients of the USDs energy dissipation under 22 ground motions
Table 3 Average energy dissipation of the frame and USDs under 22 ground motions (unit kNmiddotm)
PRCFCP-USD PRCFCP -USD-RW PRCFCP -USD-RWPRCFCP -USD ()Frame 76685 48392 63USDs 145487 153809 106Total 222172 202201 91
12 Shock and Vibration
62 Evaluation of the Seismic Collapse Capacity e collapsemargin ratio (CMR) an important index for measuring thestructural seismic collapse capacity [40] can be calculated by(6) where 1113954SCT is the spectral acceleration corresponding tothe median value of the estimated spectral accelerations atcollapse and SMT is the spectral acceleration at the funda-mental period of the structure shown in Figure 6
CMR 1113954SCTSMT (6)
Figure 18 shows the comparison of the collapse prob-ability curves for the contrast models e collapse
probability of the PRCFCP-USD and PRCFCP-USD-RW issignificantly smaller than that of the PRCFCP under thesame intensity earthquake Table 4 shows the CMR values ofthe contrast models e CMR value of the PRCFCP-USD isincreased by 313 compared to the PRCFCP which meansthat the seismic collapse capacity can be improved via theaddition of USDs e CMR of the PRCFCP-USD-RW isincreased by 1528 which is approximately five times thatof 313 which means that the participation of rocking wallsfurther improves the seismic collapse capacity of thePRCFCP-USD
Frame
2000 40000Energy (kNmiddotm)
0
1
2
3
4
5
6
7
8
Stor
y
(a)
FrameUSD
1000 2000 30000Energy (kNmiddotm)
0
1
2
3
4
5
6
7
8
Stor
y
(b)
FrameUSD
1000 2000 30000Energy (kNmiddotm)
0
1
2
3
4
5
6
7
8
Stor
y
(c)
Figure 15 Energy dissipation at different storeys under GM9
ActualAverage
0
1
2
3
4
5
6
7
8
Stor
y
04 08 1200Interstory dri ratio ()
(a)
ActualAverage
0
1
2
3
4
5
6
7
8
Stor
y
04 08 1200Interstory dri ratio ()
(b)
ActualAverage
0
1
2
3
4
5
6
7
8St
ory
01 02 03 0400Interstory dri ratio ()
(c)
Figure 16 Comparison of the residual interstorey drifts under major earthquakes (a) PRCFCP (b) PRCFCP -USD (c) PRCFCP -USD-RW
Shock and Vibration 13
7 Conclusions
e energy dissipation capacity of the USDs placed betweenthe cladding panels and the main structure and the con-trolling deformation capacity of rocking walls are combined
to improve the seismic performance of the traditionalPRCFCP e following conclusions are obtained throughthe comparative analyses of the structures withwithout theUSDs or the rocking walls
(1) e participation of the USDs can slightly enhancethe lateral load-carrying capacity of the structure andslightly reduce the velocity of the carrying reductionafter structural yield under a pushover comparedwith the PRCFCP However the combination ofrocking walls and USDs can significantly enhancethe lateral load-carrying capacity and ductility of thestructure
(2) In PRCFCP-USD the USDs can dissipate energy andeffectively reduce the deformation of the structureunder an earthquake indicating that the claddingpanel with USDs can achieve the target of shockabsorption
(3) eUSDs at each storey of the PRCFCP-USD exhibita large difference in energy dissipation In the po-sition where the interstorey drift is sufficient theUSDs dissipate energy in excess In places withsmaller drifts the USDsrsquo capacity cannot entirelyperform Rocking walls can compel the USDs at eachstorey to evenly dissipate energy
(4) Compared with the PRCFCP the DCF values of thePRCFCP-USD are larger under some ground mo-tions because the USDs at each storey unevenlydissipate energy In the PRCFCP-USD-RW the peakinterstorey drift and residual displacement are smalland uniform and the DCF average value is only 119According to conclusions (2)ndash(4) the use of USDscan reduce the structural displacement response butnot control the structural deformation profilehowever the two design goals can be simultaneouslyachieved through the combination of rocking wallsand USDs
(5) e seismic collapse capacity of the PRCFCP-USDand PRCFCP-USD-RW is larger than that of thePRCFCP e CMR value of the PRCFCP-USD-RWis approximately five times that of the PRCFCP-USD showing that the seismic collapse capacity canbe improved by the proposed cladding panels withUSDs and that the combination of rocking walls andUSDs further improves the seismic collapse capacity
Data Availability
e authors declare that all data supporting the findings ofthis study are available within the article
Conflicts of Interest
e authors declare no conflicts of interest
Acknowledgments
is research was financially supported by the NationalNatural Science Foundation of China (nos 51708166
0 5 10 150
50
100
PRCFCPPRCFCP-USDPRCFCP-USD-RW
cb
Col
lapse
pro
babi
lity
()
a
a = 2410b = 3442c = 6627
SCT (g)
Figure 18 Comparison of the collapse fragility curves among thecontrast models
Table 4 CMR of all models
Models 1113954SCT SMT (g) CMR Increase
PRCFCP 2410 g 0356 677 mdashPRCFCP-USD 3442 g 0387 889 313PRCFCP-USD-RW 6627 g 0387 1712 1528
16 of PRCFCP 16 of PRCFCP-USD50 of PRCFCP 50 of PRCFCP-USD84 of PRCFCP 84 of PRCFCP-USD16 of PRCFCP-USD-RW50 of PRCFCP-USD-RW84 of PRCFCP-USD-RW
1 2 30Maximum story drift ratio ()
0
3
6
9
12
15S a
(T1
5)
Figure 17 Comparison of the three modelsrsquo IDA curves
14 Shock and Vibration
51778201 and 51878233) the Fundamental Research Fundsfor Central Universities of China (no JZ2019HGTB0086)and the China Postdoctoral Science Foundation (no2018M630706) eir support is gratefully acknowledged
References
[1] H Maneetes ldquoDevelopment of a seismic dissipatingmechanism for precast concrete cladding panelsrdquo PhDDissertation Pennsylvania State University State CollegePA USA 2007
[2] E D Losch PW Hynes R Andrews Jr et al ldquoState of the artof precastprestressed concrete sandwich wall panelsrdquo PCIJournal vol 56 no 2 pp 131ndash176 2011
[3] PrecastPrestressed Concrete Institute PCI Design HandbookPrecastPrestressed Concrete Institute Chicago IL 60606USA 7th edition 2010
[4] JGJT458-2018 Technical standard for application of precastconcrete facade panel China Building Industry Press BeijingUSA 2018 in Chinese
[5] A Belleri E Brunesi R Nascimbene et al ldquoSeismic per-formance of precast industrial facilities following majorearthquakes in the Italian territoryrdquo Journal of Performance ofConstructed Facilities vol 29 no 5 Article ID 040141352014
[6] G Toniolo and A Colombo ldquoPrecast concrete structures thelessons learned from the LrsquoAquila earthquakerdquo StructuralConcrete vol 13 no 2 pp 73ndash83 2012
[7] D A Bournas P Negro and F F Taucer ldquoPerformance ofindustrial buildings during the Emilia earthquakes inNorthern Italy and recommendations for their strengthen-ingrdquo Bulletin of Earthquake Engineering vol 12 no 5pp 2383ndash2404 2014
[8] GCRNist 96-681 Literature Review on Seismic Performance ofBuilding Cladding Systems National Institute of Standardsand Technology United States Department of CommerceGaithersburg MD USA 1995
[9] R Tyler ldquoDamping in building structures by means of PTFEsliding jointsrdquo Bulletin of New Zealand National Society forEarthquake Engineering vol 10 no 3 pp 139ndash142 1977
[10] J M Cohen and G H Powell ldquoA design study of an energy-dissipating cladding systemrdquo Earthquake Engineering ampStructural Dynamics vol 22 no 7 pp 617ndash632 1993
[11] J-P Pinelli C Moor J I Craig and B J Goodno ldquoTesting ofenergy dissipating cladding connectionsrdquo Earthquake Engi-neering amp Structural Dynamics vol 25 no 2 pp 129ndash1471996
[12] L Ferrara R Felicetti G Toniolo and C Zenti ldquoFrictiondissipative devices for cladding panels in precast buildingsrdquoEuropean Journal of Environmental and Civil Engineeringvol 15 no 9 pp 1319ndash1338 2011
[13] A Baird A Palermo and S Pampanin ldquoControlling seismicresponse using passive energy dissipating cladding connec-tionsrdquo in Proceedings of the New Zealand Society for Earth-quake Engineering Conference Wellington New ZealandApril 2013
[14] P Negro and M Lamperti Tornaghi ldquoSeismic response ofprecast structures with vertical cladding panels the safe-cladding experimental campaignrdquo Engineering Structuresvol 132 pp 205ndash228 2017
[15] B Dal Lago F Biondini and G Toniolo ldquoExperimentalinvestigation on steel W-shaped folded plate dissipativeconnectors for horizontal precast concrete cladding panelsrdquo
Journal of Earthquake Engineering vol 22 no 5 pp 778ndash8002018
[16] B Dal Lago F Biondini and G Toniolo ldquoExperimental testson multiple-slit devices for precast concrete panelsrdquo Engi-neering Structures vol 167 pp 420ndash430 2018
[17] F Karadogan E Yuksel A Khajehdehi et al ldquoCyclic behaviorof reinforced concrete cladding panels connected with energydissipative steel cushionsrdquo Engineering Structures vol 189pp 423ndash439 2019
[18] B Alavi and H Krawinkler ldquoStrengthening of moment-resisting frame structures against near-fault ground motioneffectsrdquo Earthquake Engineering amp Structural Dynamicsvol 33 no 6 pp 707ndash722 2004
[19] Z Qu A Wada S Motoyui H Sakata and S Kishiki ldquoPin-supported walls for enhancing the seismic performance ofbuilding structuresrdquo Earthquake Engineering amp StructuralDynamics vol 41 no 14 pp 2075ndash2091 2012
[20] G Deierlein H Krawinkler XMa et al ldquoEarthquake resilientsteel braced frames with controlled rocking and energy dis-sipating fusesrdquo Steel Construction vol 4 no 3 pp 171ndash1752011
[21] A Wada Z Qu S Motoyui and H Sakata ldquoSeismic retrofitof existing SRC frames using rocking walls and steeldampersrdquo Frontiers of Architecture and Civil Engineering inChina vol 5 no 3 pp 259ndash266 2011
[22] K M Twigden and R S Henry ldquoExperimental response anddesign of O-connectors for rocking wall systemsrdquo Structuresvol 3 pp 261ndash271 2015
[23] Z Zhang R B Fleischman J I Restrepo et al ldquoShake-tabletest performance of an inertial force-limiting floor anchoragesystemrdquo Earthquake Engineering amp Structural Dynamicsvol 47 no 10 pp 1987ndash2011 2018
[24] Y Feng Z Zhang X Chong J Wu and S Meng ldquoElasticdisplacement spectrum-based design of damage-controllingBRBFs with rocking wallsrdquo Journal of Constructional SteelResearch vol 148 pp 691ndash706 2018
[25] N Rahgozar N Rahgozar and A S Moghadam ldquoControlled-rocking braced frame bearing on a shallow foundationrdquoStructures vol 16 pp 63ndash72 2018
[26] J M Kelly R I Skinner and A J Heine ldquoMechanisms ofenergy absorption in special devices for use in earthquakeresistant structuresrdquo Bulletin of NZ Society for EarthquakeEngineering vol 5 no 3 pp 63ndash88 1972
[27] S Bagheri M Barghian F Saieri and A Farzinfar ldquoU-shapedmetallic-yielding damper in building structures seismic be-havior and comparison with a friction damperrdquo Structuresvol 3 pp 163ndash171 2015
[28] S Mazzoni F McKenna et al OpenSees Command LanguageManual PEER University of California Berkeley CA USA2006
[29] GB 50017-2003 Code for Design of Steel Structures ChinaPlanning Press Beijing China 2003 in Chinese
[30] A I Dimopoulos T L Karavasilis G Vasdravellis and B UyldquoSeismic design modelling and assessment of self-centeringsteel frames using post-tensioned connections with webhourglass shape pinsrdquo Bulletin of Earthquake Engineeringvol 11 no 5 pp 1797ndash1816 2013
[31] Z Qu Study on Seismic Damage Mechanism Control andDesign of Rocking Wall-Frame structures Tsinghua Univer-sity Beijing China PhD Dissertation in Chinese 2010
[32] M Palermo and T Trombetti ldquoExperimentally-validatedmodelling of thin RC sandwich walls subjected to seismicloadsrdquo Engineering Structures vol 119 pp 95ndash109 2016
Shock and Vibration 15
[33] E Brunesi R Nascimbene and A Pavese ldquoMechanical modelfor seismic response assessment of lightly reinforced concretewallsrdquo Earthquakes and Structures vol 11 no 3 pp 461ndash4812016
[34] GB 50011-2010 Code for Seismic Design of Buildings ChinaArchitecture amp Building Press Beijing China 2010 inChinese
[35] G A MacRae Y Kimura and C Roeder ldquoEffect of columnstiffness on braced frame seismic behaviorrdquo Journal ofStructural Engineering vol 130 no 3 pp 381ndash391 2004
[36] D Vamvatsikos and C A Cornell ldquoIncremental dynamicanalysisrdquo Earthquake Engineering amp Structural Dynamicsvol 31 no 3 pp 491ndash514 2002
[37] ASCE Minimum Design Loads for Buildings and OtherStructures (ASCESEI 7-10) American Society of Civil En-gineers Reston VA USA 2010
[38] S Zaruma and L A Fahnestock ldquoAssessment of designparameters influencing seismic collapse performance ofbuckling-restrained braced framesrdquo Soil Dynamics andEarthquake Engineering vol 113 pp 35ndash46 2018
[39] D Vamvatsikos and C A Cornell ldquoTracing and post-pro-cessing of IDA curves theory and software implementationrdquop44 Report No RMS Stanford University and StanfordUSA 2001
[40] Federal Emergency Management Agency (FEMA) Quanti-fication of building seismic performance factors FEMAWashington DC USA 2009
16 Shock and Vibration
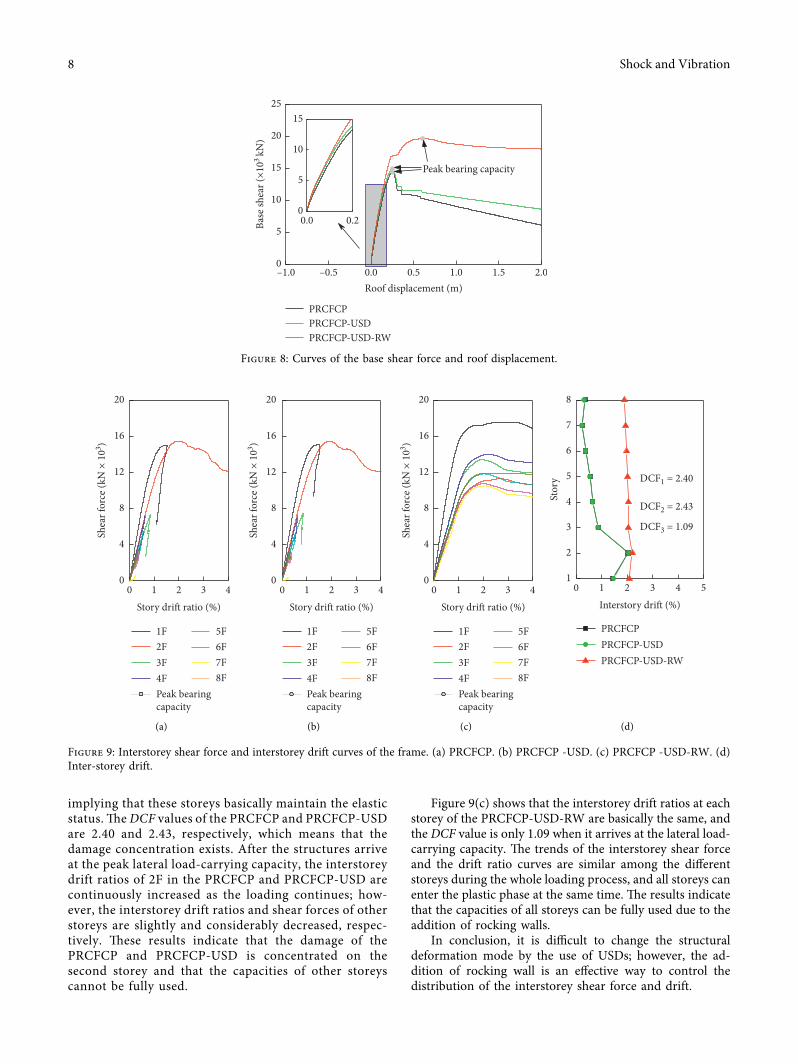