
ENHANCING RESILIENCE OF CRITICAL ROAD STRUCTURES: …
86
ENHANCING RESILIENCE OF CRITICAL ROAD STRUCTURES: BRIDGES, CULVERTS AND FLOODWAYS UNDER NATURAL HAZARDS Final project report Sujeeva Setunge 1 , Priyan Mendis 2 , Karu Karunasena 3 , Kevin Zhang 1 , Dilanthi Amaratunga 4 , Weena Lokuge 3 , Nilupa Herath 2 , Long Shi 1 , Hessam Mohseni 1 , Huu Tran 1 & Kanishka Atapattu 1 1 RMIT University, 2 University of Melbourne, 3 University of Southern Queensland, 4 University of Huddersfield
Transcript of ENHANCING RESILIENCE OF CRITICAL ROAD STRUCTURES: …

ENHANCING RESILIENCE OF CRITICAL ROAD STRUCTURES: BRIDGES, CULVERTS AND FLOODWAYS UNDER NATURAL HAZARDS Final project report
Sujeeva Setunge1, Priyan Mendis2, Karu Karunasena3, Kevin Zhang1, Dilanthi Amaratunga4, Weena Lokuge3, Nilupa Herath2, Long Shi1, Hessam Mohseni1, Huu Tran1 & Kanishka Atapattu1
1RMIT University, 2University of Melbourne, 3University of Southern Queensland, 4University of Huddersfield

ENHANCING RESILIENCE OF CRITICAL ROAD STRCUTURES – FINAL PROJECT REPORT | REPORT NO. 671.2021
1
Version Release history Date
1.0 Initial release of document 24/05/2021
© Bushfire and Natural Hazards CRC 2021
All material in this document, except as identified below, is licensed under the Creative Commons Attribution-Non-Commercial 4.0 International Licence.
Material not licensed under the Creative Commons licence:
• Department of Industry, Science, Energy and Resources logo • Cooperative Research Centres Program logo • Bushfire and Natural Hazards CRC logo • All other logos • All photographs, graphics and figures
All content not licenced under the Creative Commons licence is all rights reserved. Permission must be sought from the copyright owner to use this material.
Disclaimer: RMIT University, the University of Melbourne, the University of Southern Queensland, the University of Huddersfield and the Bushfire and Natural Hazards CRC advise that the information contained in this publication comprises general statements based on scientific research. The reader is advised and needs to be aware that such information may be incomplete or unable to be used in any specific situation. No reliance or actions must therefore be made on that information without seeking prior expert professional, scientific and technical advice. To the extent permitted by law, RMIT University, the University of Melbourne, the University of Southern Queensland, the University of Huddersfield and the Bushfire and Natural Hazards CRC (including its employees and consultants) exclude all liability to any person for any consequences, including but not limited to all losses, damages, costs, expenses and any other compensation, arising directly or indirectly from using this publication (in part or in whole) and any information or material contained in it.
Publisher: Bushfire and Natural Hazards CRC
May 2021
Citation: (2021) Enhancing resilience of critical road structures: bridges culverst and floodways under natural hazards – final project report, Bushfire and Natural Hazards CRC, Melbourne.
Cover: Bridge fire Gippsland, VIC.

ENHANCING RESILIENCE OF CRITICAL ROAD STRCUTURES – FINAL PROJECT REPORT | REPORT NO. 671.2021
3
TABLE OF CONTENTS
ACKNOWLEDGMENTS 5
EXECUTIVE SUMMARY 6
END-USER PROJECT IMPACT STATEMENT 8
PRODUCT USER TESTIMONIALS 9
INTRODUCTION 10
BACKGROUND 12
Introduction 12
The Project 13
RESEARCH APPROACH 15
Year 1 15
Year 2 15
Year 3 16
KEY MILESTONES 17
YEAR 1 17
YEAR 2 17
YEAR 3 17
VULNERABILITY MODELLING OF BRIDGES UNDER NATURAL HAZARDS 18
Bridges under flood loading 18
Bridges exposed to bush fires 25
Bridges under earthquake loading 32
VULNERABILITY MODELLING OF FLOODWAYS UNDER FLOOD LOADING 37
Categorisation of floodways 37
Vulnerability of floodways in this region 38
Inspection of floodways 39
Analysis of floodways under different loading scenarios 42
A Survey of Industry Experts and Asset Owners 44
Development of a floodway design guide 47
PRIORITISATION OF BRIDGE STRUCTURES 49
Economic impact due to bridge failure 49
bridge prioritisation for seismic impact 55
SOCIAL AND ENVIRONMENTAL IMPACT DUE TO A BRIDGE FAILURE 59
Methodology 59
Data requirements 61

ENHANCING RESILIENCE OF CRITICAL ROAD STRCUTURES – FINAL PROJECT REPORT | REPORT NO. 671.2021
4
Toolkit validation - Case study 63
Validation interviews 63
Results and recommendations 64
DEVELOPMENT OF A BRIDGE RATING METHOD – SEISMIC EXAMPLE 65
Bridge damage probability equation 65
PROTOTYPE SOFTWARE TOOL FOR VULNERABILITY MODELLING OF BRIDGES 70
Central Asset Management System CAMS for Bridges 70
Vulnerability of bridges under natural hazards 70
UTILISATION AND IMPACT 73
Summary 73
Structural design of floodways under extreme flood loading1 73
Vulnerability maps of brideges under Flood, bush fire and earthquakes 73
Vulnerability assessment of brideges under extreme cyclonic events2 74
Resilience assessment of timber bridges3,4 74
Structural analysis in floodway design process5 75
CONCLUSION 76
Next Steps 76
PUBLICATIONS LIST 77
Peer-Reviewed Journal Articles 77
Conference Papers 78
Keynote presentations 79
Technical Reports 79
Book chapters 80
TEAM MEMBERS 81
Research Team 81
End-Users 81
REFERENCES 83

ENHANCING RESILIENCE OF CRITICAL ROAD STRCUTURES – FINAL PROJECT REPORT | REPORT NO. 671.2021
5
ACKNOWLEDGMENTS Industry partners from the end user organisations: Queensland reconstruction authority, Institution of Public Works Engineers Australia (IPWEA) Qld, Lockyer Valley regional council, VicRoads (DoT), QTMR, City of Brimbank, Geoscience Australia are gratefully acknowledged.
Further, eight research students completed their research within the project. Six of these Ph.D students and two are masters by research students. Six of the scholars generated a significant knowledge base on modelling of road structures under flood, bush fire and earthquakes and two scholars developed models for measuring community impact of failure of road structures. These scholars are gratefully acknowledged.
Research Scholars:
Yue Zhang (M.Eng)
Amila Dissanayake (Ph.D)
Maryam Nasim (Ph.D)
Farook Kalendhar (Ph.D)
Akvan Gajanayake (Ph.D)
Zeinab Yazfandar (Ph.D)
Ismail Qeshta (Ph.D)
Isaac Greene (M.Eng)
ENHANCING RESILIENCE OF CRITICAL ROAD STRCUTURES – FINAL PROJECT REPORT | REPORT NO. 671.2021
6
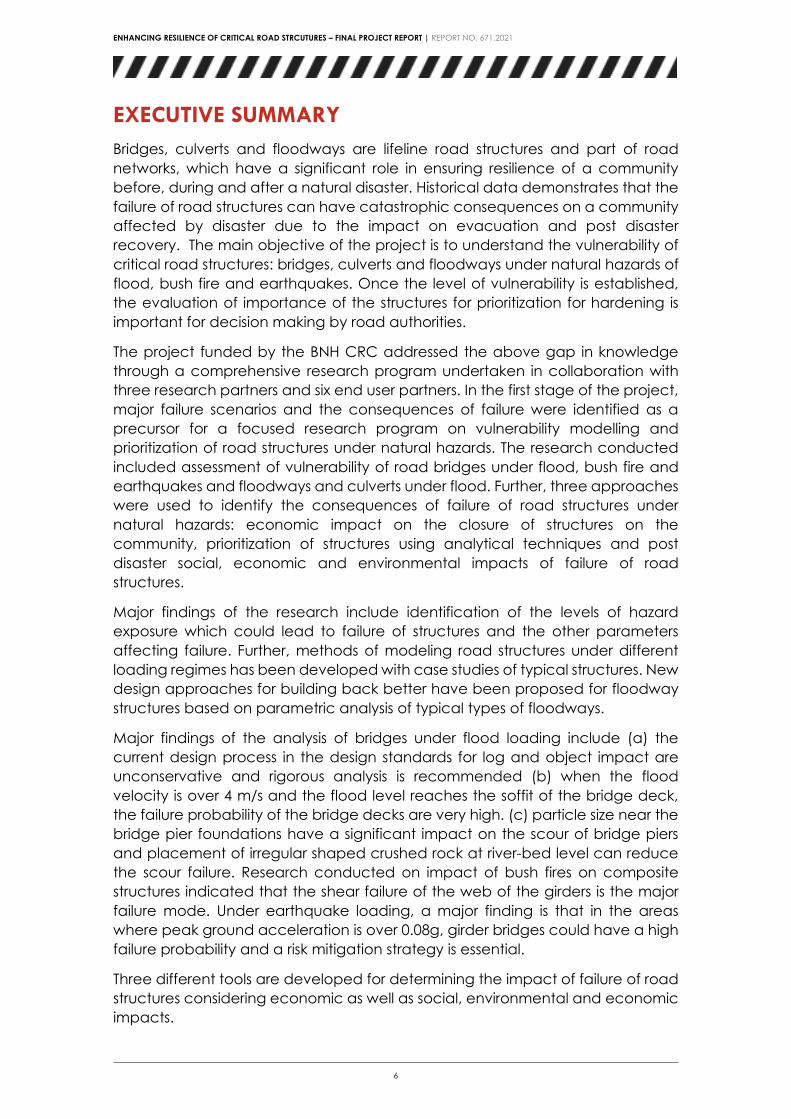
EXECUTIVE SUMMARY Bridges, culverts and floodways are lifeline road structures and part of road networks, which have a significant role in ensuring resilience of a community before, during and after a natural disaster. Historical data demonstrates that the failure of road structures can have catastrophic consequences on a community affected by disaster due to the impact on evacuation and post disaster recovery. The main objective of the project is to understand the vulnerability of critical road structures: bridges, culverts and floodways under natural hazards of flood, bush fire and earthquakes. Once the level of vulnerability is established, the evaluation of importance of the structures for prioritization for hardening is important for decision making by road authorities.
The project funded by the BNH CRC addressed the above gap in knowledge through a comprehensive research program undertaken in collaboration with three research partners and six end user partners. In the first stage of the project, major failure scenarios and the consequences of failure were identified as a precursor for a focused research program on vulnerability modelling and prioritization of road structures under natural hazards. The research conducted included assessment of vulnerability of road bridges under flood, bush fire and earthquakes and floodways and culverts under flood. Further, three approaches were used to identify the consequences of failure of road structures under natural hazards: economic impact on the closure of structures on the community, prioritization of structures using analytical techniques and post disaster social, economic and environmental impacts of failure of road structures.
Major findings of the research include identification of the levels of hazard exposure which could lead to failure of structures and the other parameters affecting failure. Further, methods of modeling road structures under different loading regimes has been developed with case studies of typical structures. New design approaches for building back better have been proposed for floodway structures based on parametric analysis of typical types of floodways.
Major findings of the analysis of bridges under flood loading include (a) the current design process in the design standards for log and object impact are unconservative and rigorous analysis is recommended (b) when the flood velocity is over 4 m/s and the flood level reaches the soffit of the bridge deck, the failure probability of the bridge decks are very high. (c) particle size near the bridge pier foundations have a significant impact on the scour of bridge piers and placement of irregular shaped crushed rock at river-bed level can reduce the scour failure. Research conducted on impact of bush fires on composite structures indicated that the shear failure of the web of the girders is the major failure mode. Under earthquake loading, a major finding is that in the areas where peak ground acceleration is over 0.08g, girder bridges could have a high failure probability and a risk mitigation strategy is essential.
Three different tools are developed for determining the impact of failure of road structures considering economic as well as social, environmental and economic impacts.

ENHANCING RESILIENCE OF CRITICAL ROAD STRCUTURES – FINAL PROJECT REPORT | REPORT NO. 671.2021
7
A major utilisation outcome of the project is a resilient floodway design guide, published in collaboration with the Institution of Public Works Engineers Australia (Qld) (IPWEAQ). A utilisation project is currently in progress jointly funded by the IPWEAQ and BNH CRC. The guide has been reviewed by the IPWEAQ and is currently being revised by the researchers to enable uptake by local council Engineers. An asset management and vulnerability modeling tool for bridges has been developed for the DoT Victoria (formerly known as VicRoads) where the bridges prone to significant damage are highlighted in a GIS map of the road network.
There are two different models developed to evaluate the consequences of the failure of road structures: first considering economic impact of detour required and a second model capturing post disaster social environmental and economic impact of failure of road structures. The first tool has been incorporated into the vulnerability modeling GIS platform developed for the DoT, Victoria.
In addition to the above deliverables in the BNH CRC project, two subsidiary projects were undertaken to understand the effect of cyclonic events on bridge structures and also resilience of timber bridges under natural disasters.
The research team is working with the end users to socialize the vulnerability modeling and decision-making tools developed to enable optimized decision making to enhance resilience of road structures under natural hazards. This is currently being continued with direct funding from the DoT, Victoria.

ENHANCING RESILIENCE OF CRITICAL ROAD STRCUTURES – FINAL PROJECT REPORT | REPORT NO. 671.2021
8
END-USER PROJECT IMPACT STATEMENT Author Name, Dr. YewChin Koay, Major Road Projects Victoria (DoT, Victoria)
I have actively participated in the project as an end user partner. This included attending the monthly meetings of the project team, participating in the end user workshops to provide feedback on the project, arranging and mentoring placements of four Ph.D candidates at the DoT Victoria and provision of data for analysis. I have also been a co-supervisor of the Ph.D candidates.
The support provided included providing structural drawings of the bridges, identifying the vulnerable structures for modelling, sharing the full bridge structure list for prioritisation and data for calculating bridge quantities for assessment of repair costs.
The outcomes of the project which includes a bridge deterioration and vulnerability model captured in a GIS platform, understanding of vulnerability of the bridge structures under natural hazards, bridge prioritization model and community impact tools developed through the project.
The outcomes of the seven Ph.D projects will be used as an industry guide for vulnerability assessment of bridges under flood, bushfire and earthquakes, prioritization of structures for strengthening and evaluation of the post disaster impact of closure of structures after a hazard event.
Author Name, Professor Wije Ariyaratne (formerly Principal Bridge Engineer, Road and Maritime Services (RMS) NSW)
Leading the Bridge & Structural Engineering of Roads & Maritime Services of NSW (RMS) for more than 19 years I have a good understanding of the problems associated with the design, construction, and sustainability of bridges. This project draws very useful conclusions and outcomes related to vulnerability of the bridge structures under natural hazards. I am of the opinion; this project will provide valuable information to end-users and other stake holders in planning for managing their bridge asset for natural disasters.

ENHANCING RESILIENCE OF CRITICAL ROAD STRCUTURES – FINAL PROJECT REPORT | REPORT NO. 671.2021
9
PRODUCT USER TESTIMONIALS Author Name, Leigh Cunningham, CEO, IPWEAQ
The Institute of Public Works Engineering Australasia Queensland (IPWEAQ) has participated in the project workshops held at the University of Southern Queensland and provided input towards the floodway asset management, inspection and design guidelines developed.
We are pleased to incorporate the outcomes of the project in a national guide for design of floodways for structural resilience. IPWEAQ has reviewed the Guide and provided feedback and proposed changes to the research team.

ENHANCING RESILIENCE OF CRITICAL ROAD STRCUTURES – FINAL PROJECT REPORT | REPORT NO. 671.2021
10
INTRODUCTION One of the seven goals of Sendai Framework for disaster risk reduction (2015-2030) is minimizing the damage to vulnerable critical infrastructure by enhancing their resilience. A major gap in research is the lack of assessment techniques and decision support tools that reduce the vulnerability of road structures and enhance both community resilience and structural resilience of road structures.
The project was completed in two stages: during stage 1 of the project, disaster risk was understood in terms of the vulnerability of road structures, and the impacts of road failure on local communities. Stage 2 aimed to enhance disaster preparedness, inform more effective responses, and ensuring that damaged structures are built back better during the recovery.
The project focused on critical road structures: bridges, culverts and floodways under exposure to flood bush fire and earthquakes. The broad focus of the project required understanding typical failure modes of the road structures under the above three hazards. Subsequently, the vulnerability of the three types of structures under the three types of hazards were explored through focused research efforts on vulnerability modelling of:
• Bridges, culverts and floodways under flood impact loadings and actions • Bridges under bush fire • Bridges under earthquakes • Floodways and culverts under flood loading
Subsequently, the findings of the vulnerability modelling of the critical road structures were used to deliver outcomes for end users including:
• Design approaches required for resilient structures leading to a floodway design guide
• Inspection methods and asset management of floodways to enhance resilience
• Asset management of bridges and culverts and prioritization of structures considering the impact on the community leading to a bridge asset management and vulnerability modeling software platform
• Post disaster analysis of social environmental and economic impact of failure of road structures leading to a tool for evaluating social economic and environmental impact (SEE tool)
This report presents a summary of research undertaken within the project. Six Ph.D candidates contributed to research activities of the project and research fellows supported the translation activities and the end user engagement.
Three major utilization outcomes were delivered from the research conducted.
• A floodway design guide, which will be published in partnership with the Institution of Public Works Engineers Australia (Queensland) (IPWEAQ) as a national guide for design of resilient floodways
• A software platform for mapping vulnerable bridges and culverts under natural hazards and prioritization for strengthening considering impact on the community

ENHANCING RESILIENCE OF CRITICAL ROAD STRCUTURES – FINAL PROJECT REPORT | REPORT NO. 671.2021
11
• A tool for quantifying post disaster social, environmental and economic impacts of failure of road structures
In addition to the above, the vulnerability modeling methodologies developed through the project will provide guidance to road authorities and local councils on modeling of specific structures under natural hazards.
The outcomes of this project contributes to priority 4b of Sendai Framework on “’Build Back Better’ in recovery, rehabilitation, and reconstruction” [1].

ENHANCING RESILIENCE OF CRITICAL ROAD STRCUTURES – FINAL PROJECT REPORT | REPORT NO. 671.2021
12
BACKGROUND INTRODUCTION
Australia’s variable climate has always been a factor in natural disasters that have had a significant impact on evolving road infrastructure and on the communities that rely on the roads. The following Table (Table 1) shows the average annual cost of natural disasters by state and territory between 1967 and 2005.
Table 1: Average annual cost of natural disasters by state and territory, 1967-2005 (BITRE, 2008:44)
From these data, during the period of severe storms and cyclones inflicted the most economic damage, followed by flooding. The data are strongly influenced by three extreme events - Cyclone Tracy in NT (1974), the Newcastle earthquake in NSW (1989) and the Sydney hailstorm also in NSW (1999), as well as three flood events in Queensland (South East Qld, 2001: Western Qld, 2004; and the Sunshine Coast, 2005). Annual cost of natural hazards given in Table 1 excludes the cost of death and injury which might have significant impact. Although a number of different methods are used to calculate costs associated with bushfire deaths Deloitte Access Economics [2] recommended using a Value of Statistical Life (VSL) of $3.5m. For injury, Bureau of Transport Economics recommended for serious injury - $850,000 and for minor injury - $28,500. Although these data are related to bushfire, there could be a strong link of them to the costs associated with death and injury due to any disaster.
Climate change has increased the risk from extreme events and the update of this table that includes data for the years 2007 to 2013 - during which there were extreme climate events in Qld, VIC, SA, and NSW. As per a recent report by Australian Business Roundtable for Disaster Resilience & Safer Communities [3], for the time period 2007-2016 the average cost of natural disasters is $18.2 billion per year and the forecast for 2050 is $39 billion.

ENHANCING RESILIENCE OF CRITICAL ROAD STRCUTURES – FINAL PROJECT REPORT | REPORT NO. 671.2021
13
The recent flood events in Queensland, Australia had an adverse effect on the country’s social and economic growth. Queensland state-controlled road network includes 33,337 km of roads and 6,500 bridges and culverts [4]. 2011-2012 flood in Queensland produced record flood levels in southwest Queensland and above average rainfall over the rest of the state [5]. The frequency of flood events in Queensland, during the past decade, appears to have increased. In 2009 March flood in North West Queensland covered 62% of the state with water costing $234 million damage to infrastructure [6], [7]. Theodore in Queensland was flooded three times within 12 months in 2010 and it was the first town, which had to be completely evacuated in Queensland. 2010-2011 floods in Queensland had a huge impact particularly on central and southern Queensland resulting in the state-owned properties such as 9,170 road network, 4,748 rail network, 89 severely damaged bridges, and culverts, 411 schools and 138 national parks [8]. Approximately 18,000 residential and commercial properties were significantly affected in Brisbane and Ipswich [7] during this time. More than $42 million support was provided to individual, families, and households while more than $121 million in grants have been provided to small businesses, primary producers and not-for-profit organizations. Furthermore, more than $12 million in concessional loans to small businesses and primary producers have been provided [9] . The Australian and Queensland governments have committed $6.8 billion to rebuild the state.
Pritchard [5] identifies that urban debris, such as cars, and the insufficient bridge span for debris to pass through are the main causes for damaging bridges in the aftermath of the 2011/2012 flood in Queensland. Two of the four tasks identified in Priority 4b (Build Back Better in recovery, rehabilitation, and reconstruction) of Sendai Framework 2015-2030 are pre-disaster recovery planning and assessment of post-disaster damages. Using 2013 flood event in Lockyer Valley, Lokuge and Setunge [9] concluded that it is necessary to investigate the failure patterns and the construction practices adopted during the initial construction and rehabilitation stages in the lifetime of bridges. These findings raised a question that what are the failure mechanisms and contributing factors which requires consideration in designing of bridges to be resilient to extreme flood events.
THE PROJECT
Outcomes of the first stage of the project identified the gaps in research and the potential focus areas. Based on these, following focus areas were identified for the second stage of the project:
1. Vulnerability modelling of bridges a. Flood and object impact loading on bridge decks b. Flood and object impact loading on bridge piers c. Wave loads on bridge structures and strengthening requirements d. Bridges under bush fires e. Bridges under earthquake loading
2. Vulnerability and resilient design of floodways a. Structural resilience of floodways b. Inspection and asset management of floodways c. Resilient design guidelines

ENHANCING RESILIENCE OF CRITICAL ROAD STRCUTURES – FINAL PROJECT REPORT | REPORT NO. 671.2021
14
3. Prioritization of road structures considering community impact a. Prioritization of bridges for hardening to enhance resilience b. Social environmental and economic impact of failure of road
structures 4. Utilization outcomes
a. Floodway design guide b. Software platform for bridge asset management and vulnerability
under disasters c. A tool for evaluating social, environmental and economic impacts
of failure of road structures
The report presents the summary of research approach for each of the above segments and also presents the utilization outcomes currently in progress.

ENHANCING RESILIENCE OF CRITICAL ROAD STRCUTURES – FINAL PROJECT REPORT | REPORT NO. 671.2021
15
RESEARCH APPROACH The project was completed in three phases as described below.
YEAR 1
Generic analysis methodology for vulnerability modelling: A detailed numerical modelling methodology was developed for bridges under flood, bush fire and earthquake loading and floodways under flood loading. This has some similarities with the method used by HAZUS in the USA but has incorporated a more rigorous analysis and cover the complexities of bridge structures including the structural forms adopted in Australia.
Hazard mapping for Victoria and Queensland: A flood/bushfire map for Victoria was developed with the assistance of the Department of Environment, Land Water and Planning (DELWP). Bridge structures pre 1992 have been designed for 1:100 year return period flood loading and the current code requires design according to 1:2000 year return period flood loading. Two scenarios were covered and the structures falling into the two categories were identified. Queensland Reconstruction Authority (QRA) hazard maps were used to identify vulnerable structure in Queensland.
A time-temperature curve for bush fire impact was developed for different regions of Victoria. Fire spread prediction project of the BNH CRC was engaged to provide time-temperature curves for the states.
Earthquake hazard map for Victoria was developed using Geoscience Australia information as well as the outcomes of the earthquake resistant buildings project of the CRC.
Categorization of road structures: The generic modelling of bridges requires categorization of road structures considering structural form, construction material and the design period. The design standard used at the design stage will impact on the structural capacity as well. This analysis was undertaken by the researchers under the guidance of VicRoads structures team.
Floodway design process: Analysis of the failure of the floodways has established the gaps in design which lead to failure under flood loading. Also, a comparison of damage indices has demonstrated the most expensive elements of floodways which contribute to the reconstruction cost. In this state, the outcomes of the previous stage were used to develop the basic design process for a resilient floodway.
YEAR 2
Generic analysis to identify vulnerable structures: Applying the method developed in year 1 and integrating the hazard maps, vulnerable structures were identified for the two stages: Victoria and Queensland. These were identified in a GIS map.
Community impact model and the prioritized structures: Considering the level of importance of structures and vulnerability identified, a methodology was developed for recognizing the structures which affect evacuation, disaster

ENHANCING RESILIENCE OF CRITICAL ROAD STRCUTURES – FINAL PROJECT REPORT | REPORT NO. 671.2021
16
responses, and post-disaster services. This methodology was used to derive a shortlist of bridges structures and floodways which requires hardening and/or long-term reconstruction
Floodways inspection and management. Inspection manual for floodways was developed which align with the existing bridge inspection manual. This can be used for routine maintenance as well as during the recovery stage after an extreme flood event.
YEAR 3
Cost estimation linking with damage categories: Working with the end user: Road authority of Victoria, quantities of bridge structures were captured to establish the typical costs of repair. Two quantity surveyors were engaged for this work and 200 structures were analysed. The outcome is used as input for an AI algorithm to determine the typical quantities for all 3300 structures.
Community Impact quantification: A Ph.D project of Akvan Gajanayake (completed in 2019) delivered a community impact model to capture impact of failure of road structures on the community.
The environmental impact was quantified using the life cycle analysis considering carbon emissions, eutrophication potential, and nonrenewable energy use.
Prioritization and decision making. Prioritization decision making required integration of three impacts: economic, social and environmental.
Validation and implementation: Validation of the developed tools will be undertaken by using a recent disaster event where road structures were affected. The data for 2011 and 2013 Lockyer Valley floods are available for this purpose.
Floodway design guide: Having received the feedback for the floodway design process from the end users, the floodway design guide was developed. A utilization project will translate the work as a national guide under the aegis of Institution of Public Works Engineers Australia in Queensland (IPWEA Q)

ENHANCING RESILIENCE OF CRITICAL ROAD STRCUTURES – FINAL PROJECT REPORT | REPORT NO. 671.2021
17
KEY MILESTONES Key milestones of the project are summarized below.
YEAR 1
• Numerical modelling of bridges for vulnerability under flood, bush fire and earthquakes
• Hazard quantification, where data is available • Resilient floodway design process captured in a publication • Floodway inspection framework developed • Analysis of bridge structures and categorisation of the scenarios
o Bridge decks under flood loading and object impact o Bridge piers under flood and object impact o Bridge piers under scour o Bridges under flood wave loading o Bridges under bush fire o Bridges under earthquakes
YEAR 2
• Generic analysis of bridge structures • Community impact model for decision making • Floodway inspection methodology • Bridge strengthening options analysis
YEAR 3
• Quantities and cost of bridge repair • Multicriteria decision making on post disaster recovery • Prioritization of structures for betterment • Vulnerability mapping software platform developed • Flloodway design guide submitted for IPWEAQ review • Final project report

ENHANCING RESILIENCE OF CRITICAL ROAD STRCUTURES – FINAL PROJECT REPORT | REPORT NO. 671.2021
18
VULNERABILITY MODELLING OF BRIDGES UNDER NATURAL HAZARDS BRIDGES UNDER FLOOD LOADING
In recent years, frequencies of flood events in Australia have increased. It is noted that flood events cause the most damage to infrastructure compared to any other natural hazards in the world. Road bridges are lifeline structures with a pre and post disaster critical functionality. Failure or damage of bridges during an extreme flood event can have severe consequences to the community as well as road authorities and emergency services. Currently a major gap in knowledge is the ability to evaluate the vulnerability of bridge structures using a methodology which captures the variability of the event intensities and the variability of the structural capacity. The research presented here addresses this knowledge gap.
Girder bridge decks under flood loading
Research commenced with a comprehensive literature review covering review of major bridge design codes in the world, literature on flood loading, vulnerability modelling of bridges and numerical modelling approaches to simulate bridges under natural hazards. Damage indices proposed by researchers to depict the levels of damage to structures are also noted.
A comprehensive analysis of case studies of failure of bridges under flood loading under the 2011 and 2013 floods in Queensland and Victoria was undertaken to establish the major failure mode of bridges under flood loading. This identified that failure of girder and deck of concrete girder bridges, which constitute more than 60% of the bridge network, is a common case study to investigate. Two bridges were selected for analysis and the outcome was used to establish the vulnerability modelling methodology.
A deterministic analysis of the selected structures was undertaken under variable flood loading to establish the analysis methodology using ABAQUS software. The loading configuration considered covered flood, log impact and debris impact. This analysis demonstrated that Kapernicks Bridge would fail at a flood velocity of 3.71m/s which closely agrees with the recorded flood velocity as well.
Understanding the limitations of the deterministic analysis where the variability of flood loading and the variability of structural capacity cannot be accounted for, a probabilistic fragility analysis was undertaken to establish the probability of failure of the bridges. Probability distribution was established for flood velocity as well as the structural section capacity. Fragility curves were derived for concrete girder bridges using the developed methodology.
The methodology developed is applicable for any bridge structure when the flood loading distribution for the location of the bridge can be established.
Contribution to the existing knowledge from this research has been the methodology developed to quantify vulnerability of road infrastructure exposed to flood hazard that would assist in evaluating damage state for bridge

ENHANCING RESILIENCE OF CRITICAL ROAD STRCUTURES – FINAL PROJECT REPORT | REPORT NO. 671.2021
19
structures. Emergency Management could use this damage state to assess evacuation routes while Road Authority could make decision on strengthening the bridge structure.
A sensitivity analysis was undertaken to explore the effect of span of the bridge and also increase in flood frequency on the probability of failure.
A method to derive damage indices which can be used by bridge engineers for decision making has been demonstrated.
Bridge piers under log and object impact
Australia has suffered from the loss of life and extreme damage to infrastructure from natural hazards such as bushfire, flood etc. Floods are Australia’s costliest disasters on bridges, one of the most important components of highway and railway transportation network. Therefore, safety and serviceability of bridges have always been a great concern to the practice and profession of civil engineering. The resilience of critical infrastructures such as roads and bridges is vital in evacuation support activities for during, before and after disaster response and recovery. In addition, bridges have a significant impact on the resilience of road infrastructure and the damage to bridges could significantly increase the vulnerability of the community served by the transportation infrastructure. Therefore, understanding the factors which affect the resilience of bridge structures, is extremely important to ensure the design specifications, as well as maintenance regimes for bridge structures. Furthermore, considering the resilience and vulnerability of structures is vital during, before and after disasters. Roads Corporation of Victoria (VicRoads) has identified that older structures consisting of U-slab decks are vulnerable to flood loading. One focus of this project was to focus on understanding damages to U-slab bridges exposed to flood loading.
The vulnerable element of the case study U-slab bridges has been identified using a simplified analysis (2 dimensional line analysis) using Space-Gass. This analysis indicated that the superstructure of a U slab structure is quite robust under flood loading and slender piers can be vulnerable. Water flow pressure on the piers has been studied using Computational Fluid Dynamics (CFD) methodology to examine the pressure distribution on piers with two different cross-sectional shapes. This work has demonstrated that the pressure distribution on a bridge pier under flood loading can be simulated using a uniformly distributed load. Further, it is noted that the magnitude of the flood-induced force is significantly affected by the geometry of the pier cross-section.
Considering the concrete plasticity damage (CPD) modelling, nonlinear analysis has been conducted to evaluate the damage behaviour of the piers, and a simple damage index based on energy absorbed, which can be derived from a standard finite element modelling output, has been introduced. Based on that different damage levels of a bridge pier under flood loading damage indices have been derived.
Based on the review of practice and the literature review the log or moving object impact is likely to be occurring during flood loading. Therefore, a

ENHANCING RESILIENCE OF CRITICAL ROAD STRCUTURES – FINAL PROJECT REPORT | REPORT NO. 671.2021
20
comprehensive investigation has been conducted to understand the structural response of a moving object impact, i.e., log impact. Using a validated model, the general relationship between different aspects of the structural response has been studied. Moreover, the bridge damage response during log impact has been studied, and the numerical results have been compared to provisions of different design standards. This study has concluded that the current provisions of design standards on the log or any moving object impact on bridges under flood loading could be unconservative and will require a systematic study considering the varying mass of impacts and the geometry of bridge piers.
Scour of bridge piers
Modelling Methodology
A novel upscaling methodology was proposed to facilitate prediction of scour around bridge piers. The methodology employed a coupled CFD-DEM model to study the microscale mechanism of scour under live-bed conditions over a range of flow rates.
The coupled CFD-DEM algorithm is a sophisticated numerical model which is capable of resolving the multi-body interactions in scour process. However, the CFD-DEM algorithm is a very computationally expensive numerical solution which cannot be feasibly used to resolve the full-scale bridge pier scour. The computational overhead associated with the full-scale bridge pier scour simulation comes from the huge difference between the length scale of the characteristic pier diameter (~1m) and that of the sediment particle diameter (~100 micron) which entails modelling tens of thousands to more than millions. In addition, solving the whole scour process until reaching the equilibrium state, which takes few hours in real-time behavior, is almost impossible as it requires solving tens of thousands of time-steps for thousands of particles. As a solution, a small-scale coupled CFD-DEM model is presented in this study with the aid of periodic boundaries, assigned to the inlet-outlet boundaries, to reproduce an infinite bed of sediment particles. The devised approach has reduced the dimensions of the simulation domain and the number of particles, assisting to curtail the computational expenses. Periodic boundaries also enable replicating live-bed regime by including suspended particles, carried by the flowing water, in numerical simulation. The model is validated against a few experimental data for scour initiation as well as for scour extent.
The results of the simulations from the validated model for a given sediment type facilitates population of probabilistic model for particle scour based upon local flow conditions and the impact of suspended particles. This scour model can be employed in macroscopic CFD models for scour that only require tracking of suspended particles rather than DEM of the sediment bed, the source of the major of the computational overhead for coupled CFD-DEM models. Thus, the proposed upscaling methodology represents a viable technique to predict macroscopic scour using only modest computational resources. The microscale model involves simulation of a bed of sediment particles under live-bed conditions with periodic lateral boundary conditions over a range of applied flow rates. This model explores the microscale mechanisms of scour within the

ENHANCING RESILIENCE OF CRITICAL ROAD STRCUTURES – FINAL PROJECT REPORT | REPORT NO. 671.2021
21
sediment bed under live-bed conditions, facilitating the development of a probabilistic phenomenological model for scour that is based on these observations. Microscale simulations are then used to populate this model and describe how this model can be used to model rate and extent of scour rate as a function of local flow conditions and particle impacts in macroscopic CFD simulations.
Parametric studies and applications
The validated small-scale model is used to perform a parametric study to shed light on the governing mechanisms in a general scour process and to identify and quantify controlling variables for scour assessment. It has been found that the particle size has an inverse relationship with the scour depth such that with increasing the particle size the scour depth reduces (Figure 1). Also, the shape of sediment particles affects the scour depth such that the more spherical is the particles, the higher is the scour depth. This is due to the higher interlocking effect in a non-spherical assemblage. In addition, studying the effect of particle size distribution (PSD) shown that for a non-uniform assemblage, the scour depth is less than that for the equivalent spherical assemblage. This is due to the presence of finer particles, which causes higher interlocking between particles, and, also, the armoring effect in non-uniform assemblages.
(a) For different particle sizes and flow depth of 0.04m
(b) For different Hf⁄D (Fluid domain depth/particle size)
Figure 1: Plots of normalized scour depth as a function of Froude number . (Dash-lines correspond to the polynomial trendline associated with each data series.)
0
1
2
3
4
5
6
0 0.5 1 1.5 2 2.5 3 3.5 4
Ds/D
Froude number
D=0.24 mm
D=0.5 mm
D=1 mm
01234567
0 0.5 1 1.5 2 2.5 3 3.5 4
Ds/D
Froude number
Hf/D=208
Hf/D=167
Hf/D=125
Hf/D=96
Hf/D=80
Hf/D=40

ENHANCING RESILIENCE OF CRITICAL ROAD STRCUTURES – FINAL PROJECT REPORT | REPORT NO. 671.2021
22
The small-scale CFD-DEM model was used to develop a macroscale model to estimate local scour around bridge piers. A series of simulations for a given particle ensemble with specified properties and different flow conditions has been performed using the small-scale model and the results of the fluid shear stress and the particle collision velocity are used to populate a scour function (Figure 2). This scour function can then be employed in the macroscopic CFD-only simulation with one-way particle tracking to predict local scour around bridge pier solely from the flow conditions and particle dynamics (kinetic energy). Through this approach, the many-body interactions of particles within the sediment bed, which account for the bulk of computational overhead, are not directly resolved in the macroscopic CFD-only model but are rather incorporated by the scour rate function which is conditioned by the small-scale model.
Figure 2: Scour probability function as a function of fluid shear stress and collision velocity (which may be converted to kinetic energy as 𝑒𝑒𝑘𝑘 = 1
2𝑚𝑚𝑝𝑝𝑣𝑣2, where 𝑚𝑚𝑝𝑝 is the particle mass of soil). Maroon regions correspond to cases for which no data was recorded during the simulations.
Conclusion
In this study, a microscale coupled CFD-DEM model is developed to study and evaluate the scour around bridge piers under live-bed conditions. The CFD-DEM

ENHANCING RESILIENCE OF CRITICAL ROAD STRCUTURES – FINAL PROJECT REPORT | REPORT NO. 671.2021
23
model is computationally demanding due to the large number of particles and the two very different timescales of CFD and DEM models. The microscale model with periodic boundary conditions, assigned to the inlet-outlet boundaries to reproduce an infinite bed of sediment particles, has been developed in this study to address the limitations of the coupled CFD-DEM models and to enable an in depth-understanding of the interactive behavior of sediment particles and flowing water in scour process. The devised approach has reduced the dimensions of the simulation domain and the number of particles, assisting to curtail the computational expenses. Periodic boundaries also enable replicating live-bed regime by including suspended particles, carried by the flowing water, in numerical simulation. The numerical model has been validated against a few experimental data and is shown to be capable of predicting the sediment transport regime as well as the extent of scour.
The developed microscale CFD-DEM model can be upscaled in a CFD-only model, which is less computationally expensive. The upscaling allows for simulation of local scour around bridge piers with significant reduction in computational expenses. The microscale model would be used to populate a scour rate function for different flow regimes and sediment conditions. Given the development and population of an appropriate scour rate function from the microscale model, this scour rate function can then be employed in the macroscopic CFD simulation with one-way particle tracking to predict local scour around bridge pier solely from the flow conditions and particle dynamics (kinetic energy). Through this approach, the many-body interactions of particles within the sediment bed, which account for the bulk of computational overhead, are not directly resolved in the macroscopic model but are rather incorporated by the scour rate function which is conditioned by the microscale model. Thus, the developed model is largely beneficial to resolve the ongoing challenge of simulating the complex mechanisms around localised scour in bridge piers.
Guidance for end users
A small-scale verified coupled CFD-DEM model has been proposed along with a novel upscaling methodology for estimation of full-scale bridge pier scour. The method can be adopted by the end users to closely evaluate the scour around bridge piers overcoming challenges involved in conventional modelling approaches such as CFD-DEM modelling.
The investigations in relation with the effects of particle properties on the scour process can be useful to minimize the scour induced failure risk of the bridges. Results showed that the particle size has an inverse relationship with the scour depth such that with increasing the particle size the scour depth reduces. Also, the shape of sediment particles affects the scour depth such that the more spherical is the particles, the higher is the scour depth. In addition, studying the effect of particle size distribution (PSD) shown that for a non-uniform assemblage, the scour depth is less than that for the equivalent spherical assemblage. Hence it is recommended to place irregular shaped non-uniform crushed rock at the pier-river bed level to minimize scour induced bridge failures.

ENHANCING RESILIENCE OF CRITICAL ROAD STRCUTURES – FINAL PROJECT REPORT | REPORT NO. 671.2021
24
Fragility and Resilience of Bridges Subjected to Extreme Wave-Induced Forces
Bridges are susceptible to severe damage due to wave-induced forces during extreme events such as floods, hurricanes, storm surges and tsunamis. As a direct impact of climate change, the frequency and intensity of these events are also expected to increase in the future. The damages to bridges lead to substantial community impact during emergency and post-disaster recovery activities. Hence, viable restoration strategies are needed to enhance the resilience of bridges under extreme wave hazards. The research on the quantification of vulnerability and resilience of bridges under extreme wave forces is limited. In particular, vulnerability and resilience assessment tools for bridges under different hazard intensity levels are required to quantify the resilience. This research addresses these research needs by providing a comprehensive vulnerability assessment framework for bridges subjected to extreme hydrodynamic forces.
A comprehensive literature review is first conducted on the four resilience assessment elements, namely external wave force characterization, structural response, vulnerability assessment and resilience quantification to identify the existing gaps in knowledge, particularly in vulnerability and assessment methods.
Unified resilience indices, based on the “resilience triangle” concept, are proposed to take into account the effect of the consideration of resources (cost) and environmental impact and their relative importance to the decision makers in the resilience quantification. Such indices are important for stakeholders as they provide a linkage between the social (time), economic and environmental impacts in the assessment of restoration strategies.
An integrated vulnerability assessment framework for bridges with strong connectivity between super- and sub-structure is proposed. The framework includes both static and time- history analyses to examine the performance of bridges subjected to significant hydrodynamic forces. The uncertainties in force and structural parameters are taken into account and the probability of damage is estimated using six damage states that define the pre- and post-peak response of bridge. The pier drift is taken as the engineering demand parameter. The use of two-parameter intensity measures that can provide an accurate estimation of the response of bridge such as momentum flux (hu2) and moment of momentum flux (h2u2/2) is investigated.
To demonstrate the proposed framework, a numerical model is developed for a case study bridge located in a flood-prone region in Queensland, Australia. The accuracy of the piers model is validated using published works on small-scale pier specimens that have limited ductility. The effect of strengthening of bridge piers using fibre reinforced polymer (FRP) jackets is examined.
The overall fragility functions for all intensity measures (velocity, inundation depth, momentum flux and moment of momentum flux) are obtained for both deteriorated and strengthened bridge. The reduction in scatter of fragility data is examined for the two-parameter intensity measures for all damage states. The viability of the use of FRP jackets for enhancing the resilience of bridges under extreme wave forces is also evaluated. The application of unified resilience

ENHANCING RESILIENCE OF CRITICAL ROAD STRCUTURES – FINAL PROJECT REPORT | REPORT NO. 671.2021
25
indices based on the damage probability data obtained from fragility analysis is discussed for different intensities of the hazard.
The main contribution provided by this research is the comprehensive vulnerability and resilience assessment methods for bridges under extreme wave hazards. Such methodologies can assist in the evaluation of the different pre-disaster strengthening and recovery schemes for bridges. Decision makers (e.g., road authorities) can use the outcome of this research to assess the different retrofitting options for bridges taking into consideration the time, cost and energy consumption associated with each option.
BRIDGES EXPOSED TO BUSH FIRES
Introduction
Bruyère, Holland [1] quotes that “Climate change is no longer about the future”, there are already measurable changes to weather and climate extremes associated with the global warming. Researchers have shown the potential influence of climate change on to the more severe and longer fire seasons around the globe [10]. A warmer world means longer fire seasons and drier fuels [11]. A study covering 1979 to 2013, showed that fire weather seasons have lengthened by 18.7% globally. Meanwhile, the rapid urbanisation and population decentralization in recent decades have increased the size of the Wildland Urban Interfaces (WUI) rendering more communities and infrastructures vulnerable to bush and wild fires [12]. However, only little research exists, elucidating the fire behaviour of Wildland Urban Interfaces. This research aims to understand the extreme effects that can be expected on bridge structures subjected to WUI fires given different environmental and fuel conditions. Given the limited number of researches carried out on the effect of wildland urban interface (WUI) fire on bridge structures, this study first establishes a numerical modelling approach for WUI fire-structure interaction that involved fine vegetation fuels The main purpose of this series of analysis is to understand the effect of fuel characteristics and environmental factors that could potentially change the fire behaviour and the subsequent fire structure interaction. A parametric study will be completed varying the grass height, surface vegetation load, vegetation moisture content and domain wind velocity to understand the effect of temperature development of different girder geometries.
Modelling of fire dynamics in WUI
Both wildland and WUI fires are very difficult to study with full-scale repeatable experiments in the field due to their expense, safety implications, and variations in atmosphere, terrain, and fuel conditions. As an alternative, predictions of wild and bushland fire spread have been achieved through “operational” mathematical models based on empirical correlations for wildland fuels. However, when the fire spreads into wildland Urban Interfaces where fire meets the built environment the empirical correlations may no longer be applied to describe the fire behaviour [13]. Hence, the necessity of an alternative modelling technique should be addressed. As an alternative, this chapter describes the development of a three-dimensional (3D), fully transient, physics based, computer simulation approach for modelling fire spread through surface and

ENHANCING RESILIENCE OF CRITICAL ROAD STRCUTURES – FINAL PROJECT REPORT | REPORT NO. 671.2021
26
elevated fuels in a WUI. 3D physics-based fire modelling can be used to improve our understanding on how fire propagate under variety of fire weather conditions, fuel configurations and terrain conditions and subsequently how these fires affect structures in the vicinity.
Fuel beds are seldom homogeneous. A significant variation of the fuel characteristics can be expected over a landscape scale; however, this study idealizes the problem to a uniform fuel bed. Many of these input parameters can be considered to be in which a large variation would not be expected among different kinds of grass, such as the heat of combustion of the fuel, char fraction, element density, and emissivity. Table 2 shows the parameters used in the analysis. For other properties are considerably based on the environmental conditions or specific plot of land.
Table 2: Thermo physical, pyrolysis and combustion and ambient parameters used in the numerical analysis for surface vegetation
Input parameter Value/range
Heat of combustion 16400kJ/kg
Soot yield 0.008
Vegetation Height 0.5-1.0 m
Vegetation load 0.5-2.0 kg/m2
Vegetation moisture content 6.33%,10.15%,15%
Vegetation Surface to Volume ratio (SVR) 9770 m-1
Vegetation element density 440kg/m3
Vegetation char fraction 0.17
Emissivity 0.9
Vegetation drag coefficient 0.125
Ambient temperature 33°𝐶𝐶
Relative humidity 40%, 80%
Vegetation curing 77.5%,100%
Case study
Fire-structure interaction is dependent on fuel quantity, geometry, fuel characteristics, ambient conditions and structural characteristics. This research is designed to understand the extreme effects that can be expected on to a bridge structure subjected to WUI fires given different environmental and fuel conditions. Numerical simulation of the WUI fire is accomplished using Fire Dynamic Simulator (FDS) software. Assessment were made on the fire-structure interaction of existing steel girder bridge structure exposed to many different fire events covering a range of fuel and environmental conditions. Computation domain used for the analysis and the structural configuration of the bridge

ENHANCING RESILIENCE OF CRITICAL ROAD STRCUTURES – FINAL PROJECT REPORT | REPORT NO. 671.2021
27
withing the domain is given in Figure 3. Table 3 summarizes the descriptions of the case studies completed during the study. Case studies have been designed to represent a range of parameters that could WUI fire interactions.
(a) Longitudinal section of the domain
(b) Inlet wind velocity profile, with 2 m/s and 5 m/s, measured at 10 m from the ground
PG4 cross section PG6 cross section PG10 cross section
(c) Steel cross sectional geometry
(d) Longitudinal view of a plate girders used in the analysis
Figure 3 Description of the computational domain and structural configuration

ENHANCING RESILIENCE OF CRITICAL ROAD STRCUTURES – FINAL PROJECT REPORT | REPORT NO. 671.2021
28
Table 3: Summary of parametric study
An assessment was made on the fire-structure interaction of existing steel girder bridge structure exposed to many different fire events covering a range of fuel and environmental conditions. Temperature development of the structure was monitored using Adiabatic Surface Temperature (AST) computing devices attached to different locations of the bridge covering the flanges, webs and concrete slab. AST data collected during the time period of fire exposure of the structure was subsequently used for a heat transfer analysis. The thermal analysis is carried out using the general purpose finite element software ABAQUS. Adiabatic surface temperature is a practical tool to express the thermal exposure of a surface to fire. Utilizing the AST helps to reduce the data flow into the structural models by eliminating the dependency of the surface temperature on the net heat flux.
Heat transfer mechanism from the fire zone to boundaries of the girder is mainly through convection and radiation, while conduction is the main mechanism for heat transmission within the bridge assembly. A convection heat transfer coefficient of αc = 50 W/(m2°C) was used in the thermal analysis. For thermal analysis, temperature dependent thermal properties, namely conductivity,
Case name Grass height (m)Vegetation load(kg/m2)
Vegetation moisture(%)
Relative Humidity (%)
Vegetation Curing (%)
Wind speed (m/s)
H0.5/B0.5/M0.063/W2 0.5 0.5 6.33 40 100 2H1/B0.5/M0.063/W2 1 0.5 6.33 40 100 2H0.5/B1/M0.063/W2 0.5 1 6.33 40 100 2H1/B1/M0.063/W2 1 1 6.33 40 100 2H0.5/B2.5/M0.063/W2 0.5 2.5 6.33 40 100 2H1/B2.5/M0.063/W2 1 2.5 6.33 40 100 2H0.5/B0.5/M0.1/W2 0.5 0.5 10.15 80 100 2H1/B0.5/M0.1/W2 1 0.5 10.15 80 100 2H0.5/B1/M0.1/W2 0.5 1 10.15 80 100 2H1/B1/M0.1/W2 1 1 10.15 80 100 2H0.5/B2.5/M0.1/W2 0.5 2.5 10.15 80 100 2H1/B2.5/M0.1/W2 1 2.5 10.15 80 100 2H0.5/B0.5/M0.15/W2 0.5 0.5 15 40 77.5 2H1/B0.5/M0.15/W2 1 0.5 15 40 77.5 2H0.5/B1/M0.15/W2 0.5 1 15 40 77.5 2H1/B1/M0.15/W2 1 1 15 40 77.5 2H0.5/B2.5/M0.15/W2 0.5 2.5 15 40 77.5 2H1/B2.5/M0.15/W2 1 2.5 15 40 77.5 2H0.5/B0.5/M0.063/W5 0.5 0.5 6.33 40 100 5H1/B0.5/M0.063/W5 1 0.5 6.33 40 100 5H0.5/B1/M0.063/W5 0.5 1 6.33 40 100 5H1/B1/M0.063/W5 1 1 6.33 40 100 5H0.5/B2.5/M0.063/W5 0.5 2.5 6.33 40 100 5H1/B2.5/M0.063/W5 1 2.5 6.33 40 100 5H0.5/B0.5/M0.1/W5 0.5 0.5 10.15 80 100 5H1/B0.5/M0.1/W5 1 0.5 10.15 80 100 5H0.5/B1/M0.1/W5 0.5 1 10.15 80 100 5H1/B1/M0.1/W5 1 1 10.15 80 100 5H0.5/B2.5/M0.1/W5 0.5 2.5 10.15 80 100 5H1/B2.5/M0.1/W5 1 2.5 10.15 80 100 5H0.5/B0.5/M0.15/W5 0.5 0.5 15 40 77.5 5H1/B0.5/M0.15/W5 1 0.5 15 40 77.5 5H0.5/B1/M0.15/W5 0.5 1 15 40 77.5 5H1/B1/M0.15/W5 1 1 15 40 77.5 5H0.5/B2.5/M0.15/W5 0.5 2.5 15 40 77.5 5H1/B2.5/M0.15/W5 1 2.5 15 40 77.5 5

ENHANCING RESILIENCE OF CRITICAL ROAD STRCUTURES – FINAL PROJECT REPORT | REPORT NO. 671.2021
29
specific heat and thermal expansion, were provided as input into ABAQUS. These properties are defined according to the EN 1992-1-2 and EN 1993-1-2 [14], [15].
Example case study 1- H1/B2.5/M0.63/W2
Figure 4: Fire plume and soot generation
Figure 5. Heat Release Rate (HRR)
0
50
100
150
200
250
0 50 100 150 200 250
HRR
(MW
)
Time (S)
H1/B2.5/M0.063/W2

ENHANCING RESILIENCE OF CRITICAL ROAD STRCUTURES – FINAL PROJECT REPORT | REPORT NO. 671.2021
30
Figure 6: Maximum temperature development of each different girder cross sections
Heat release rate and the rate of spread are the most influential factors that affect the structural temperature development. Wind which directly affects the plume geometry angle can modify the HRR and the spread rate. Higher wind velocities help to build up higher heat release rates but drives the front faster minimizing the resident time for fire structure interactions. Low wind conditions on the other hand result slow progressing, low intensity nearly vertical fire plums which allows longer and more damaging fire structure interactions. It has also been understood that the presence of an overhead obstruction can significantly modify the flame geometry and the total HRR as a result. The modification of a fire plume geometry as a result of the presence of an overhead obstruction such as a bridge structure can have a considerable effect on the HRR, flame front width, convection and radiation heat fluxes and ultimately the fire structure interaction. Lower wind velocity in the domain tends to support a plume driven fire front with low intensity and slow progress. This type of fire tends to create higher temperature development of the structure due to the increased residence time of the flame front. In contrast, higher background wind velocity results a high intensity fires with a high rate of spread, however, such fires cause lower temperature development of the structure because of the lower residence time of the fire under the bridge It is interesting to note how the 3 levels of moisture contents used in the analysis affected on the temperature development of the structural components. As the moisture content of the fuel increased the maximum HRR decreased. However, such condition helped to slowdown the fire front spread rate and increased the resident time allowing higher temperature development of the structure.
According to the results, temperature development on structural components have a strong dependency on the vegetation load available on the ground and the vegetation height which determined the compactness of similar loads of fuel above all the other parameters. Vegetation load which determines the amount of heat that potentially can be released in a fire is the only component of the mix that can be controlled by land managers. Hence, exercising fuel hazard reduction methods through Mechanical fuels treatments is one of the few things

ENHANCING RESILIENCE OF CRITICAL ROAD STRCUTURES – FINAL PROJECT REPORT | REPORT NO. 671.2021
31
can be done to reduce the risk of bushfires and their intensity to control the fire structure interactions by keeping the fire in milder conditions. This also helps to improve the chances of firefighters getting them under control. Instead of control burning, mechanical fuels treatments can be used in wildland Urban interfaces where fuel loading poses a hazard. On the other hand, the presence of elevated fuel around the structure causes the highest temperature in the structure compared to the surface only fuel conditions. This signifies the fact that the presence of elevated fuel load close to the structures poses a significant risk in terms of temperature development and its consequences.
Conclusions
Fire-structure interaction on a bridge located at a wildland urban interface is investigated using a series of case studies. Case studies are prepared in order to cover a range of environmental and fuel conditions. Vegetation height, vegetation load, fuel moisture content and domain wind speed were treated as the primary variables in case studies. Body temperature development of the different elements of the bridge is taken as the primary output. The maximum temperature that is experienced by a structural element is used to predict the degradation of the material strength parameters and the shear behavior of the girder geometry.
• According to the case studies it could be concluded that, lower wind velocity in the domain results a slow progressing and low intensity fire front. This type of fire tends to create higher temperature development of the structure due to the increased residence time of the flame front.
• It could be observed in all the case studies that resident time of fire front has a directly proportionate relationship with the temperature development of structural elements.
• It could also be understood that the presence of an overhead obstruction such as a bridge, can significantly modify the flame geometry, the total HRR and ultimately the fire structure interaction.
• It was interesting to note how different levels of moisture contents used in the analysis (research range from 6.33% to 15%), affected the temperature development of the structural components. As the moisture content of fuel increased, the maximum HRR decreased. However, such condition helped to slowdown the fire front spread rate and increased the resident time allowing a higher temperature development of the structure.
• It can be concluded that well compacted higher loads of fuel with considerably higher moisture content (tested only up to 15%) inside a low wind velocity environment can produce a higher thermal impact during a bridge fire- structure interaction.
• According to the results of the series of simulation work, author believes that the effect of fine fuel on the fire structure interaction is limited mainly to shear capacity reduction. This is mainly due to the fact that, even under the shorter period of fire resident time, a significant temperature development can be experienced by web structural element depending on their respective thicknesses.

ENHANCING RESILIENCE OF CRITICAL ROAD STRCUTURES – FINAL PROJECT REPORT | REPORT NO. 671.2021
32
Results from this project can help to understand the isolated bushfire cases on bridge structures. However, cumulative effects on a bridge structure when exposed to recurrent WUI fire events should be investigated in a future research.
BRIDGES UNDER EARTHQUAKE LOADING
Introduction
Over the past several decades, bridges have experienced frequent disasters under extreme loading of natural hazard, among which earthquake is one of the most severe hazards worldwide. It is noticeable that specific design codes for bridges under seismic load were developed and modified iteratively through the past century and there were many historical bridges constructed before a comprehensive design code was established. Because of this, the prediction of failure cases of these bridges is more difficult to generate and accompanying impact on surroundings will be uncontrollable as well.
As located inside Indo-Australian plate, Australia experiences more intraplate earthquakes, which are less severe but harder to predict and cannot be explained from plate tectonics, thus severe damage could happen to Australian bridges and result in huge losses, which means it is still pivotal to ensure the seismic performance, especially for those vital lifeline structures like bridges.
Bridge is a significant component of transportation system, and it provides connection between places which are separated by rivers, valleys or roads. It is one of the most critical portions of city infrastructure system, and it influences the economic and cultural development for its connectivity function across areas, which is regarded as part of lifeline engineering. It is of vital importance to predict and monitor the performance of bridge under earthquakes then provide appropriate response to control its influence on both property and lives.
Due to the absence of adequate recorded earthquake data and limited access to all bridge parameters, it is likely to be impossible to simulate real ground motion conditions and predict bridge performance for each bridge in Australia.
As there are limited resources to stimulate the performance of each bridge under earthquake conditions, a risk-based bridge prioritisation system on multi criteria can be set up to predict the vulnerability of bridges for earthquake impact for the bridges in Australia. After identifying the most critical bridges, a rating framework for the most common bridge types will be developed to assess the failure probability due to earthquake impacts.
Although Australia is located in low-to-moderate seismicity zone, the cost of extreme condition is considerable and have had significant impact on infrastructure and communities. The following figure (Figure 7) shows the insured costs of natural disasters between 1987 and 2016.

ENHANCING RESILIENCE OF CRITICAL ROAD STRCUTURES – FINAL PROJECT REPORT | REPORT NO. 671.2021
33
Figure 7: Historic insured costs of natural disasters, Australia, 1987-2016 (2017 prices)
It is observed that the Newcastle earthquake in 1989 caused widespread damage with insured cost of $3.5 billion (in 2017 prices). Even though the probability of large earthquake is low, the damage of such a case would be catastrophic in consideration of many existing bridge structures that are not constructed in accordance with the current seismic design standards. There were also several earthquakes already observed higher than the moderate earthquake magnitude defined in AS1170.4, like the 1988 Tennant Creek, NT earthquake and 1997 Collier Bay, WA earthquake. Hence, more researches about earthquake vulnerability of important bridge infrastructure, which are critical components in transportation network, should be conducted to ensure the safety or provide improvement methods as required.
Vulnerability of bridge can be estimated based on multiple criteria including the intensity of disasters, vulnerability of structures and the impact on community. A marking system for bridge seismic risk assessment or bridge maintenance can be proposed using an integrated bridge index (IBI) for bridge rating that describes its influence on bridge serviceability and road network operation by considering strategic importance, bridge condition, hydraulic risk, and seismic risk together, which conforms with Chile condition by 98%. A weighted formula to prioritize bridge retrofits is put forward by considering replacement cost, condition of the bridge, bridge traffic, and age of the structure. The highest rank for retrofit in this program is Fourth Street Viaduct with scores of 8.10.
These findings raised a question that what are the contributing factors and their weightings which requires consideration in maintenance of bridges to be resilient to earthquakes.
Research activities
Three main research areas as given below were conducted to achieve the objectives:
1. Vulnerability analysis of bridges under earthquakes by fragility curve

ENHANCING RESILIENCE OF CRITICAL ROAD STRCUTURES – FINAL PROJECT REPORT | REPORT NO. 671.2021
34
2. Prioritisation of bridges considering earthquake impacts
3. Development of a bridge rating method
Vulnerability analysis of bridges under earthquakes by fragility curve
Fragility analysis of bridge structures is necessary for post-construction risk assessment and management as many bridges in Australian transportation network were not designed with enough seismic reliability. This study aims to develop fragility curves for the case-study bridge selected in accordance with the bridge inventory analysis, which can be used to predict the seismicity performance of typical bridge types in Australia.
Review of methods for development of fragility curves
Seismic risk assessment aims to estimate the potential losses with the occurrence of an earthquake, and seismic fragility analysis is a conventional means utilised in this assessment.
Existing fragility curves can be categorised into the five groups in accordance with different sources of damage data applied in the generation of fragility curves. The five groups are judgmental, empirical, experimental, analytical and hybrid, derived from the expert judgment, post-earthquake investigations, full-scale experiments, analytical simulations, or combinations of some methods above, respectively (Wu et al., 2017). For this research project, the analytical approach is preferred due to the robustness and reliability. Among all kinds of analytical fragility curve development, nonlinear time history analysis (NLTHA) is chosen as the method utilised in this study due to its reliability and the natural considerations of various uncertainties.
Fragility curve development
NLTHA is convenient to combine various variabilities in the process of modelling establishment, including the uncertainties of geometry, materials and seismicity. Many researchers applied this method to develop fragility curves for bridges. In terms of the procedure, the analysis basically follows the outline depicted below:
Firstly, a large ground motion suites are constructed based on the procedure developed by Lam, Wilson, Chandler and Hutchinson. Then, a series of ground motion records are selected from the suites following the method of “bins” suggested by Shome et al. [16]. Motions are divided into four bins based on its moment magnitude of event (M) and closet distance from the source (R) to cover the whole range of possible earthquakes in Australia.
Secondly, after choosing appropriate time histories, 3D sample bridge modelling should be developed by OpenSees to explicitly consider nonlinear finite-element analysis for bridge components like columns, bearings, abutments and headstocks. Different components should be made up of different modelling elements.
Thirdly, because responses are always measured by different engineering demand parameters (EDPs) to depict the damage statuses. Thus, different ranges of EDP values can be divided into different damage status (DS). There are

ENHANCING RESILIENCE OF CRITICAL ROAD STRCUTURES – FINAL PROJECT REPORT | REPORT NO. 671.2021
35
always four stages named as slight, moderate, extensive, complete damages showing different median value and standard deviations of each critical component.
Fourthly, fragility curve can be generated. Fragility curve is defined as the cumulative probability curve of reaching or exceeding a specified damage state for a specific component. When the seismic demand (D) of one component exceeds the corresponding capacity (C) value under a specific IM value, thus the probability equation is generally expressed in the form of conditional probability as below:
𝐹𝐹𝐹𝐹𝐹𝐹𝐹𝐹𝐹𝐹𝐹𝐹𝐹𝐹𝐹𝐹𝐹𝐹 = 𝑃𝑃[𝐿𝐿𝐿𝐿|𝐼𝐼𝐼𝐼 = 𝐹𝐹]
Case study
According to the bridge inventory analysis based on the VicRoads database, the prestressed concrete I-beam girder bridge is the most common bridge type in Australia. Hence, a three-span prestressed concrete girder bridge (Tenthill creek bridge) is considered as the case-study bridge. The layout of this bridge is illustrated in Figure 8 below. Three-dimensional (3D) nonlinear finite element models of the case-study bridge were established using OpenSees as shown in Figure 9.
Figure 8: Structural details of the case-study bridge

ENHANCING RESILIENCE OF CRITICAL ROAD STRCUTURES – FINAL PROJECT REPORT | REPORT NO. 671.2021
36
Figure 9: Visualised model of the case-study bridge
Following Equation (1) of cumulative probability calculation, the damage probability of the four retrofit conditions with increasing PGA under different limit states is plotted in Figure 10. The four lines present the probabilities of damage at the four different damage states. The highest probability of slight damage is 0.825 while it is only 0.043 for complete damage states.
Figure 10: Fragility curves for case study bridge

ENHANCING RESILIENCE OF CRITICAL ROAD STRCUTURES – FINAL PROJECT REPORT | REPORT NO. 671.2021
37
VULNERABILITY MODELLING OF FLOODWAYS UNDER FLOOD LOADING CATEGORISATION OF FLOODWAYS
The knowledge utilised within the classification of floodways was acquired from the standard engineering designs from the Lockyer Valley Regional Council in Queensland. Floodways constructed in the Lockyer Valley Regional Council area after the 2011 and 2013 flood events typically consisted of four types (Figure 11). Each type geometrically differed based on the slope of the upstream and downstream batter and the dimensions of the upstream and downstream rock protection. These features are typically varied to suit the road segment and crossing geometry.
Figure 11: Typical floodway construction types in the Lockyer Valley Regional Council.
Type 1
Type 2
Type 3
Type 4
ENHANCING RESILIENCE OF CRITICAL ROAD STRCUTURES – FINAL PROJECT REPORT | REPORT NO. 671.2021
38
VULNERABILITY OF FLOODWAYS IN THIS REGION
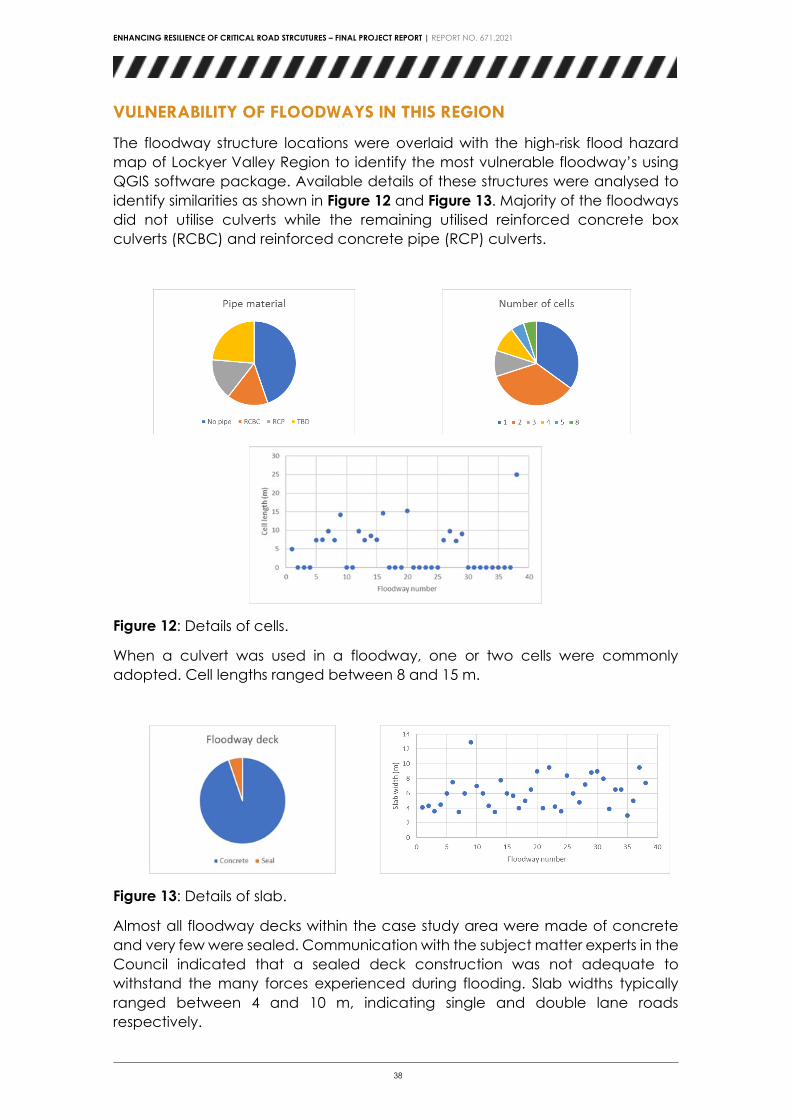
The floodway structure locations were overlaid with the high-risk flood hazard map of Lockyer Valley Region to identify the most vulnerable floodway’s using QGIS software package. Available details of these structures were analysed to identify similarities as shown in Figure 12 and Figure 13. Majority of the floodways did not utilise culverts while the remaining utilised reinforced concrete box culverts (RCBC) and reinforced concrete pipe (RCP) culverts.
Figure 12: Details of cells.
When a culvert was used in a floodway, one or two cells were commonly adopted. Cell lengths ranged between 8 and 15 m.
Figure 13: Details of slab.
Almost all floodway decks within the case study area were made of concrete and very few were sealed. Communication with the subject matter experts in the Council indicated that a sealed deck construction was not adequate to withstand the many forces experienced during flooding. Slab widths typically ranged between 4 and 10 m, indicating single and double lane roads respectively.

ENHANCING RESILIENCE OF CRITICAL ROAD STRCUTURES – FINAL PROJECT REPORT | REPORT NO. 671.2021
39
From the analysis of the floodways in the Lockyer Valley region, it was identified that there are four (4) types commonly used with small variations to the batter slope and rock protection for each type. Majority of the most vulnerable floodways did not have culverts. Slab decks were typically made from concrete and of a single lane width. These parameters were used in subsequent research covering modelling and structural analysis. Further details on the methods used to classify floodways can be found in Lokuge et al. [17].
INSPECTION OF FLOODWAYS
The floodway inspection and maintenance framework was developed to enable the correct information capture for the condition assessment of floodways. This framework also incorporated the damage index method to evaluate repairs and reconstruction needs in monetary terms and to prevent over or under cost estimation. A case study based on the assessment of floodways in the Lockyer Valley Regional Council was also provided demonstrating the utilisation benefit of the framework developed. This framework is anticipated to assist regional councils through enhanced decision making and the ability to prioritise repairs in respect to both short term and long-term benefits.
Inspection Framework Method
The floodway inspection framework consisted of five key elements which were arranged in separate tables to allow for data entry. The five key elements were as follows:
A. Basic information – a table was created which facilitated recording asset identification, location, some design and construction details and type of floodway. It was recommended to adopt the Austroads Guide to define the floodway type.
B. Previous inspection notes – It was identified that a summary table of previous inspection reports and repair/reconstruction work was important in the decision-making process and therefore a table recording such data was assembled. This section also includes a section to add pictures from the last inspection undertaken.
C. Basic details of current inspection – A table was provided to record current inspection records such as date, time, person/s inspecting and the reason for the inspection. The varying triggers to undertake inspections were classified as regular inspection, maintenance work or to assess the structure due to damage caused by a natural disaster or an accident. In the latter case, the nature of the incident should also be included. As an example, flood level, period and annual exceedance probability are all parameters that can be used to classify a flood event and the need for an inspection.
D. Inspection records (Table 3)- This section in the framework provides a detailed and methodological approach that outlines each component of a floodway, its failure mechanism and the extent of the damage. This step is the most important step and is used to estimate the magnitude of

ENHANCING RESILIENCE OF CRITICAL ROAD STRCUTURES – FINAL PROJECT REPORT | REPORT NO. 671.2021
40
the damage and hence the corresponding decision on repair/reconstruction needs.
Through a qualitative assessment a value is assigned to each element based on the state of the floodway at the time of inspection. A value of 1 indicates that the element is in excellent condition. A value of 2 indicates satisfactory condition and that the floodway is only subjected to minor damage, deterioration or misalignment. A value of 3 indicates moderate damage/deterioration or a fair condition. A value of 4 is used when the floodway is in poor condition and elements have major defects. Any element that has failed or failure is imminent should be rated critical corresponding to a value of 5.
E. Condition Report – This is the last section of the framework and includes the preparation of a condition report with sign-off. Judgement on the extent of damage, repair/reconstruction is also outlined in this section.

ENHANCING RESILIENCE OF CRITICAL ROAD STRCUTURES – FINAL PROJECT REPORT | REPORT NO. 671.2021
41
Table 4. Typical inspection record (further sheets are included for damage index calculations and asset condition ranking).
Inspection Record
Location/ Condition
Upstream Dimension
Damage Extent (%) State
Notes
Pipe from Left to Right In pipe note any debris, evidence of wildlife or anything noteworty.
1 Internal 10 1 Minor debris in pipe.
2 Internal 25 2 Cracks in pipe. Evidence of plant life.
Endwall External 10 1 Needs reseal. Not covering Pipe
Left Wingwall External 50 2 Cracking throughout. Needs seal
Right Wingwall External 100 5 Missing
Apron External 25 2 Evidence of plant life
Toe External 100 5 Missing
Riprap/Rock Protection External 100 5 Missing
Scour/Erosion External 0 1 None evident
Location/ Condition
Downstream Dimension
Damage Extent (%) State
Notes
Pipe from Left to Right In pipe note any debris, evidence of wildlife or anything noteworty.
1 Internal 5 1 Needs reseal.
2 Internal 10 1 Minor debris in pipe.
Endwall External 10 1 Needs reseal. Not covering Pipe
Left Wingwall External 60 3 Part missing. Cracks throughout
Right Wingwall External 60 3 Part missing. Cracks throughout
Apron External 100 5 Missing
Toe External 100 5 Missing
Riprap/Rock Protection External 100 5 Missing
Scour/Erosion External 0 1 None evident
Sundry
Roadway Good condition
Upstream Vegitation Ok 1/5
Downstream Vegitation Fair 2/5
Signage Ok 1/4

ENHANCING RESILIENCE OF CRITICAL ROAD STRCUTURES – FINAL PROJECT REPORT | REPORT NO. 671.2021
42
Case study
A case study was undertaken to compare the results of the above inspection framework and current condition state of a culvert. The culvert used in the case study was selected at random, with the criteria that it was not in condition state 1 or one of the 436 selected for the data analysis. The culvert received a condition state 2 rating from LVRC in 2015. This inspection framework also gave the culvert a condition state 2 but also gave it a damage index of 21.25. This damage index can then be used to rate culverts against each other to determine maintenance priority.
As part of this maintenance framework for small structures the following outcomes were derived:
• A comprehensive literature review on the available maintenance guidelines for road structures was conducted.
• Associated photos for each element of the floodways/ culverts under the four condition states was collected.
• Inspection framework was developed to suit the small road structure maintenance.
• The developed framework was demonstrated using a case study.
ANALYSIS OF FLOODWAYS UNDER DIFFERENT LOADING SCENARIOS
Four standard engineering floodway types from the Lockyer Valley Region in Queensland were selected for use in the analysis of floodways under different loading scenarios. Three-dimensional finite element modelling and subsequent parametric analysis was conducted using finite element computational software.
Modelling methodology
The modelling techniques, criterions and selected parameters which were utilised in this research are listed as follows:
• Element types and criterions: Four node tetrahedra Strand7 brick elements were used to construct the three-dimensional model. Mohr-coulomb yield criterion, a commonly implemented failure model for geotechnical materials was used to analyse the non-linear behavior of soil materials. Max Stress yield criterion was assigned to concrete brick elements and defines failure when stress components exceed yield strength in either compression or tension.
• Boundary conditions: Boundary conditions were assigned to the outer model extents to imitate in-situ support conditions of a floodway situated in infinite length and depth of natural adjoining strata.
• Mesh and model refinement: the extent of adjoining natural earth and mesh density was iteratively increased until a converged numerical solution resulted.

ENHANCING RESILIENCE OF CRITICAL ROAD STRCUTURES – FINAL PROJECT REPORT | REPORT NO. 671.2021
43
• Concrete-soil interface: It was concluded that omitting contact interface was satisfactory for flow velocities less than or equal to 8 m/s as loading was calculated to be well below the maximum frictional force.
• Mechanical properties: Rock protection was assumed to be made up of individual loose packed rocks (lower modulus and density) which behave as a soil material defined by Mohr-Coulomb criterion. Steel reinforcement in concrete was neglected, allowing tensile forces apparent to be determined and reinforcement designed accordingly in the structural design method presented.
Due to the complexity of the full-size model and the use of a nonlinear analysis, a verification model representing a component of the augmented model was utilised to provide model confidence. The following was checked utilising the verification model:
• Elastic response: Hooke’s Law was used to resolve vertical displacement for each of the layered elastic materials in the verification model. By comparing total elastic displacement calculated by Hooke’s law to that of the linear static solver output, discrepancies in the model’s response could be determined.
• Visual response: Visual inspection of the magnitude and shape of deformation was checked to ensure uniformity and that realistic results were being obtained.
• Mohr-Coulomb response with concrete-soil interface: The effect of contact was analysed using the Coulomb friction/Elliptical Plastic model after inducing a small gap between the layers and linking the two regular meshes so that they are in immediate contact.
The following range of variables and loads were selected for use in the parametric analysis. The values used for these variables were consistent with those recorded during the 2011 flood event in the Lockyer Valley Region and the design considerations implemented by the Lockyer Valley Regional Council.
• Flow depth intervals consisting of 0, 1 and 2 m above the road surface.
• Upstream velocities of up to 8 m/s;
• Varying boulder mass between 2 and 4 tonnes;
• Varying cut-off wall depth between 900 and 1100 mm;
• Varying adjacent soil types; and
• Varying downstream rock protection extents.
• Loadings: Hydrostatic, vehicular, boulder impact and debris loading.
Outcomes
The worst-case loading scenario was discovered to occur when flow depth and flow velocity were at a maximum and for a 4-tonne boulder impact, no downstream rock protection and a 900 mm cut-off wall depth. Changing soil

ENHANCING RESILIENCE OF CRITICAL ROAD STRCUTURES – FINAL PROJECT REPORT | REPORT NO. 671.2021
44
types was also found to have a large influence on the variability of displacement and stress results.
It was also discovered that both positive and negative bending moments and shear forces act against the floodway superstructure. Further, these maximum positive and negative moments and shear forces are concentrated at the upstream and downstream cut-off wall and apron locations. These locations were subsequently selected for the development of strength capacity design charts representing the absolute moment and force acting on the structure.
As an outcome of this research, strength capacity charts containing design bending moment and shear force values for the five floodway types were derived based on the worst-case loading scenario (Figure 14). These design graphs provide designers with an accurate and expeditious method to determine the design forces apparent within the floodway structure under extreme flood loadings. Designers can then design structural elements in accordance with the relevant concrete design standards. Through the implementation of this design process it is expected that floodway structural resilience will be improved as a result of increased durability, serviceability and
strength.
(a) (b)
Figure 14: Typical (a) design bending moment and (b) design shear force charts.
Greene et al. [18] gives further details on the numerical finite element modelling and simulation methods, which were used to derive the structural design charts.
A SURVEY OF INDUSTRY EXPERTS AND ASSET OWNERS
Following several extreme flood events within Australia, the investigation into floodway construction and maintenance techniques has been undertaken by many government organisations to enhance the resilience of rural communities. To collate the intuition and experiences of engineers, asset owners and individuals undertaking these investigations, a survey containing open-ended and closed-ended questions was prepared and distributed. This survey specifically focused on the vulnerability of floodway structures during extreme flood events, the failure mechanisms observed and feedback relating to design improvements and amendments. The responses received form a significant repository of information pertaining to the design, construction and maintenance techniques being undertaken in practice. The responses also highlighted several areas of vulnerability such as; the downstream rock
3 4 5 6 7 8
Velocity (m/s)
0
5
10
15
Desig
n Be
ndin
g M
omen
t (kN
m)
1m Flow depth
1.5m Flow depth
2m Flow depth
3 4 5 6 7 8
Velocity (m/s)
0
10
20
30
40
50
60
Desig
n Sh
ear F
orce
(kN)
1m Flow depth
1.5m Flow depth
2m Flow depth

ENHANCING RESILIENCE OF CRITICAL ROAD STRCUTURES – FINAL PROJECT REPORT | REPORT NO. 671.2021
45
protection, raised floodway structures, sandy soil types and impact loading from debris conveyed by floodwaters. Several improvements to the current design practices were also identified.
Methodology
An online survey instrument (refer appendix A) consisting of 12 questions was prepared using Lime Survey and received ethics approval from the University of Southern Queensland. Prior to dissemination, the online survey instrument was thoroughly beta-tested to ensure functionality. The target audience consisted of individuals and asset owners with expertise in floodway design, construction and maintenance and included councils, road authorities, technical consultants and Institute of Public Works Engineering Australasia (IPWEA) members. The survey questions were mainly objective, however, also incorporated questions that allowed the respondents to detail their experiences and knowledge further. On average, the survey took approximately nine minutes to complete and was open for a three-week duration.
Responses
Figure 15: Survey responses received
The survey was accessed a total of 96 times, for which 64 completed responses (66.7%) were received. The remaining 32 responses (33.3%) were partially completed and were not considered in the analysis (Figure 15). The survey received participation from QLD, NSW, VIC and SA, providing a good cross-section of floodway experiences within Australia.
Results
Question 1 - The survey results strongly suggest that floodway structures were “highly likely” (42.2%) or “likely” (40.6%) to sustain damage during extreme flood events. The options; “neither likely nor unlikely”, “unlikely” and “very unlikely” received 10.9%, 4.7% and 1.6% respectively.
Question 2 - It was suggested by respondents that downstream floodway structural components are most likely to sustain damage during extreme flood events. Downstream rock protection ranked highest (65.6%), followed by the downstream batter (12.5%) and downstream cut-off wall (7.8%). Few respondents stated that the upstream rock protection (7.8%), apron (4.7%) and
Completed responses (64)
Partial responses (32)

ENHANCING RESILIENCE OF CRITICAL ROAD STRCUTURES – FINAL PROJECT REPORT | REPORT NO. 671.2021
46
upstream cut-off wall (1.6%) were the most susceptible component to be damaged during extreme flood events.
Question 3 - Fifty-two respondents (87.5%) stated that floodway failure was more common in raised floodway structures as opposed to level floodway structures (12.5%).
Question 4 - 78.1% of respondents stated that floodway failure is more noticeable in certain soil types. Out of the multiple-choice list of soil types, a Sandy Soil type received the most responses (56%), followed by Clay Soils (12%), Silty Soils (10%) and Gravel Soils (8%). The option to select ‘Other’ also existed, which received seven responses (14%). These responses detailed that sodic and highly dispersive soils were also problematic to floodway construction.
Question 5 - Forty respondents (62.5%) stated that increased sediment loading from articles such as organic debris (logs) and boulders have contributed to floodway failure as a result of being conveyed by floodwaters and impacting the floodway structure. Of these 40 respondents, 15 (37.5%) stated that impact from boulders (large rocks) specifically contributed to the failures experienced. The other 25 respondents (62.5%) indicated that the impact of boulders did not contribute to the failures.
Where is the Question 6?
Question 7 - Respondents were asked if they had undertaken any investigations into different concrete cut-off wall configurations, including depth and width. Out of the 64 respondents, seven (10.9%) stated that they had undertaken investigations into different cut-off wall configurations, while the remaining 57 respondents (89.1%) indicated that they had not.
Of the seven respondents that had undertaken investigations into different cut-wall configurations, four respondents (57.1%) had considered both the upstream and downstream cut-off walls, two respondents (28.6%) had only considered the downstream cut-off wall and one respondent (14.3%) had only considered the upstream cut-off wall.
Question 8 - The respondents were asked if they had trialled any other improvements or amendments to floodway design to increase structural resilience against flooding. Twenty-three respondents (35.9%) stated that they had, while the other 41 respondents (64.1%) indicated that they had not. The improvements and modifications to current floodway construction practices covered areas such as geometric alignment, structure configuration, pavement materials and rock protection.
Question 9 – A wide range of other feedback was also received based on the respondent’s different experiences in floodway design, construction and maintenance.
The experiences and observations recorded within this survey suggested that flooding is a significant cause of floodway failure. It also highlighted that downstream floodway components including rock protection, cut-off wall and apron, respectively, were the most likely components to fail during exposure to

ENHANCING RESILIENCE OF CRITICAL ROAD STRCUTURES – FINAL PROJECT REPORT | REPORT NO. 671.2021
47
flooding. Raised floodway structures were also discovered to be significantly more vulnerable to failure than structures constructed level with the creek bed. Furthermore, the watercourse bed soil type was also discovered to be a significant contributor to floodway failure, thus highlighting the importance of achieving a non-erodible creek bed during design. The failure mechanisms recorded within this survey were used to validate the numerical floodway modelling outputs used within the design guideline. The results of this survey were published by the Institute of Public Works Engineering Australasia, Queensland branch (IPWEAQ) in the Engineering for Public Works e-journal [19].
DEVELOPMENT OF A FLOODWAY DESIGN GUIDE
A design guideline covering a comprehensive design approach was deduced. This design guideline considered a structural model to predict failure during a worst-case peak flow and an associated impact load. This design methodology still relied upon and incorporated the hydraulic practices from traditional design guidelines for floodway flow characteristics, however, it doesn’t consider hydraulic principles as the primary predictor of floodway failure. The incorporated structural design methodology within the developed design guideline provides designers with an expeditious method to calculate the ultimate design forces using design charts. By implementing the design process, structural resilience will be improved through satisfying durability, serviceability and strength criteria.
IPWEAQ has been presented with this design guideline, undertaken review and has identified the value of the work and suggested that the outcomes be published as an BNHCRC/IPWEAQ joint publication to create a pathway to utilisation. It is intended that designers can use the developed manual inclusive of design charts and comprehensive worked examples as a complete national guide for the design of resilient floodways.
Content Covered within Design Guideline
The following content in sequential order was covered within the design guideline:
1. Determine floodway suitability for the selected asset classification. This includes the incorporation of a road asset classification table for rural roads.
2. Conduct a field survey to determine preliminary information required for design, including the optimal crossing location, long and cross sections, Manning’s roughness coefficient, hydraulic gradient, soil type and design flood depth.
3. Determine geometric horizontal and vertical alignment, appropriate signage for use at the crossing and design road level.
4. Select standard engineering floodway type to be implemented. This section includes construction considerations, a library of five standard floodway types and a selection matrix to assist in selecting the appropriate floodway type based on stream characteristics.

ENHANCING RESILIENCE OF CRITICAL ROAD STRCUTURES – FINAL PROJECT REPORT | REPORT NO. 671.2021
48
5. Conduct hydraulic design, including peak flood flow and depth calculations.
6. Select appropriate scour, pavement and embankment protection. Different protection types are explained including rock protection design tables.
7. Design floodway structural elements to satisfy the relevant standard based on the design bending and shear force values obtained from the design charts for the library of five standard floodway types.
8. Detailed design and issued structural drawings.
Two comprehensive worked examples based on the procedure outlined (Figure 16). These examples cover both a flush mounted floodway construction and a raised floodway construction.
Figure 16: Typical floodway design completed using the process
The end users who will benefit from the developed design guideline are local councils in Australia who design and maintain rural roads. The new robust design process developed will lead to a resilient design of floodways to avoid recurrent failures. The end user benefit is the reduced cost of reconstruction and enhanced recovery time of the council area after a disaster event, ultimately reinstating the normal day to day life of the community in a much more expeditious manner.

ENHANCING RESILIENCE OF CRITICAL ROAD STRCUTURES – FINAL PROJECT REPORT | REPORT NO. 671.2021
49
PRIORITISATION OF BRIDGE STRUCTURES ECONOMIC IMPACT DUE TO BRIDGE FAILURE
The bridge importance ranking is conducted based on the consequence of bridge closure due to emergency repair or the worst-case of unexpected failure. Bridge importance ranking and prioritization are essential for cost-effective asset management because of the size of bridge network. A state-wide bridge network in Australia can have more than 3000 bridges as compared to 14,000 bridges in Florida state of US. A more comprehensive list of consequence costing models is used in this analysis which result in more accurate importance raking of bridge network. The significant contribution of this study is the new development of five costing models for delay of ambulance, police and fire-fighting services, and road-surface wear cost together with freight delay cost in bridge importance ranking. Furthermore, the costing approach adopted in this study is better than the scoring approach in importance ranking of bridge network. This is because the costing approach can be used for cost-benefit analysis, which is the core of funding application or business case for public projects.
The costing models considered in this study for bridge importance ranking are shown in Figure 17, which depicts how a bridge closure or restriction over a period of time cause various costs to road users and community. When a bridge is closed or restricted, road users are to take detour routes with consequence of additional travel time and length. These detour time and detour length together with bridge attributes such as traffic volume, distance to public primary services (e.g. hospital, police and fire stations) are used to calculate various costs to road users and community. Components in Figure 17 are presented in more detail where appropriate in the following sections. The cost models for noise, soil, water and vibration are ignored due to difficult to estimate due to assumed short period of bridge closure and restriction.
All costing models are calculated for daily costs, which is the suitable format for multiplying with duration of bridge closure in unit time of days in cost-benefit analysis.
Figure 17: Diagram of costing method for bridge importance ranking

ENHANCING RESILIENCE OF CRITICAL ROAD STRCUTURES – FINAL PROJECT REPORT | REPORT NO. 671.2021
50
Detour route, detour time and detour length
When multiple detour routes are available for a bridge closure, the choice of detour route by car drivers is based not only on attributes of detour route (e.g. speed limit, length, and safety hazard) but also on driver’ behavior (e.g. driving habit, road knowledge, minimized travel cost) and recently added traffic update. This is similar to the well-known problem of traffic assignment over alternative routes. The traffic assignment algorithms can be used to identify bridge detour routes and how bridge traffic volume is assigned to each detour route. These algorithms, although considered very advanced, require intensive data and processor. Alternatively, some simpler search methods for detour route can be used.
The detour route can be manually selected by searching in Google traffic map for 10 bridges in the case study. The Google traffic map can provide several possible detour routes with the shortest travel time and/or length for selection. The estimated travel time seem to be real time updated by GPS signal, which can be changed at time during a day such as peak morning and afternoon, and non-peak lunch and evening time. It should be noted the estimated travel time by Google traffic map is based on the normal operation of bridges. When the bridge closure occurs, the estimated travel time in a detour route is expected longer due to a large number of detour vehicles and must be timely checked in Google traffic map or can be estimated using traffic congestion Equation.
The steps taken to identify detour routes are as follows:
1. Two major intersections nearest to both ends of the bridge are selected for start and end of possible detour routes on Google traffic map.
2. The resulted detour routes and their travel time and length from Google traffic map search are recorded.
3. If multiple detour routes are needed, the estimated travel time is not 4. Due to the focus on costing models, only one detour route is selected in this
study and is based on the shortest travel time. The manual search of detour routes can be replaced by the automatic search using GIS tool and search algorithm. The search algorithm uses the similar setup of the manual detour search method.
Detour length in kilometer unit is the additional travel length due bridge closure and is calculated as the difference between travel length over the fully open bridge and travel length in the selected detour route.
Detour time in minute unit is the additional travel time due to bridge closure and is calculated as the difference between travel time over the fully open bridge and travel time in the selected detour route.
Time value cost
Time value is monetary value of additional travel time due to bridge closure. Time value is applied to all bridge users (i.e. vehicle, pedestrian, cyclist) including working people (e.g. driver, business, worker) and non-working people (e.g. student, tourist, pensioner). Time value is calculated as:

ENHANCING RESILIENCE OF CRITICAL ROAD STRCUTURES – FINAL PROJECT REPORT | REPORT NO. 671.2021
51
TimeCost = DetourTime x HourlyPay x NumberPerson
Detour time is estimated in unit time of minute in Section 2 and needs to convert to unit time of hour to match with the hourly pay.
The hourly pay can be distinguished between business class ($49/hr) and working class ($15/hr) as per ABS.
The variable NumberPersion is the number of bridge users, which can be estimated using the following equation:
NumberPerson=DetourAADT * 1.3 + commuters by Tram/Bus/Walker/Cyclist
The detour AADT is the bridge AADT assigned to each detour route. The detour AADT can be estimated using sophisticated algorithm as described in the previous section. For a simplification to suit the manual search method of Google traffic map, the detour AADT can be estimated using weighted average method as follows. Suppose that bridge AADT is 1000 and there are 3 detour routes with known travel length and travel time from Google traffic map as (40 km, 0.5 hour), (25 km, 1 hour), (15 km, 1.2 hour). If it is reasoned that car drivers would prefer detour route with higher average speed, the detour average speed is calculated as 80 km/h, 25 km/h, and 12.5 km/h. Then the detour AADT can be calculated using weighted average as shown in Equation 3 and results of detour AADTs are 681, 213 and 106 respectively.
DetourAADT = Bridge AADT * Detour average speed / (sum of average speed)
The value of 1.3 in Equation 2 is the average number of car occupants (including drivers) taken from the ABS.
The tram commuters in Equation 2 are calculated from weekly tram boarding, which is obtained from tram operator. The bus commuters, walkers and cyclists are ignored at this stage due to lack of data.
Vehicle operating cost
Vehicle operating cost is consequence cost of additional travel length and time due to detour time of a bridge closure. The Vehicle operating cost is a function of number of vehicles and their travel length.
Vehicle_operating_cost = Vehicle_operating_cost_rate x AADT x detour length
Vehicle_operating_cost_rate is taken from ABS. AADT is separated between trucks and light vehicles.
Accident cost
Accident cost is consequence cost of accident due to additional travel length and time in the event of a bridge closure. The Accident cost is a function of number of vehicles and their travel length.
- Accident cost = Accident_rate x AADT x detour length

ENHANCING RESILIENCE OF CRITICAL ROAD STRCUTURES – FINAL PROJECT REPORT | REPORT NO. 671.2021
52
Accident_rate is taken from ABS.
Local Air Pollution cost
Local air pollution cost is consequence cost of air pollution due to additional travel length and time in the event of a bridge closure. The Local air pollution cost is a function of number of vehicles and their travel length.
Local air pollution cost = Local_air_pollution_cost_rate x AADT x detour length
Local_air_pollution_cost_rate is taken from oversea study.
Greenhouse gas emission cost
Greenhouse gas emission cost is consequence cost of Greenhouse gas emission due to additional travel length and time in the event of a bridge closure. The Greenhouse gas emission cost is a function of number of vehicles and their travel length.
Accident cost = Greenhouse_gas_emission_cost_rate x AADT x detour length
Greenhouse_gas_emission_cost_rate is taken from ABS.
Road surface wear cost
Road surface damage cost is consequence cost of additional travel length on road surface due to detour time of a bridge closure. The road surface damage is a function of number of vehicles and their weights and surrounding factors such as temperature, rainfall.
It is assumed that, only number of vehicles and their weights contribute to road surface damage during bridge closure.
RoadSurfaceDamageCost = Damage rate x AADT x detour length
Damage_Rate is taken from overseas studies due to lack of data in Australia. Damage rate is distinguished between light and truck vehicles such as 0.0011 AUD to 0.035$/vehicle.km AUD for lorry and truck respectively [20].
AADT is separated between trucks and light vehicles.
Freight delay cost
Freight cost is the consequence cost of freight delay to freight sender and receiver due to additional travel time in the event of a bridge closure. At this stage, the freight cost is considered as a function of number of vehicles and their travel time because Freight_cost_rate can be taken from ABS.
FreightCost = Freight_cost_rate x AADT_truck x detour time
Future work will focus on identification of critical freight route with corresponding bridge and the impact of freight type on freight delay cost.

ENHANCING RESILIENCE OF CRITICAL ROAD STRCUTURES – FINAL PROJECT REPORT | REPORT NO. 671.2021
53
Police delay cost
Police cost is consequence cost of delay of police response time due to detour time and detour length of a bridge closure, which can be estimated using the expected value of probability theory as:
PoliceDelayCost = Prob_Delay_Police x Rescue_value Prob_Delay_Police =(Prob_Police_trip) x (Prob_life_threatening) x
(1+Delay_Time/30) x (1+1/distance)
Prob_Delay_Police is a function of probability of a police trip over a bridge and is a function of prob_life_threatening, Delay_Time and Distance_Bridge_PoliceStation
Prob_police_trip is probability of at least one police trip over a bridge over 1 day. At this stage, it is taken as average of number of police trips (YYY from Annual report of Victoria Poice) over the bridge network (5000 bridges). This assumption can be validated using bridge camera.
Distance reflect the shortest distance between a bridge and a police station and is used as the modification factors for the average police bridge trip because the closer bridge to the police station, the more police trips.
prob_ life_threatening is probability of a life_threatening rescue trip by police such as assault, hostage and kidnap. At this stage, it is assumed 0.2 of a rescue trip, meaning out of 10 rescue calls, 2 are life-threatening.
Delay_time is additional time or detour time taken due to a bridge closure and is used as a modification factor for Prob_Delay_Police.
Human value is taken as 1 million as per ABS.
Fire fighting delay cost
Firefighting delay cost is consequence cost of delay of fire fighting truck due to detour time of a bridge closure, which can be estimated using the expected value of probability theory as:
FireFightingCost = Prob_Delay_FireTruck x Rescue_value Prob_Delay_FireTruck =(Prob_FireTruck_trip) x (Prob_life_threatening) x
(1+Delay_Time/30) x (1+1/distance)
Prob_Delay_FireTruck is a function of probability of a fire truck trip over a bridge and is a function of prob_life_threatening, Delay_Time and Distance_Bridge_Firestation
Prob_firetruck_trip is probability of at least one fire truck trip over a bridge over 1 day. At this stage, it is taken as average of number of firetruck rescue trips (11500 from MFB) over metro bridge network (1800 bridges). This assumption can be validated using bridge camera.
Distance reflect the shortest distance between a bridge and a fire station and is used as the modification factors for the average firetruck bridge trip because the closer bridge to the fire station, the more Fire Truck trips.

ENHANCING RESILIENCE OF CRITICAL ROAD STRCUTURES – FINAL PROJECT REPORT | REPORT NO. 671.2021
54
prob_ life_threatening is probability of a life_threatening rescue trip by firetruck such as traffic and site accident (victim to be removed from car wreckage and site hazard) before the ambulance can transport victims to hospital. At this stage, it is assumed 0.2 of a rescue trip, meaning out of 10 rescue calls, 2 are life-threatening.
Delay_time is additional time or detour time taken due to a bridge closure and is used as a modification factor for prob_delay.
Rescue_value can be Human value, which is taken as 1 million as per ABS and house value, which is taken as $300K.
Ambulance delay cost
Ambulance delay cost is consequence cost of delay of patience transport to hospital due to detour time of a bridge closure. The ambulance delay cost can be estimated using the expected value of probability theory as:
AmbulanceDelayCost = Prob_Delay_serious_illness x Human_Value
Prob_Delay_serious_illness = (Prob_ambulance_trip) x (Prob_serious_illness) x (1+Delay_Time/30) x (1+1/distance)
Human value is taken as $1 million as per ABS.
Prob_Delay_serious_illness is the probability of transport delay of serious illness such as stabbing, bleeding, heart attack, breathing problems, stroke that can lead to death and therefore need to transport within 15-30 min to hospital. The critical time of 30-minute is chosen based on a recent news report [21] and hospital delay study [22].
Prob_ambulance_trip is probability of at least one ambulance trip over a bridge over 1 day. At this stage, it is taken as average of number of first-respond ambulance trips (210,000 per year from Annual Report of Ambulance Victoria) over bridge network (5000 bridges). This assumption can be validated using bridge camera.
prob_serious_illness is probability of a serious illness in an ambulance trip. At this stage, it is assumed 0.2-0.5 of an ambulance trip, meaning out of 10 illness by ambulance trip, 2-5 are serious illness.
Distance reflect the shortest distance between a bridge and a hospital and is used as the modification factors for the average ambulance bridge trip because the closer bridge to the hospital, the more ambulance trips.
Delay_time is additional time or detour time taken due to a bridge closure and is used as a modification factor for Prob_Delay_serious_illness .
Model validation
Model validation is conducted as follows:
a/ Methodology verification (on the completion)

ENHANCING RESILIENCE OF CRITICAL ROAD STRCUTURES – FINAL PROJECT REPORT | REPORT NO. 671.2021
55
Internal review (Asset management team, CBA team, Regional team)
External Expert workshop (Industry, Academics)
Journal publication
Literature review
b/ Indirect validation (after completion and adoption)
Corporate Annual report performance
Model sensitivity analysis
Model sensitivity analysis studies the effect of influential factors on the model outcome. Two approaches of model sensitivity analysis are conducted as follows:
a/ Local Sensitivity
One at a time (factor value change, factor removing/adding)
b/ Global sensitivity
Variance-based method
BRIDGE PRIORITISATION FOR SEISMIC IMPACT
Prioritisation of bridges considering earthquake impacts
The transportation systems highly depend on the performance of bridges in the network and failure of a single bridge could lead to catastrophic impacts to the economy of the region. This study aims to identify and prioritise bridges in Victoria under earthquake impacts. Multi decision criteria method was used in ranking the bridges located in Victoria using an inventory of approximately 3500 bridges. The final ranking results will show the most vulnerable bridges and the distribution among the common bridge types.
Multi criteria decision making (MCDM)
In developing the proposed method to prioritize the bridges, three main categories such as seismic hazard, structural vulnerability and impact which directly or indirectly affect the prioritisation were considered in multi criteria decision making process.
Seismic hazard is considered as the seismic hazard level that the bridge is located in. Development of hazard map is a good method to quantify the seismic level in a location. Generally, the probabilistic earthquake hazard map shows the ground shaking which has a specific probability of exceedance during a given period. In Australia, the earthquake hazard map provides the earthquake hazard with a 1 in 500 years annual probability of exceedance depending on the historical seismicity and understanding of geological conditions.

ENHANCING RESILIENCE OF CRITICAL ROAD STRCUTURES – FINAL PROJECT REPORT | REPORT NO. 671.2021
56
Structural vulnerability is an important factor in evaluating the seismic behaviour of bridges under a given ground motion. One of the most important factors influencing the structural capacity of bridges is the age as bridges experience progressive deterioration over years. Besides, there are many existing bridges in Australia that are constructed before the first seismic code was introduced, which makes it harder to predict the behaviours of old bridges.
The impact represents the consequences associated with the failure of bridges. Direct impact mainly refers to the cost of repair due to post earthquake events. Geometric configuration of bridges shows significant impact in damaging or collapsing due to earthquakes, thus the bridge over all width and the length provides an approximate indication of cost associates with bridge repairs. Considering these two parameters, the local ratings were assigned to understand the repair costs to bridges. Emergency response to a bridge failure should also be considered as a factor of the impact, which means the closer it is relative to the city area the higher potential influence it will cause.
Indirect impact is reflected in its influence on the road network system, the higher traffic volume of the bridge route is the higher its impact on the function of other roads and bridges is. Similarly, the road type is considered as a parameter and freeways are given higher rating compared to main roads.
Analytical hierarchy process (AHP)
Analytical Hierarchy process developed by is a method which corporate qualitative and quantitative criteria and this method is being considered as a practical method for multicriteria decision making. It can decompose a complicated problem into its component parts and then find out the interrelationships in each hierarchy through simple pairwise comparison.
To determine the weights and relative importance between each criterion proposed in section 2.1, averaged normalised method is considered as the most accurate method for calculation of eigen vector (𝑤𝑤𝑖𝑖) of the decision matrix. The equation is shown as below:
𝒘𝒘𝒊𝒊 = 𝟏𝟏𝒏𝒏∑ 𝒂𝒂𝒊𝒊𝒊𝒊
𝒂𝒂𝒌𝒌𝒏𝒏𝒊𝒊=𝟏𝟏
where 𝑤𝑤𝑖𝑖 is the eigen vector with the relative weight of the attribute in row 𝐹𝐹 for a reciprocal 𝑛𝑛 × 𝑛𝑛 matrix and 𝐹𝐹𝑖𝑖𝑖𝑖 is the element location in row 𝐹𝐹 and column 𝑗𝑗 of the decision matrix.
The pairwise comparison scale is provided in Table 5, in which the quantitative evaluation varies from 1 to 9 with increasing relative importance. As the scores derived in this process are subjective and can cause inconsistencies in the final matrix, the next step in AHP is to measure the consistency of the approach. Consistency index (C.I.) is calculated as follows:
𝐶𝐶. 𝐼𝐼. = (𝜆𝜆𝑚𝑚𝑚𝑚𝑚𝑚 − 𝑁𝑁)/(𝑁𝑁 − 1)
where 𝜆𝜆𝑚𝑚𝑚𝑚𝑚𝑚 is the maximum eigen vector of the 𝑁𝑁 × 𝑁𝑁 comparison matrix, which will become a 6 × 6 matrix in this study.

ENHANCING RESILIENCE OF CRITICAL ROAD STRCUTURES – FINAL PROJECT REPORT | REPORT NO. 671.2021
57
Following that the consistency ratio (𝐶𝐶.𝑅𝑅.) is defined as ratio between consistency index and the consistency index of a random-like matrix (called random index or 𝑅𝑅. 𝐼𝐼. ). A random matrix is a matrix where judgements have been entered randomly. It indicates whether the decision maker is consistent in deciding the entries by measuring the degree of inconsistency. It is suggested that consistency ratio of 0.1 or less is acceptable to continue the AHP.
Table 5. Pairwise comparison scale
Verbal Judgement Numeric
value
Extremely important 9
8
Very strongly important 7
6
Strongly more important 5
4
Moderately more important
3
2
Equally important 1
Technique for Order Preference by Similarity to an Ideal Solution (TOPSIS)
After determining the weightings of all criterions, TOPSIS method is introduced to process the final ranking using the Euclidean distances that are shortest from positive-ideal solutions and farthest from negative-ideal solutions. It calculates the relative closeness to the positive-ideal solution with lowest vulnerability as the ranking index. The basic procedure of TOPSIS is explained below:
• Original marking matrix should be normalized as follows.
𝐹𝐹𝑖𝑖𝑖𝑖 = 𝑥𝑥𝑖𝑖𝑖𝑖/�∑ 𝑥𝑥𝑖𝑖𝑖𝑖2𝑚𝑚𝑖𝑖=1
where 𝐹𝐹 and 𝑗𝑗 are the index for bridges and criterions respectively. • Calculate weighted normalized matrix 𝑣𝑣𝑖𝑖𝑖𝑖 by multiplying it with the
weightings derived in previous section. • Determine the separation measures from the positive-ideal and negative-
ideal solutions respectively by the equations below:
𝐿𝐿𝑖𝑖∗ = �∑ �𝑣𝑣𝑖𝑖𝑖𝑖 − 𝑣𝑣𝑖𝑖∗�2𝑛𝑛
𝑖𝑖=1
𝐿𝐿𝑖𝑖− = �∑ �𝑣𝑣𝑖𝑖𝑖𝑖 − 𝑣𝑣𝑖𝑖−�2𝑛𝑛
𝑖𝑖=1
where 𝐿𝐿𝑖𝑖∗ and 𝐿𝐿𝑖𝑖− are the distance to the best and worst solutions respectively; 𝑣𝑣𝑖𝑖∗ and 𝑣𝑣𝑖𝑖− are the best and worst values for the 𝑗𝑗𝑡𝑡ℎ criterion for all bridges, and these will be equivalent to the minimum and maximum weighted normalized values in each criterion.

ENHANCING RESILIENCE OF CRITICAL ROAD STRCUTURES – FINAL PROJECT REPORT | REPORT NO. 671.2021
58
• Calculate the similarity index (𝐶𝐶𝑖𝑖∗) and rank the prioritization order based on this value, of which the lower value means closer distance to the worst case and thus higher vulnerability to earthquakes. 𝐶𝐶𝑖𝑖∗ = 𝑆𝑆𝑖𝑖
−
𝑆𝑆𝑖𝑖∗+𝑆𝑆𝑖𝑖
−
Analysis results
The bridge inventory for Victoria in VicRoads data base was used to test the proposed methodology developed on a real complex network. All the bridges in Victoria was considered for this cases study and the areas included in the study comprised of central business, residential and rural areas in Victoria. The bridge data inventory comprised of 3531 bridges and general information such as structural system, construction year, traffic volume etc. on each bridge.
The weightings of all six criterions are calculated as shown in Table 6, in which seismic hazard is allocated for the largest proportion of 0.32 and this conforms to the description above about the importance of seismic hazard. The repair cost weighs 0.10 and this will be evaluated equally by its overall length and width with 0.05 weighting each.
Table 6. Weights for each selected criterion
Seismic hazard
Age of bridge
Repair cost
Traffic volume
Road type
Emergency response
0.32 0.22 0.1 0.11 0.09 0.16
After applying the proposed method to all Victorian bridges, the top 20 critical bridges are marked in the map of Victoria. It can be observed from Figure 18 that all 20 bridges locate in the largest PGA area and are close to each other. Further research about the common points of these bridges could be developed.
Figure 18: Location of 20 most critical bridges in Victoria

ENHANCING RESILIENCE OF CRITICAL ROAD STRCUTURES – FINAL PROJECT REPORT | REPORT NO. 671.2021
59
SOCIAL AND ENVIRONMENTAL IMPACT DUE TO A BRIDGE FAILURE METHODOLOGY
The methodology adopted for this research used participatory design principles, where stakeholder feedback was incorporated throughout the development stage. This method helped to identify critical factors that needed to be included both from a theoretical as well as practical aspects of the tool. Continuous engagement with stakeholders and domain experts resulted in an iterative development process for the tool, which was the preferred method over a deductive, prescribed version. A total of 27 participants (Table 7) were interviewed starting at the needs assessment stage right down to the utilisation stage of the tool.
Table 7. List of participants
Participant Organisational Sector Work Division / Area of expertise
P1 Local Government Infrastructure Services P2 Local Government Disaster Management P3 Local Government Economic Development P4 Local Government Environment Management P5 Local Government Environment Management P6 Local Government Community Development P7 Local Government Community Development P8 State Government Reconstruction Operations P9 State Government Transport operations P10 State Government Transport operations P11 State Government Transport Asset Services P12 Local Government Infrastructure Projects P13 Local Government Infrastructure Projects P14 Local Government Construction (New Works) P15 Local Government Asset Management P16 Local Government Asset Services P17 Local Government Asset Management P18 Local Government Asset Management P19 State Government Transport Operations P20 Local Government Infrastructure Services P21 State Government Disaster Resilience P22 Research Institution Infrastructure resilience P23 Research Institution Disaster resilience P24 Research Institution Transport engineering P25 Research Institution Infrastructure Engineering P26 Research Institution Infrastructure resilience P27 Research Institution Life Cycle Assessment

ENHANCING RESILIENCE OF CRITICAL ROAD STRCUTURES – FINAL PROJECT REPORT | REPORT NO. 671.2021
60
The first step was to conduct in-depth interviews with practitioners involved in post-disaster reconstruction of road infrastructure in disaster-prone regions in Australia. These interviews highlighted that decision making and prioritisation takes place in an ad-hoc manner with little consideration to wider socio-economic and environmental factors. It was found that the absence of techniques that can incorporate local nuances and the difficulty of adapting them to different regions was a major reason why practitioners relied on tacit knowledge and personal experience more than models and tools developed by researchers. It was also found that compatibility with current practices and ease-of-use were important characteristics that would increase a model’s adoption by practitioners.
The modelling principles for the tool were selected based on several factors like scope of analysis, sophistication of the tool and expected outputs, which were identified through the interviews. Table 8 shows the expected outcomes of the framework and the most relevant principles within different modelling approaches were selected.
Table 8. Principles adopted for framework
Expected outcomes
Modelling principles / approaches References
Scalability Microeconomic (bottom-up) modelling [2]
Incorporating behavioural change
Agent-based techniques [2]
Allows for aggregation
Use of complementary methods [2]
Flexibility Ability to select required impact categories [2]
Ability to be used in Cost Benefit Analysis
Monetary weighting [2]
Based on the modelling principles identified the most appropriate method to measure a comprehensive list of potential impacts were selected. These impacts covered a wide range of financial, economic, social and environmental impacts that could occur during the reconstruction process. The identification of these impacts and the selection of the suitable measurement methods were based on a state-of-the-art review and were supported through in-depth interviews with practitioners and experts in the field. The selection of the measurement methods relied heavily on the available data to practitioners given the expedited and resource constraint nature of post-disaster reconstruction.
The outline of the framework (Figure 19) illustrates how the different impacts are measured, quantified and amalgamated to a common reporting metric. The amalgamation of the different impact categories helped in the practical use of

ENHANCING RESILIENCE OF CRITICAL ROAD STRCUTURES – FINAL PROJECT REPORT | REPORT NO. 671.2021
61
the framework in decision making. This was one aspect that was highlighted in the end-user interviews. In addition, the results obtained needed to be easily understood and allowed for use in conjunction with the financial analysis techniques used in practice. To achieve these outcomes, a monetary weighting of the different impacts was carried out.
Figure 19: Outline of the framework
Monetary valuation was used to weight and aggregate the different impact categories. As monetary valuation is extensively used in evaluation of new infrastructure projects the uptake of a tool with a similar method was seen to be higher among infrastructure and governmental authorities. The monetary valuation of these impacts provides an opportunity for decision makers to incorporate this tool as a complementary method to current funding and prioritisation techniques being used.
Based on the interview data, the usability of MCDA in expedited post-disaster reconstruction has been found to be limited. The use of monetary values within the tool was found to be beneficial as it allowed for specific weightings to be allocated without the need for expert opinions being sought at the post disaster recovery decision-making stage. This allows for the tool to be used in diverse areas, where the weightings could be customised by using more relevant monetary values to the region under analysis, which increases the wide-spread use of the tool. Interview data suggests monetary valuations to be most commonly used in resource allocation decision making.
DATA REQUIREMENTS
The data requirements for the tool were obtained by conducting an analysis of the literature that had used the specific methods for prior assessment. Table 9
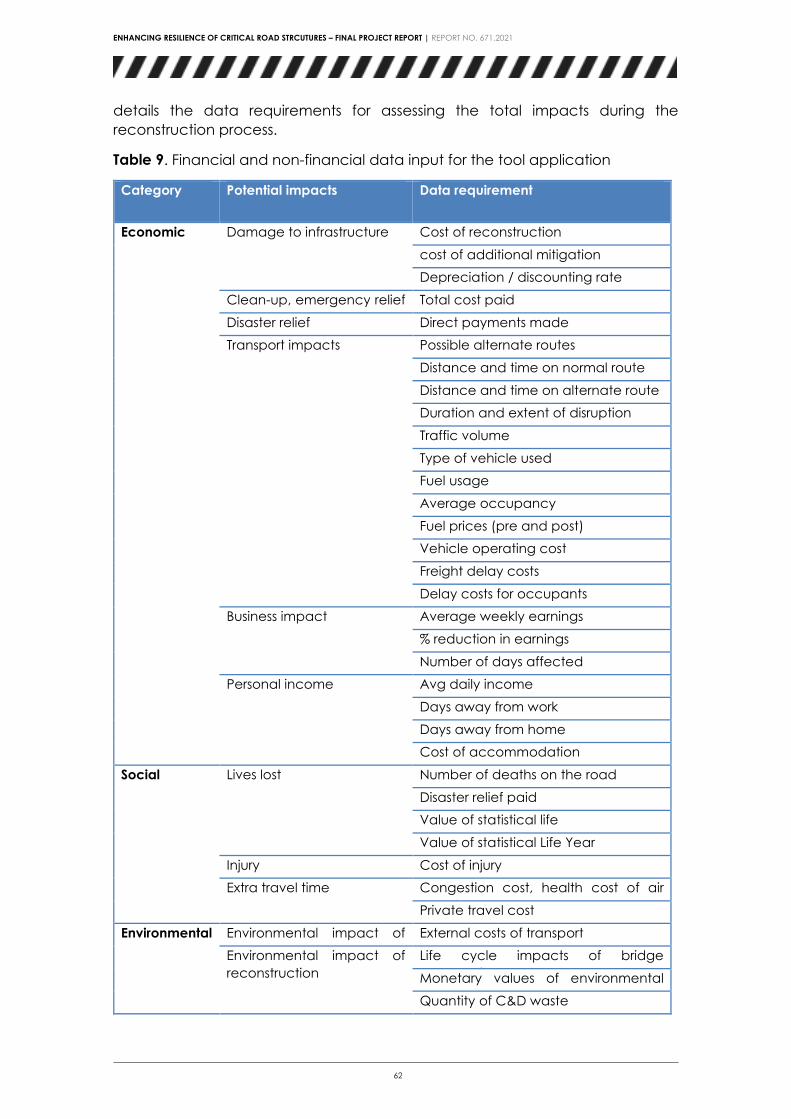
ENHANCING RESILIENCE OF CRITICAL ROAD STRCUTURES – FINAL PROJECT REPORT | REPORT NO. 671.2021
62
details the data requirements for assessing the total impacts during the reconstruction process.
Table 9. Financial and non-financial data input for the tool application
Category Potential impacts Data requirement
Economic Damage to infrastructure Cost of reconstruction
cost of additional mitigation Depreciation / discounting rate
Clean-up, emergency relief t
Total cost paid
Disaster relief Direct payments made Transport impacts Possible alternate routes
Distance and time on normal route
Distance and time on alternate route Duration and extent of disruption
Traffic volume
Type of vehicle used Fuel usage
Average occupancy
Fuel prices (pre and post) Vehicle operating cost
Freight delay costs
Delay costs for occupants Business impact Average weekly earnings
% reduction in earnings
Number of days affected Personal income Avg daily income
Days away from work
Days away from home Cost of accommodation
Social Lives lost Number of deaths on the road
Disaster relief paid Value of statistical life
Value of statistical Life Year
Injury Cost of injury Extra travel time Congestion cost, health cost of air
ll ti Private travel cost
Environmental Environmental impact of d t
External costs of transport Environmental impact of reconstruction
Life cycle impacts of bridge t ti Monetary values of environmental
i t Quantity of C&D waste

ENHANCING RESILIENCE OF CRITICAL ROAD STRCUTURES – FINAL PROJECT REPORT | REPORT NO. 671.2021
63
Data collection was carried out in two distinct stages. Site-specific data related to the two case study areas was collected by contacting staff of the relevant local council, reconstruction agencies and the Department of Transport and Main Roads. Information obtained from these organisations was mainly sourced from their documented historical records, while interviews were used to obtain more generic information about the activities and the surroundings of the case study areas. Most of the statistical data was obtained from publicly available data sources through a desktop search. Sources included data sets, government reports, publicly accessible data bases and academic publications.
The data collection process resulted in the development of a comprehensive data base of external costs related to sustainability impacts of road infrastructure. This data base was included as an add-on to the tool, where these values could be used in instances where more specific and up to date data are not easily available. This was considered a vital resource for practitioners during the validation interviews as they recognised that collecting similar social and environmental external costs will be hampered in a time constrained post-disaster period.
TOOLKIT VALIDATION - CASE STUDY
The relevance of the developed framework and the practical use of it were tested through a real-life application in a disaster impacted region. The area selected for the case study was the Lockyer Valley region in South East Queensland, Australia. As most of the previous work measuring wider impacts of damage to road infrastructure has concentrated on urban areas, this research project focussed on a regional area. Impacts were presumed to differ between urban and regional areas as there is generally a lack of alternative routes in regional areas and reconstruction may take longer in regional areas as opposed to more urban settings. Impacts in regional areas will also be spatially narrow, thus making it easier to measure.
Two bridges that were damaged during the 2013 floods were selected to conduct the case study. These bridges were selected after consultation with council staff based on the importance of the locations and the availability of data specific to those structures. Both bridges were completely damaged during the 2013 floods and were reconstructed.
VALIDATION INTERVIEWS
A final round of interviews with both practitioners and academic experts were conducted to validate the results obtained through the application of the tool in the case studies. Feedback from practitioners was obtained on the relevance of the tool for practical decision making. Views on whether the tool captured all the critical impacts and its compatibility with other decision making techniques being used were collected
A majority of the interviewees agreed that monetising the impacts was beneficial as it resulted in less subjectivity in the process. The monetary valuation of social impacts was seen as a first step towards incorporating social impacts in the regular decision-making processes. The interviewees agreed that the framework

ENHANCING RESILIENCE OF CRITICAL ROAD STRCUTURES – FINAL PROJECT REPORT | REPORT NO. 671.2021
64
would aid in the post-disaster reconstruction phase in justifying and validating decisions and for prioritisation of reconstruction increasing transparency in decisions made, especially in cases where there could be community backlash. Further, some participants believed this framework will be critical for use by smaller-scale local government authorities who have less resources to fall back on in a time of a disaster.
The scalability of the tool was identified to be a vital benefit in its use in disaster recovery, as the availability of data and the level of detail required would vary in different locations and for different organisations. The toolkit was identified as portraying an accurate representation of real-life impacts. The database that was developed for the toolkit was considered an important outcome as it had a compilation of relevant data points from varied sources and data sets. Practitioners mentioned that given the lack of primary data and the challenge in obtaining reliable data in a time constrained post-disaster environment, the data base was seen to be of immense benefit for decision makers.
RESULTS AND RECOMMENDATIONS
The following major recommendations were made based on the findings of the thesis:
Decision makers should prioritise reconstruction based on a comprehensive SEE impact assessment as making decisions based purely on financial and technical aspects may lead to less than optimal decisions being made.
Assessing alternative methods of reconstruction of bridges against the estimated times for construction can lead to methods that lead to less social impacts to communities without simply relying on strengthening of structures.
Keeping road networks open, even partially, during reconstruction will reduce the socio-economic impacts to communities drastically.
Decision makers need to consider how alternative methods of reconstruction affect the natural environment surrounding the structures and how that in turn can exacerbate or mitigate the occurrence of disasters in the future.
Results showed that the total sustainability related impacts vary based on where the bridge is located, and impacts could range between 25-30% of the total impacts.
Cross functional teams in the initial decision making process can lead to more holistic view being taken and can lead to diverse options that will have less SEE impacts.

ENHANCING RESILIENCE OF CRITICAL ROAD STRCUTURES – FINAL PROJECT REPORT | REPORT NO. 671.2021
65
DEVELOPMENT OF A BRIDGE RATING METHOD – SEISMIC EXAMPLE Given the prioritization ranking of all bridges in Victoria, it will be possible to find out the most vulnerable types among the common bridge types in Victoria. Combining other criterions, an equation could be set up to provide a quick estimation of the damage probability of a specific bridge. As it may take times to develop fragility curves for each bridge, this quick method could save time and effort in predicting the bridge performance under earthquake and determine which project should be addressed in emergency condition.
BRIDGE DAMAGE PROBABILITY EQUATION
As discussed in the first section, one of the widely used ways to assess the bridge vulnerability to earthquake is fragility curve development. The evaluation targets of fragility curve vary from an individual structure or a type of structure to a specific system, such as a transportation system. It produces a set of seismic fragility curves, indicating the seismic performance of the assesses targets. Apart from predicting the earthquake performance, some retrofit measures are required to improve the reliability of already built bridges, which are constructed early before the updated design code and cannot be totally reconstructed due to heritage protection, traffic network complexity or other reasons.
However, there are also many limitations on this method. It highly demands on time and computational resource to process the bridge model and the analysis accuracy also depends on the number of earthquake records. Besides, the modelling results may also deviate as bridge condition changes with age. A simple but reliable method for quick estimation of the damage probability of a bridge based on the widely available information like its location, age and structure type is proposed in this study as a preliminary step in bridge repair or renovation management.
The key factors considered in this probability equation are seismic hazard (𝐹𝐹𝑠𝑠), bridge type (𝐹𝐹𝑡𝑡), span length (𝐹𝐹𝑙𝑙) and age of bridge (𝐹𝐹𝑚𝑚). Seismic hazard (𝐹𝐹𝑠𝑠) measures the seismic hazard level the bridge is located in, which is one of the most important factors that indicates the vulnerability of bridges. The higher vulnerable area it is in, the higher probability of damage it would experience during earthquake. Bridge type (𝐹𝐹𝑡𝑡) is measured by vulnerability ranking of the six most common bridge types. The mark is provided by comparing the percentage variation of these bridge types in the top 1200 vulnerable bridges after ranking them by prioritization of earthquake impacts, the higher variation means the higher fragile this type is with respect to seismicity. Span length (𝐹𝐹𝑙𝑙) is the average span length calculated by dividing the total bridge length by the number of its span and the results show that the vast majority span length is less than 50 metre. Age of bridge (𝐹𝐹𝑚𝑚) is also a considerable factor that will influence the damage probability of bridge under earthquake for aged bridges may trigger more severe damage under similar earthquake level.

ENHANCING RESILIENCE OF CRITICAL ROAD STRCUTURES – FINAL PROJECT REPORT | REPORT NO. 671.2021
66
Parameter allocation
To determine the parameters allocated to these four different factors, analytical hierarchy process (AHP) is utilised to quantify the criterions by pairwise comparison. Following the comparison scale in Table 5, the normalised matrix of these four factors and final weightings are expressed in Table 10 and Table 11:
Table 10. Normalized Matrix of AHP
Seismic Hazard
Bridge Type Span length Age of bridge
Seismic Hazard 1 3 2 3
Bridge Type 0.33 1 0.5 2
Span length 0.5 2 1 2
Age of bridge 0.33 0.5 0.5 1
Sum 2.167 6.500 4.000 8.000
Table 11. Weights for each criterion of probability equation
Seismic Hazard Bridge Type Span length Age of bridge
0.45 0.17 0.26 0.12
It is observed that seismic hazard is assigned for the highest weighting as it is one of the main inputs in developing fragility curves. Based on these weightings, the equation can be expressed as below for estimating the damage probability (𝑃𝑃) of a specific bridge under earthquake:
𝑃𝑃 = 0.45𝐹𝐹𝑠𝑠 + 0.17𝐹𝐹𝑡𝑡 + 0.26𝐹𝐹𝑙𝑙 + 0.12𝐹𝐹𝑚𝑚
where 𝐹𝐹𝑠𝑠 is seismic hazard, 𝐹𝐹𝑡𝑡 is bridge type, 𝐹𝐹𝑙𝑙 is span length and 𝐹𝐹𝑚𝑚 is age of bridge.
Marking criteria
As Equation 8 is expected to provide a probability value, the marks for all factors should be distributed in the scale of 0-1 to ensure the final probability value is reasonable. For seismic hazard (𝐹𝐹𝑠𝑠), span length (𝐹𝐹𝑙𝑙) and age of bridge (𝐹𝐹𝑚𝑚), the marking criteria is set up based on the variation range of the bridge database in Victoria to rank its relative vulnerability between each other and the values are listed in the Table 12.

ENHANCING RESILIENCE OF CRITICAL ROAD STRCUTURES – FINAL PROJECT REPORT | REPORT NO. 671.2021
67
Table 12. Marking criteria for 𝐹𝐹𝑠𝑠, 𝐹𝐹𝑙𝑙, and 𝐹𝐹𝑚𝑚
Seismic Hazard Mark
zone 1 (0-0.015) 0
zone 2 (0.015-0.03) 0.2
zone 3 (0.03-0.05) 0.4
zone 4 (0.05-0.06) 0.6
zone 5 (0.06-0.08) 0.8
zone 6 (>0.08) 1
Span length Mark
0-10 0
10-20 0.2
20-30 0.4
30-40 0.6
40-50 0.8
>50 1
Age of bridge Mark
More than 60 1
46-60 0.8
35-46 0.64
25-35 0.48
11-25 0.32
1-10 0.16
Less than 1 0
To allocate marks for different bridge types, it is necessary to find out the most common bridge types in Victoria. The bridge data inventory comprised of 3531 bridges and general information such as structural system, construction year, traffic volume etc. on each bridge. The distribution of each structural configuration is shown in Figure 20. The top 6 bridge types are SI (I-beam), AS (super tee), SE (precast flat slab-no overlay), SO (U-slab overlay), SN (U-slab- no overlay), SB (box girder) respectively.

ENHANCING RESILIENCE OF CRITICAL ROAD STRCUTURES – FINAL PROJECT REPORT | REPORT NO. 671.2021
68
Figure 20: Bar chart of structure configuration in Victoria database
After prioritizing the bridges based on seismic impact, the number of these 6 types changed in the top 1200 prioritized bridges because of the different performance under earthquake. Comparing the ratio variation of these bridges, the vulnerability can be then ranked and the highest increasing in proportion after prioritization means its highest possibility of damage during earthquake. The pie charts of the proportion variation of the six bridge types are shown in Figure 21. Among them box girder bridge increased from 11.9% to 17.6% with 17.6−11.9
1.9=
0.47 increasing rate, thus it is concluded that box girder bridge is the most vulnerable bridge type in Victoria. This could result from the long span characterisation of box girder bridge comparing with other 5 types. Similarly, the variation ratio of other 5 types are calculated, and the marking criteria is allocated based on this ranking as listed in Table 13.
Figure 21: Pie charts of the proportion of top 6 common bridges in whole bridge inventory (left) and in top 1200 bridges after prioritization (right)
0
100
200
300
400
500

ENHANCING RESILIENCE OF CRITICAL ROAD STRCUTURES – FINAL PROJECT REPORT | REPORT NO. 671.2021
69
Table 13. Marking criteria for bridge type 𝐹𝐹𝑡𝑡
Bridge Type Mark SI 0.8 AS 0.6 SE 0.4 SO 0.2 SN 0 SB 1
Case study
Tenthill creek bridge is selected as the case study bridge. This case study aims at determining the damage probability and then compare this value with the damage probability generated by its fragility curves developed in previous section.
Tenthill creek bridge is a 3-span RC bridge built in 1976 to carry a state highway in Gatton, Queensland. It is supported by a total of 12 pre-stressed 27.38m long I-beams over three spans of 27.38m. As this bridge is located in Queensland rather than Victoria, its seismic hazard level is directly read from Australia hazard map as 0.0075g.
Based on the information above, it is easy to find out the marks of each factor for this bridge:
Table 14. Markings for Tenthill creek bridge
Factor Weighting Mark
Seismic hazard 𝐹𝐹𝑠𝑠 0.45 0
Bridge type 𝐹𝐹𝑡𝑡 0.17 0.8
Span length 𝐹𝐹𝑙𝑙 0.26 0.4
Age of bridge 𝐹𝐹𝑚𝑚 0.12 0.64
Damage probability 𝑃𝑃 0.317
The damage probability of this bridge is calculated as 0.317. The common seismic level in Australia is 0.08g, given which the highest damage probability (slight damage) of the fragility curve is 0.431.
The discrepancy between the modelling results and prediction equation mainly result from the marking criteria, which is set up according to the seismic hazard range in Victoria. It can be observed from the hazard map of Australia that the values in Queensland is lower than Victoria and the criteria should be edit for local application.

ENHANCING RESILIENCE OF CRITICAL ROAD STRCUTURES – FINAL PROJECT REPORT | REPORT NO. 671.2021
70
PROTOTYPE SOFTWARE TOOL FOR VULNERABILITY MODELLING OF BRIDGES CENTRAL ASSET MANAGEMENT SYSTEM CAMS FOR BRIDGES
CAMS for bridges is an asset management platform developed for bridge structures of Victoria in partnership VicRoads (Department of Transport Victoria (DoT)). The platform (Figure 22) is hosted in cloud service offered by Amazon web services. The system has the capability to capture bridge structures at detailed component level for asset management and strengthening. Deterioration models for 75 components of bridges are derived using historical inspection data collected by VicRoads over a 10 year period. Predictive modeling of degradation of components is depicted using the stochastic Markov chain process.
Whilst the platform was developed with the support of an ARC grant on “Deterioration modelling of bridge structures”, enhancement of the platform for damage estimation and resilience under natural hazards was undertaken through the BNH CRC funded project.
Figure 22: CAMS platform for bridges
VULNERABILITY OF BRIDGES UNDER NATURAL HAZARDS
Based on the outcomes of the comprehensive research program, CAMS vulnerability platform was developed to present the bridge vulnerability under flood, bush fire and earthquakes and prioritization. Figure 23 below presents the user interface of the software tool. It can be used in identifying the most vulnerable bridges so that informed decisions can be made on pre-disaster planning.

ENHANCING RESILIENCE OF CRITICAL ROAD STRCUTURES – FINAL PROJECT REPORT | REPORT NO. 671.2021
71
Figure 23: Bridge details
Software tool is capable of identifying whether a selected bridge is located in a bushfire prone area or not as shown in Figure 25.
Figure 24: GIS map of bush fire prone bridges
On the other hand, bridge ranking system was developed based on the impact on the community if a bridge failure happens due to an earthquake (Figure 26).
Figure 25: Earthquake prone bridges prioritized considering impact on the community

ENHANCING RESILIENCE OF CRITICAL ROAD STRCUTURES – FINAL PROJECT REPORT | REPORT NO. 671.2021
72
Figure 26: Flood prone structures

ENHANCING RESILIENCE OF CRITICAL ROAD STRCUTURES – FINAL PROJECT REPORT | REPORT NO. 671.2021
73
UTILISATION AND IMPACT SUMMARY
Through a number of end-user engagement activities, some specific utilization outcomes have been identified.
STRUCTURAL DESIGN OF FLOODWAYS UNDER EXTREME FLOOD LOADING1
Output Description
We used a three-dimensional finite element method to investigate numerically the different parameters, geometric configurations and loading combinations which leads to floodway vulnerability during extreme flood events. The worst-case loading scenario is then used as the basis for design from which several structural design charts are deduced. These charts enable design bending moments and shear forces to be extracted and the cross-sectional area of steel and concrete to be designed in accordance with the relevant design codes for strength, serviceability and durability.
Extent of Use
• Technical guideline for floodway design to ensure floodway structure have adequate structural resilience, aiding in reduced maintenance and periods of unserviceability
Utilisation Potential
• The developed method can help the end-users, such as VicRoads, to benefit the structural design considering the flood risk.
• A utilization project with IPWEA Queensland has been co-funded by the CRC.
VULNERABILITY MAPS OF BRIDEGES UNDER FLOOD, BUSH FIRE AND EARTHQUAKES
Output Description
Vulnerability assessments conducted as part of the research program have been included in a cloud hosted software platform to display the vulnerability of the bridge structures in Victoria. A total of 5706 structures are included in the vulnerability maps.
The software platform also includes bridge components, their quantities and the current condition of the components as input for decision making.
Further, the bridge prioritization methodology developed through the project has been incorporated in to the platform to identify the structures, failure of which will have a major impact on the community as input for decision making on strengthening.

ENHANCING RESILIENCE OF CRITICAL ROAD STRCUTURES – FINAL PROJECT REPORT | REPORT NO. 671.2021
74
Extent of Use
• Displays the vulnerability of all structures in Victoria for flood, bush fire and earthquakes in a GIS map. These can be used by the regions of VicRoads (DoT) for identifying the vulnerable structures for detailed assessment and strengthening
• Structures are ranked in the order of the value to the community
Utilisation Potential
• The software tool will be used by the road authority in Victoria for enhancing resilience of the structures vulnerable to the natural hazards.
VULNERABILITY ASSESSMENT OF BRIDEGES UNDER EXTREME CYCLONIC EVENTS2
Output Description
This research investigates a method to evaluate the vulnerability of timber and concrete bridges subjected to an extreme cyclone event. It identifies the development of a fault tree for bridge closure. A set of case study bridges that damaged due to Cyclone Marcia in 2015 has been used to develop a basic fault tree method.
Extent of Use
• Quantitative assessment of bridges considering the extreme cyclonic events
Utilisation Potential
• The proposed framework can be used as a guide, and using few other case studies, it can be refined further for its broader use.
RESILIENCE ASSESSMENT OF TIMBER BRIDGES3,4
Output Description
This research uses a number of bridge inspection reports to develop a method to predict the probability of failure of a timber bridge. The inspected condition states of the elements in the timber bridge are used to develop a Markov chain based model and Gamma process model to predict the deterioration of each element.
Extent of Use
• Predict the failure of timber bridges under external hazards
Utilisation Potential
• It could help to quantify the level of resilience that to save efforts and times in saving lives

ENHANCING RESILIENCE OF CRITICAL ROAD STRCUTURES – FINAL PROJECT REPORT | REPORT NO. 671.2021
75
STRUCTURAL ANALYSIS IN FLOODWAY DESIGN PROCESS5
Output Description
This research considered the Lockyer Valley as a case study region to identify the common structural attributes relating to the most vulnerable floodways. It was discovered that the most vulnerable floodways did not have culverts, the slab decks were typically made from concrete and they were of a single lane width.
Extent of Use
• For the external use in the floodway design in enhancing the structural reliability
Utilisation Potential
• It provides a basis for floodway structural design graphs and adjacent soil/rock protection vulnerability analysis
ENHANCING RESILIENCE OF CRITICAL ROAD STRCUTURES – FINAL PROJECT REPORT | REPORT NO. 671.2021
76
CONCLUSIONS The project has developed vulnerability modeling methodologies for bridges under flood, bush fire and earthquakes with case study examples to develop the methodologies. Major conclusions can be summarized as:
• Girder bridge decks will be significantly vulnerable to failure for flood velocities over 4 m/s, if the flood level exceeds the deck soffit height
• Bridge piers will not be significantly vulnerable under flood loading until the flood velocities exceed 7 m/s. However, log impact can cause failure of bridge piers at much lower velocities
• Wave loading on bridge superstructures will only be critical at velocities above 7 m/s.
• Bridges exposed to bush fires will have significant reduction in shear capacity under bush fire loading. Keeping the fuel levels low can control the damage to bridge structures under bush fires.
• Floodway structures are currently designed following a hydraulic capacity based approach. A structural design guideline is needed to ensure resilience under flood and boulder impact.
• Optimised asset management of road structures will enhance the resilience of the structures under natural hazards.
• Social, environmental and economic impacts of failure of road structures, during the post disaster period can be quantified using an integrated model which converts all the impacts to a monetary value.
NEXT STEPS
1. One utilisation project is in progress with IPWEAQ to publish the outcomes as a national guide for structural design of floodways.
2. EU Horizon 2020 funded project is currently in progress to expand the methodologies developed during the project for rail infrastructure

ENHANCING RESILIENCE OF CRITICAL ROAD STRCUTURES – FINAL PROJECT REPORT | REPORT NO. 671.2021
77
PUBLICATIONS LIST PEER-REVIEWED JOURNAL ARTICLES
1. Kafele, B., Zhang, L., Mendis, P., Herath, N., Maizuar, M., Duffield, C., Thompson, R., (2017) Monitoring the dynamic behaviour of the Merlynston creek bridge using interferometric radar sensors and finite element modelling, International Journal of applied mechanics, 9(1):1750003-1-20. (Q1)
2. Maizuar, M., Zhang, Miramini, L., Mendis, P., Thompson, T., (2017) Detecting structural damage to bridge girders using radar interferometry and computational modeling. Structural Control and Health Monitoring, 24(10): 1-6 (Q1)
3. Herath, N., Mendis, P., Zhang, L.H., (2017), A probabilistic study of ground motion simulation for Bangkok soil. Bulletin of Earthquake Engineering 2017; 15(5): 1925-1943 (Q1)
4. Lokuge, Weena, and Wilson, Matthew and Tran, Huu and Setunge, Sujeeva (2017) Predicting the failure of timber bridges by using current inspection reports. Engineering for Public Works (7). pp. 85-89.
5. Qeshta, I. M. I., Hashemi, M. J., Hashemi. M. R., Gravina, R., and Setunge, S. Development of Fragility Functions for Rigid-Frame Bridges Subjected to Tsunami-Induced Hydrodynamic Forces (Journal paper accepted in Structure and Infrastructure Engineering)
6. Lokuge, W., Greene, I., Etemadi, E., Karunasena, W., (2019) Role of structural analysis in floodway design process, Australian Journal of Civil Engineering, vol. 17, no. 2, pp. 110-119. Published 20 August 2019 (Q3)
7. B. Raja, S. Miramini, C. Duffield, M. Sofi, P. Mendis, L. Zhang. The influence of ambient environmental conditions in detecting bridge concrete deck delamination using infrared thermography (IRT). Structural Control and Health Monitoring 2020; 27(4): e2506 (Q1)
8. Pathiranage Thilini and Lokuge Weena, “Vulnerability assessment of bridges subjected to extreme cyclonic events”, Natural Hazards, 102, pp: 401–417, 2020. (Q1)
9. Lokuge Weena, Wilson Matthew, Tran Huu and Setunge, Sujeeva, “Predicting the probability of failure of timber bridges using fault tree analysis”, Structure and Infrastructure Engineering, 15(6), 783-797, 2019. (Q1)
10. Gajanayake, A. Khan, T. and Zhang, G. 2019, Postdisater decision making in road infrastructure recovery projects: an interview study with practitioners in Queensland, National Emergency Reponse.
11. Qeshta, I. M. I., Hashemi, M. J., Gravina, R., and Setunge, S. (2019). Review of resilience assessment of coastal bridges to extreme wave-induced loads. Engineering Structures, 185, 332-352. (Q1)
12. Gajanayake, A. Zhang, G. Khan, T. and Mohseni, H. 2020, 'Postdisaster Impact Assessment of Road Infrastructure: State-of-the-Art Review', in Natural Hazards Review, American Society of Civil Engineers, United States, vol. 21, no. 1, pp. 1-14 ISSN: 1527-6988 (Q1)
13. Gajanayake, A. Khan, T. and Zhang, G. 2020, 'Post-Disaster Reconstruction of Road Infrastructure', in European Journal of Transport and Infrastructure

ENHANCING RESILIENCE OF CRITICAL ROAD STRCUTURES – FINAL PROJECT REPORT | REPORT NO. 671.2021
78
Research, Technische Universiteit Delft, Netherlands, vol. 20, no. 1, pp. 1-16 ISSN: 1567-7141 (Q1)
14. Greene Isaac, Lokuge Weena and Karunasena Karu, “Floodways and flood related experiences: A survey of industry experts and asset owners”, Engineering for Public Works, 19, pp. 68-75, 2020, ISSN: 2652-6050 (e-journal).
15. Greene I., Lokuge W. and Karunasena W., “Structural design of floodways under extreme flood loadings”, International Journal of Disaster Resilience in the Built Environment, Published online, 2020, DOI 10.1108/IJDRBE-10-2019-0072 (Q1)
16. Nasim M., Setunge S., Mohseni H., Zhou Sh. “An investigation into the water flow pressure distribution on the bridge pier under flood loading” Structure and Infrastructure Engineering Journal, 2018; 15: 219-229. (Q1)
17. Wahalathantri, B, Lokuge, W., Karunasena, W., Setunge, S. (2018), Quantitative assessment of flood discharges and floodway failures through cross-cultivation of advancement in knowledge and traditional practices, International journal of disaster resilience in the built environment, Vol 9, Issue 4/5, pp 435 – 456 (Q1).
CONFERENCE PAPERS
18. Abbott, T., Gamage, N and Setunge, S. and Lokuge, W (2017) Predicting the remaining life of timber bridges. In: The 12th World Congress on Engineering Asset Management & The 13th International Conference on Vibration Engineering and Technology of Machinery, Brisbane, 2-4 August 2017.
19. Akvan Gajanayake, Hessam Mohseni, Guomin Zhang, Jane Mullett, Sujeeva Setunge, Community adaptation to cope with disaster related road structure failure, The 7th International Conference on Building Resilience; Using scientific knowledge to inform policy and practice in disaster risk reduction, Bangkok, Thailand 27 – 29 November 2017.
20. Dissanayake, A., Venkatesan, S., Setunge, S., Robert, D., Mohseni, H., Nasim, M., Thermal response analysis of composite steel girder bridges subjected to bushfires, Austroads Bridge Conference, Melbourne, March 2017.
21. Nasim M., Setunge S., Zhou S., Mohseni H., An Investigation to the Behaviour of water flow on Bridge Pier in Flood Event, Austroads Bridge Conference, Melbourne, March 2017.
22. Jethro Cohen, Weena Lokuge, Nilupa Herath, Effect of snipe depth on the performance of timber bridge girders", The 9th International Conference on Bridge Maintenance, Safety and Management, Melbourne, 2018.
23. Rahmin Borzou, Weena Lokuge, Rehabilitation of timber bridge piles using a FRP wrapping system", The 9th International Conference on Bridge Maintenance, Safety and Management, Melbourne, 2018.
24. Kalendher, F., Setunge, S., Robert, D., Mohseni, H., Fragility curves for concrete girder bridges under floor hazard, The 9th International Conference on Bridge Maintenance, Safety and Management, Melbourne, 2018.
25. Tran, H.D., Setunge, S., Koay Y.C., Luckzac, H., 2018, What are the attributes of a superior bridge management system, The 9th International Conference on Bridge Maintenance, Safety and Management, Melbourne, 2018.

ENHANCING RESILIENCE OF CRITICAL ROAD STRCUTURES – FINAL PROJECT REPORT | REPORT NO. 671.2021
79
26. H.D. Tran, S. Setunge, Y-C. Koay & H. Luckzac, 2018, Predictive modeling of the deterioration of Australian state bridge network, The 9th International Conference on Bridge Maintenance, Safety and Management, Melbourne, 2018.
27. H.D. Tran, S. Setunge, Y-C. Koay & H. Luckzac, 2018, A simulated maintenance costing using a Markov deterioration model for bridge components, The 9th International Conference on Bridge Maintenance, Safety and Management, Melbourne, 2018.
28. Dissanayake, A.P., Setunge, S., Venkatesan, S., Numerical assessment of composite bridges subjected to Wildland Urban Interface (WUI) fires, The 9th International Conference on Bridge Maintenance, Safety and Management, Melbourne, 2018.
29. Nasim M., Setunge S., Zhou S., Mohseni H., Computational Investigation on the Piers of a U-Slab Bridge under Raising Flood Intensity, The 9th International Conference on Bridge Maintenance, Safety and Management, Melbourne, 2018.
30. Nasim M., Setunge S., Zhou S., Mohseni H., Nazem M., Damage Index Investigation for The RC Bridge Pier Exposed to Flood Loading, Australasian Structural Engineering Conference, 2018.
31. Nasim M., Setunge S., Zhou S., Nazem M., Mohseni H., Vulnerability Assessment for the Reinforced Concrete Beam Exposed to Monotonic Loading Using Different Damage Indexes, GSTX 2018, Barcelona.
32. Qeshta, I. M. I., Hashemi, M. J., Gravina, R., and Setunge, S. (2018). Fragility analysis of non-ductile RC bridges subjected to extreme hydrodynamic forces. Proceedings of the Ninth International Conference on Bridge Maintenance, Safety and Management (IABMAS 2018) (pp. 1279-1285).
33. Herath N, Zhang L, Mendis P, Lokuge W, Setunge S, (2019) Life cycle performance of bridges under multiple seismic actions, ACI Structural (Q1-second round review)
34. Qeshta, I. M. I., Hashemi, M. J., Hashemi, M. R., Gravina, R., and Setunge, S. Development of Fragility Functions for Coastal Bridges Subjected to Extreme Hydrodynamic Forces (Submitted to Structure and Infrastructure Engineering).
KEYNOTE PRESENTATIONS
35. S. Setunge, Enhancing disaster preparedness by building resilience of critical infrastructure, The 7th International Conference on Building Resilience; Using scientific knowledge to inform policy and practice in disaster risk reduction, Bangkok, Thailand 27 – 29 November 2017.
36. Zhang L, (2019) The 16th East Asia-Pacific Conference on Structural Engineering & Construction (EASEC).
37. W. Lokuge, Timber bridge maintenance, Institute of Public Works Engineering Australasia, Annual State Conference, Brisbane Convention and Exhibition Centre, 8-10 November 2016.
TECHNICAL REPORTS
38. A report delivered on predicting quantities of bridge components to enable estimation of maintenance costs.

ENHANCING RESILIENCE OF CRITICAL ROAD STRCUTURES – FINAL PROJECT REPORT | REPORT NO. 671.2021
80
39. A report about the bridge rating 40. A report about the Classification of Bridges 41. I. Greene, W. Lokuge, W. Karunasena, Floodway design guideline 42. A report about Floodway Inspection and Maintenance Framework 43. A report about Repair of Bridge Structures 44. A report on Flexural behavior of circular reinforced concrete columns
retrofitted with glass fibre reinforced polymer wrapping system
BOOK CHAPTERS
45. M. Maizuar, L. Zhang, S. Miramini, P. Mendis, C. Duffield. (2020) Structural Health Monitoring of Bridges Using Advanced Non-destructive Testing Technique. In: Wang C., Ho J., Kitipornchai S. (eds) ACMSM25. Lecture Notes in Civil Engineering, vol 37. Springer, Singapore, 963-972: 2020
46. M. Sofi, E. Lumantarna, P. Mendis, L. Zhang. A proposed method for the use of the IBISFS in experimental modal analysis of Buildings in Data Mining in Structural Dynamic Analysis - A Signal Processing Perspective. Springer, 147-169; 2019
ENHANCING RESILIENCE OF CRITICAL ROAD STRCUTURES – FINAL PROJECT REPORT | REPORT NO. 671.2021
81
TEAM MEMBERS RESEARCH TEAM
Professor Sujeeva Setunge
Professor Priyan Mendis (Unimelb)
Professor Karu Karunasena (USQ)
Professor Kevin Zhang (RMIT)
Professor Dilanthi Amaratunga (Huddersfield, UK)
Associate Professor Weena Lokuge (USQ)
Dr. Nilupa Herath (Unimelb)
Dr. Long Shi
Dr. Hessam Mohseni
Dr. Huu Tran (RMIT)
Mr. Kanishka Atapattu (RMIT)
Associate Researchers (supervisors of the research scholars):
Dr. Sri Venkatesan
Dr. Dilan Robert
Associate Professor Rebecca Gravina
END-USERS
End-user organisation End-user representative Extent of engagement (Describe type of engagement)
Geoscience Australia Leesa Carson Review of the research outcomes, progress reports and specific advice on community impact
VicRoads (DoT) Dr. Yew-Chin Koay Joint supervision of Ph.D candidates, organizing end user organization placements for 4 Ph.D candidates, attending monthly meetings. Utilization outcome of vulnerability modelling of bridges.
Queensland Reconstruction authority
Kieran Dibb Presentation at end user workshops, organizing end user interviews with the Ph.D

ENHANCING RESILIENCE OF CRITICAL ROAD STRCUTURES – FINAL PROJECT REPORT | REPORT NO. 671.2021
82
candidate Akvan Gajanayake who worked on post disaster recovery, Floodway reconstruction information
Institution of Public Works Engineers Australia (Qld) (IPWEAQ)
Leigh Cunningham Presentations at project end user workshops, Leading the utilization project on floodway design
Lockyer Valley regional council
Tony McDonald, Miles Fairbairn
Provision of data on damages to road infrastructure during flood events, input to floodway reconstruction and design guides developed.
City of Brimbank Dominic Di Martino Contributions towards local government perspective as an end user of the research outcomes
ENHANCING RESILIENCE OF CRITICAL ROAD STRCUTURES – FINAL PROJECT REPORT | REPORT NO. 671.2021
83
REFERENCES
[1] ‘Build Back Better in recovery, rehabilitation and reconstruction 2017 | Consultative version’. United Nations Office for Disaster Risk Reduction .
[2] ‘DELOITTE ACCESS ECONOMICS 2014. Scoping Study on a Cost Benefit Analysis of Bushfire Mitigation. In: DELOITTE (ed.). Sydney: Australian Forest Products Association.’
[3] ‘Natural disaster costs to reach $39 billion per year by 2050’. http://australianbusinessroundtable.com.au/assets/reports/media-release-nov-11.pdf (accessed Mar. 21, 2021).
[4] ‘Queensland Transport and Roads Investment Program, 2010-11 to 2013-14’, 2010. https://www.tmr.qld.gov.au/About-us/Corporate-information/Publications/Queensland-Transport-and-Roads-Investment-Program/Qtrip1011to1314.
[5] R. W. Pritchard, ‘2011 to 2012 Queensland floods and cyclone events: Lessons learnt for bridge transport infrastructure’, Australian Journal of Structural Engineering, vol. 14, no. 2, pp. 167–176, 2013.
[6] ‘Increasing Queensland’s resilience to inland flooding in a changing climate’, 2010. https://data.longpaddock.qld.gov.au/static/about/publications/pdf/inlandfloodstudy.pdf.
[7] ‘Rebuilding a stronger, more resilient Queensland’, 2012. http://hardenup.org/umbraco/customContent/media/1367_QRA%20-%20Resilience.pdf.
[8] ‘Queensland floods: The economic impact Special Report’, 2011. http://www.scotto.com.au/cmsdocuments/Queensland%20Floods%20Jan%202011%20-%20The%20Economic%20Impact.pdf.
[9] W. Lokuge and S. Setunge, ‘Evaluating disaster resileince of bridge infrastructure when exposed to extreme natural events’, presented at the International conference on disaster resilience, Sri Lanka, 2013.
[10] Flannigan, M., et al., ‘Global wildland fire season severity in the 21st century’, Forest Ecology and Management, vol. 294, pp. 54–61.
[11] Flannigan, M., M. Wotton, and G. Marshall., ‘Climate Change and Wildland Fire Intensity’, in AGU Fall Meeting Abstracts., 2016.
[12] Massada, A.B., et al., ‘Wildfire risk in the wildland–urban interface: a simulation study in northwestern Wisconsin’, Forest Ecology and Management, vol. 258, no. 9, pp. 1990–1999.
[13] Evans, D., R. Rehm, and E. McPherson., ‘Physics-based modelling of wildland–urban intermix fires’, presented at the 3rd international wildland fire conference., 2003.
[14] CEN, EN 1992-1-2 (2004) Eurocode 2: Design of concrete structures-Part 1-2: General rules-Structural fire design. 2004, European Comittee for Standardization: Brussels. .
[15] CEN, EN 1993-1-2 (2005) Eurocode 3: Design of steel structures - Part 1-2: General rules - Structural fire design. 2005, European Comittee for Standardization: Brussels. .
[16] ‘Shome, N., et al.,, Earthquakes, records, and nonlinear responses. Earthquake Spectra, 1998. 14(3): p. 469-500’.
[17] W. Lokuge, I. Greene, E. Etemadi, and W. Karunasena, ‘Role of Structural Analysis in Floodway Design Process’, Australian Journal of Civil Engineering, vol. 17, no. 2, pp. 110–119, 2019.
[18] I. Greene, W. Lokuge, and W. Karunasena, ‘Structural design of floodways under extreme flood loading’, International Journal of Disaster Resilience in the Built Environment, vol. 11, no. 4, pp. 535–555, 2020.
[19] I. Greene, W. Lokuge, and W. Karunasena, ‘Floodways and Flood-Related Experiences: Survey of Industry and Asset Owners’, Engineering for Public Works, vol. 19, pp. 69–75, 2020.
[20] ‘AHMED, A., BAI, Q., LAVRENZ, S. & LABI, S. 2015. Estimating the marginal cost of pavement damage by highway users on the basis of practical schedules for pavement maintenance, rehabilitation and reconstruction. Structure and Infrastructure Engineering, 11, 1069-1082.’
[21] ‘CAMPBELL, D. 2018. Hidden toll of ambulance delays at A&E revealed. The Gurdian.’
[22] ‘JALDELL, H., LEBNAK, P. & AMORNPETCHSATHAPORN, A. 2014. Time Is Money,But How Much?The Monetary Value of Response Time for Thai Ambulance Emergency Services’.

ENHANCING RESILIENCE OF CRITICAL ROAD STRCUTURES – FINAL PROJECT REPORT | REPORT NO. 671.2021
84
Appendix A – Industry Floodway Survey Questions
Question 1: In your experience what is the likelihood that a floodway, inclusive of protection, will sustain damage during extreme flood events?
0 1 2 3 4 5 6 7 8 9 10
Not Likely Very Likely
Question 2: In your experience which floodway component is most susceptible to damage during an extreme flood event? What is the likely cause of this damage?
a) Upstream Rock Protection b) Upstream Cut-off Wall c) Apron d) Downstream Batter e) Downstream Cut-off Wall f) Downstream Rock Protection
Question 3: In your experience is floodway failure more common in raised floodway structures or floodway structures situated level with the creek bed?
a) Raised Floodway Structure b) Level Floodway Structure
Figure A1. Major floodway components.
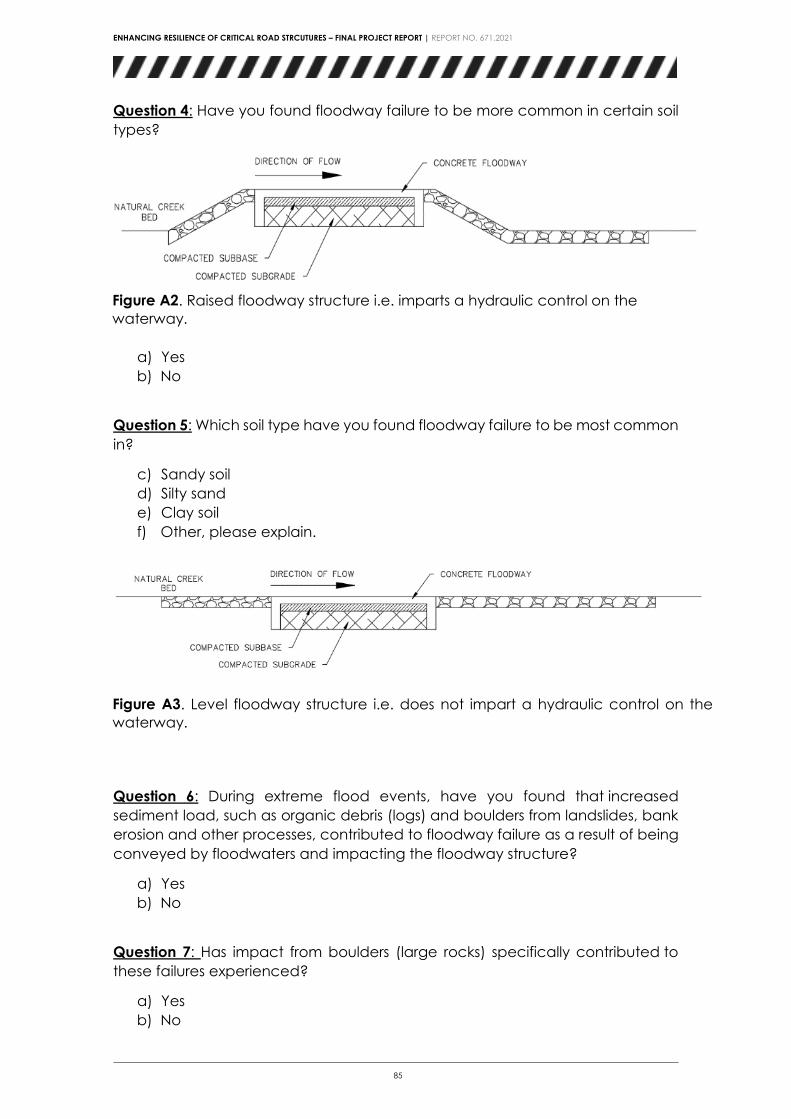
ENHANCING RESILIENCE OF CRITICAL ROAD STRCUTURES – FINAL PROJECT REPORT | REPORT NO. 671.2021
85
Question 4: Have you found floodway failure to be more common in certain soil types?
a) Yes b) No
Question 5: Which soil type have you found floodway failure to be most common in?
c) Sandy soil d) Silty sand e) Clay soil f) Other, please explain.
Question 6: During extreme flood events, have you found that increased sediment load, such as organic debris (logs) and boulders from landslides, bank erosion and other processes, contributed to floodway failure as a result of being conveyed by floodwaters and impacting the floodway structure?
a) Yes b) No
Question 7: Has impact from boulders (large rocks) specifically contributed to these failures experienced?
a) Yes b) No
Figure A3. Level floodway structure i.e. does not impart a hydraulic control on the waterway.
Figure A2. Raised floodway structure i.e. imparts a hydraulic control on the waterway.

ENHANCING RESILIENCE OF CRITICAL ROAD STRCUTURES – FINAL PROJECT REPORT | REPORT NO. 671.2021
86
Question 8: Has your 86rganization completed any investigation into different concrete cut-off wall configurations (depth, width etc.)?
Question 9: Which cut-off wall did these investigations specifically apply to?
a) Upstream Cut-off Wall b) Downstream Cut-off Wall c) Both Upstream and Downstream Cut-off Wall
Question 10: What were the investigations carried out? and did these investigations lead to an increase in structural resilience?
Question 11: Has your organisation trialed any other improvements or amendments to floodway design to increase structural resilience against flood events? If so, please explain.
Question 12: Is there any other feedback you wish to provide based on your experience in floodway construction and maintenance?
Figure A4. Typical downstream floodway detail.