ENHANCING PRODUCT IMAGES FOR CLICK-THROUGH RATE ...bjornstenger.github.io › papers ›...
5
ENHANCING PRODUCT IMAGES FORCLICK-THROUGH RATE IMPROVEMENT Yeongnam Chae Mitsuru Nakazawa Bj¨ orn Stenger Rakuten Institute of Technology, Rakuten, Inc. [email protected] ABSTRACT This paper proposes a statistical method to enhance image quality in order to increase the click-through rate (CTR) of product images. We build a joint probability model of global image features for photos of different product categories. The images are modified in terms of brightness, contrast, and sharpness in order to increase the expected CTR. The effec- tiveness of the method is evaluated using a perceptual user study, comparing it to histogram equalization methods, and by conducting an A/B test over a one-week period on the e- commerce site Rakuten Ichiba. Index Terms— image enhancement, click-through rate, advertisement, e-commerce 1 Introduction Assessing the quality of a photograph is a matter of applica- tion context. If user preference is the quality metric, there is significant variance and dependence on the image content. Designing an automatic enhancement method that increases user preference based on adjusting image statistics such as sharpness or color distributions is not straightforward. In this paper we consider the CTR of images as a target metric. Im- ages play a significant role in conveying information and at- tract potential customers to services. From a commercial per- spective, it is interesting to note that advertisers spend over US$ 13 billion annually on banner ads [1], yet consumers pay little attention to them, as seen from the mean CTR value of 0.12% [2]. In order to improve the CTR of images advertis- ers have adopted image filtering applications for global image adjustment, e.g. [3, 4]. However, image filtering may not al- ways yield the desired effect in terms of CTR increase, and advertisers rely on their experience or intuition to carefully adjust image parameters to generate a more attractive image. Here we propose an image processing method that helps au- tomating the image enhancement process, thereby empower- ing merchants who are less experienced in image processing. Instead of defining an appearance-based quality measure of a given image, we directly aim to increase its CTR value. We first collect real-scale product images and their CTR from a large e-commerce website [5]. We then construct a statistical model of visual features and the corresponding CTR. Finally, Original Ours PAE (Intensity) PAE (RGB) Fig. 1: Image enhancement examples. (left column) Original input images [6][7][8], (second column) images after enhancement with the proposed statistical method, (third column) applying Piecewise Affine Equalization (PAE) [9] using intensity and (fourth column) PAE using RGB values. PAE works well on the top input image, but overly darkens the middle and bottom images. we enhance an image by maximizing an objective function based on the image features. The contribution of this paper is twofold. First, we pro- pose an image enhancement method to increase the expected CTR. This is the first study that enhances the image based on CTR. The method can be applied to images of various cate- gories, as shown Fig. 1. Second, we study the effectiveness of the method, using both a preference survey, comparing it with standard histogram equalization methods, and an A/B test on an e-commerce website [5], where the CTRs of original and modified images are measured over a one-week period. 2 Prior work There has been significant prior work on enhancing the CTR for advertising images. The visual factors that have been in- vestigated include: Color. According to psychological studies, the dominant image color has effects on the viewer[10]. For example, blue
Transcript of ENHANCING PRODUCT IMAGES FOR CLICK-THROUGH RATE ...bjornstenger.github.io › papers ›...

ENHANCING PRODUCT IMAGES FOR CLICK-THROUGH RATE IMPROVEMENT
Yeongnam Chae Mitsuru Nakazawa Bjorn Stenger
Rakuten Institute of Technology, Rakuten, [email protected]
ABSTRACTThis paper proposes a statistical method to enhance imagequality in order to increase the click-through rate (CTR) ofproduct images. We build a joint probability model of globalimage features for photos of different product categories. Theimages are modified in terms of brightness, contrast, andsharpness in order to increase the expected CTR. The effec-tiveness of the method is evaluated using a perceptual userstudy, comparing it to histogram equalization methods, andby conducting an A/B test over a one-week period on the e-commerce site Rakuten Ichiba.
Index Terms— image enhancement, click-through rate,advertisement, e-commerce
1 IntroductionAssessing the quality of a photograph is a matter of applica-tion context. If user preference is the quality metric, thereis significant variance and dependence on the image content.Designing an automatic enhancement method that increasesuser preference based on adjusting image statistics such assharpness or color distributions is not straightforward. In thispaper we consider the CTR of images as a target metric. Im-ages play a significant role in conveying information and at-tract potential customers to services. From a commercial per-spective, it is interesting to note that advertisers spend overUS$ 13 billion annually on banner ads [1], yet consumerspay little attention to them, as seen from the mean CTR valueof 0.12% [2]. In order to improve the CTR of images advertis-ers have adopted image filtering applications for global imageadjustment, e.g. [3, 4]. However, image filtering may not al-ways yield the desired effect in terms of CTR increase, andadvertisers rely on their experience or intuition to carefullyadjust image parameters to generate a more attractive image.Here we propose an image processing method that helps au-tomating the image enhancement process, thereby empower-ing merchants who are less experienced in image processing.Instead of defining an appearance-based quality measure of agiven image, we directly aim to increase its CTR value. Wefirst collect real-scale product images and their CTR from alarge e-commerce website [5]. We then construct a statisticalmodel of visual features and the corresponding CTR. Finally,
Original Ours PAE (Intensity) PAE (RGB)
Fig. 1: Image enhancement examples. (left column) Original inputimages [6][7][8], (second column) images after enhancement withthe proposed statistical method, (third column) applying PiecewiseAffine Equalization (PAE) [9] using intensity and (fourth column)PAE using RGB values. PAE works well on the top input image, butoverly darkens the middle and bottom images.
we enhance an image by maximizing an objective functionbased on the image features.
The contribution of this paper is twofold. First, we pro-pose an image enhancement method to increase the expectedCTR. This is the first study that enhances the image based onCTR. The method can be applied to images of various cate-gories, as shown Fig. 1. Second, we study the effectiveness ofthe method, using both a preference survey, comparing it withstandard histogram equalization methods, and an A/B test onan e-commerce website [5], where the CTRs of original andmodified images are measured over a one-week period.
2 Prior workThere has been significant prior work on enhancing the CTRfor advertising images. The visual factors that have been in-vestigated include:
Color. According to psychological studies, the dominantimage color has effects on the viewer[10]. For example, blue

tones convey trust, while red tones convey excitement[11]. Toconfirm how colors affect the CTR, North and Ficorilli [12]conducted A/B tests, and reported that on the website of aninsurance company dominantly blue colors showed signifi-cantly higher CTR than red ones. In tests on both B2B andB2C websites, Lohtia et al. [13] found that moderate colorsachieve higher CTR than dark or bright colors.
Image size. While large images tend to increase CTR [14],there are clearly limitations given the screen real-estate.Berke [15] compared the CTR for three different image sizes,reporting the highest CTR for medium sizes of 300 × 250, afinding also supported in [12].
Static and dynamic images. In the early days of the webmany animated images were used for advertising. The studyby Yoo et al. [16] reported that dynamic ads produced higherCTRs than static images, however, a more recent study of theeffect of static and dynamic images on four company web-sites [17] reported the opposite effect. The effect of anima-tions is therefore not conclusive.
3 Statistical Image EnhancementThe target metric adopted in this paper is the expected CTRof an image, which is the ratio of the number of clicks and thenumber of times an image was displayed on the web page.The CTR of an image is affected by various factors, such asthe image content, visual quality, relative placement, and con-text on the page it is displayed. Here we are interested in howthe image quality affects the CTR, and consider all other fac-tors as nuisance variables. We formulate the task as finding asuitable enhancement function fθ, with parameters θ which,when applied to an input image I leads to a high expectedvalue of the CTR, r:
θ∗ = argmaxθ p(r|fθ(I)). (1)
We consider functions fθ of the form
fθ(IL) = (αIL + β)− Gσ ∗ IL, (2)
where IL is the luminance channel of the image in Lab repre-sentation, and the parameters θ = (α, β, σ) include the scal-ing parameter α, the offset β and the σ to determine the vari-ance in the Gaussian kernel Gσ . We take a learning approachto determine the parameters of the enhancement function. Inorder to estimate the perceptual effect of the image enhance-ment, we first extract global image features φ(I) and learn amapping from these features to the expected CTR value
E(r|φ(I)), (3)
where φ(I) the 4-dimensional feature vector as
φ(I) = (ϕb, ϕc, ϕs, ϕsal)T , (4)
Fig. 2: Saliency coverage feature. From the input image [20] (left),we compute a saliency map (middle) using a method that takes ob-jectness into account [18]. The binarized saliency map (right) isthen used to compute the area ratio.
where ϕB is the mean brightness, ϕC is the image contrast,defined as the scaled standard deviation of the luminancechannel:
ϕc = ζψ
(|L|−1
∑i∈IL
l − µIL
) 12
, (5)
with scale factor ζψ . The sharpness, ϕS is defined as the max-imum of the Laplacian:
ϕs = ζλmaxi∈IL
(δi
δx+δi
δy
), (6)
with scale factor ζλ. To compute the saliency value, ϕsal,we compute a saliency map using the method in [18], andbinarize it using Otsu’s method [19]. The saliency feature isthe ratio of the salient and non-salient areas, see Fig. 2. Thisfeature ensures that when adjusting brightness, contrast, orsharpness, the main object remains visually salient.
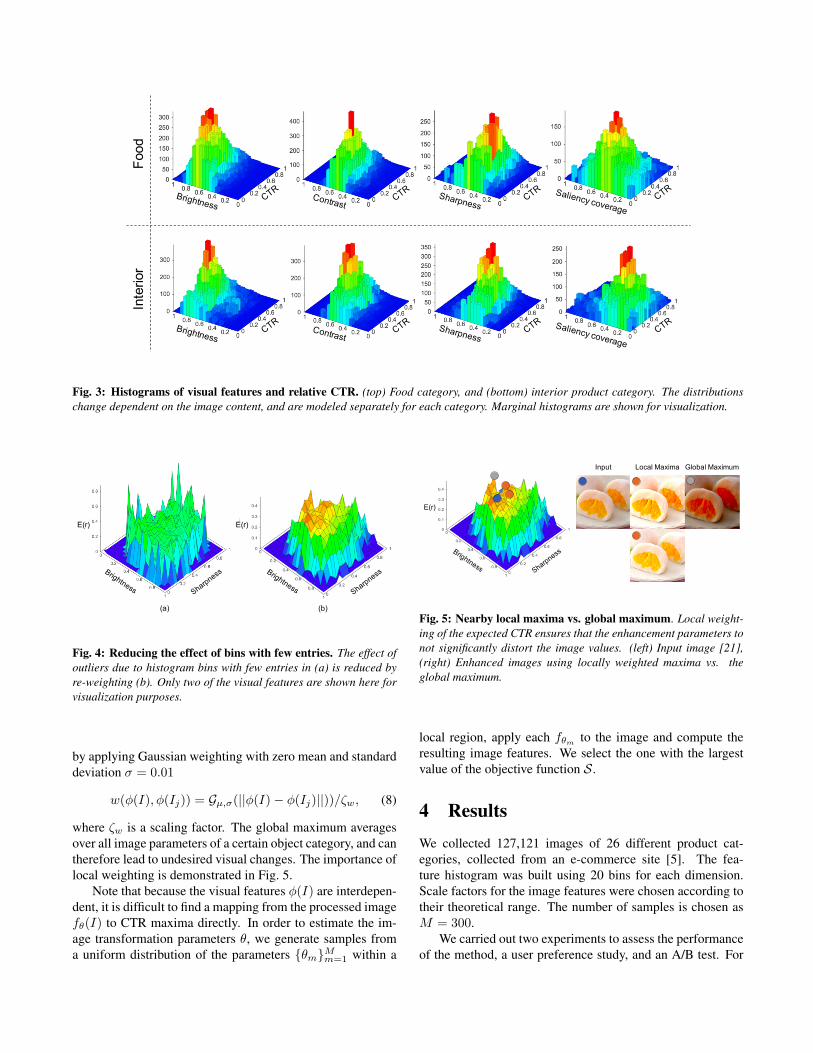
Category-based models. The images contain productsfrom different categories. Fig. 3 shows marginal distributionsof visual features and CTR values for two different productcategories. Since these distributions differ for different prod-ucts we create separate models for each product category. Thefeature distributions φ(Ik) for training images {IK}Kk=1 froma particular category are modeled using histograms, and wecompute the expected CTR for each bin (Fig. 4(a)). His-togram bin-weighting is applied to down-weight bins contain-ing few data points, thus reducing the effect of outliers. Theresulting model with bin weighting is shown in Fig. 4 (b).
Local neighborhood weighting. We use weighting of theexpected CTR value function in a local neighborhood of theinput image features φ(I) to obtain the following objectivefunction for an image Ij :
S(φ(Ij)) = w(φ(I), φ(Ij))E(r(φ(Ij))), (7)
Food
Interior
Fig. 3: Histograms of visual features and relative CTR. (top) Food category, and (bottom) interior product category. The distributionschange dependent on the image content, and are modeled separately for each category. Marginal histograms are shown for visualization.
E(r) E(r)
(a) (b)
Fig. 4: Reducing the effect of bins with few entries. The effect ofoutliers due to histogram bins with few entries in (a) is reduced byre-weighting (b). Only two of the visual features are shown here forvisualization purposes.
by applying Gaussian weighting with zero mean and standarddeviation σ = 0.01
w(φ(I), φ(Ij)) = Gµ,σ(||φ(I)− φ(Ij)||))/ζw, (8)
where ζw is a scaling factor. The global maximum averagesover all image parameters of a certain object category, and cantherefore lead to undesired visual changes. The importance oflocal weighting is demonstrated in Fig. 5.
Note that because the visual features φ(I) are interdepen-dent, it is difficult to find a mapping from the processed imagefθ(I) to CTR maxima directly. In order to estimate the im-age transformation parameters θ, we generate samples froma uniform distribution of the parameters {θm}Mm=1 within a
E(r)
Input Local Maxima Global Maximum
Fig. 5: Nearby local maxima vs. global maximum. Local weight-ing of the expected CTR ensures that the enhancement parameters tonot significantly distort the image values. (left) Input image [21],(right) Enhanced images using locally weighted maxima vs. theglobal maximum.
local region, apply each fθm to the image and compute theresulting image features. We select the one with the largestvalue of the objective function S.
4 ResultsWe collected 127,121 images of 26 different product cat-egories, collected from an e-commerce site [5]. The fea-ture histogram was built using 20 bins for each dimension.Scale factors for the image features were chosen according totheir theoretical range. The number of samples is chosen asM = 300.
We carried out two experiments to assess the performanceof the method, a user preference study, and an A/B test. For

**
0
200
400
600
800
1000
Fashion Food Interior Sports
Freq
uency
Original Ours PAE(Intensity)[?] PAE(RGB)[?]
*
*
**
**
** *:p value<0.05
� Original � Ours� PAE(Intensity)� PAE(RGB)
Fig. 6: User preference study. The proposed method performs wellon the food and sports goods categories, while performing slightlyworse on fashion and interior categories. Statistically significantdifferences (p < 0.05) are shown with black connecting lines. BothPAE methods perform poorly.
the two experiments, we used 48 images of 270 × 200 reso-lution, selected from four product categories: fashion, food,interior products and sports goods.
4.1 Preference surveyFor each input image we computed the enhanced image usingthe proposed method, and two enhancement methods basedon histogram equalization, proposed in [9]. These four im-ages were displayed in randomized order to 148 users to-gether with the question: Which of these images makes youwant to purchase the product most?
The result is shown in Fig. 6. To measure the statisticalsignificance, we calculated the p values. Both PAE methodsled to low preference, even compared to the original image.PAE performed poorly on images containing large white areasas can be seen in the middle and bottom row of Fig. 1. Theproposed method showed significantly higher preference thanPAE. Compared to the input images, the it performed wellon the food and sports goods categories, while performingslightly worse on fashion and interior categories. However,these differences, are statistically not significant (p > 0.05,see Fig. 6).
4.2 A/B testIn the second experiment we carried out an A/B test on an e-commerce website. The original images and images enhancedwith the proposed method were shown at the same location ofthe page and all other page content was identical. The numberof impressions and the number of click-throughs were mea-sured over the period of one week, yielding a total of 100,720
0
0.5
1
1.5
2
Fashion Food Interior Sports
CTR(%)
Original Ours
*
*
*:p value<0.05
Fig. 7: Result of A/B test. Change of CTR, when showing the origi-nal images and the enhanced images using the proposed method, fordifferent product categories. Improvements are observed for fashion,food, and interior product photos. Only results on fashion and foodare statistically significant.
impressions and 1,119 clicks.The overall result is shown in Fig. 7. On average, the
CTR was improved by 15.7%. By category, the enhancedimages show significant improvement of 27.4% for food im-ages, 16.9% on fashion images (p < 0.05). Although thereis no significant difference for other categories, the interiorand the sports category show 21.6% better and 3.1% worseperformance, respectively.
4.3 Discussion.We have carried out both a preference survey and an A/B test,which are in fact measuring two different metrics. While thesurvey measures conscious preference, this does not neces-sarily imply a higher CTR. We use the assumption that thesurvey serves as a useful proxy for an A/B test in a real set-ting, which carries more financial risk. Further, we also foundcases in which the original image was already of high qualityand the enhanced version did not differ significantly, leadingto similar results of the two images.
5 Conclusion
In this paper we have presented a statistical image enhance-ment method, adjusting image brightness, contrast, and sharp-ness, with the objective to increase the click-through rate ofproduct images. We have shown in a user preference studythat our method outperforms standard enhancement methodsusing histogram equalization. In an A/B test over one weekwe have measured the change of CTR over the period of aweek and found an average increase of 15.7%, demonstratingthe effectiveness of the method.

6 References[1] eMarketer, “US digital display ad spending to surpass search
ad spending in 2016,” https://www.emarketer.com/Article/US-Digital-Display-Ad-Spending-Surpass-Search-Ad-Spending-2016/1013442 (accessed on Feb 12, 2018).
[2] eMarketer, “Consumers get engaged with rich media,”https://www.emarketer.com/Article/Consumers-Engaged-with-Rich-Media/1011282 (accessed on Feb 12, 2018).
[3] LateNiteSoft, “Camera+,” http://camera.plus/ (accessed onFeb 8, 2018).
[4] Everimaging, “Fotor,” https://www.fotor.com/ (accessed onFeb 8, 2018).
[5] Rakuten Inc., “Rakuten ichiba,” https://global.rakuten.com/en/(accessed on Feb. 8, 2018).
[6] “Source image,” http://image.ias.rakuten.co.jp/acp/ec/11461/12216177/1-1-1/e32f86f5ca46849881050ecd00a040df.jpg (ac-cessed on May 23, 2018).
[7] “Source image,” http://image.ias.rakuten.co.jp/acp/ec/41771/12216179/1-1-1/b40c18e2108918be208a2f7417349510.jpg (ac-cessed on May 23, 2018).
[8] “Source image,” http://image.ias.rakuten.co.jp/acp/ec/175992/12216186/1-1-1/82a1928a280677b5b87d5bc616d9c477.jpg (ac-cessed on May 23, 2018).
[9] J. Lisani, A. Petro, and C. Sbert, “Color and contrast enhance-ment by controlled piecewise affine histogram equalization,”Journal of Image Processing On Line, , no. 2, pp. 49–60, 2012.
[10] G. Ciotti, “The psychology of color in marketingand branding,” https://www.helpscout.net/blog/psychology-of-color/ (accessed on Feb 11, 2018).
[11] L. Widrich, “Why facebook is blue: The science of col-ors in marketing,” https://blog.bufferapp.com/the-science-of-colors-in-marketing-why-is-facebook-blue (accessed on Feb11, 2018).
[12] M. North and M. Ficorilli, “Click me: an examination of theimpact size, color, and design has on banner advertisementsgenerating clicks,” Journal of Financial Services Marketing,vol. 22, no. 3, pp. 99–108, 2017.
[13] R. Lohtia, N. Donthu, and E. Hershberger, “The impact of con-tent and design elements on banner advertising click-throughrates,” Journal of Advertising Research, vol. 43, no. 4, pp.410–418, 2004.
[14] C. Cho, “How advertising works on the www: Modified elabo-ration likelihood model,” Journal of Current Issues & Researchin Advertising, vol. 21, no. 1, pp. 34–50, 1999.
[15] A. Berke, “What is the best ad size?,”https://blog.adroll.com/best-practices/best-ad-size (accessedon Feb 8, 2018).
[16] C. Y. Yoo, K. Kim, and P. A. Stout, “Assessing the effects ofanimation in online banner advertising,” Journal of InteractiveAdvertising, vol. 4, no. 2, pp. 49–60, 2004.
[17] J. O’Toole, “Which works better: Static vs. animatedads,” https://www.webtrends.com/blog/2013/12/which-works-better-static-vs-animated-ads/ (accessed on Feb 8, 2018).
[18] G. Yildirim and S. Susstrunk, “FASA: fast, accurate, and size-aware salient object detection,” in ACCV, 2014.
[19] N. Otsu, “A threshold selection method from gray-level his-tograms,” IEEE Transactions on Systems, Man and Cybernet-ics., vol. 9, no. 1, pp. 62–66, 1979.
[20] “Source image,” http://thumbnail.image.rakuten.co.jp/@0_mall/otoshuclub/cabinet/item6/8300182_r.jpg (accessed on May 23, 2018).
[21] “Source image,” https://event.rakuten.co.jp/mother/tieup/otoshu/img/20160415/item04_thumb.jpg (accessed on May 23, 2018).


![[Rakuten TechConf2014] [C-6] Japan ICHIBA Daily Work - Tools & Processes](https://static.fdocuments.in/doc/165x107/557d608ed8b42aba3d8b4ffc/rakuten-techconf2014-c-6-japan-ichiba-daily-work-tools-processes.jpg)


![[Rakuten TechConf2014] [A-4] Rakuten Ichiba](https://static.fdocuments.in/doc/165x107/5595a04d1a28ab0a448b4646/rakuten-techconf2014-a-4-rakuten-ichiba.jpg)

![[RakutenTechConf2013] [LT] Scrum of Global Ichiba](https://static.fdocuments.in/doc/165x107/545cf136b1af9f320a8b4931/rakutentechconf2013-lt-scrum-of-global-ichiba.jpg)
![Expressive Visual Text-To-Speech as an Assistive Technology for …bjornstenger.github.io › papers › cassidy_cviu2015.pdf · 2020-04-25 · 105 with a grimace) [25]. In everyday](https://static.fdocuments.in/doc/165x107/5f28aaf4122e1432ec76ed18/expressive-visual-text-to-speech-as-an-assistive-technology-for-a-papers-a-cassidycviu2015pdf.jpg)