Oracle Flash Storage System Support and Interoperability Guide
Upload
vuongxuyenCategory
view
248download
0
An Oracle White PaperNovember 2010
Enhancing Oracle Database Performancewith Flash Storage
Enhancing Oracle Database Performance with Flash Storage
1. Introduction ........................................................................................ 1 2. Flash Memory: Performance and Price Characteristics ..................... 4
2.1 Performance Implications ............................................................. 6 2.2 Price-Performance Implications ................................................... 7
3. Hardware Configuration ..................................................................... 8 4. Software Environment and Configuration .......................................... 9 5. Flash Storage in Decision Support Environments ............................. 10 6. Flash Storage in OLTP Environments ................................................ 12
6.1 OLTP Workloads .......................................................................... 12 6.2 Oracle Database Redo Logs on Flash Storage ........................... 13 6.3 Read Only Workloads .................................................................. 14 6.4 Read-Write Workloads ................................................................. 18
7. Flash Storage and Database Maintenance ........................................ 22 7.1 Database Loading ........................................................................ 22 7.2 Index Creation .............................................................................. 22 7.3 Database backups ....................................................................... 22 7.4 Database Recovery ...................................................................... 23
8. Conclusions ....................................................................................... 24 Acknowledgments .................................................................................. 25 Appendix A ............................................................................................. 26 Appendix B ............................................................................................. 28 Endnotes ................................................................................................ 30
Enhancing Oracle Database Performance with Flash Storage
1. Introduction
In the last year or two, enterprise class flash storage devices have entered the marketplace. One of the high end examples of such devices is Oracle's Sun F5100 Flash Array (hereafter just F5100.)
The F5100 provides impressive raw I/O performance when compared to conventional disks. For example Table 2.2 shows that small I/Os (8K) on an F5100 are about an order of magnitude faster than small I/Os on 15K SAS disks and that large I/O's (1MB) are about 3 times faster on an F5100 than on SAS disks.
Intuitively, these types of I/O advantages, should translate into serious performance gains for Oracle database applications when conventional disks are replaced by F5100 devices. In this paper it is shown how, and under what circumstances, this will occur.
The focus of the paper is on three Oracle application areas
• on-line transaction processing (OLTP) – characterized by transactions which retrieve and
update just a handful of rows
• decision support (DSS) – characterized by queries that scan very large numbers of rows
• database maintenance tasks – which include such diverse activities as database backup and
recovery, index creation and database loads
It will be seen that in each of these areas, the use of F5100 flash devices for database storage can improve overall performance by as much as a factor of 4 or 5, or by as little as just a few percent. The wide variations show that flash may not speed up all applications.
1

Enhancing Oracle Database Performance with Flash Storage
The degree of improvement seen with any particular application depends upon certain characteristics of that application. For example if an application consumes almost all of the I/O channel bandwidth in a disk-based configuration, replacing disk with flash will provide little or no performance benefit.
In addition to investigating the use of flash for database storage, the use of flash for redo logs is also considered. The guidelines for optimizing performance with flash-based redo logs will turn out to be somewhat different than those for database files.
As stated above, the approach of this paper is to investigate the performance implications of replacing all conventional disks in an Oracle database with flash devices. Prior studies of flash in the Oracle database environment have looked at performance improvements resulting from mixed flash and conventional disk configurations.
For example, http://www.oracle.com/technetwork/articles/systems-hardware-architecture/accel-db-f5100-163888.pdf studies the use of flash for Oracle indexes, with tables stored on conventional disks.
Oracle also has the capability of using F5100's as a cache for the Oracle SGA. More information on this approach can be found at:http://www.oracle.com/technetwork/articles/systems-hardware-architecture/oracle-db-smart-flash-cache-175588.pdf
2

Enhancing Oracle Database Performance with Flash Storage
The organization of the rest of the paper is as follows:
• Section 2 compares some of the underlying characteristics of flash and disks.
• Sections 3 and 4 describe the configurations used for the tests that were performed.
• Section 5 discusses how the use of flash storage can improve query performance in decision support environments.
• Section 6 does the same for OLTP environments.
• Section 7 describes how the use of flash can speed up database maintenance operations.
• Section 8 summarizes the conclusions
• In addition, there are two appendices which show the SQL statements used for all the tests.
3
Enhancing Oracle Database Performance with Flash Storage
2. Flash Memory: Performance and Price Characteristics
Flash memory is solid state (i.e. all electronic) , non-volatile storage with performance and price characteristics lying somewhere between DRAM and conventional spinning (magnetic) disks. It should however be noted, that not all flash is the same. Bulk storage flash devices display wide performance and price differences, based on the specifics of their implementations.
At the very low end is consumer flash, found in digital cameras, MP3 players, memory sticks, and the like.
In the mid range are flash devices which have form factors resembling disks or HBA cards. These are suitable for high performance PCs and even some datacenters.
At the very high end are multi-terabyte units with performance as much as an order of magnitude greater than the best conventional disks. These units are designed for enterprise-level computing systems and have much higher reliability specifications than the lower end devices.
This paper is concerned only with this latter type of flash, and specifically focuses on the Oracle's Sun F5100 Flash Array.
The F5100 has a capacity of 1920 GB or almost 2TB in a 1 U enclosure. It is comprised of up to 80 DIMM like cards, called flash modules.
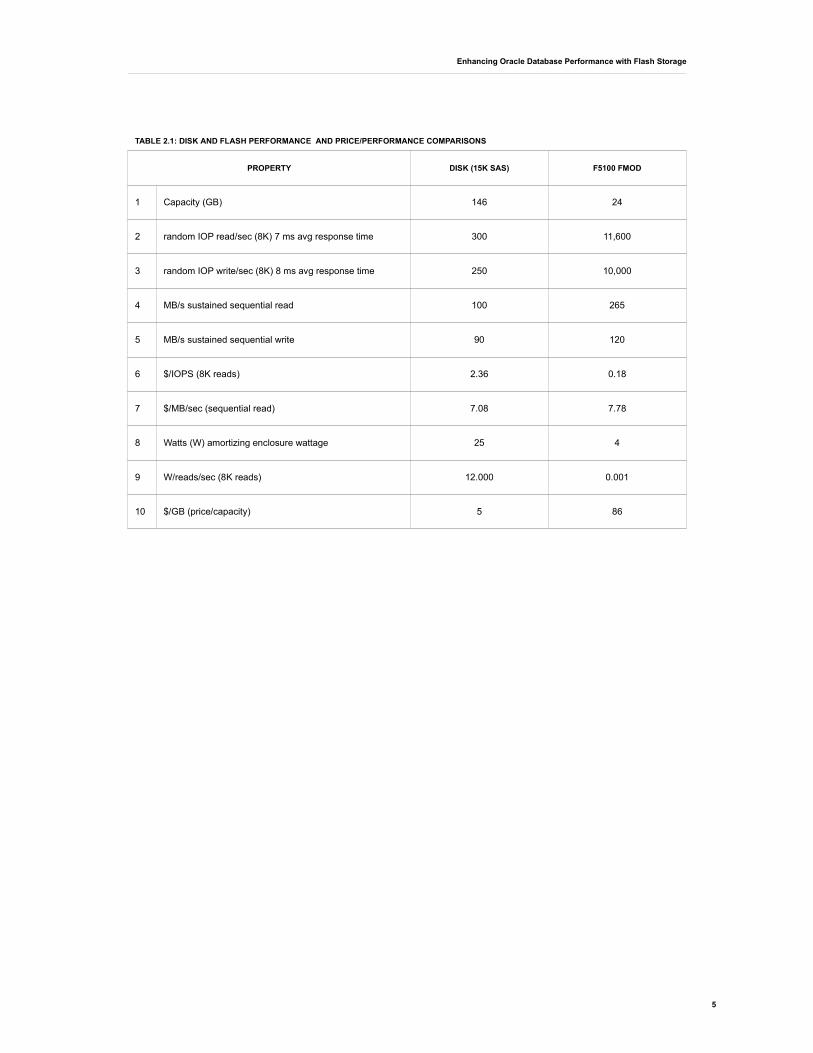
Table 2.1 summarizes general performance and price-performance differences between F5100 flash modules and SAS 15K disks. Table 2.2 shows more detailed performance comparisons between the two types of devices.
Many of the measures listed in these tables are elaborated upon in Sections 2.1 and 2.2.
4
Enhancing Oracle Database Performance with Flash Storage
TABLE 2.1: DISK AND FLASH PERFORMANCE AND PRICE/PERFORMANCE COMPARISONS
PROPERTY DISK (15K SAS) F5100 FMOD
1 Capacity (GB) 146 24
2 random IOP read/sec (8K) 7 ms avg response time 300 11,600
3 random IOP write/sec (8K) 8 ms avg response time 250 10,000
4 MB/s sustained sequential read 100 265
5 MB/s sustained sequential write 90 120
6 $/IOPS (8K reads) 2.36 0.18
7 $/MB/sec (sequential read) 7.08 7.78
8 Watts (W) amortizing enclosure wattage 25 4
9 W/reads/sec (8K reads) 12.000 0.001
10 $/GB (price/capacity) 5 86
5

Enhancing Oracle Database Performance with Flash Storage
TABLE 2.2 RANDOM I/O CHARACTERISTICS FOR F5100 FLASH MODULES VS. SAS DISKS
AVERAGE SERVICE TIMES (MS) FOR RANDOM I/OS
SINGLE F5100 FMOD (WITH D10R) SAS 143 GB 15 K DISK
1 user 2 users 4 users 8 users 16 users 1 user 2 users 4 users 8 users 16 users
8 K read 0.37 0.39 0.54 0.71 1.38 3.9 6.6 10.3 17.3 29.8
8 K write 0.28 0.53 0.55 0.88 1.6 4.3 7.9 13.1 21.9 38.9
1 MB read 4.1 7.8 15.3 30.3 60.6 11.8 22.8 41.9 81 155
1 MB write 8.93 15.8 34.7 70 130 12.2 23.7 44.6 85 165
SUSTAINED THROUGHPUT RANDOM READS (WRITES) PER SEC
SINGLE F5100 FMOD (WITH D10R) SAS 143 GB 15 K DISK
1 user 2 users 4 users 8 users 16 users 1 user 2 users 4 users 8 users 16 users
8 K read 2665 5050 7410 11220 11630 255 302 385 460 540
8 K write 3530 3770 7300 10300 9950 230 250 300 350 410
1 MB read 255 260 261 264 264 85 87 95 100 103
1 MB write 112 125 115 110 122 82 84 90 94 97
2.1 Performance Implications
Table 2.2 shows some of the performance advantages of the F5100 compared to SAS 15K disks
• small I/Os are about an order of magnitude faster on the F5100 than on a SAS disk
• large reads are about 3 times faster on the F5100 than on a SAS disk
• large writes are about 1.5 times faster on the F5100 than on a SAS disk
6
Enhancing Oracle Database Performance with Flash Storage
Table 2.2 also shows that
• the F5100 has similar latencies for small random reads and small random writes
• the latency of large random (sequential) writes is about twice that of large random (sequential) reads
These results suggest that F5100 based storage should easily out-perform disk performance for most Oracle workloads.
One of the generally held perceptions about flash storage devices is that writes are much slower than reads. This has led many to believe that flash is not an appropriate technology for write intensive applications.
While this perception is certainly true about writes to the underlying NAND chips that many flash storage devices are constructed from, enterprise level flash devices have been designed, through various mechanisms, to compensate for the inherent NAND write performance limitations so as to achieve excellent write, as well as read, performance. This is seen at the pure I/O level in Table 2.2. It will also be seen at the Oracle level throughout this paper, in that many of the example workloads which benefit from the use of flash, do both reads and writes. Thus one should not automatically avoid using flash with write intensive workloads.
2.2 Price-Performance Implications
The disk industry has traditionally pitched the cost of storage in terms of $/GB (Table 2.1 line 10). Whereas this made sense in the past, when disk capacities were much smaller than they are today, currently, other metrics turn out to be more meaningful.
For example $/IOPS or $/MB/sec (depending on workload) are much better metrics for making price/performance comparisons than $/GB. This is because disk capacities have grown so dramatically, compared to disk performance, that many customers only use 5-10% of the capacity of each disk in order to get the proper number of spindles to meet performance objectives. These alternate measures show that conventional storage costs are much higher than they initially seem, and in some cases, even higher than flash storage costs (Table 2.1 lines 6 and 7) [1].
The low power consumption of the F5100 (Table 2.1 line 8), implies that the use of F5100 based storage will also yield very significant operational cost savings, coupled with performance improvements.
7
Enhancing Oracle Database Performance with Flash Storage
3. Hardware Configuration
All of the reported measurements were made on two identically configured (except for storage) Sun SPARC Enterprise M5000 servers (hereafter just M5000). Each M5000 had 128GB of main memory and was running Oracle Solaris 10 9/10 . One of the servers was configured with
• 6 x Oracle's Sun Storage J4200 Arrays (each with 12x 146GB 15k RPM SAS disks), referred to as the “disk configuration” in the rest of the paper
and the other was configured with
• 1 x F5100 Flash Array (60 x 24 GB flash modules), referred to as the “flash configuration” in the rest of the paper
Each M5000 had a single I/O unit with a total I/O channel capacity of approximately 2 GB/sec.
In each configuration, Oracle's Sun StorageTek 2540 Array (hereafter just SS2540) was used for the Oracle database redo log. The SS2540 was also used as the Oracle backup device for the backup tests.
A number of tests were also done with the flash-based redo logs .
The M5000 is a 8 socket server with 4 x 2.5GHz SPARC VI cores per socket. Since this much CPU power would totally overwhelm the available I/O subsystem , only 2 of the 8 sockets where enabled. This resulted in much more balanced systems from the standpoint of CPU power and I/O capability. However, the conclusions derived from these smaller configurations should also apply to larger CPU and storage configurations, as long as the I/O and CPU subsystems are balanced.
8
Enhancing Oracle Database Performance with Flash Storage
4. Software Environment and Configuration
All experiments were performed using Oracle 11g R2. “Raw” devices, as opposed to UFS or ZFS files, were used for all database tablespaces and redo logs,. The only exceptions were for the ZFS based redo log experiments performed with the flash configuration.
The same database schema, based on a subset of the TPC-H schema [2], was used for both the disk and flash configurations. The TPC-H database contains historical sales data of a hypothetical enterprise that ships orders, of various kinds of parts, on a worldwide basis. Although the TPC-H schema was developed for a decision support benchmark, OLTP operations can be performed on the schema as well.
The queries and transactions used for the various workloads reference the following tables [3]:
• orders
• with columns (o_orderkey, o_custkey, o_orderstatus, o_totalprice, ... )
• lineitem
• with columns (l_orderkey, l_partkey, l_suppkey, l_linenumber.
l_quantity, ...)
• customer
• with columns (c_custkey, c_name, c_address, c_nationkey, c_acctbal, ...)
• nation
• with columns ( n_nationkey, n_name, n_comment, ...)
A complete description of the tables can be found in the TPC-H Benchmark Specification. The total size of the raw data loaded into the database tables was approximately 90 GB.
To keep things on a level playing field, each workload was painstakingly tuned to take full advantage of its respective storage configuration.
9
Enhancing Oracle Database Performance with Flash Storage
5. Flash Storage in Decision Support Environments
Decision support type queries typically scan large amounts of data, and usually, consume significant CPU resources and I/O channel bandwidth. In addition, such queries generally return aggregate, as opposed to detailed, data.
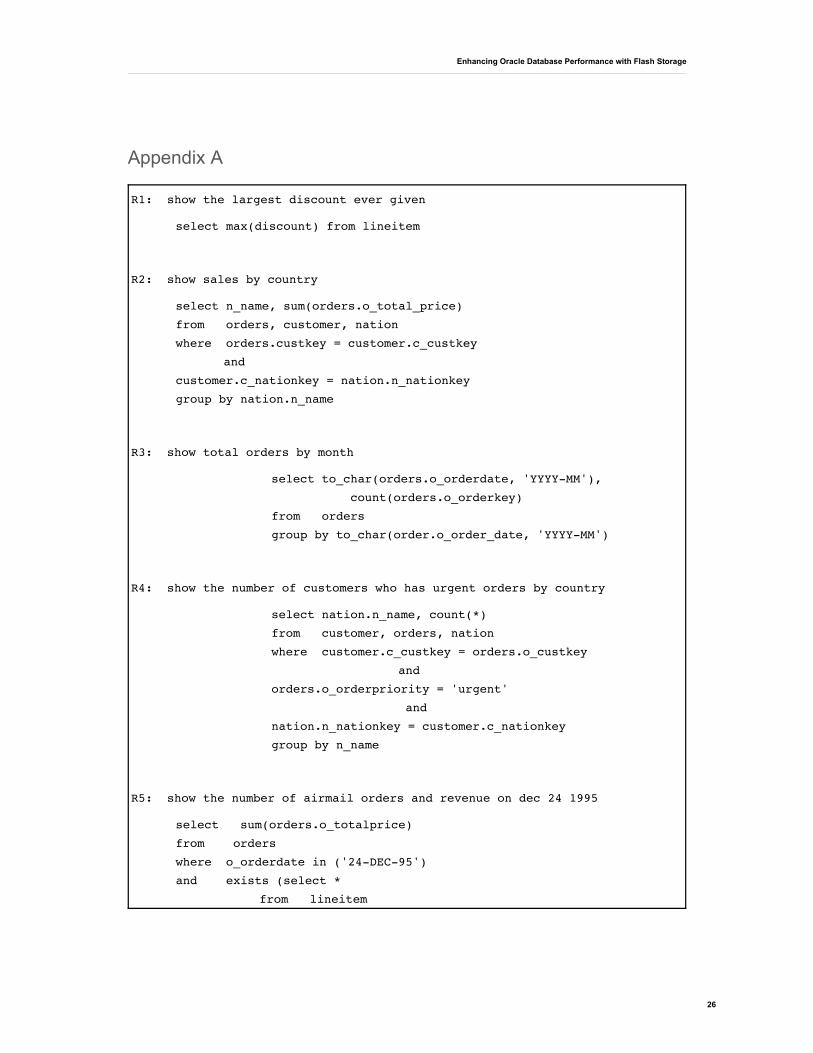
The following questions, whose answers can be found in the subset TPC-H database described above, are typical decision support type queries (the SQL statements for these are shown in Appendix A):
• R1: What is the maximum discount anyone has ever received?
• R2: What are the total revenue breakdowns for each country?
• R3: How many orders were placed in each month?
• R4: How many urgent orders were there in each country?
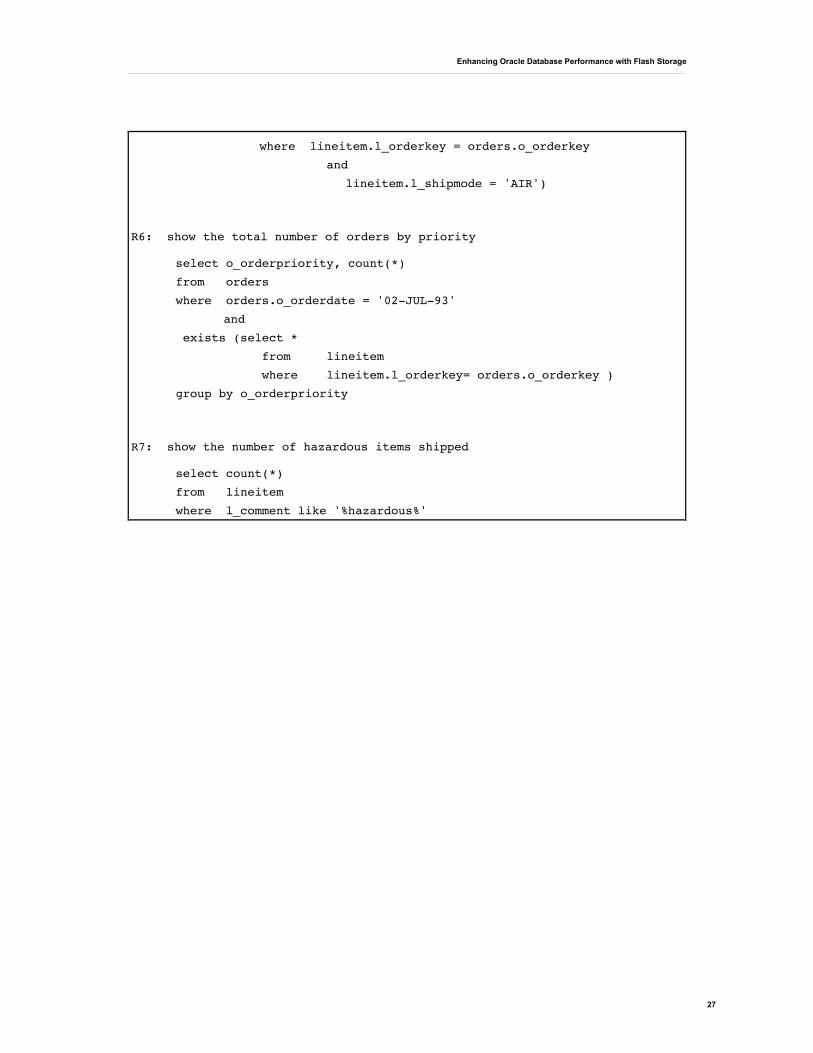
• R5: What was the total revenue for all orders requesting airmail delivery on Dec 24 1995?
• R6: How many orders, of each priority type, were received on July 2 1993?
• R7: How many hazardous items have ever been shipped?
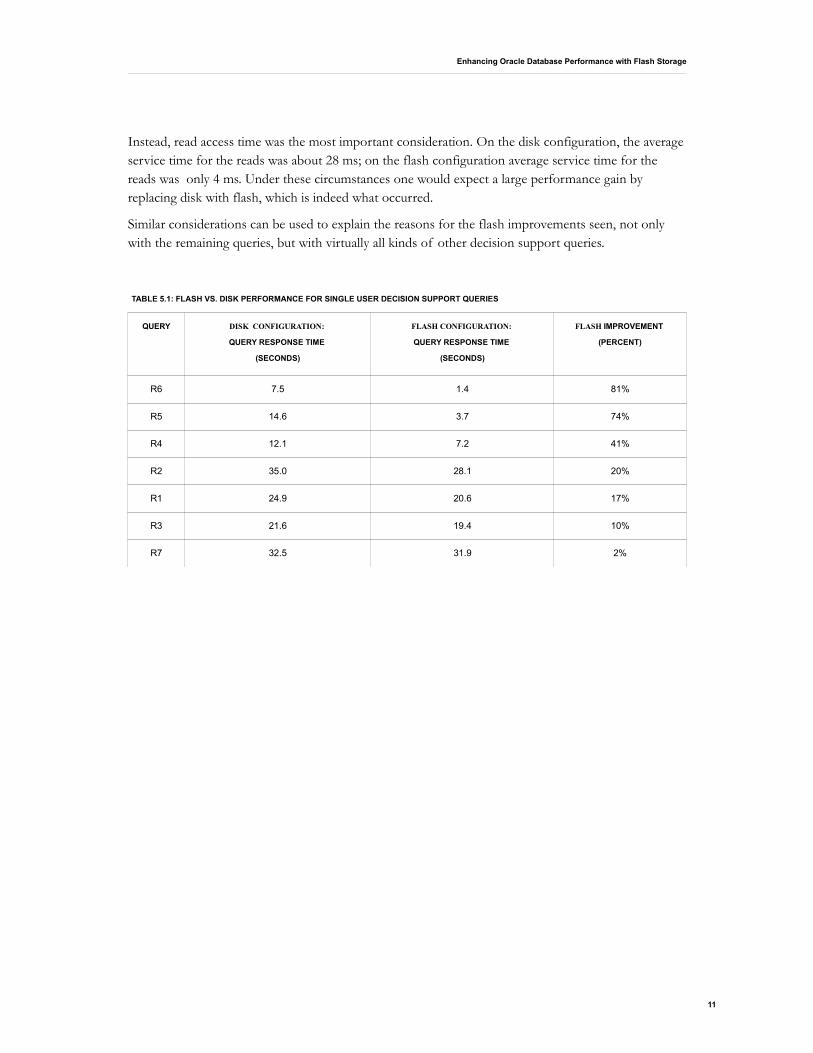
Each of these queries was executed in parallel mode. The response time was used as the metric to judge performance.
The response times are shown in Table 5.1. As is readily seen, the use of flash resulted in response time improvements for all 7 queries. However the degree of improvement varied over a wide range. In some cases (e.g. R5 and R6), flash provided a substantial benefit, whereas in others (e.g. R3 and R7), flash provided a very small benefit. The reasons for the variations become apparent after studying the resource consumption patterns of each query.
For example, the disk version of R7 consumed an average of 1900 MBPS (megabytes/sec) of I/O bandwidth. Since the total I/O channel capacity for the system is about 2000 MBPS, there is at most another 5% of bandwidth that can be squeezed out of the system. The flash version of R7 did manage to consume a little bit of the slack, which accounts for the roughly 2% observed performance improvement.
With Query R3, the CPU was severely bottlenecked in the disk configuration; average CPU utilization was almost 90%. Thus the maximum benefit that could occur with the substitution of faster storage devices is 10%. This is indeed what did occur.
Queries R3 and R7 illustrate a fundamental theorem from queuing network theory, which says that the throughput of a system, comprised of a network of queues, cannot be increased by reducing the service times of non-bottleneck resources, if at least one of the resources is saturated, i.e. operating at nearly 100% utilization [4].
Queries R5 and R6 experienced the most improvement with use of flash. Both of these queries had an average read size of about 32K bytes. Thus I/O channel capacity was nowhere near saturation.
10
Enhancing Oracle Database Performance with Flash Storage
Instead, read access time was the most important consideration. On the disk configuration, the average service time for the reads was about 28 ms; on the flash configuration average service time for the reads was only 4 ms. Under these circumstances one would expect a large performance gain by replacing disk with flash, which is indeed what occurred.
Similar considerations can be used to explain the reasons for the flash improvements seen, not only with the remaining queries, but with virtually all kinds of other decision support queries.
TABLE 5.1: FLASH VS. DISK PERFORMANCE FOR SINGLE USER DECISION SUPPORT QUERIES
QUERY DISK CONFIGURATION:
QUERY RESPONSE TIME
(SECONDS)
FLASH CONFIGURATION:
QUERY RESPONSE TIME
(SECONDS)
FLASH IMPROVEMENT
(PERCENT)
R6 7.5 1.4 81%
R5 14.6 3.7 74%
R4 12.1 7.2 41%
R2 35.0 28.1 20%
R1 24.9 20.6 17%
R3 21.6 19.4 10%
R7 32.5 31.9 2%
11
Enhancing Oracle Database Performance with Flash Storage
6. Flash Storage in OLTP Environments
OLTP type transactions are characterized by lightweight client-server interactions which use minimal CPU resources and access small numbers of rows.
Single SQL statements transactions, with known I/O characteristics were used to simulate various OLTP environments. This methodology is sound in that the SQL statements which were used are, in effect, the building blocks of more realistic workloads.
For each storage configuration, each of the simple transactions were run repeatedly, by an increasing number of users, until the throughput reached a peak. The throughputs and response times were then tabulated and compared.
6.1 OLTP Workloads
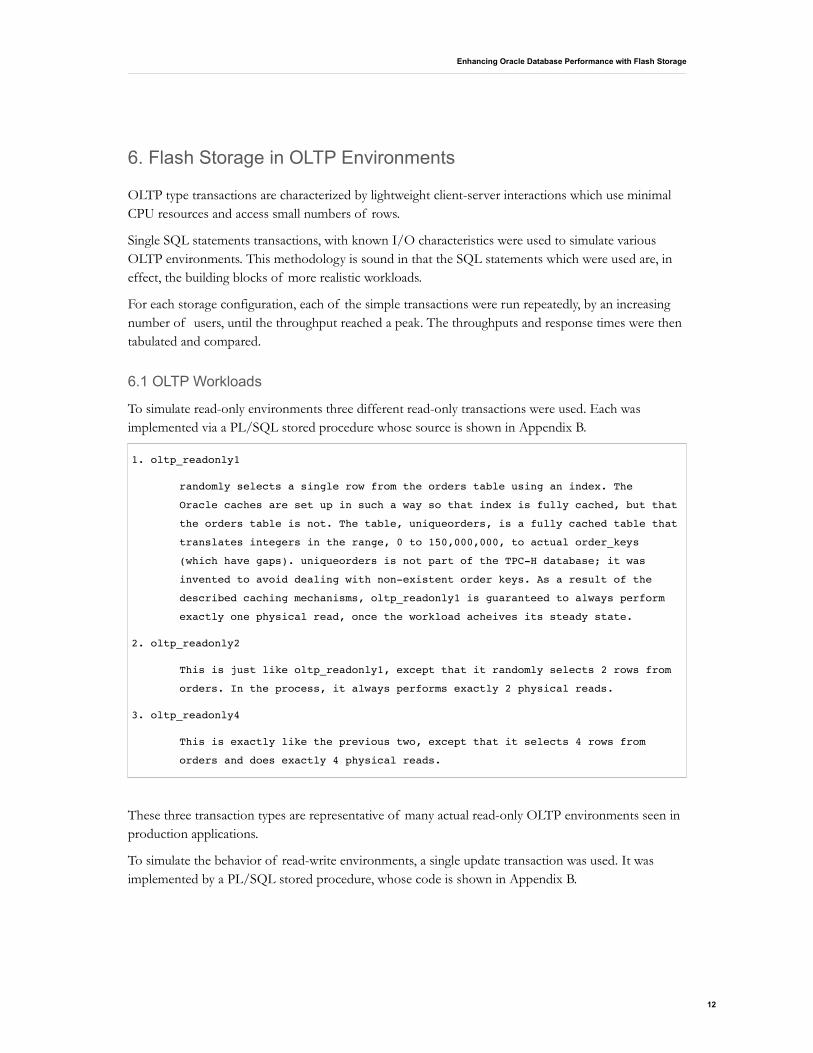
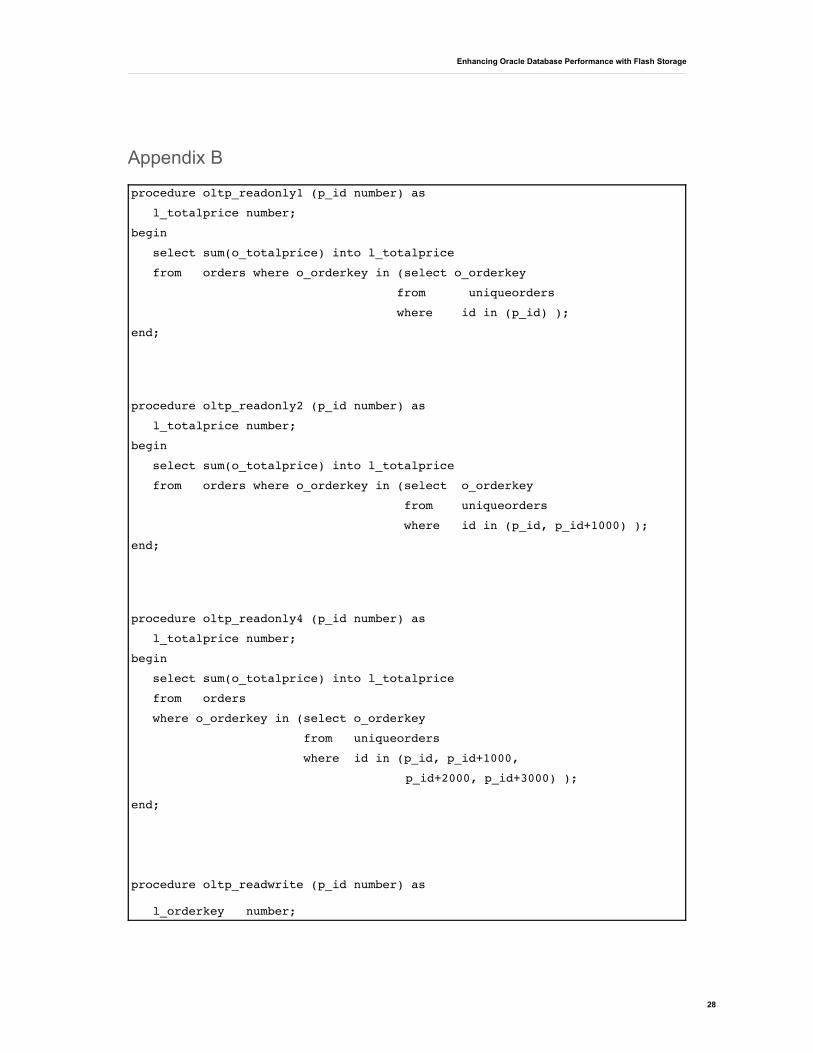
To simulate read-only environments three different read-only transactions were used. Each was implemented via a PL/SQL stored procedure whose source is shown in Appendix B.
1. oltp_readonly1
randomly selects a single row from the orders table using an index. The
Oracle caches are set up in such a way so that index is fully cached, but that
the orders table is not. The table, uniqueorders, is a fully cached table that
translates integers in the range, 0 to 150,000,000, to actual order_keys
(which have gaps). uniqueorders is not part of the TPC-H database; it was
invented to avoid dealing with non-existent order keys. As a result of the
described caching mechanisms, oltp_readonly1 is guaranteed to always perform
exactly one physical read, once the workload acheives its steady state.
2. oltp_readonly2
This is just like oltp_readonly1, except that it randomly selects 2 rows from
orders. In the process, it always performs exactly 2 physical reads.
3. oltp_readonly4
This is exactly like the previous two, except that it selects 4 rows from
orders and does exactly 4 physical reads.
These three transaction types are representative of many actual read-only OLTP environments seen in production applications.
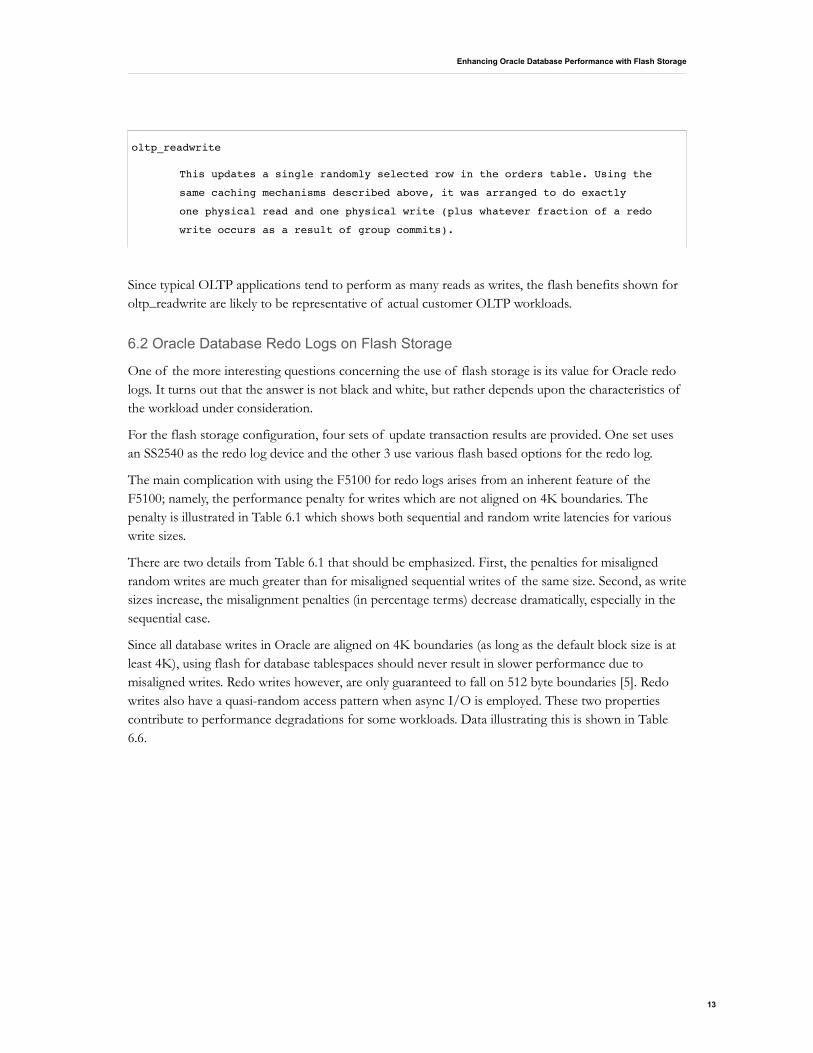
To simulate the behavior of read-write environments, a single update transaction was used. It was implemented by a PL/SQL stored procedure, whose code is shown in Appendix B.
12
Enhancing Oracle Database Performance with Flash Storage
oltp_readwrite
This updates a single randomly selected row in the orders table. Using the
same caching mechanisms described above, it was arranged to do exactly
one physical read and one physical write (plus whatever fraction of a redo
write occurs as a result of group commits).
Since typical OLTP applications tend to perform as many reads as writes, the flash benefits shown for oltp_readwrite are likely to be representative of actual customer OLTP workloads.
6.2 Oracle Database Redo Logs on Flash Storage
One of the more interesting questions concerning the use of flash storage is its value for Oracle redo logs. It turns out that the answer is not black and white, but rather depends upon the characteristics of the workload under consideration.
For the flash storage configuration, four sets of update transaction results are provided. One set uses an SS2540 as the redo log device and the other 3 use various flash based options for the redo log.
The main complication with using the F5100 for redo logs arises from an inherent feature of the F5100; namely, the performance penalty for writes which are not aligned on 4K boundaries. The penalty is illustrated in Table 6.1 which shows both sequential and random write latencies for various write sizes.
There are two details from Table 6.1 that should be emphasized. First, the penalties for misaligned random writes are much greater than for misaligned sequential writes of the same size. Second, as write sizes increase, the misalignment penalties (in percentage terms) decrease dramatically, especially in the sequential case.
Since all database writes in Oracle are aligned on 4K boundaries (as long as the default block size is at least 4K), using flash for database tablespaces should never result in slower performance due to misaligned writes. Redo writes however, are only guaranteed to fall on 512 byte boundaries [5]. Redo writes also have a quasi-random access pattern when async I/O is employed. These two properties contribute to performance degradations for some workloads. Data illustrating this is shown in Table 6.6.
13

Enhancing Oracle Database Performance with Flash Storage
TABLE 6.1: 4K ALIGNED AND MISALIGNED WRITES TO F5100 FLASH MODULES
WRITE SIZE
(BYTES)
AVG. SERVICE TIME
SEQUENTIAL CASE
(MS)
AVG. SERVICE TIME
RANDOM CASE
(MS)
512 0.96 2.48
1024 0.96 2.51
2048 .12 2.26
**4096** 0.11 0.68
4608 0.15 5.35
**8192** 0.17 0.75
12800 0.33 4.16
**16384** 0.27 0.88
31744 0.53 3.79
32256 0.53 4.5
**32768** 0.51 1.18
65024 1.53 5.23
**65536** 1.35 1.46
1048064 15.13 18.43
**1048576** 15.13 14.49
Values surrounded by ** are multiples of 4K
6.3 Read Only Workloads
The following 3 tables compare flash and disk performance for read-only OLTP workloads.
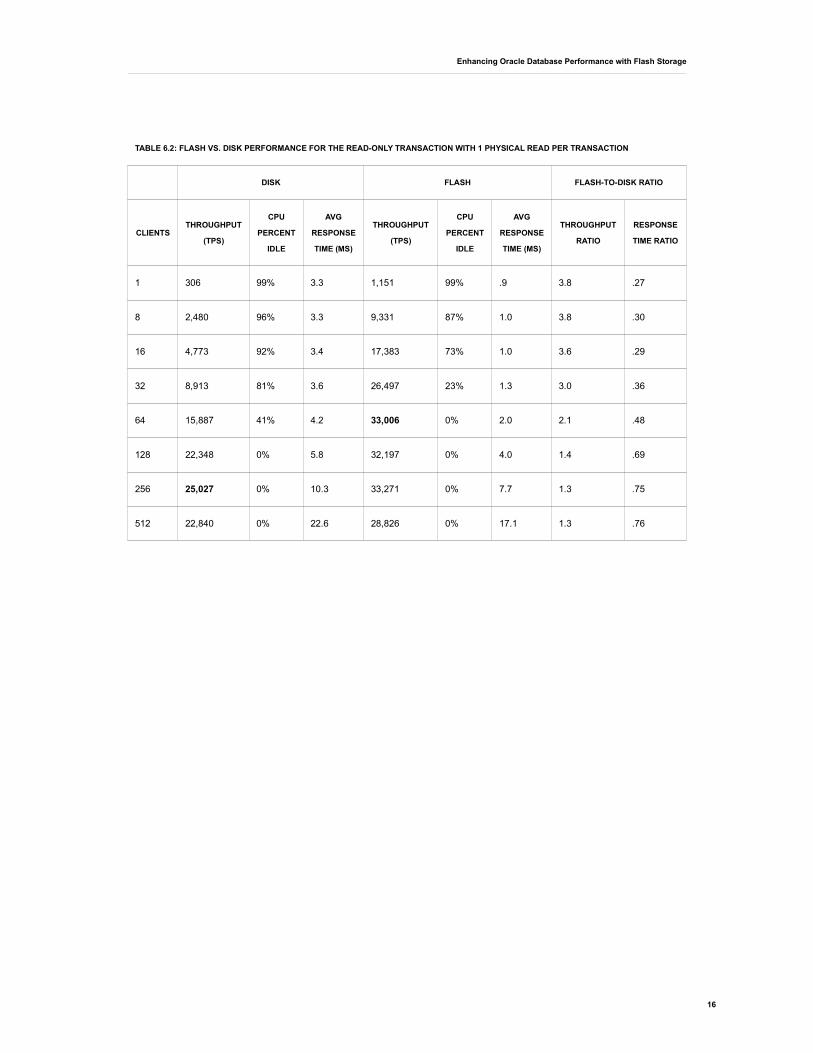
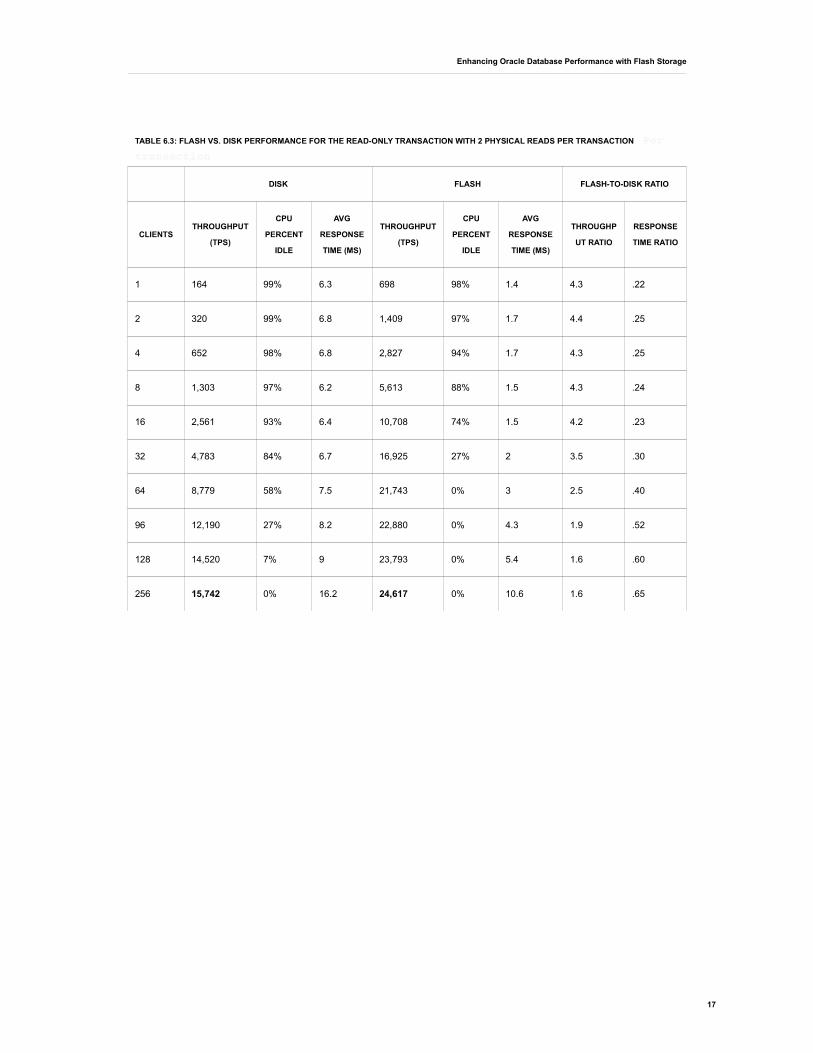
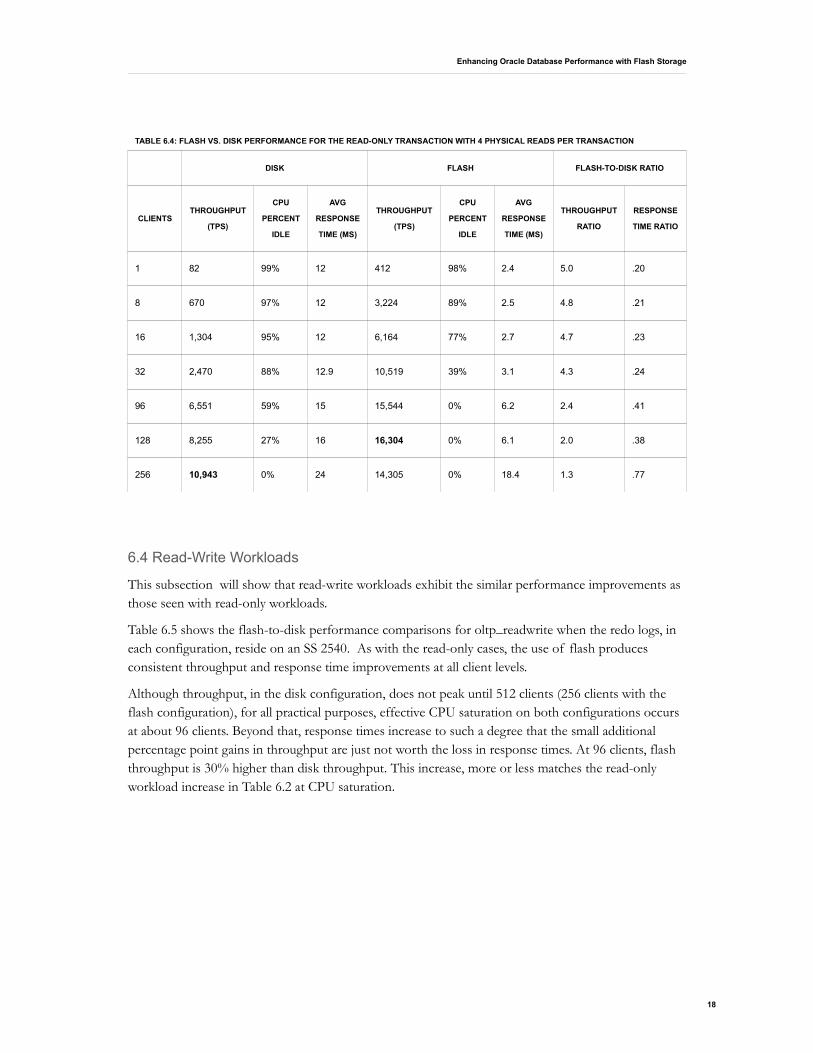
Table 6.2 shows the disk-flash throughput and response time comparisons for oltp_readonly1. Tables 6.3 and 6.4 show the analogous comparisons for oltp_readonly2 and oltp_readonly4.
All 3 tables show that at lightly CPU utilized levels the use of flash storage provides significant performance benefits – up to 80% reductions in response times together with as much as 5 times the throughput. As CPU utilizations increase, the performance benefits of using flash storage decrease (in percentage terms). What is very interesting however, is what happens when the CPUs are completely saturated.
14
Enhancing Oracle Database Performance with Flash Storage
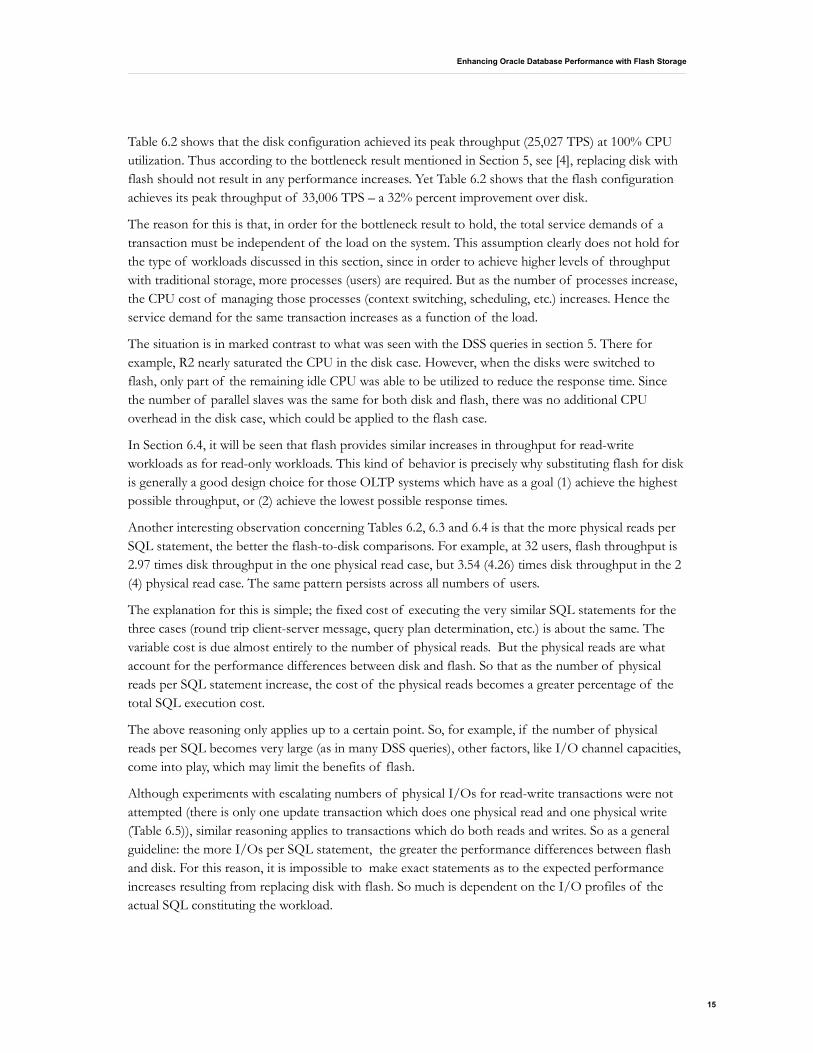
Table 6.2 shows that the disk configuration achieved its peak throughput (25,027 TPS) at 100% CPU utilization. Thus according to the bottleneck result mentioned in Section 5, see [4], replacing disk with flash should not result in any performance increases. Yet Table 6.2 shows that the flash configuration achieves its peak throughput of 33,006 TPS – a 32% percent improvement over disk.
The reason for this is that, in order for the bottleneck result to hold, the total service demands of a transaction must be independent of the load on the system. This assumption clearly does not hold for the type of workloads discussed in this section, since in order to achieve higher levels of throughput with traditional storage, more processes (users) are required. But as the number of processes increase, the CPU cost of managing those processes (context switching, scheduling, etc.) increases. Hence the service demand for the same transaction increases as a function of the load.
The situation is in marked contrast to what was seen with the DSS queries in section 5. There for example, R2 nearly saturated the CPU in the disk case. However, when the disks were switched to flash, only part of the remaining idle CPU was able to be utilized to reduce the response time. Since the number of parallel slaves was the same for both disk and flash, there was no additional CPU overhead in the disk case, which could be applied to the flash case.
In Section 6.4, it will be seen that flash provides similar increases in throughput for read-write workloads as for read-only workloads. This kind of behavior is precisely why substituting flash for disk is generally a good design choice for those OLTP systems which have as a goal (1) achieve the highest possible throughput, or (2) achieve the lowest possible response times.
Another interesting observation concerning Tables 6.2, 6.3 and 6.4 is that the more physical reads per SQL statement, the better the flash-to-disk comparisons. For example, at 32 users, flash throughput is 2.97 times disk throughput in the one physical read case, but 3.54 (4.26) times disk throughput in the 2 (4) physical read case. The same pattern persists across all numbers of users.
The explanation for this is simple; the fixed cost of executing the very similar SQL statements for the three cases (round trip client-server message, query plan determination, etc.) is about the same. The variable cost is due almost entirely to the number of physical reads. But the physical reads are what account for the performance differences between disk and flash. So that as the number of physical reads per SQL statement increase, the cost of the physical reads becomes a greater percentage of the total SQL execution cost.
The above reasoning only applies up to a certain point. So, for example, if the number of physical reads per SQL becomes very large (as in many DSS queries), other factors, like I/O channel capacities, come into play, which may limit the benefits of flash.
Although experiments with escalating numbers of physical I/Os for read-write transactions were not attempted (there is only one update transaction which does one physical read and one physical write (Table 6.5)), similar reasoning applies to transactions which do both reads and writes. So as a general guideline: the more I/Os per SQL statement, the greater the performance differences between flash and disk. For this reason, it is impossible to make exact statements as to the expected performance increases resulting from replacing disk with flash. So much is dependent on the I/O profiles of the actual SQL constituting the workload.
15
Enhancing Oracle Database Performance with Flash Storage
TABLE 6.2: FLASH VS. DISK PERFORMANCE FOR THE READ-ONLY TRANSACTION WITH 1 PHYSICAL READ PER TRANSACTION
DISK FLASH FLASH-TO-DISK RATIO
CLIENTSTHROUGHPUT
(TPS)
CPU
PERCENT
IDLE
AVG
RESPONSE
TIME (MS)
THROUGHPUT
(TPS)
CPU
PERCENT
IDLE
AVG
RESPONSE
TIME (MS)
THROUGHPUT
RATIO
RESPONSE
TIME RATIO
1 306 99% 3.3 1,151 99% .9 3.8 .27
8 2,480 96% 3.3 9,331 87% 1.0 3.8 .30
16 4,773 92% 3.4 17,383 73% 1.0 3.6 .29
32 8,913 81% 3.6 26,497 23% 1.3 3.0 .36
64 15,887 41% 4.2 33,006 0% 2.0 2.1 .48
128 22,348 0% 5.8 32,197 0% 4.0 1.4 .69
256 25,027 0% 10.3 33,271 0% 7.7 1.3 .75
512 22,840 0% 22.6 28,826 0% 17.1 1.3 .76
16
Enhancing Oracle Database Performance with Flash Storage
TABLE 6.3: FLASH VS. DISK PERFORMANCE FOR THE READ-ONLY TRANSACTION WITH 2 PHYSICAL READS PER TRANSACTION Per transaction
DISK FLASH FLASH-TO-DISK RATIO
CLIENTSTHROUGHPUT
(TPS)
CPU
PERCENT
IDLE
AVG
RESPONSE
TIME (MS)
THROUGHPUT
(TPS)
CPU
PERCENT
IDLE
AVG
RESPONSE
TIME (MS)
THROUGHP
UT RATIO
RESPONSE
TIME RATIO
1 164 99% 6.3 698 98% 1.4 4.3 .22
2 320 99% 6.8 1,409 97% 1.7 4.4 .25
4 652 98% 6.8 2,827 94% 1.7 4.3 .25
8 1,303 97% 6.2 5,613 88% 1.5 4.3 .24
16 2,561 93% 6.4 10,708 74% 1.5 4.2 .23
32 4,783 84% 6.7 16,925 27% 2 3.5 .30
64 8,779 58% 7.5 21,743 0% 3 2.5 .40
96 12,190 27% 8.2 22,880 0% 4.3 1.9 .52
128 14,520 7% 9 23,793 0% 5.4 1.6 .60
256 15,742 0% 16.2 24,617 0% 10.6 1.6 .65
17
Enhancing Oracle Database Performance with Flash Storage
TABLE 6.4: FLASH VS. DISK PERFORMANCE FOR THE READ-ONLY TRANSACTION WITH 4 PHYSICAL READS PER TRANSACTION
DISK FLASH FLASH-TO-DISK RATIO
CLIENTSTHROUGHPUT
(TPS)
CPU
PERCENT
IDLE
AVG
RESPONSE
TIME (MS)
THROUGHPUT
(TPS)
CPU
PERCENT
IDLE
AVG
RESPONSE
TIME (MS)
THROUGHPUT
RATIO
RESPONSE
TIME RATIO
1 82 99% 12 412 98% 2.4 5.0 .20
8 670 97% 12 3,224 89% 2.5 4.8 .21
16 1,304 95% 12 6,164 77% 2.7 4.7 .23
32 2,470 88% 12.9 10,519 39% 3.1 4.3 .24
96 6,551 59% 15 15,544 0% 6.2 2.4 .41
128 8,255 27% 16 16,304 0% 6.1 2.0 .38
256 10,943 0% 24 14,305 0% 18.4 1.3 .77
6.4 Read-Write Workloads
This subsection will show that read-write workloads exhibit the similar performance improvements as those seen with read-only workloads.
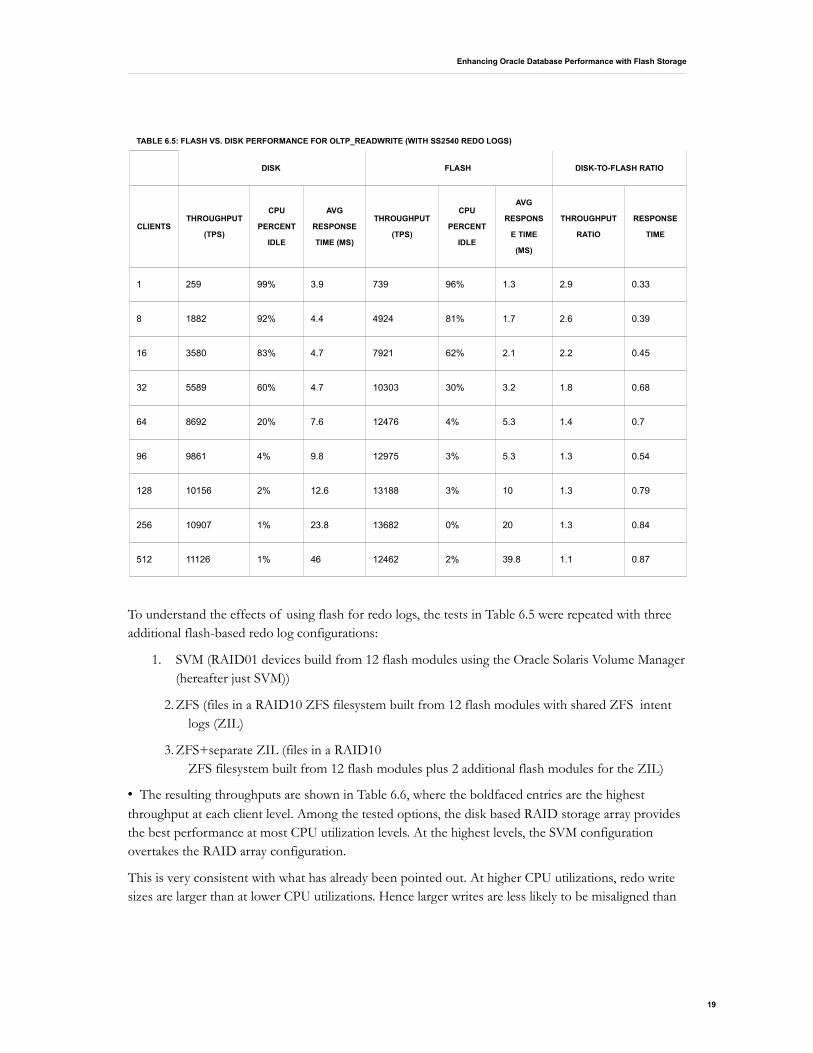
Table 6.5 shows the flash-to-disk performance comparisons for oltp_readwrite when the redo logs, in each configuration, reside on an SS 2540. As with the read-only cases, the use of flash produces consistent throughput and response time improvements at all client levels.
Although throughput, in the disk configuration, does not peak until 512 clients (256 clients with the flash configuration), for all practical purposes, effective CPU saturation on both configurations occurs at about 96 clients. Beyond that, response times increase to such a degree that the small additional percentage point gains in throughput are just not worth the loss in response times. At 96 clients, flash throughput is 30% higher than disk throughput. This increase, more or less matches the read-only workload increase in Table 6.2 at CPU saturation.
18
Enhancing Oracle Database Performance with Flash Storage
TABLE 6.5: FLASH VS. DISK PERFORMANCE FOR OLTP_READWRITE (WITH SS2540 REDO LOGS)
DISK FLASH DISK-TO-FLASH RATIO
CLIENTSTHROUGHPUT
(TPS)
CPU
PERCENT
IDLE
AVG
RESPONSE
TIME (MS)
THROUGHPUT
(TPS)
CPU
PERCENT
IDLE
AVG
RESPONS
E TIME
(MS)
THROUGHPUT
RATIO
RESPONSE
TIME
1 259 99% 3.9 739 96% 1.3 2.9 0.33
8 1882 92% 4.4 4924 81% 1.7 2.6 0.39
16 3580 83% 4.7 7921 62% 2.1 2.2 0.45
32 5589 60% 4.7 10303 30% 3.2 1.8 0.68
64 8692 20% 7.6 12476 4% 5.3 1.4 0.7
96 9861 4% 9.8 12975 3% 5.3 1.3 0.54
128 10156 2% 12.6 13188 3% 10 1.3 0.79
256 10907 1% 23.8 13682 0% 20 1.3 0.84
512 11126 1% 46 12462 2% 39.8 1.1 0.87
To understand the effects of using flash for redo logs, the tests in Table 6.5 were repeated with three additional flash-based redo log configurations:
1. SVM (RAID01 devices build from 12 flash modules using the Oracle Solaris Volume Manager (hereafter just SVM))
2. ZFS (files in a RAID10 ZFS filesystem built from 12 flash modules with shared ZFS intent logs (ZIL)
3. ZFS+separate ZIL (files in a RAID10 ZFS filesystem built from 12 flash modules plus 2 additional flash modules for the ZIL)
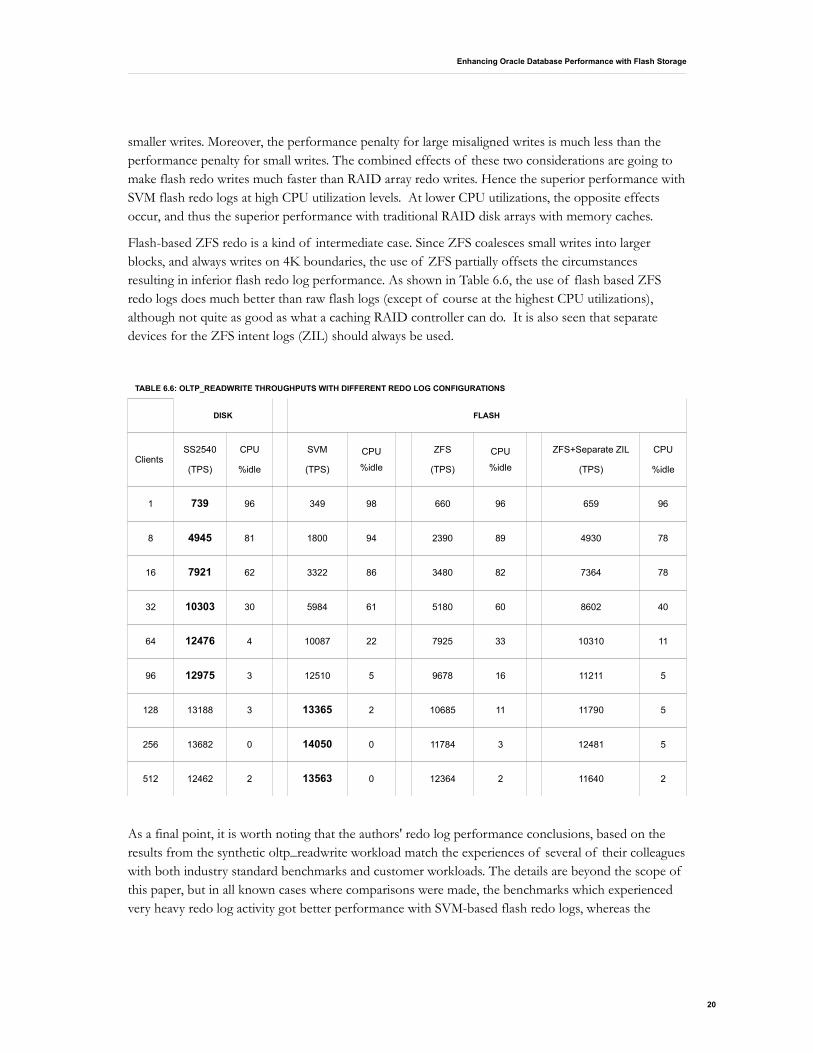
• The resulting throughputs are shown in Table 6.6, where the boldfaced entries are the highest throughput at each client level. Among the tested options, the disk based RAID storage array provides the best performance at most CPU utilization levels. At the highest levels, the SVM configuration overtakes the RAID array configuration.
This is very consistent with what has already been pointed out. At higher CPU utilizations, redo write sizes are larger than at lower CPU utilizations. Hence larger writes are less likely to be misaligned than
19
Enhancing Oracle Database Performance with Flash Storage
smaller writes. Moreover, the performance penalty for large misaligned writes is much less than the performance penalty for small writes. The combined effects of these two considerations are going to make flash redo writes much faster than RAID array redo writes. Hence the superior performance with SVM flash redo logs at high CPU utilization levels. At lower CPU utilizations, the opposite effects occur, and thus the superior performance with traditional RAID disk arrays with memory caches.
Flash-based ZFS redo is a kind of intermediate case. Since ZFS coalesces small writes into larger blocks, and always writes on 4K boundaries, the use of ZFS partially offsets the circumstances resulting in inferior flash redo log performance. As shown in Table 6.6, the use of flash based ZFS redo logs does much better than raw flash logs (except of course at the highest CPU utilizations), although not quite as good as what a caching RAID controller can do. It is also seen that separate devices for the ZFS intent logs (ZIL) should always be used.
TABLE 6.6: OLTP_READWRITE THROUGHPUTS WITH DIFFERENT REDO LOG CONFIGURATIONS
DISK FLASH
ClientsSS2540
(TPS)
CPU
%idle
SVM
(TPS)
CPU
%idle
ZFS
(TPS)
CPU
%idle
ZFS+Separate ZIL
(TPS)
CPU
%idle
1 739 96 349 98 660 96 659 96
8 4945 81 1800 94 2390 89 4930 78
16 7921 62 3322 86 3480 82 7364 78
32 10303 30 5984 61 5180 60 8602 40
64 12476 4 10087 22 7925 33 10310 11
96 12975 3 12510 5 9678 16 11211 5
128 13188 3 13365 2 10685 11 11790 5
256 13682 0 14050 0 11784 3 12481 5
512 12462 2 13563 0 12364 2 11640 2
As a final point, it is worth noting that the authors' redo log performance conclusions, based on the results from the synthetic oltp_readwrite workload match the experiences of several of their colleagues with both industry standard benchmarks and customer workloads. The details are beyond the scope of this paper, but in all known cases where comparisons were made, the benchmarks which experienced very heavy redo log activity got better performance with SVM-based flash redo logs, whereas the
20

Enhancing Oracle Database Performance with Flash Storage
benchmarks which experienced light redo activity got much performance with RAID array based redo logs.
21
Enhancing Oracle Database Performance with Flash Storage
7. Flash Storage and Database Maintenance
This section examines four database tasks of a maintenance nature. None of these tasks are performed very frequently, but since each can take a long time, any speedups can be significant from the perspective of overall data center operations. It will be seen that the use of flash provides performance gains in all four cases.
7.1 Database Loading
The four tables comprising the database schema described in Section 4 were populated from roughly 90 GB of raw ASCII data. To utilize the I/O subsystems to their full capability (and achieve the best possible load time), an optimized parallel load technique was used to load the raw data into each of the databases.
When the tables were stored on conventional disks the load took 80 minutes. When the tables were stored on the F5100, the load took only 54 minutes. The resulting 33% reduction in load time shows once again how the use of flash storage can provide a significant performance benefit over the use of conventional disks.
Note that in both cases, the raw ASCII data was stored on conventional disks. So the difference between the disk and flash cases is only on writes to their respective databases. Thus, here is an example of a write-only operation where flash is faster than disk.
7.2 Index Creation
After the tables were loaded, several indexes were created on each table. On the flash configuration index creation took about 20% less time than on the disk configuration.
More specifically, the lineitem table consisted of roughly half-a-billion rows. The creation of an index on the order_id column took 135 seconds when lineitem resided on conventional storage but only 106seconds when lineitem resided on flash –a roughly 20% advantage in favor of flash. The 20% improvement was typical for creating other indexes as well. Note that both reads and writes are involved with index creation.
7.3 Database backups
Oracle provides several different database backup options (off-line, online. incremental, etc.). For some types of backups, the time it takes to do a backup is directly proportional to the physical size of the database. For others there are external factors, independent of the database size, which affect database backup times. Since these external factors are too numerous and difficult to simulate, backup studies were confined to “cold” (or offline) backups, where backup times depend only on physical size of the database.
For both the flash and conventional disk cases an SS2540 (12x73GB 15K RPM SAS drives) was used for the backup location. The flash implementation was roughly 25% faster.
22
Enhancing Oracle Database Performance with Flash Storage
Specifically, it took 4,702 seconds to do a backup of a 420 GB tablespace residing on a conventional disk configuration, but only 3,738 seconds for the same sized tablespace residing on flash.
Had flash storage been used as the backup device, the backup time difference would have been even more dramatic.
7.4 Database Recovery
After an Oracle instance crash -- regardless of whether the cause is due to a hardware, operating system or a database software failure – the Oracle database has mechanisms to recover the database to its state at the time of the last committed transaction. Different mechanisms, depending upon the specific type of recovery performed, are used to do the actual recovery, but all the mechanisms involve essentially two steps:
(1) replaying committed transactions in the appropriate redo logs and
(2) rolling back the effects of un-committed transactions in those same logs.
The results of the experiment described below show that when the database and the redo logs are stored on flash devices the time to recover is 6 times faster than when conventional disks are used for the database and redo logs.
This was determined by setting the Oracle database buffer pool size and the checkpoint interval size so that it was possible to accumulate more than 20 GB of redo log data before a checkpoint would occur. A concurrent set of read-write transactions was then run until the redo log grew to about 7 GB. At that point the Oracle database was crashed and restarted. Upon restart, the database software automatically replayed and aborted all the necessary transactions in the 7 GB of redo data. The same experiment was performed on both the flash database (with a flash redo log) and the disk database (with an SS2540-based redo log). In the disk case, the time for recovery was 400 seconds, whereas in the flash case, the time for recovery was 60 seconds.
Once the time for replaying a single log of a known size is determined, then the time to replay any number of logs, of any size, can be easily calculated. Thus the crash recovery experiment should be sufficient to get a handle on recovery times for more complicated scenarios.
Since system availability is directly dependent upon the mean time for system repair (together with the mean time to failure), fast recovery times are vital when designing highly available systems. The use of flash thus provides a very simple way to increase Oracle availability by decreasing recovery times.
Of course no one interested in designing highly available systems would allow an online redo log to grow to 7 GB without intervening checkpoints. Thus it is not suggested that the recovery experiment described above is at all realistic. It was designed only as a means of measuring recovery time as a function of redo size. The 6 to 1 ratio will apply to any amount of redo, both large and small.
23
Enhancing Oracle Database Performance with Flash Storage
8. Conclusions
In Sections 5, 6 and 7, a number of examples of Oracle database workloads, which exhibit important performance benefits when flash devices are used in place of conventional storage, were described. Only two situations were found where flash provides little or no benefit, and one additional area was identified where flash can actually be detrimental to performance.
The two situations where the use of flash is of little benefit are with decision support queries whose disk versions either (1) come close to saturating the CPUs or (2) come close to saturating the I/O channels. In these case, substituting conventional disks with faster storage devices can only improve query response times to the degree that there is some excess CPU, or channel capacity, left over from the disk configuration. R3 (from Section 5) is an example of the first case and R7 (from Section 5) is an example of the second case.
The area where the use of flash can actually degrade performance is with redo logs. Under very heavy loads flash is the right choice for redo logs, but under light to moderate loads, RAID storage arrays with memory caches will generally provide better performance.
Overall, the use of flash provides the greatest performance benefits in environments which do large numbers of small reads and small writes. Most types of indexed accesses fall into this category. In such cases, I/O channel capacity is never an issue. Even at throughput levels where disk based systems actually saturate the CPUs, the replacement of disk with flash provided additional throughput. OLTP is the primary application area with these characteristics, but some types of DSS queries also match these characteristics.
The performance gains resulting from the use of flash, together with the other benefits provided by flash – reduced power consumption, reduced floorspace requirements[6], increased reliability, and the like – make flash a compelling option for the Oracle database environment. That flash has not yet been adopted by the user community, on a more widespread basis, is probably due to its novelty, together with its perceived cost disadvantages. The cost issues were addressed in section 2, where it was argued that using F5100 flash devices could actually be considerably cheaper than using conventional storage for some types of applications.
As for the novelty, it is hoped that the results and arguments presented in this paper will help to remove any doubts about the value of flash for Oracle database environments.
24

Enhancing Oracle Database Performance with Flash Storage
Acknowledgments
The authors would like to thank Kevin P. Kelly, Peter Yakutis and Sriram Gummuluru for their helpful insights. They would also like to thank Guido Ficco for his support and encouragement.
25
Enhancing Oracle Database Performance with Flash Storage
Appendix A
R1: show the largest discount ever given
select max(discount) from lineitem
R2: show sales by country
select n_name, sum(orders.o_total_price)
from orders, customer, nation
where orders.custkey = customer.c_custkey
and
customer.c_nationkey = nation.n_nationkey
group by nation.n_name
R3: show total orders by month
select to_char(orders.o_orderdate, 'YYYY-MM'),
count(orders.o_orderkey)
from orders
group by to_char(order.o_order_date, 'YYYY-MM')
R4: show the number of customers who has urgent orders by country
select nation.n_name, count(*)
from customer, orders, nation
where customer.c_custkey = orders.o_custkey
and
orders.o_orderpriority = 'urgent'
and
nation.n_nationkey = customer.c_nationkey
group by n_name
R5: show the number of airmail orders and revenue on dec 24 1995
select sum(orders.o_totalprice)
from orders
where o_orderdate in ('24-DEC-95')
and exists (select *
from lineitem
26
Enhancing Oracle Database Performance with Flash Storage
where lineitem.l_orderkey = orders.o_orderkey
and
lineitem.l_shipmode = 'AIR')
R6: show the total number of orders by priority
select o_orderpriority, count(*)
from orders
where orders.o_orderdate = '02-JUL-93'
and
exists (select *
from lineitem
where lineitem.l_orderkey= orders.o_orderkey )
group by o_orderpriority
R7: show the number of hazardous items shipped
select count(*)
from lineitem
where l_comment like '%hazardous%'
27
Enhancing Oracle Database Performance with Flash Storage
Appendix B
procedure oltp_readonly1 (p_id number) as
l_totalprice number;
begin
select sum(o_totalprice) into l_totalprice
from orders where o_orderkey in (select o_orderkey
from uniqueorders
where id in (p_id) );
end;
procedure oltp_readonly2 (p_id number) as
l_totalprice number;
begin
select sum(o_totalprice) into l_totalprice
from orders where o_orderkey in (select o_orderkey
from uniqueorders
where id in (p_id, p_id+1000) );
end;
procedure oltp_readonly4 (p_id number) as
l_totalprice number;
begin
select sum(o_totalprice) into l_totalprice
from orders
where o_orderkey in (select o_orderkey
from uniqueorders
where id in (p_id, p_id+1000,
p_id+2000, p_id+3000) );
end;
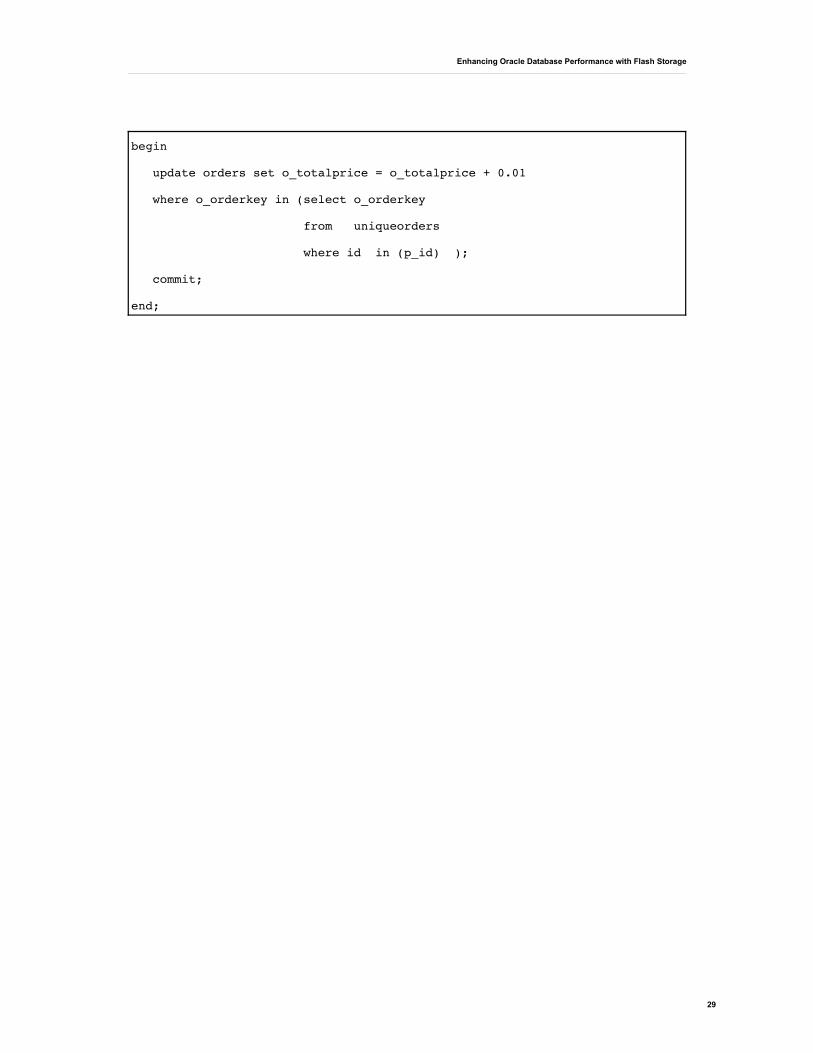
procedure oltp_readwrite (p_id number) as
l_orderkey number;
28
Enhancing Oracle Database Performance with Flash Storage
begin
update orders set o_totalprice = o_totalprice + 0.01
where o_orderkey in (select o_orderkey
from uniqueorders
where id in (p_id) );
commit;
end;
29
Enhancing Oracle Database Performance with Flash Storage
Endnotes
[1] Another metric for making price-performance comparisons for storage is what might be called “$/effective GB”, or “$/usable GB”. As already noted, when conventional disks are used for high performance storage oriented applications, the application data must be spread out across a large number of spindles. In such cases, most of the capacity of a conventional storage subsystem is wasted. The part that is actually used is the effective (or usable) part. Thus $/effective GB is arguably a more meaningful measure of price performance than $/GB. Since with flash, effective capacity almost always equals actual capacity, the $/effective GB metric shows that flash can actually be cheaper than conventional storage for many applications.
[2] A description of the TPC-H schema, together with the complete benchmark specification can be found at http://tpc.org/tpch/spec/tpch2.11.0.pdf. TPC-H Benchmark is a registered trademark of� the Transaction Processing Performance Council.
[3] It should be noted that although parts of the TPC-H schema were used for the table definitions, and the TPC developed dbgen program was used to create the data for populating the tables, all of the queries and transactions discussed in this paper were invented by the authors. Thus the work described here has no relation to, nor should it be compared, in any way, to any published TPC-H result.
[4] Any good book on computer system performance modeling has a section on bottleneck analysis, where the result is discussed. A very clear discussion can be found in: The Art of Computer System Performance Analysis, Raj Jain, Wiley 1991, pages 563 – 567.
[5] This has been changed in Oracle 11R2, with the addition of a 'BLOCKSIZE' option to the 'ALTER DATABASE ADD LOGFILE' command. This option, which is (as of October 2010) not available for Oracle on versions of Solaris, guarantees that redo writes will be a multiple of BLOCKSIZE, and thus aligned on BLOCKSIZE boundaries. The availability of this option will likely change the stated conclusions about flash based redo logs.
[6] A comparison of the flash and conventional configurations used for this study are indicative of the kind of savings in floorspace that the F5100 can provide. Assuming that flash redo logs are used, the flash configuration consumes a total of 6 U (5 U for the M5000 and 1 U for the F51000). By contrast, the conventional configuration consumes a total of 19 U (5 for the M5000, 2 U for each of the six J4200 arrays and 2 U for the SS2540).
30
Enhancing Oracle Database Performance with Flash StorageNovember 2010Author: Richard Gostanian and Senthil Ramanujam
Oracle CorporationWorld Headquarters500 Oracle ParkwayRedwood Shores, CA 94065U.S.A.
Worldwide Inquiries:Phone: +1.650.506.7000Fax: +1.650.506.7200oracle.com
Copyright © 2010, Oracle and/or its affiliates. All rights reserved. This document is provided for information purposes only and the contents hereof are subject to change without notice. This document is not warranted to be error-free, nor subject to any other warranties or conditions, whether expressed orally or implied in law, including implied warranties and conditions of merchantability or fitness for a particular purpose. We specifically disclaim any liability with respect to this document and no contractual obligations are formed either directly or indirectly by this document. This document may not be reproduced or transmitted in any form or by any means, electronic or mechanical, for any purpose, without our prior written permission.
Oracle and Java are registered trademarks of Oracle and/or its affiliates. Other names may be trademarks of their respective owners.
AMD, Opteron, the AMD logo, and the AMD Opteron logo are trademarks or registered trademarks of Advanced Micro Devices. Intel and Intel Xeon are trademarks or registered trademarks of Intel Corporation. All SPARC trademarks are used under license and are trademarks or registered trademarks of SPARC International, Inc. UNIX is a registered trademark licensed through X/Open Company, Ltd. 0410