ENHANCEMENT OF THE EAF DUST RECYCLING IN SELF-...
10
VINCENT PIRET 1 , MARCOS LOPES 2 ENHANCEMENT OF THE EAF DUST RECYCLING IN SELF- REDUCING BRIQUETTES BY CONTROLLING THEIR HYDRATION BEHAVIOUR Abstract The steel production via the EAF route produces free lime containing dust. In the case of carbon steel production, the main dust recycling process is the Waelz furnace, allowing the recovery of zinc but not of Fe. In the case of stainless steel production, the recovery of valuable alloying elements (a.o. nickel, chromium, and molybdenum) can be achieved by recycling the dust in the form of self-reducing briquettes into a liquid steel bath. A hydration step is mandatory before the briquetting of free lime bearing dust in order to avoid swelling and degradation of the produced briquettes. The amount of added water must be well controlled in order to ensure the full hydration and also to limit the residual humidity to avoid the need for a subsequent drying step. A straightforward methodology for the determination of the free lime content and of the water amount to be added has been developed and validated. Hydration trials have been carried out to study the respective impacts of the dust nature, the temperature and added water on the reaction kinetics. Industrial trials have confirmed that the behaviour is the same at pilot and industrial scales. Keywords: EAF dust recycling, stainless steel, hydration, self-reducing briquettes, free lime, hydrated lime. List of symbols EAF: Electric Arc Furnace CaO: Calcium Oxide, Free Lime Ca(OH)2: Calcium Hydroxide, Hydrated Lime DTA Differential Thermal Analysis XRF: X-Ray Fluorescence XRD: X-Ray Diffraction Catot: Calcium Total SEM: Scanning Electron Microscope EDX: Energy Dispersive X-ray 1 CRM Group, Avenue du Bois Saint Jean 21, 4000 Liège, BELGIUM 2 Aperam R&D, BP15 Rue Roger Salengro, 62330 Isbergues, FRANCE
Transcript of ENHANCEMENT OF THE EAF DUST RECYCLING IN SELF-...

VINCENT PIRET1, MARCOS LOPES2
ENHANCEMENT OF THE EAF DUST RECYCLING IN SELF-
REDUCING BRIQUETTES BY CONTROLLING THEIR HYDRATION
BEHAVIOUR
Abstract
The steel production via the EAF route produces free lime containing dust. In the case of
carbon steel production, the main dust recycling process is the Waelz furnace, allowing the
recovery of zinc but not of Fe. In the case of stainless steel production, the recovery of
valuable alloying elements (a.o. nickel, chromium, and molybdenum) can be achieved by
recycling the dust in the form of self-reducing briquettes into a liquid steel bath. A hydration
step is mandatory before the briquetting of free lime bearing dust in order to avoid swelling
and degradation of the produced briquettes.
The amount of added water must be well controlled in order to ensure the full hydration and
also to limit the residual humidity to avoid the need for a subsequent drying step. A
straightforward methodology for the determination of the free lime content and of the water
amount to be added has been developed and validated. Hydration trials have been carried out
to study the respective impacts of the dust nature, the temperature and added water on the
reaction kinetics. Industrial trials have confirmed that the behaviour is the same at pilot and
industrial scales.
Keywords: EAF dust recycling, stainless steel, hydration, self-reducing briquettes, free lime,
hydrated lime.
List of symbols
EAF: Electric Arc Furnace
CaO: Calcium Oxide, Free Lime
Ca(OH)2: Calcium Hydroxide, Hydrated Lime
DTA Differential Thermal Analysis
XRF: X-Ray Fluorescence
XRD: X-Ray Diffraction
Catot: Calcium Total
SEM: Scanning Electron Microscope
EDX: Energy Dispersive X-ray
1 CRM Group, Avenue du Bois Saint Jean 21, 4000 Liège, BELGIUM 2 Aperam R&D, BP15 Rue Roger Salengro, 62330 Isbergues, FRANCE

1. Introduction
The steel production via EAF route produces free lime containing dust [1]. In the case of
carbon steel production, the main dust recycling process is the Waelz furnace [2], allowing
the recovery of zinc (in the off gas) but not of Fe which is fully oxidized in slag phase. In the
case of stainless steel production, the presence of valuable alloying elements (a.o. nickel,
chromium, and molybdenum) in the dust is a driver to treat them in another process in which
those elements can be recovered.
Since 2010, Recyco (an Aperam SA subsidiary located in France), has developed and
operates a recycling pyrometallurgical process [3]. First, by-products from the stainless steel
industry (dust and sludge) are mixed with a reducing agent and then roll pressed to produce
self-reducing briquettes. After curing at room temperature, the briquettes are charged in an
EAF to produce ferroalloys which are sent to the by-products producers and the slag
valorised as construction material. In 2015, the plant has successfully treated 50 000 tonnes
of stainless steel by-products. Co-processing dust and sludge, if mixed in controlled
proportion with binder, reducing agent and flux, allows reaching nearly 100% of the EAF
input in the form of self-reducing briquettes. The amount of each material in the recipe is
chosen depending of the targeted final products composition, availability of the material,
mechanical requirements for the briquettes …
In order to briquette a mix containing free lime bearing materials, a hydration step is
mandatory before the compaction. The free lime contained in the dust reacts with water
(Equation 1) to form hydrated lime, the reaction produces heat and the swelling on the dust.
CaO + H2O Ca(OH)2 + heat (1)
As the briquetting process of oxidised materials requires a binder witch is often dispersed
with water [4] and as the mix contains water from non-dried sludge, the hydration reaction
and consequently the swelling behaviour cannot be avoided. The Figure 1 shows the
detrimental effect of the use of non-hydrated dust on mechanical properties. The briquettes
seem of good quality at the output of the press but swell and crack after a few hours due the
lime hydration inside the briquette.
Fig1: briquettes at the output of the press (left), after hydration within the briquettes (right)
Therefore, the hydration reaction must be completed before compaction. Industrially, the free
lime bearing dusts are mixed with water in order to obtain after reaction a wet powder that

can safely be introduced in the mixer together with the other materials. The amount of water
added must be well controlled in order to ensure the completion of the hydration reaction and
avoid a costly drying step.
The work presented in this paper presents a straightforward methodology to determine the
amount of free lime contained in the dust, which can be directly related to the minimal
amount of water needed for the completion of the hydration. The main part of this paper is
focussed on the key factors influencing the kinetics of the free lime hydration reaction within
the dust. Tests have been performed at pilot and industrial scale.
2. Experimental setup
Free lime measurement
The most used techniques for the determination of “free lime” (ASTM C114) are the Franke
method using acetaocetic ester and the Lerch and Bogue method using glycerol-alcohol [5].
Those methods were developed for the determination of free lime within Portland cement and
do not distinguish the calcium oxide (CaO or free lime in this paper) from the calcium
hydroxide (Ca(OH)2 or hydrated lime in this paper) [6]. Other authors use DTA [7-8] analysis
to determine the amount of Ca(OH)2 or XRD [9] for CaO determination. In EAF dust,
another method consists in a XRF analysis for dosing Catot [10].
As those techniques were mainly devoted to cement analysis and as the CaO content is not
determined by a direct measurement, CRM has decided to develop a straightforward
methodology to evaluate the available free lime amount in a dust. For the free lime hydration
study, the amount of water needed for finishing the reaction between water and the dust is the
parameter of interest. The water is mainly needed for the reaction with CaO, but also with
MgO or other compounds of the dust.
The measurement principle is the following: the dust is mixed with a defined excess of
demineralised water, after defined mixing time, the solution is dried at 105°C. The weight
gain of the sample is accounted for water chemically linked with the dust, which is mainly in
the form of Ca(OH)2.
Setup of the hydration reaction monitoring
Two parameters have been monitored during the hydration trials, the temperature
(thermocouple measurement) and the electrical resistance of the dust. The follow up of the
temperature allows indirect measurement of the heat released by the reaction and the
electrical resistance is related to the water repartition. The resistance is obtained by the
measurement of the current circulating in the dust under a continuous potential difference of
25V. The Figure 2 presents a schematic view and a picture of the used device. For practical
reasons, the current flowing through the device will be used instead of the electrical
resistance. In this system, one variable can be easily obtained from the other by using the
Ohm’s law (Equation 2).
U [V] = R [Ω] I[A] (2)
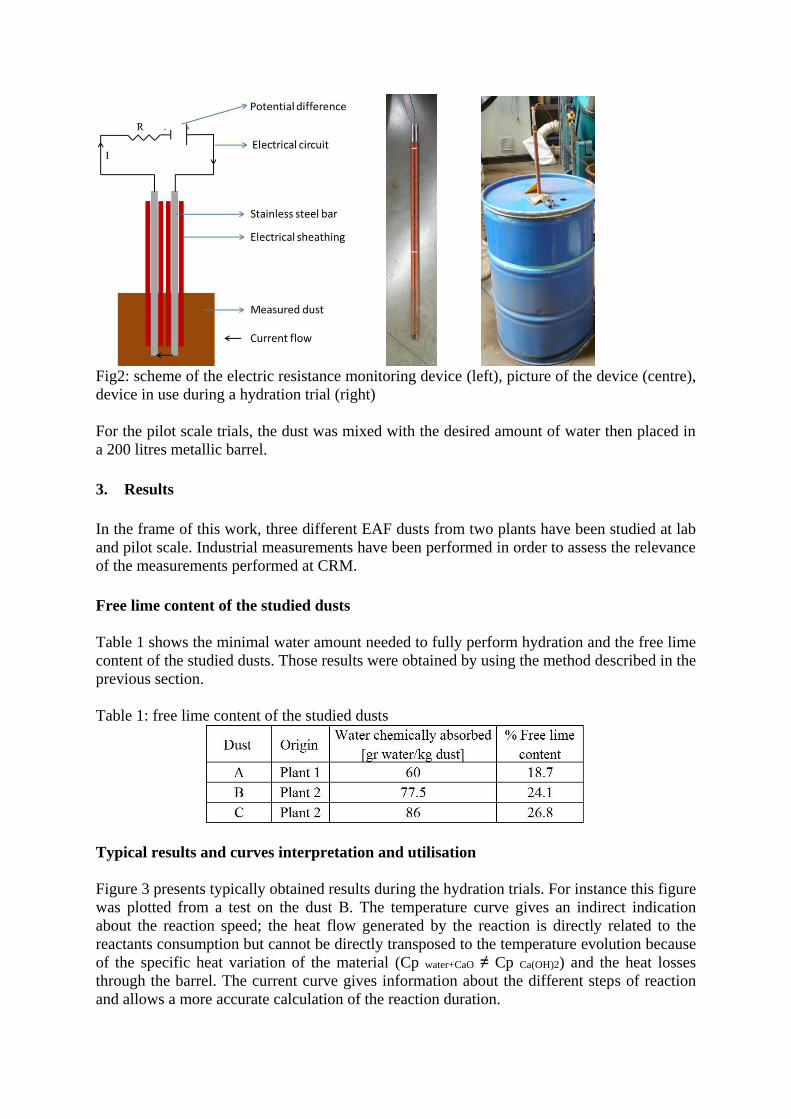
Fig2: scheme of the electric resistance monitoring device (left), picture of the device (centre),
device in use during a hydration trial (right)
For the pilot scale trials, the dust was mixed with the desired amount of water then placed in
a 200 litres metallic barrel.
3. Results
In the frame of this work, three different EAF dusts from two plants have been studied at lab
and pilot scale. Industrial measurements have been performed in order to assess the relevance
of the measurements performed at CRM.
Free lime content of the studied dusts
Table 1 shows the minimal water amount needed to fully perform hydration and the free lime
content of the studied dusts. Those results were obtained by using the method described in the
previous section.
Table 1: free lime content of the studied dusts
Typical results and curves interpretation and utilisation
Figure 3 presents typically obtained results during the hydration trials. For instance this figure
was plotted from a test on the dust B. The temperature curve gives an indirect indication
about the reaction speed; the heat flow generated by the reaction is directly related to the
reactants consumption but cannot be directly transposed to the temperature evolution because
of the specific heat variation of the material (Cp water+CaO ≠ Cp Ca(OH)2) and the heat losses
through the barrel. The current curve gives information about the different steps of reaction
and allows a more accurate calculation of the reaction duration.

The temperature evolution (Figure 3) shows that the hydration reaction accelerates with
temperature. The temperature plateau around 100°C is obviously related to the water
evaporation process. For long reaction times (~3500s in the example), a slight temperature
decrease is observed meaning that the heat losses become more important than the residual
heat generated by the ending reaction.
Fig3: characteristic curves of temperature and current obtained from a hydration trial
From the current curve, the different steps of the reaction can be extracted. The first increase
is due to the reorganisation of the material around the stainless steel bars. The first decrease is
the consequence of the water migration from the surface to the core of the particles. Then the
current slightly decreases due to the water consumption by the reaction until a peak appears
when the reaction runaway (strong increase of the temperature). The time difference between
the peaks of the current curve will be used in the rest of this paper as “the reaction time”.
In the EAF dust, the free lime is spread in the material in consequence of what the reaction is
evolving simultaneously everywhere in the barrel. This is confirmed by Figure 4 which
presents the temperature evolution at different positions in the barrel, far and near the walls.
In the centre of the barrel, the thermal losses are low and almost constant: the temperature
evolution is similar for the three studied positions which means that the reaction is occurring
at the same time and speed.
In the positions “near the wall” the runaway of the reaction is delayed in comparison to the
“far from wall” but also stronger. This can be explained by taking into account the fact that
the closer of the wall the bigger are the thermal losses, leading to lower temperature and
therefore lower reaction acceleration. In those positions, the increase of temperature is not
only a consequence of the heat coming from the hydration reaction but also from the
diffusion heat coming from the “far from wall” material, the combination of both explaining
the step-like runaway. This particular experiment is an additional proof of the temperature
impact on the hydration kinetics.

Fig4: simultaneous temperature measurement at different positions in the barrel
In order to properly interpret the information given by those curves, a sampling of the
material during the reaction (trial on dust B) was performed to assess the evolution of the dust
swelling tendency. The sampled material was compacted in the form of small cylinders and
then cured under air at room temperature. The results are shown at Figure 5.
Fig5: evolution of the dust swelling tendency during the hydration reaction
Before the runaway (red curve), the dust cannot be used for briquettes production because the
swelling due to free lime hydration is not fulfilled. Minutes after the runaway, the dust can be
used but with a risk of small swelling. Fifteen minutes after the reaction time the dust can be
safely briquetted (for dust B).

Industrial measurements
Measurements have been performed at industrial scale in the Recyco plant (Figure 6), in
order to compare with pilot scale results.
Fig6: setup for industrial measurement
Figure 7 presents a set of curves obtained during the industrial trials. The lack of temperature
data until 1800 seconds is due to a technical issue that has been solved during the test. The
conclusion is that the behaviour of hydration is the same at pilot and industrial scales,
therefore the result obtained at CRM should be easy to transpose for industrial use.
Fig7: current and temperature curves obtained after industrial trials

Impact of the dust nature
The main characterisation parameter of the hydration trials is the “reaction time”. The impact
of the dust nature on the reaction time is shown on Figure 8.
Fig8: reaction time for the three different studied dusts
The reaction is very dependent on the dust nature; the comparison of this result with table 1
could give the wrong impression that the reaction is inversely proportional to the free lime
content. A test on another sample of dust B (but another production date) containing only
11.8% of free lime gave a reaction time of the same order of magnitude.
The explanation of this difference between the reaction times lies in the thickness of the
protecting layer around the bigger particles of the dust (lime, silica, alumina …). A paired
SEM-EDX analysis (Figure 9) has put in light the existence of such layer composed of very
fine particles of metallic oxide (Fe,Cr, Ni).
Fig9: SEM-EDX images for the three studied dusts, in the first raw the calcium is put in
white, in the second raw the chromium is put in white (image width: 1.6mm)
The thickness of this protecting layer is in line with the time of reaction, consequently this is
considered as the most plausible explanation for the difference in reaction time. Nevertheless
additional work should be performed to confirm this conclusion. The origin of the thickness
difference should be studied from the EAF process perspective.
Dust B Dust A Dust C

Impact of the product temperature
The material temperature has a strong influence on the reaction kinetics. Tests have been
carried out using preheated reactants before the mixing. The following hydration trials have
been performed on dust B because the reaction time is compatible with the observer time.
The results are presented at Figure 10.
Fig10: impact of the reactants temperature on the reaction time
Those results confirm the accelerating effect of a higher temperature on the hydration speed.
The temperature of the environment seems to have an important impact on the disintegration
of the protecting layer.
Impact of the amount of added water
The amount of water added impact the reaction time. Below the amount of water chemically
absorbed by the dust (table 1) the reaction time increases. This can be explained by the fact
that when almost all the water has reacted, the likelihood of contact between water and free
lime become quite small and consequently the hydration reaction speed decreases.
Above the amount of water chemically absorbed by the dust (table 1), the impact is not fully
understood. An increase of the reaction time is observed for some dust and a decrease for
others, this could be explained by the relative importance of the following mechanisms:
• Increasing the water addition increases the heat capacity of the material (Cpwater =
4.18kJ/kg K and Cpdust = 0.8kJ/kg K). A heat capacity increase slows down the rise
of temperature and consequently the reaction speed.
• Increasing the water addition increases the likelihood of contact between water and
free lime witch increase the reaction speed.
4. Conclusions
The work carried out in this study resulted in a better comprehension of the hydration
reaction of the free lime contained in EAF dust. It is worth noting that with the sensors
(temperature and current) used in this study, the end of the reaction can be detected but not its
reason (total consumption of free lime or a lack of water). For an optimal use of those sensing
results, the amount of free lime in the considered dust must be known or measured. This can
be obtained by utilisation of the straightforward methodology that has been developed in this
study.

Additionally, the work carried out also put in light the main parameters influencing the
kinetics of the hydration reaction. Those parameters are:
• the dust nature, which influences the thickness of the protective layer made of small
metallic oxide particles;
• the material temperature;
• the amount of added water.
5. References
[1] European Commission: “Best Available Techniques (BAT) Reference Document for Iron
and Steel Production”, 2010, 443.
[2] Strohmeier et al., Steelworks Residues and the Waelz Kiln Treatment of Electric Arc
Furnace Dust, 1996, pp. 87-90.
[3] L. Avernant, A. Roques, M. El. Ouafi: “Recyco-Isbergues : Rapport d’activité – Année de
référence 2013”, 2014.
[4] W. Pietsch: “Roll pressing”, 1978, 94-97.
[5] E. E. Pressler, Stephen. Brunauer, D. L. Kantro: “Investigation of Franke Method of
Determining Free Calcium Hydroxide and Free Calcium Oxide”, Analytical
Chemistry, 1956, 896–902.
[6] R.F. Gebhardt: “Rapid Methods for Chemical Analysis of Hydraulic Cement”, ASTM
STP985, 1988.
[7] H.G. Midgley: “The determination of calcium hydroxide in set Portland cements”,
Building Research Establishment Department of the Environment, Garston, Watford, 1978.
[8] V.S. Ramachandran: “Differential thermal method of estimating calcium hydroxide in
calcium silicate and cement pastes”, Division of Building Research National Research
Council of Canada Ottawa, 1979.
[9] T. Sofili, V. Novosel-Radovi, S. Cerjan-Stefanovi, A. Rastovcan-Mioc: “The
mineralogical composition of dust from an electric arc furnace”, Material Technology 39,
149-154, 2005.
[10] C.Z. Rizescui, Z. Bacinschi, E.V. Stoian, A. Poinescu: “Characterization of Steel Mill
Electric Arc Furnace Dust”, Advances in Waste Management, 139-143, 2010.