Eco-efficiency tool box Learning unit C: implementing eco-efficiency
ENHANCEMENT OF ECO-EFFICIENCY THROUGH LIFE CYCLE ASSESSMENT
IN NATURAL RUBBER LATEX CONCENTRATE PROCESSING
SERI MAULINA
FACULTY OF ENGINEERING UNIVERSITY OF MALAYA
KUALA LUMPUR
2014

ENHANCEMENT OF ECO-EFFICIENCY THROUGH LIFE CYCLE ASSESSMENT
IN NATURAL RUBBER LATEX CONCENTRATE PROCESSING
SERI MAULINA
THESIS SUBMITTED IN FULFILMENT OF THE REQUIREMENTS
FOR THE DEGREE OF DOCTOR OF PHILOSOPHY
FACULTY OF ENGINEERING UNIVERSITY OF MALAYA
KUALA LUMPUR 2014
ii
UNIVERSITY OF MALAYA
ORIGINAL LITERARY WORK DECLARATION
Name of Candidate: SERI MAULINA (I.C/Passport No: A0300074)
Registration/Matric No: KHA 060009
Name of Degree: Doctor Of Philosophy (PhD)
Title of Project Paper/Research Report/Dissertation/Thesis (“this Work”):
Enhancement of Eco-Efficiency Through Life Cycle Assessment in Natural
Rubber Latex Concentrate Processing
Field of Study:
I do solemnly and sincerely declare that:
(1) I am the sole author/writer of this Work;
(2) This work is original
(3) Any use of any work in which copyright exists was done by way of fair dealing
and for permitted purposes and any excerpt or extract from, or reference to or
reproduction of any copyright work has been disclosed expressly and
sufficiently and the title of the Work and its authorship have been
acknowledgment in this Work;
(4) I do not have any actual knowledge nor do I ought reasonably to know that the
making of this work constitutes an infringement of any copyright work;
(5) I hereby assign all and every rights in copyright to this work to the University of
Malaya(“UM”), who henceforth shall be owner of the copyright in this Work
and that any reproduction or use in any form or by any means whatsoever is
prohibited without the written consent of UM having been first had and
obtained;
(6) I am fully aware that if in the course of making this Work I have infringed any
copyright weather intentionally or otherwise, I may be subject to legal action or
any other action as may be determined by UM
Candidate’s signature Date
Subscribed and solemnly declared before
Witness’s Signature Date
Name
Designation

iii
ABSTRACT
The three countries in South East Asia, namely Indonesia, Thailand and Malaysia are
the world’s largest produces of natural rubber in the world with a combined production
capacity of 6.5 Mt annually. Field latex which normally consists of 20% dry rubber
content (DRC) needs to be further concentrated to dry rubber content of 60% before it
can be used for downstream products. The present practice in latex concentrate factories
uses large volume of water and energy needs to be more efficient in their materials and
energy usage and leads to environmental problems. The rubber industry needs to
improve its competitiveness not only to increase profits but to ensure sustainability.
Life Cycle Assessment (LCA) and Eco-Efficiency are used as the combined approach in
this research to attain that objective.
The study was conducted on two selected natural rubber latex concentrate processing
plants in North Sumatera. The main objectives of the study are to conduct life cycle
inventory for natural rubber latex concentrate, analyze the environment impact from
the life cycle processing activities, implement opportunities towards environmental
improvements through LCA and also to suggest improvements of the impacts from the
current practices of natural rubber latex concentrate processing towards eco-efficiency
of the selected premises.
Two factories, A and B which produce latex concentrate as the main product and block
skim rubber as by-product were chosen. Both factories use centrifugation as a
concentration process. This study is a gate to gate study where data inventory starts
from acceptance of latex in the plant until production of concentrated latex and block
skim rubber. To determine the amount of impact that arise in this process, LCIA was

iv
used using Eco-Indicator 99. The functional unit of the study is to process of 1,000 kg
concentrated latex and 1,000 kg block skim rubber. Furthermore, the most influential
impact was used to measure the eco-efficiency.
Based on the results obtained, Factory A contributed higher environmental impact than
Factory B for both latex concentrate and block skim rubber processing. Damage to
resources is very high, dominantly contributed from fossil fuel. Ammonia gives the
highest impact in latex concentrate processing by 92.7% for Factory A with total
impact of 30.998 Pt while in Factory B ammonia gives 98.8% impact with total impact
of 22.675 Pt. The highest impact in block skim rubber processing for Factory A is
caused by formic acid (46.5%) and plastic (40.5%) with a total impact of 5.483 Pt,
while for Factory B it is caused by plastic (64.5%), sulfuric acid (27.6%) with a total
impact of 3.439 Pt.
Based on eco-efficiency indicator, waste intensity is almost the same for both factories
in latex concentrate processing. Water intensity for Factory A for latex concentrate and
block skim rubber processing is greater than Factory B. Therefore Factory B is found to
be more eco-efficient in water consumption. As for energy intensity, Factory A has
greater energy intensity compared to Factory B both in latex concentrate and block skim
rubber processing. Factory A provided greater emissions compared to Factory B. This
indicates that factory B is more eco-efficiency in energy consumption.
v
ABSTRAK
Indonesia kini mempunyai ladang getah terbesar di dunia dengan keluasan 3.4 juta
hektar, diikuti oleh Thailand seluas 2.6 juta dan Malaysia, 1.02 juta hektar. Walau
bagaimanapun, pengeluaran getah Indonesia berjumlah 2.4 juta tan manakala
pengeluaran getah Thailand mencapai 3.1 juta tan dan pengeluaran getah Malaysia
mencecah 951,000 tan. Eksport getah Indonesia pada tahun 2011 adalah di sekitar juta
tan, dan selebihnya adalah penggunaan domestik. Kualiti getah ditentukan oleh
mengekalkan tahap kebersihan yang tinggi adalah sangat penting untuk bersaing di
pasaran dusia. Jadi sudah tiba masanya industri getah meningkatkan daya saing dalam
usaha untuk meningkatkan keuntungan dan memastikan kemampanan.
Kajian ini dijalankan pada dua kilang yang memproses lateks peat getah alam di premis
terpilih di Sumatera Utara. Matlamat utama kajian ini adalah untuk menjalankan
kehidupan kitaran inventori untuk lateks pekat getah alam dari premis terpilih,
menganalisis impak ke alam sekitar daripada aktiviti kehidupan kitaran pemprosesan
melaksanakan peluang ke arah peningkatan alam sekitar melalui LCA, untuk
mencadangkan penambahbaikan impak dari amalan semasa lateks peat getah alam
pemprosesan ke arah eko-kecekapan premis yang dipilih.
Dua kilang, A dan B yang menghasilkan lateks pekat sebagai produk utama dan blok
skim getah sebagai produk akhir telah terpilih. Kedua-dua kilang menggunakan
sentrifugatsi sebagai proses pemisahan. Penyelidikan ini merupakan satu kajian pintu ke
pintu di mana inventori data bermula dari penerimaan getah di kilang sehingga
pengeluaran lateks pekat dan blok skim getah. Dalam pengeluaran blok skim getah,
koagulum daripada pembekuan skim getah dan ketulan cawan digunakan sebagai bahan
mentah. Selain peralatan utama di atas, terdapat beberapa peralatan tambahan dan bahan

vi
kimia. Di samping itu terdapat juga variasi dalam jumlah dan jenis bahan kimia yang
digunakan, yang boleh menyebabkan perbezaan dalam kualiti dan kuantiti produk.
Pengumpulan data inventori terdiri daripada input dan output bahan, tenaga dan air.
Data telah dikumpulkan tiga kali dari masing-masing kilang. Untuk menentukan jumlah
impak yang timbul dalam proses ini, LCIA telah digunakan menggunakan eko-indikator
99. Tambahan pula, kesan yang paling berpengaruh digunakan untuk mengukur eko-
efisiensi. Unit fungsional studi adalah untuk memproses 1,000 kg lateks pekat dan
1,000 kg blok skim getah.
Berdasarkan hasil yang diterima, Kilang A menyumbang impak alam sekitar yang lebih
tinggi daripada Kilang B dalam pemprosesan lateks pekat dan blok skim pemprosesan
getah. Kerusakan terhadap fosil adalah sangat tinggi, kebanyakan disumbang dari bahan
api fosil. Ammonia memberikan impak tertinggi dalam pemprosesan lateks peat dengan
92.7% untuk Kilang A dengan jumlah impak 30,998 Pt dan Kilang 98.8% B dengan
jumlah impak 22,675 Pt. Kesan impak tertinggi dalam blok skim pemprosesan getah
Kilang A adalah disebabkan oleh asid formik 46.5% dan plastik 40.5% dengan jumlah
impak 5,483 Pt, manakala Kilang B disebabkan oleh plastik 64,5%, asid sulfurik 27.6%
dengan jumlah impak 3,439 Pt.
Eco- efisiensi diukur melalui pengiraan eko-efisiensi dan eko-efisiensi indikasi.
Kategori impak dan penilaian kerusakan digunakan untuk mengira eko-efisiensi.
Intensiti sisa, intensiti tenaga dan intensiti air digunakan untuk mengukur indikasi eko-
efisiensi.
Untuk pengukuran eko- efisiensi, 8 kategori impak daripada 11 kategori impak telah
dipilih sebagai impak paling berpengaruh yang menyebabkan kemusnahan alam sekitar
dari pemprosesan lateks pekat dan blok skim pemprosesan getah. Didapati bahawa
vii
kerusakan terhadap sumber member eko- efisiensi terendah pemprosesan lateks getah
asli peat untuk kedua-dua kilang diikuti dengan kesihatan manusia. Oleh itu terdapat
keperluan untuk menguruskan sumber dan kesihatan manusia dalam usaha untuk
meningkatkan eko- efisiensi.
Berdasarkan indikasi eko- efisiensi, intensitas air untuk Kilang A pada pemprosesan
lateks pekat dan blok skim pemprosesan getah adalah lebih besar daripada Kilang B.
Oleh itu Kilang B didapati lebih eko-efisiensi dalam penggunaan air.
Dalam kajian ini, terdapat beberapa cara untuk meningkatkan Eko- Efisiensi melalui
pengurusan bahan, tenaga dan air yang telah disyorkan.
viii
ACKNOWLEDGEMENT
Syukur I pray to Allah SWT for blessings bestowed on me for the successful
completion of this thesis.
Firstly I would like to express my sincere thanks to my supervisors Prof. Dr. Nik
Meriam Nik Sulaiman and Assoc. Prof. Dr. Noorzalina bin Mahmood for their precious
guidance, patience, and support in the preparation of this thesis.
I would like to express thanks to the companies, who have given me such a great
opportunity to conduct research at their premises. Also thanks to all the staff of the
plants who have given me their time during the collection of data.
My appreciation goes to my parents, Burhanuddin Harahap (alm) and Diana Siregar for
educating and guiding me all this while. My appreciation also goes to my dear
husband, Murlan Tamba, for giving me moral support and love in times of extreme
difficulty. My appreciation also goes to my dear children, Raisa Annastasia, Shauma
Lannakita, Muhammad Rizki Tamba for their patience and love and for putting up with
me in time of great distress. Thanks to my friend Lilies Sukeksi, Raja Shazrin, Redzuan,
for friendship and cooperation during study in Universi of Malaya. Last but not least my
sisters and brother for their constant encouragement.

ix
TABLE OF CONTENTS
ORIGINAL LITERARY WORK DECLARATION ........................................................ ii
ABSTRACT ..................................................................................................................... iii
ABSTRAK ........................................................................................................................ v
ACKNOWLEDGEMENT ............................................................................................. viii
TABLE OF CONTENTS ix
LIST OF FIGURES xiii
LIST OF TABLES ..................................................................................................... xvi
LIST OF ABBREVIATIONS ........................................................................................ xix
CHAPTER 1 .................................................................................................................... 1
1. INTRODUCTION ..................................................................................................... 1
1.1. Background............................................................................................................. 1
1.2. Issues and Challenges in the Natural Rubber Latex Concentrate Processing
Industry ................................................................................................................... 7
1.3. Objectives of Study ................................................................................................ 9
1.4. Scope of Study ...................................................................................................... 10
1.4.1. The Process .......................................................................................................... 10
1.4.2. Legal/Standards Requirement .............................................................................. 10
1.4.3. Evaluation Procedures .......................................................................................... 11
1.5. Significance of Study .......................................................................................... 11
1.6. Organization of Thesis ......................................................................................... 12
1.7. Publication ............................................................................................................ 13
CHAPTER 2 .................................................................................................................. 14
2. LITERATURE REVIEW ........................................................................................ 14
2.1. Introduction .......................................................................................................... 14
2.2. Natural Rubber Latex Concentrate Processing..................................................... 17
2.3. Latex Concentrate ................................................................................................. 18
2.4. Skim Latex............................................................................................................ 19
2.5. Eco-Efficiency ...................................................................................................... 22
2.5.1. Eco-efficiency in global business ......................................................................... 24
2.5.2. Eco-efficiency in Indonesia .................................................................................. 25
2.5.3. Measuring Eco-Efficiency .................................................................................... 26
2.5.4. Eco-Efficiency Indicator ...................................................................................... 28
2.6. Routes To Eco-Efficiency .................................................................................... 30
x
2.6.1. Cleaner production ............................................................................................... 30
2.6.2. Environmental management system ..................................................................... 31
2.6.3. Environmental auditing ........................................................................................ 31
2.6.4. Public environmental reporting ............................................................................ 32
2.6.5. Design for environment ........................................................................................ 32
2.6.6. Product stewardship.............................................................................................. 32
2.6.7. Life Cycle Assessment ......................................................................................... 33
2.6.8. Supply chain management .................................................................................... 34
2.6.9. Environmental accounting .................................................................................... 34
2.6.10. Ecological Footprint ............................................................................................ 34
2.7. Life Cycle Assessment (LCA) .............................................................................. 35
2.7.1. Goal and Scoping ................................................................................................. 36
2.7.2. Life Cycle Inventory............................................................................................. 36
2.7.3. Life Cycle Impact Assessment ............................................................................. 37
2.7.4. Life Cycle Interpretation ...................................................................................... 39
CHAPTER 3 .................................................................................................................. 39
3. RESEARCH METHODOLOGY ............................................................................ 39
3.1. Introduction .......................................................................................................... 39
3.2. Setting the objectives of the study ........................................................................ 41
3.3. Selection of 2 (two) Natural Rubber Latex Concentrate Factories ...................... 42
3.3.1. Location of the factory ......................................................................................... 42
3.3.2. The process and product ....................................................................................... 43
3.3.3. Data availability.................................................................................................... 44
3.4. Inventory Data Collection .................................................................................... 44
3.4.1. Material Inventory ................................................................................................ 45
3.4.2. Energy consumption ............................................................................................. 46
3.4.3. Water consumption ............................................................................................... 47
3.4.4. Residual ................................................................................................................ 47
3.5. Life Cycle Assessment Methodology .................................................................. 49
3.5.1. Procedure Life Cycle Assessment Methodology ................................................. 50
3.5.2 Life Cycle Inventory............................................................................................. 53
3.5.3. Life Cycle Impact Assessment ............................................................................. 53
3.6. Eco-Efficiency Methodology ............................................................................... 54
3.7. Comparison between two factories ..................................................................... 56
3.8. Interpretation and evaluation of the result ............................................................ 57

xi
3.9. Conclusions and Recommendations ..................................................................... 57
CHAPTER 4 ................................................................................................................... 58
4. RESULTS AND DISCUSSION.............................................................................. 58
4.1 Introduction .......................................................................................................... 58
4.2 Products ................................................................................................................ 58
4.3 Natural Rubber Latex Concentrate Processing..................................................... 61
4.3.1 Processing in Factory A........................................................................................ 61
4.3.2 Processing in Factory B ....................................................................................... 75
4.3.3 Comparison of process activities between Factory A and Factory B .................. 88
4.4 Inventory Data Collection .................................................................................... 89
4.4.1 Material Data ........................................................................................................ 89
4.4.2 Energy Consumption ............................................................................................ 96
4.4.3 Water Consumption .............................................................................................. 99
4.4.4 Residuals............................................................................................................. 101
4.5 Life Cycle Inventory........................................................................................... 108
4.5.1 Material............................................................................................................... 108
4.5.2 Energy Consumption .......................................................................................... 112
4.5.3 Water Consumption ............................................................................................ 115
4.5.4 Residuals............................................................................................................. 117
4.5.5 Summary Overall Process Flow in Natural Rubber Latex Concentrate Processing120
4.6 Life Cycle Impact Assessment (LCIA) .............................................................. 122
4.6.1 Characterization .................................................................................................. 122
4.6.2 Normalization of Characterization ..................................................................... 125
4.6.3 Damage Assessment ........................................................................................... 129
4.6.4 Normalization Damage Assessment ................................................................... 131
4.6.5 Weighting ........................................................................................................... 134
4.7 Eco-Efficiency .................................................................................................... 140
4.7.1 Calculation of Eco-Efficiency ............................................................................ 140
4.7.2 Eco-Efficiency Indicator .................................................................................... 151
CHAPTER 5 ................................................................................................................ 161
5. CONCLUSION AND RECOMMENDATION .................................................... 161
5.1 Conclusions ........................................................................................................ 161
5.2 Recommendations .............................................................................................. 164
References ..................................................................................................................... 165

xii
APPENDIX A ............................................................................................................... 173
APPENDIX B ............................................................................................................... 174
APPENDIX C ............................................................................................................... 175

xiii
LIST OF FIGURES
Figure 1.1: World Rubber Production ................................................................... 6
Figure 1.2: World Rubber Consumption ............................................................... 6
Figure 2.1: Boundary Setting of CO2 Efficiency ................................................. 25
Figure 2.2: Structure of Life Cycle Assessment ................................................... 36
Figure 2.3: Framework and Stages of Research Methodology ............................. 41
Figure 3.2: Location of the Natural Rubber Latex Concentrate Factories ............ 43
Figure 3.3: Process Separation Scheme of Field Latex ......................................... 44
Figure 3.4: Overall Process Flow in Natural Rubber Latex Concentrate Processing 45
Figure 3.5: System boundary in Natural Rubber Latex Concentrate Processing in
Factory A ............................................................................................ 51
Figure 3.6: System boundary in Natural Rubber Latex Concentrate Processing in
Factory B ............................................................................................ 52
Figure 4.1: Flow Diagram Natural Rubber Latex Concentrate Processing
in Factory A ........................................................................................ 62
Figure 4.2: Centrifugation process where the light dense stream is
concentrated latex and heavy dense stream is skim latex ................... 66
Figure 4.3: Storage tank for concentrated latex ..................................................... 68
Figure 4.4: Coagulation pond ................................................................................ 70
Figure 4.5: Pieces coagulum after size reduction .................................................. 71
Figure 4.6: Macerator............................................................................................. 72
Figure 4.7: A set of cutters for size reduction from sheet into crumbs ................ 73
Figure 4.8: Set of dryer .......................................................................................... 74
Figure 4.9: Pressing and block skim rubber after packaging ................................. 75
Figure 4.10: Flow Diagram Natural Rubber Latex Concentrate Processing
xiv
in Factory B .......................................................................................... 77
Figure 4.11: Receiving Tank.................................................................................... 79
Figure 4.12: Centrifuge in Factory B ....................................................................... 80
Figure 4.13: Blending Tank in Factory B ............................................................... 81
Figure 4.14: Blow case ............................................................................................ 82
Figure 4.15: Storage Tanks ...................................................................................... 83
Figure 4.16: Skim Latex Receiver ........................................................................... 84
Figure 4.17: Pre Breaker Machine ........................................................................... 85
Figure 4.18: Extruder ............................................................................................... 86
Figure 4.19: Drying Machine (Dryer) ...................................................................... 87
Figure 4.20: Overall rubber balance in Natural Rubber Latex Concentrate
Processing ........................................................................................... 90
Figure 4.21: Overall Process Flow in Natural Rubber Latex Concentrate Processing
of Factory A ......................................................................................... 120
Figure 4.22: Overall Process Flow in Natural Rubber Latex Concentrate Processing
of Factory B ........................................................................................ 121
Figure 4.23: Normalization of Characterization of Natural Rubber Latex
Concentrate Processing in Factory A and Factory B ........................... 127
Figure 4.24: Damage Assessment of Latex Concentrate Processing in
Factory A and Factory B ...................................................................... 131
Figure 4.25: Normalization Damage Assessment of Latex Concentrate Processing
in Factory A and Factory B .................................................................. 133
Figure 4.26 : Weighting per impact category Natural Rubber Latex Concentrate
Processing in Factory A and Factory B ............................................. 136
Figure 4.27 : Weighting not per impact category Natural Rubber Latex Concentrate
Processing in Factory A and Factory B ............................................. 139

xv
Figure 4.28: Eco-Efficiency of Natural Rubber Latex Concentrate Processing in
Factory A and Factory B based on Impact Categories ....................... 144
Figure 4.29: Eco-Efficiency of Natural Rubber Latex Concentrate Processing in
Factory A and Factory B based on Damage Assessment..................... 147
Figure 4.30: Eco-Efficiency Indicator of Natural Rubber Latex Concentrate
Processing in Factory A and Factory B ............................................... 153
Figure 4.31: Reprocessing of wastewater ................................................................ 160
xvi
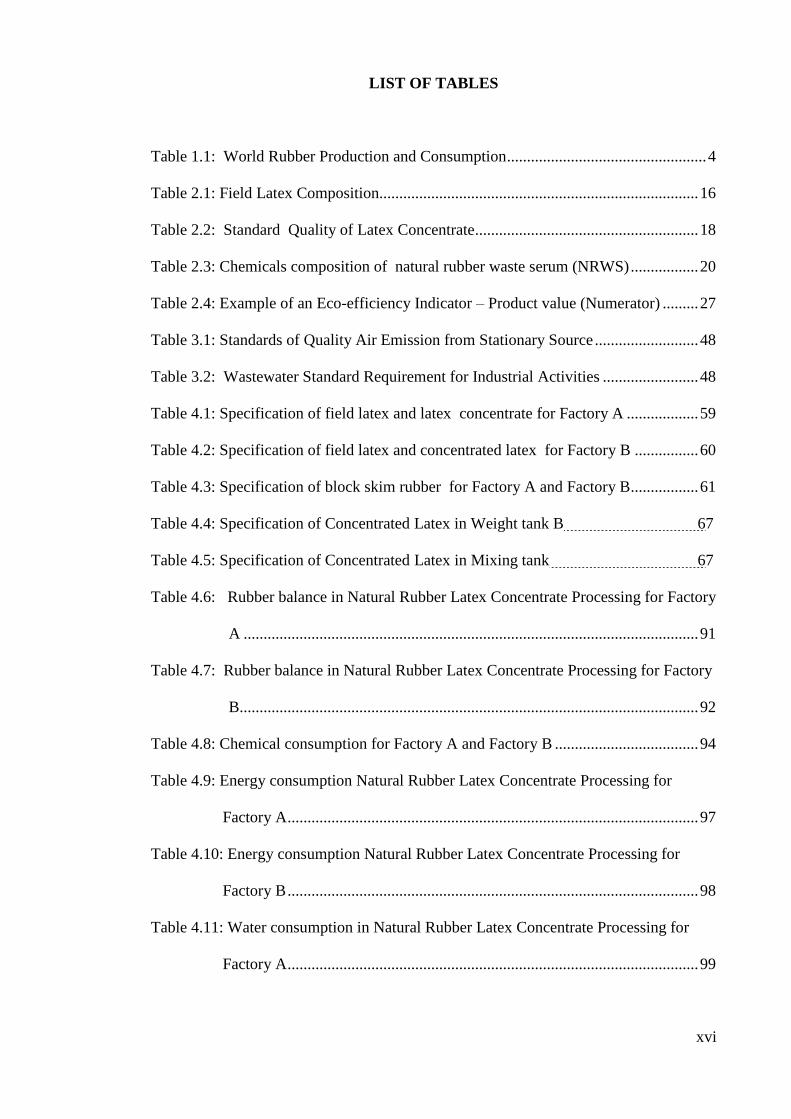
LIST OF TABLES
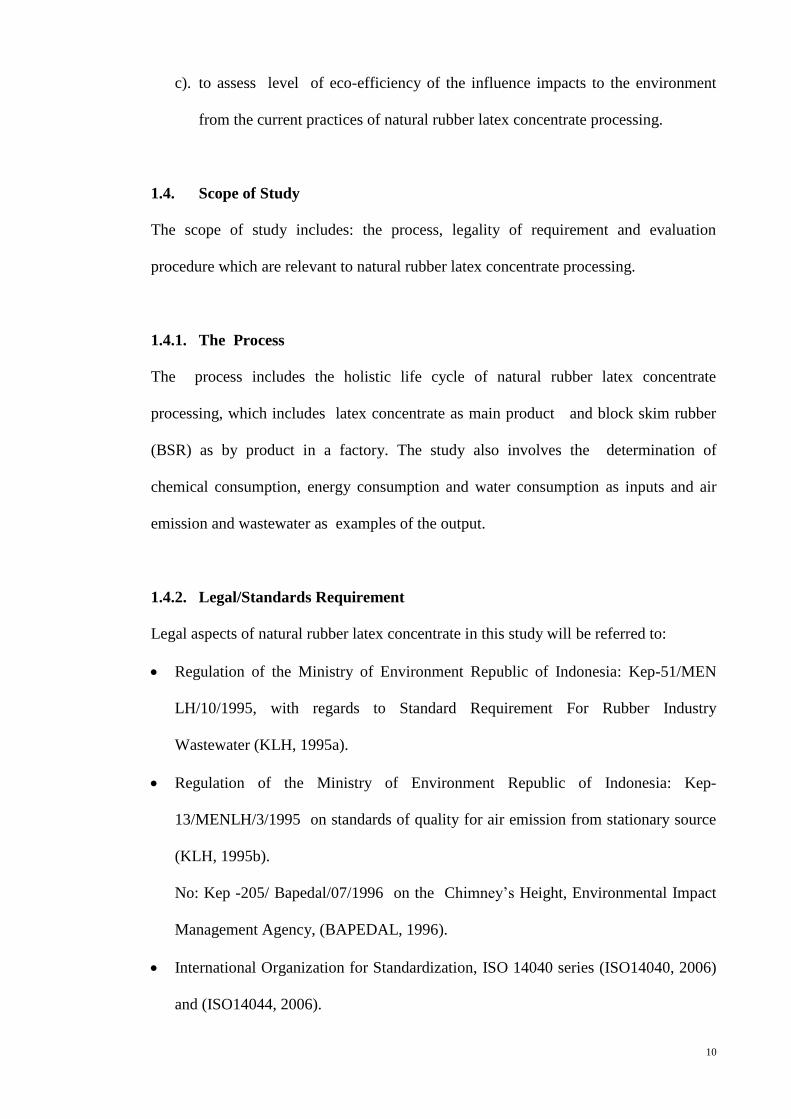
Table 1.1: World Rubber Production and Consumption .................................................. 4
Table 2.1: Field Latex Composition................................................................................ 16
Table 2.2: Standard Quality of Latex Concentrate ........................................................ 18
Table 2.3: Chemicals composition of natural rubber waste serum (NRWS) ................. 20
Table 2.4: Example of an Eco-efficiency Indicator – Product value (Numerator) ......... 27
Table 3.1: Standards of Quality Air Emission from Stationary Source .......................... 48
Table 3.2: Wastewater Standard Requirement for Industrial Activities ........................ 48
Table 4.1: Specification of field latex and latex concentrate for Factory A .................. 59
Table 4.2: Specification of field latex and concentrated latex for Factory B ................ 60
Table 4.3: Specification of block skim rubber for Factory A and Factory B................. 61
Table 4.4: Specification of Concentrated Latex in Weight tank B 67
Table 4.5: Specification of Concentrated Latex in Mixing tank 67
Table 4.6: Rubber balance in Natural Rubber Latex Concentrate Processing for Factory
A .................................................................................................................. 91
Table 4.7: Rubber balance in Natural Rubber Latex Concentrate Processing for Factory
B................................................................................................................... 92
Table 4.8: Chemical consumption for Factory A and Factory B .................................... 94
Table 4.9: Energy consumption Natural Rubber Latex Concentrate Processing for
Factory A ....................................................................................................... 97
Table 4.10: Energy consumption Natural Rubber Latex Concentrate Processing for
Factory B ....................................................................................................... 98
Table 4.11: Water consumption in Natural Rubber Latex Concentrate Processing for
Factory A ....................................................................................................... 99
xvii
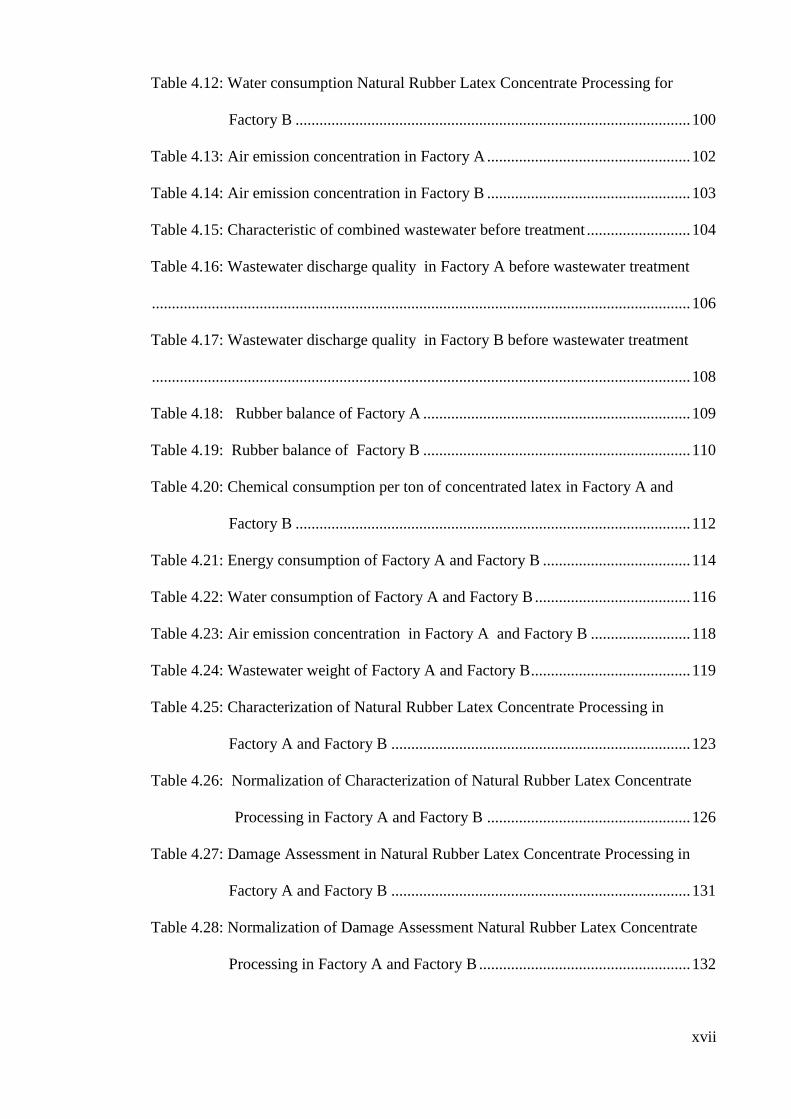
Table 4.12: Water consumption Natural Rubber Latex Concentrate Processing for
Factory B ................................................................................................... 100
Table 4.13: Air emission concentration in Factory A ................................................... 102
Table 4.14: Air emission concentration in Factory B ................................................... 103
Table 4.15: Characteristic of combined wastewater before treatment .......................... 104
Table 4.16: Wastewater discharge quality in Factory A before wastewater treatment
....................................................................................................................................... 106
Table 4.17: Wastewater discharge quality in Factory B before wastewater treatment
....................................................................................................................................... 108
Table 4.18: Rubber balance of Factory A ................................................................... 109
Table 4.19: Rubber balance of Factory B ................................................................... 110
Table 4.20: Chemical consumption per ton of concentrated latex in Factory A and
Factory B ................................................................................................... 112
Table 4.21: Energy consumption of Factory A and Factory B ..................................... 114
Table 4.22: Water consumption of Factory A and Factory B ....................................... 116
Table 4.23: Air emission concentration in Factory A and Factory B ......................... 118
Table 4.24: Wastewater weight of Factory A and Factory B ........................................ 119
Table 4.25: Characterization of Natural Rubber Latex Concentrate Processing in
Factory A and Factory B ........................................................................... 123
Table 4.26: Normalization of Characterization of Natural Rubber Latex Concentrate
Processing in Factory A and Factory B ................................................... 126
Table 4.27: Damage Assessment in Natural Rubber Latex Concentrate Processing in
Factory A and Factory B ........................................................................... 131
Table 4.28: Normalization of Damage Assessment Natural Rubber Latex Concentrate
Processing in Factory A and Factory B ..................................................... 132

xviii
Table 4.29: Weighting per impact category Natural Rubber Latex Concentrate
Processing in Factory A and Factory B ................................................... 135
Table 4.30: Weighting not per impact category Natural Rubber Latex Concentrate
Processing in Factory A ............................................................................. 138
Table 4.31: Weighting Impact Categories of Natural Rubber Latex Concentrate
Processing in Factory A and Factory B ................................................... 141
Table 4.32: Percentage of Weighting Impact Categories of Natural Rubber Latex
Concentrate Processing in Factory A and Factory B ................................. 142
Table 4.33: Eco-Efficiency of Natural Rubber Latex Concentrate Processing of Factory
A and Factory B based on Impact Categories ........................................... 143
Table 4.34: Eco-Efficiency of Natural Rubber Latex Concentrate Processing in Factory
A and Factory B based on Damage Assessment ....................................... 146
Table 4.35: Effect of the chemicals, energy and water in Rubber Latex ...................... 149
Table 4.36: Eco-Efficiency Indicator Factory A and Factory B in Natural Rubber Latex
Concentrate Processing .............................................................................. 152
xix
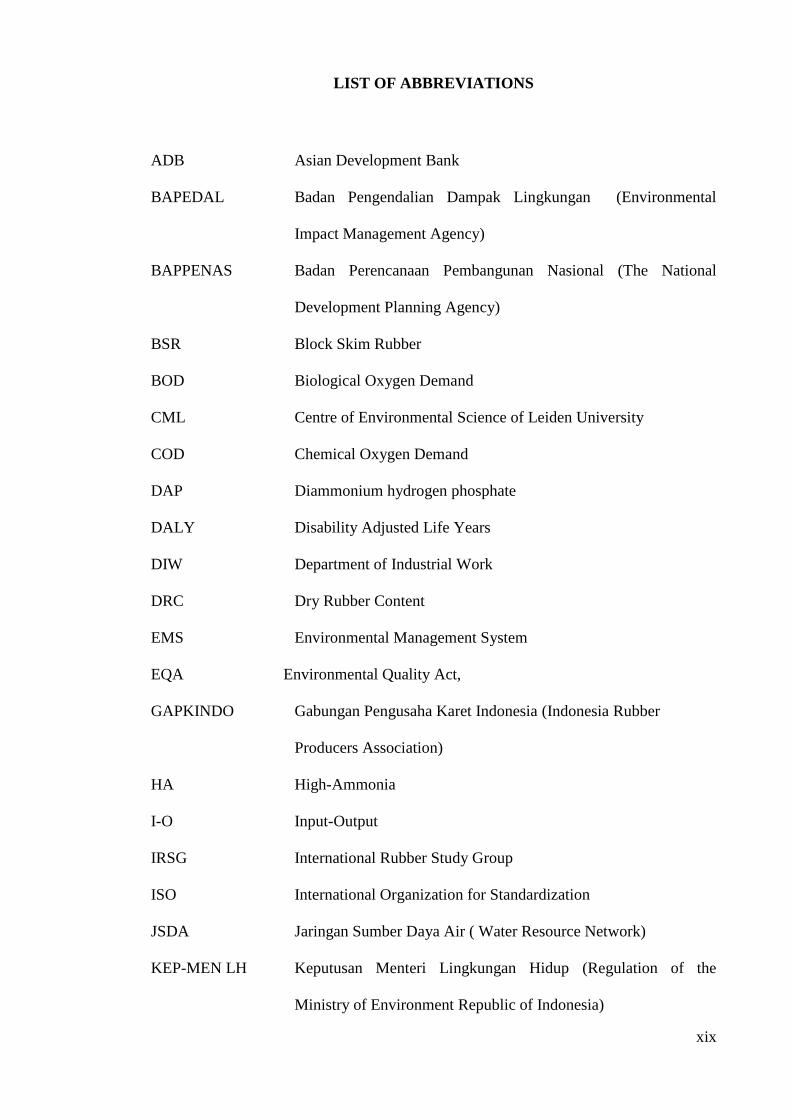
LIST OF ABBREVIATIONS
ADB Asian Development Bank
BAPEDAL Badan Pengendalian Dampak Lingkungan (Environmental
Impact Management Agency)
BAPPENAS Badan Perencanaan Pembangunan Nasional (The National
Development Planning Agency)
BSR Block Skim Rubber
BOD Biological Oxygen Demand
CML Centre of Environmental Science of Leiden University
COD Chemical Oxygen Demand
DAP Diammonium hydrogen phosphate
DALY Disability Adjusted Life Years
DIW Department of Industrial Work
DRC Dry Rubber Content
EMS Environmental Management System
EQA Environmental Quality Act,
GAPKINDO Gabungan Pengusaha Karet Indonesia (Indonesia Rubber
Producers Association)
HA High-Ammonia
I-O Input-Output
IRSG International Rubber Study Group
ISO International Organization for Standardization
JSDA Jaringan Sumber Daya Air ( Water Resource Network)
KEP-MEN LH Keputusan Menteri Lingkungan Hidup (Regulation of the
Ministry of Environment Republic of Indonesia)

xx
LA Low-Ammonia
LCA Life Cycle Assessment
LCI Life Cycle Inventory
LCIA Life Cycle Impact Assessment
MST Mechanical Stability Time
NOEC No Observed Effect Concentration
NR Natural Rubber
NRTEE The National Round Table on the Environment and the Economy
NRWS Natural Rubber Waste Serum
OT Onvangen Tank
PDF Potentially Disappeared Fractions
PAF Potentially Affected Fractionr
PE Person Equivalent
PLN Perusahaan Listrik Negara, Government Electricity Company
RBI Rubber Board India
RPM Revolution Per Minute
SNI Standard Nasional Indonesia
SS Suspended Solid
TSC Total Solid Content
TMTD Tetra Methyl Thiuram Disulfide
TZ Tetra methyl thiuram disulfide-Zinc oxide
USEPA United State Environment Protection Agency
VFA Volatile Fatty Acid
ZnO Zinc Oxide
WBCSD World Business Council for Sustainable Development

xxi
1
CHAPTER 1
1. INTRODUCTION
1.1. Background
International forums have been raising much debate regarding the environmental issue
such as global warming, ozone layer depletion, destruction of natural habitats and loss
of biodiversity. Global warming and its several potential effects on the earth is a
consequence of long-term accumulation of the so-called greenhouse gases mainly (CH4,
CO2, N2O) in the atmosphere (Khasreen, 2009). According to Asif, et al., (2007),
human activities, such as deforestation, burning of fossil fuels and changes in land use,
affect the emissions of these gases. They stated that in such a global environmental
scenario, activities in all sectors should take sustainability consideration as their prime
importance execution in order to secure the future for the next generation.
Concern for sustainability in the development and manufacture of new products is a
strategy that is widely accepted in principle, although not yet widely practiced. The
integration of environmental requirements throughout the entire lifetime of a product
needs a new way of thinking and new decision tools to be applied (Kaebernick, 2003).
Sustainable management of materials and products involve continuous evaluation of
ecological, economic, and social factors. A number of methods and tools are now
available to support this strategy. One of the most common tool is life-cycle
assessment (LCA). Even though LCA is a very influential instrument for assessing the
impact of an activity on the environment, it still has some limitations or drawbacks.
LCA has limitation related to methodological approach, time boundaries which will
affect the quality of the data and availability and further will affect the results

2
significantly (Benedetto, 2009). LCA often lacks a sustainability perspective and bring
about difficult trade-offs between depth and details (Henrik, 2006). LCA only correlates
between environmental and social factors and has limited inclusion of financial
consideration. It is suggested that Eco-Efficiency can complement LCA for establishing
a correlation between environmental and economic impacts thus leading the way
towards the consideration for sustainability.
According to Verfaillie and Bidwell (2000) the concept of eco-efficiency itself was
developed by the World Business Council for Sustainable Development (WBCSD) in
1992 and has been widely recognized by the business world. Eco-efficiency concept is
suitable to the industrial world, because its practical approach makes it possible to
balance environmental and economic benefits (Maxime, 2006). It shows how companies
get the benefits with minimal impact to the environment. According to Braungart et.al.,
(2007) eco-efficiency basically means doing more with less – using environmental
resources more efficiently; it improves environmental performance by reducing
material, energy and other natural resources while minimizing cost and liabilities.
In fact according to Uson et al., (2011) wrote, from the eco-efficiency viewpoint in
transport and mobility, eco-efficiency is more powerful than energy efficiency in
achieving high levels of sustainability.
Today natural rubber (NR) is one of the natural resources that is used widely to make
a variety of end products, such as tyres and medical related products. Natural rubber
comes from the Hevea brasiliensis tree, which grows in tropical regions. The trees can
reach 20-30 meters in height on rubber plantations and are able to start producing
commercial quantities of latex at about 7 years of age, depending on climate and

3
location. The average life span of a rubber tree is 32 years of which 25 years of
productive phase (Roberson, 2012). The rubber tree originally grew in South America,
then the seed was brought to Sri Lanka, Singapore, Malaysia and Indonesia, where the
last two countries are currently the world's biggest natural rubber producer after
Thailand (IRSG, 2012)
From the International Rubber Study Group report, global natural rubber production
and consumption is still dominated by Asia (IRSG, 2012). Asia produces 10.3 Mt
natural rubber or 93.6% of world’s natural rubber production in 2011 and utilize
69.8% of 10.9 Mt world’s consumption. This shows that Asia is the continent that most
widely produces natural rubber and is also the highest consumer of natural rubber. The
same report projected that the growth of natural rubber market would still increase up to
the year 2025.
According to Amir (2012) from the Indonesian Rubber Producer Association
(GAPKINDO), the installed capacity of rubber processing currently in Indonesia is
about 4.4 Mt, but only consumes 2.9 Mt. Therefore, there is still unused capacity of
about 1.5 Mt, because productivity is still low at only around 0.8 tons per hectare per
year, while the productivity of rubber in Thailand is able to reach 1.5 tons per hectare
per year. Rubber production in Indonesia in 2012 is expected to produce only 2.95 Mt
which is the same as 2011, due to high rainfall and climate anomalies. Based on these
conditions, the rubber production for domestic consumption is around 0.48-0.5 Mt,
while for export it is approximately 2.4-2.5 Mt.
There are 218 rubber goods industries both small and big in Indonesia. Rubber goods
industries in Indonesia are generally classified into several groups depending on the
4
type of product, including tyre industries, engineering rubber good industries, latex
good industries and general rubber goods industries (Rahman, 2009).
The growth of industry using rubber as raw material has seen progressive increment and
this demand for rubber has been partly fulfilled through synthetic rubber (SR)
production, in which synthetic rubber production is now higher than natural rubber as
shown by statistics in Table 1.1 and Figure 1.1, Figure 1.2. Although natural rubber
production is lower than the production and consumption of synthetic rubber but
actually natural rubber can not be totally replaced by synthetic rubber. This is due to the
fact that the natural rubber has better properties which includes: elastic or perfect
resiliency, good plasticity, low heat build-up and groove cracking resistance. Synthetic
rubber has advantages such as resistance to various chemicals and the price tends to
remain stable, while natural rubber price always changes (Shifhit, 2012), (Swadaya,
2008).
Synthetic rubber is produced from petroleum which is a non-renewable resource. This
means that natural rubber has good prospect for the future in term of its market demand.
In 2008, the Asia/Pacific region consumed 56 percent of global rubber demand and
China which is the largest market, is predicted to consume 30% of global rubber market
in 2013 (Group, 2010). This rubber is mainly be used for motor vehicles, for the
manufacture of tyres.
Table 1.1: World Rubber Production and Consumption
Year PRODUCTION (.000 tons) CONSUMPTION (.000 tons)
Natural Synthetic Total Natural Synthetic Total

5
Rubber Rubber Rubber Rubber Rubber Rubber
1998 6,634
9,880 16,514 6,570 9,870 16,440
1999 6,577
10,390 16,967 6,650 10,280 16,930
2000 6,762
10,870 17,632 7,340 10,830 18,170
2001 7,332
10,483 17,815 7,333 10,253 17,586
2002 7,326
10,877 18,203 7,556 10,874 18,430
2003 8,006
11,338 19,344 7,937 11,350 19,287
2004 8,744
11,977 20,721 8,716 11,877 20,593
2005 8,907
12,073 20,980 9,205 11,889 21,094
2006 9,827
12,612 22,439 9,690 12,675 22,365
2007 9,890
13,347 23,237 10,178 13,296 23,474
2008 10,128
12,711 22,839 10,175 12,748 22,923
2009 9,690
12,385 22,075 9,330 12,248 21,578
2010 10,399
14,082 24,481 10,778 14,086 24,864
2011 10,974
15,115 26,089 10,924 14,926 25,850
2012 11,329 15,083 26,412 11,033 14,895 25,928
Source: International Rubber Study Group, (2013)
Figure 1.1: World Rubber Production

6
Source: International Rubber Study Group, (2013)
Figure 1.2: World Rubber Consumption
Source: International Rubber Study Group, (2013)
According to International Rubber Study Group (2013) global rubber consumption will
grow at an average of 3.5 percent a year through 2018 as demand increases for
replacement tires. Products from natural rubber latex concentrate processing produce
many kinds of important rubber goods which provide big benefits to human beings..
However, environmental damages created from this processing could become a big
issue. Handling natural rubber from upstream to downstream through several stages,
start from plantation, intermediate product, and downstream products. This research
reviews the life cycle of the intermediate product stage from field latex to produce
latex concentrate and block skim rubber. Natural rubber latex concentrate processing
uses large amount of chemicals and consumes large volumes of water and energy. The
most common environmental issues are wastewater containing chemicals and odour.
Therefore, waste abatement and management in natural rubber processing sector should
be handled effectively and responsibly in order to reduce the damage to the
environment.
7
1.2. Issues and Challenges in the Natural Rubber Latex Concentrate Processing
Industry
The current technology to produce latex concentrate from natural rubber utilizes large
quantities of water, energy and chemicals. Chemical which act as preservatives are
added to prevent coagulation of rubber in latex and to precipitate the metals that can
interfere with the centrifugation process in latex concentrate processing. Chemicals are
also added in block skim rubber processing to form coagulum. Due to the volatile
nature of the chemicals, this industry poses a bad risk to workers’ health and the health
of surrounding communities. Excessive or un-optimized use of natural resources and
energy will definitely have negative impact on the environment. Additionally, the use of
chemicals as preservatives to maintain grade or specification of rubber also lead to
undesirable impact on the environment. The process of natural rubber latex concentrate
requires a lot of water, so it will generate high volume of effluent containing un-
coagulated rubber, proteins, carbohydrates and lipids among others. This effluent will
cause water pollution that can damage health of surrounding communities.
Operating and maintenance procedures in many of the natural rubber latex concentrate
processing are far from optimal. Losses in natural rubber latex concentrate processing
would impact on the environment, which give rise to financial losses to the industry
(Van, 2007). To overcome this, there should be an effort to reduce consumption of
natural resources through measures such as focusing on technology so that natural
resources processing will give maximum benefit to human life with minimum
environmental damage (Nguyen, 2012).
8
Problems arising in natural rubber latex concentrate processing comes from wastewater
which contains high amount of biological oxygen demand (BOD), chemical oxygen
demand (COD), suspended solid (SS), ammonia, nitrogen, sulfate, acidity and odour.
The characteristics of wastewater vary from each country due to differences in raw
latex and applied technique of processing. Effective effluent treatment would minimize
environmental pollution of rubber industry and bring it to become sustainable and
environmental friendly (Mohammadi, 2010), (Nguyen, 2012) .
Based on the above information it shows that the process of natural rubber latex
concentrate to produce latex concentrate and block skim rubber has a large negative
impact on the environment. Then the question is how to achieve environmental
improvements in parallel with economic benefits from the rubber industry.
There are opinions that link economic activities with environment and is known as
eco-efficiency. World Council for Sustainable Development (2000) explained that eco-
efficiency means producing goods and services using less energy and fewer raw
materials, resulting in less waste, less pollution and less cost.
According to US President’s Council on Sustainable Development, being eco-efficient
means:
“maintaining economic growth while producing the absolute minimum of pollution.”
According to van Berkel (2002), Eco-Efficiency is basically about making thoughtful
use of materials, energy, water and other natural resources while conducting business.
This is performed in order to improve the environmental performance of process
products, while minimizing costs and liabilities.

9
In order to identify the impact of the natural rubber latex concentrate processing on the
environment, assessment of its life cycle must be done. Currently, LCA in its present
form can still be regarded as a rising environmental management tool with significant
potential for supporting environmental decisions (UNEP, 2011). Many business
associations and companies in industry already use the life-cycle approach in the
framework of sustainability (EC, 2008). The European Commission (EC) concluded
that LCA provides the best framework for assessing the potential environmental
impacts. It provides a framework for analyzing and evaluating the environmental
impacts of the life cycle products system. Life Cycle Assessment is used as a tool to
support the eco-efficiency concept and will give a quantitative value of the impact
caused by the processes through the Life Cycle Impact Assessment (LCIA). This
potential of LCA as a tool can support the eco-efficiency approach (van Berkel, 2002).
The case studies on the research in the West Australia grains sector, showed how LCA
findings can be strategically linked to practical eco-efficiency targets at the sub-system
or process level (van Berkel, 2007). In the case of natural rubber industry, Rattanapan
(2012) developed the eco-efficiency indicator through material flow analysis for rubber
glove product but yet to present the results in a quantitative basis.
1.3. Objectives of Study
The study is conducted on the selected premises of two natural rubber latex
concentrate processing plants in North Sumatera.
The main objectives of the study are:
a). to conduct life cycle inventory study for natural rubber latex concentrate on the
two selected premises
b). to analyze the environment impact from the life cycle processing activities and
to evaluate and implement opportunities towards environmental improvements
through LCA
10
c). to assess level of eco-efficiency of the influence impacts to the environment
from the current practices of natural rubber latex concentrate processing.
1.4. Scope of Study
The scope of study includes: the process, legality of requirement and evaluation
procedure which are relevant to natural rubber latex concentrate processing.
1.4.1. The Process
The process includes the holistic life cycle of natural rubber latex concentrate
processing, which includes latex concentrate as main product and block skim rubber
(BSR) as by product in a factory. The study also involves the determination of
chemical consumption, energy consumption and water consumption as inputs and air
emission and wastewater as examples of the output.
1.4.2. Legal/Standards Requirement
Legal aspects of natural rubber latex concentrate in this study will be referred to:
Regulation of the Ministry of Environment Republic of Indonesia: Kep-51/MEN
LH/10/1995, with regards to Standard Requirement For Rubber Industry
Wastewater (KLH, 1995a).
Regulation of the Ministry of Environment Republic of Indonesia: Kep-
13/MENLH/3/1995 on standards of quality for air emission from stationary source
(KLH, 1995b).
No: Kep -205/ Bapedal/07/1996 on the Chimney’s Height, Environmental Impact
Management Agency, (BAPEDAL, 1996).
International Organization for Standardization, ISO 14040 series (ISO14040, 2006)
and (ISO14044, 2006).

11
1.4.3. Evaluation Procedures
Evaluation of the existing condition has been simulated using Life Cycle Assessment
software, SIMAPRO 7 by using methodology of Eco-Indicator 99, calculation of Eco-
Efficiency and Eco-Efficiency Indicator. Calculation of Eco-Efficiency involves
parameters that affect the Life Cycle Impact Assessment, that is an adverse impact on
environment, while Eco-Efficiency Indicator is based on three parameters i.e.,
materials, energy and water.
1.5. Significance of Study
This study will benefit the natural rubber latex concentrate processing and related
industry. The outcomes of this study are to suggest significant improvements and
benefits for the company or industry and environment in the following manner:
- The company which use life cycle assessment as a tool for eco-efficiency strategies
can reduce environmental burdens such as reduction in wastewater, energy usage,
water usage, damage to resources and eco-system quality.
- The company which use eco-efficiency strategies can achieve reduced costs and
increased profits as compared to similar firms that do not adopt eco-efficiency
strategies. In addition, eco-efficiency can be used as a tool guide for approving
capital investments, identifying and prioritize continuity of improvement, which
needs to be done and provide information on strategic decisions to be made by
company.
- Eco-efficiency principles will apply policies of the Government that encourage
economic growth and reduction of resources utilization that will produce pollution.
This policy can be done by avoidance or elimination of inappropriate subsidies
12
given as a cost to overcome negative impact to environment and social damage and
prevent excessive use of resources.
1.6. Organization of Thesis
This dissertation has been divided into 5 chapters as follows:
Chapter One contains the introduction to the dissertation. It introduces background of
the study, objectives of the study , scope of the study and contribution of the study.
Chapter Two presents the literature review. This chapter contains the theory of
Environmental Management Systems. Concept of life cycle thinking is presented
focusing on Life Cycle Assessment and the methodology following the ISO 14000
series. Theory of Eco-Efficiency is introduced, by Eco-Efficiency measurement and
Eco-Efficiency Indicator. The detailed description of Life Cycle Impact Assessment and
Eco-Efficiency is discussed. Description of natural rubber, properties and its
processing are also described in this chapter.
Chapter Three explains the methodology that is used to conduct this research. The
methodology consists of stages and detailed procedures that would be done to achieve
the objectives mentioned in chapter one.
Chapter Four explains results and discussions. Data that have been collected were
analyzed. Furthermore, the data are used to calculate the impact by using the LCA
software and Eco-Efficiency measurement. The results were analyzed. Comparative
analysis were conducted for factories that have been selected. Impact category that has
been calculated is compared to direct measurements such as air emissions and

13
wastewater. Measurements of air emissions and wastewater quality were also analyzed
based on existing government regulations.
Chapter Five concludes the findings and recommendation from this research.
1.7. Publication
During this study, the author has published several papers in conference proceedings
related to the topic of the research study. The list of the papers is presented in Appendix
A.

14
CHAPTER 2 2. LITERATURE REVIEW
2.1. Introduction
The latex of Hevea brasiliensis or natural rubber tree consists of 20%-35% rubber and
the rest non-rubber material. Each pure rubber particle is surrounded by soapy-like
substances which is made up of emulsion in aqueous (watery) phase. Carbohydrates,
lipids, microorganisms, minerals, proteins and water are non-rubber matters in the
aqueous phase and known as serum. Stability of the fresh latex is controlled by the
existence of proteins and lipids (Ho, 1979).
Products of natural rubber can be classified into two phase categories, dry rubber such
as crumb rubber and rubber sheet and liquid rubber which refers to latex concentrate.
Higher rubber concentration known as latex concentrate is obtained after separation dry
rubber content (DRC) by removing non-rubber materials. The rubber concentration is
increased from 20-35% in field latex to 60%-65% DRC rubber concentration in latex
concentrate and 3%-7% DRC concentration in skim latex and a little impurities.
There are several processes to produce latex concentrate: creaming, centrifugation,
electro-decantation and evaporation.
Creaming: Cream agent such as ammonium alginate is mixed with field latex which
will separate the latex rich rubber in the upper layer (concentrated latex) and low rubber
(serum). A cream containing 60-68% rubber content is separated from the skimmed
fraction after several weeks.
Centrifugation: The processing of field latex into latex concentrate by centrifugation
will separate field latex into two layers. The upper layer contains concentrated latex

15
with rubber content 60%-70% DRC and the lower layer contains skim latex
containing rubber content 4%-7%.
Evaporation: The process is done by heating the latex at low pressure and high
temperature so that water will evaporate. Alkali, (KOH) is used as preservative or
stabilizer. Heating will evaporate the water resulting in 80% DRC in latex concentrate
which contains total solid content (TSC) of more than 80%.
Electro-decantation: Electro-decantation uses electrode and semi- permeable
membrane in its separation process. By electrolysis, negative charge in the field latex
move towards a positive electrode and semi-permeable membrane will collect cream
which is trapped in the surface of the membrane. The properties and composition of
latex concentrate by electro-decantation process is similar to centrifugation process.
However two methods are commercially applied to produce latex concentrate from
field latex, namely creaming and centrifugation (RBI, 2006).
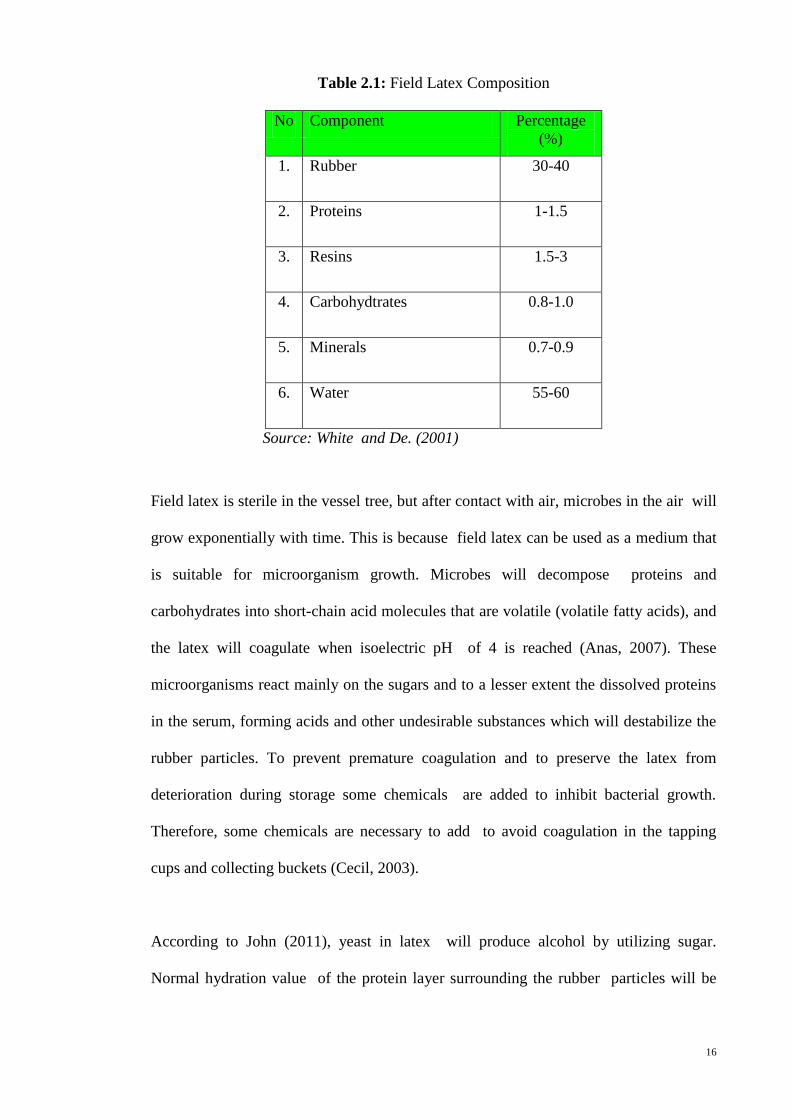
According to White and De (2001), besides water and rubber as the primary
constituents of field latex, it also consists of other components such as protein, resins,
carbohydrate, minerals as shown in Table 2.1
16
Table 2.1: Field Latex Composition
No Component Percentage
(%)
1. Rubber 30-40
2. Proteins 1-1.5
3. Resins 1.5-3
4. Carbohydtrates 0.8-1.0
5. Minerals 0.7-0.9
6. Water 55-60
Source: White and De. (2001)
Field latex is sterile in the vessel tree, but after contact with air, microbes in the air will
grow exponentially with time. This is because field latex can be used as a medium that
is suitable for microorganism growth. Microbes will decompose proteins and
carbohydrates into short-chain acid molecules that are volatile (volatile fatty acids), and
the latex will coagulate when isoelectric pH of 4 is reached (Anas, 2007). These
microorganisms react mainly on the sugars and to a lesser extent the dissolved proteins
in the serum, forming acids and other undesirable substances which will destabilize the
rubber particles. To prevent premature coagulation and to preserve the latex from
deterioration during storage some chemicals are added to inhibit bacterial growth.
Therefore, some chemicals are necessary to add to avoid coagulation in the tapping
cups and collecting buckets (Cecil, 2003).
According to John (2011), yeast in latex will produce alcohol by utilizing sugar.
Normal hydration value of the protein layer surrounding the rubber particles will be

17
reduced and destabilize the rubber particles because of the presence of alcohol as a
dehydrating agent and coagulation takes place.
Destabilizing of natural rubber could be done physically and chemically. Physical
destabilization could be caused by heating, freezing, mechanical agitation and removal
of water (evaporation). Chemical destabilization occurs when acids and salts are added.
2.2. Natural Rubber Latex Concentrate Processing
Commercial latex concentrate, known either as high-ammonia (HA) or low-ammonia
(LA) is generally produced by centrifugation. The concentration of ammonia per liter
of latex in high ammonia and low ammonia latex concentrate are 6.0-7.0 g NH3 and 4–
5 g NH3 respectively. High ammonia and low ammonia are usually used for the same
functions such as to produce elastic thread, foam products, adhesives, dipped goods,
household and industrial gloves, balloons and rubber bands. Low ammonia latex
concentrate is more economic because it consumes lower acid and preservatives.
Therefore the cost of production for LA is lower than HA latex concentrate.
Skim latex will coagulate with and without acid added and most of the non rubber
particles are removed. Skim latex contains about 7% total solid content (TSC) and 5%
dry rubber content (DRC). Dry rubber content is also addressed as DRC which means
the weight of rubber in gram present in 100 gm of latex. According to Danwanichakul
(2011), the total solid content (TSC) is measured by drying the latex sample to obtain
the dried solid and it was found that for latex with DRC of 37.2%, TSC is 38.2%. Thus,
the dissolved solid in the latex is about 1.0%.
Hevea tree produces a sap known as latex. To maintain latex in liquid phase,
preservatives such as ammonia should be added into collection cups. Ammonia will

18
prevent coagulation of latex. The solid phase can be obtained in a cup without adding
the preservatives and is known as cup lump.
2.3. Latex Concentrate
According to Thaitex (2012) the parameters that determine quality of latex concentrate
is as shown in Table 2.2.
Table 2.2: Standard Quality of Latex Concentrate
No Parameter Content
1 Dry Rubber Content (DRC)
60.00 (%), min
2 Total Solid Content (TSC)
2 (%), above DRC
3 Volatile Fatty Acid (VFA)
0.05 (%), max
4 KOH value
0.85 (%), max
5 Mechanical Stability Time
(MST)
Minimum 650 second
6 NH3 content 0.65-0.75 (%) for HA Latex Concentrate
0.2-0.29 (%) for LA Latex Concentrate
Source: Thaitex (2012)
The parameters as depicted in Table 2.2 comprises the following:
- Dry rubber content (DRC), to show rubber content in latex by coagulating latex with
acetic acid. The standard method is as described in ISO 126 (1982).
- Total solid content (TSC), to show non volatile matters in latex at temperature
from 70-100 0C at atmospheric pressure. The difference between TSC and DRC is
known as non-rubber content. There is a correlation between TSC and MST i.e.,
higher TSC result in lower MST.

19
- Volatile fatty acid (VFA) value, to show carbohydrates and amino acids have already
been converted into acetic acid, formic acid and propionic acid by bacteria. Increase
in VFA will decrease MST. The standard method is as described in ISO 506 (1992).
- KOH value, to show ammonium acid radicals in latex. The standard method is
described in ISO 127(2012)
- Mechanical stability time (MST), to show the time required for first coagulation of
rubber particles, and it measures the resistance of latex destabilizing by mechanical
agitation. MST will increase in storage with addition of soaps of fatty acid.
Hydrolysis of lipids will increase fatty acid, followed by increase in negative
charges, and then the electrical double layer repulsion will become high, and this all
will increase MST. The standard method is as described in ISO 35 (2004).
- Ammonia content (NH3), to show the types of latex, such as high ammonia (HA) or
low ammonia (LA).
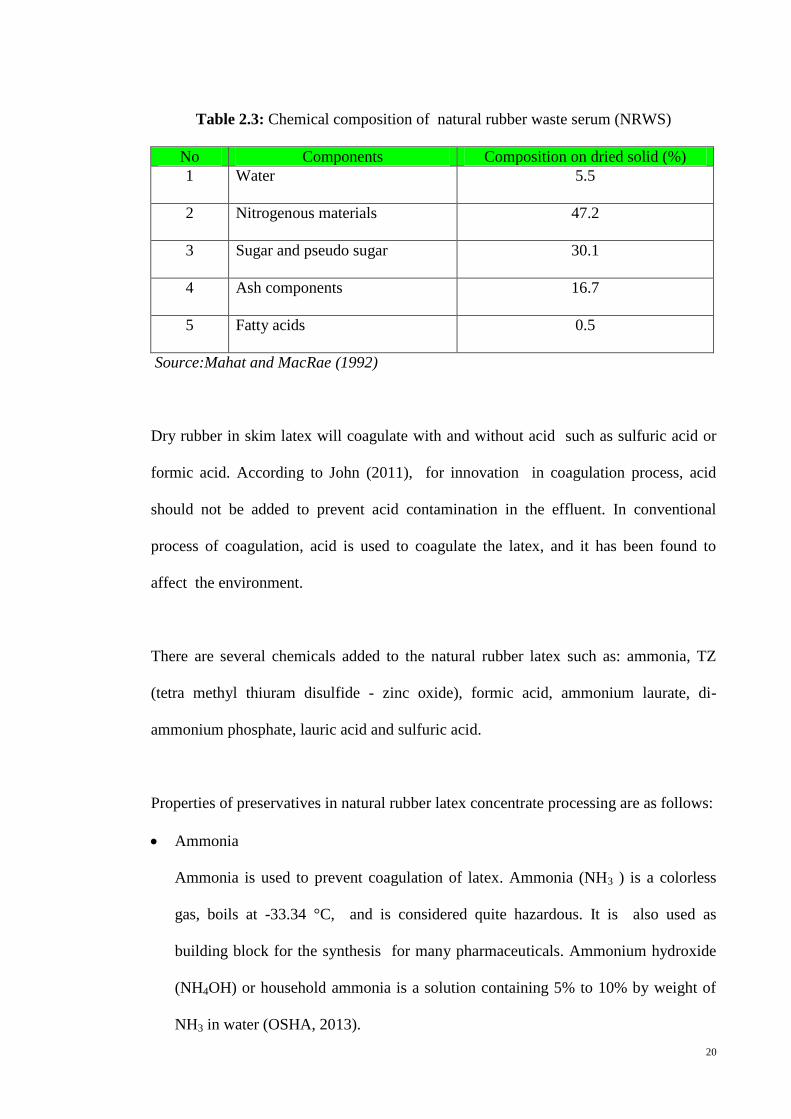
2.4. Skim Latex
According to Mahat and MacRae (1992), skim latex contains non rubber fraction with a
large watery fraction known as natural rubber waste serum (NRWS) and contains 5%
dry rubber content (DRC) and about 7% total solid content (TSC). NRWS contains
various water-soluble, non-rubber substances of which the pseudo-sugar, quebrachitol
(2-0-methyl (–) - chiroinositol or 2-0-methyl inositol), which is most prominent, water,
nitrogenous materials, fatty acids and ash components as shown in Table 2.3.
20
Table 2.3: Chemical composition of natural rubber waste serum (NRWS)
No Components Composition on dried solid (%)
1 Water
5.5
2 Nitrogenous materials
47.2
3 Sugar and pseudo sugar
30.1
4 Ash components
16.7
5 Fatty acids
0.5
Source:Mahat and MacRae (1992)
Dry rubber in skim latex will coagulate with and without acid such as sulfuric acid or
formic acid. According to John (2011), for innovation in coagulation process, acid
should not be added to prevent acid contamination in the effluent. In conventional
process of coagulation, acid is used to coagulate the latex, and it has been found to
affect the environment.
There are several chemicals added to the natural rubber latex such as: ammonia, TZ
(tetra methyl thiuram disulfide - zinc oxide), formic acid, ammonium laurate, di-
ammonium phosphate, lauric acid and sulfuric acid.
Properties of preservatives in natural rubber latex concentrate processing are as follows:
Ammonia
Ammonia is used to prevent coagulation of latex. Ammonia (NH3 ) is a colorless
gas, boils at -33.34 °C, and is considered quite hazardous. It is also used as
building block for the synthesis for many pharmaceuticals. Ammonium hydroxide
(NH4OH) or household ammonia is a solution containing 5% to 10% by weight of
NH3 in water (OSHA, 2013).
21
Tetra methyl thiuram disulfide (TMTD)
Tetra methyl thiuram disulfide ((CH3)2NCS2)2 is usually used as a fungicide, seed
disinfectant, insecticide, and bactericide. It is a white crystalline powder, and
classified as rubber accelerator (Chemicalland21, 2013).
Zinc oxide (ZnO)
Zinc oxide, is commercially produced synthetically and is widely used as an
additive in several processes in ceramics, glass, cement, rubber manufacturing (IZA,
2011). It is soluble in water, alcohol but insoluble in most acids.
Diammonium hydrogen phosphate (DAP), (NH4) 2NHPO4
Diammonium hydrogen phosphate serves as an anti-fungal, and in some plant, it is
added to latex while still in the plantation. Besides, DAP is used as fertilizer and
fire retardant. As fertilizer, DAP will increase soil pH.
Formic acid
Formic acid (also known as methanoic acid) HCOOH, during the natural rubber
latex concentrate processing is used to coagulate a liquid (skim serum) that separate
from centrifuge in the secondary pond. Coagulate product is used as raw material for
block skim rubber processing. Formic acid occurs naturally and as intermediate
substances for chemical synthesis (University, 2013).
Lauric acid
Lauric acid (also known as dodecanoic acid), is a saturated acid that has
antimicrobial properties.
Sulfuric acid (H2SO4)
Sulfuric acid is a strong acid, and is soluble in water at all concentrations. It is used
in natural rubber latex concentrate as coagulant to separate rubber from the liquid
(skim serum). The effluents resulting from rubber processing have been shown to

22
have high pollution potentials caused by the presence of components such as
phosphates and nitrates which will increase the nutrient value of water bodies
(Atagana, 1999). Algae bloom will appear, thus the ecological balance of the water
system will be disturbed.
Nowadays, increasing demand of chemical products has created a bad perception in the
community because it will reduce the quality of life. Based on research, this resulted in
high costs due to waste generated and can reach as high as 40% of production costs
(Clark, 2005). This is marked by changes in industry behavior in the 20th century and
the 21st century which in some ways focus on reducing the impact to the environment.
It should be done by using biodegradable materials, short stages of processes.
There are some common thread that links how to get a process that will produce a
product that has full commitment to environmental stability. Also there are several
parties that are interconnected to create these conditions, in particular government and
industry. Industry has the main aim that a process will produce products with maximum
profit, use of minimum and maximum natural resources compliance to government
rules. On the other hand, the government is faced with a reality that the industry can
employ labor, tax sources to run the government, however the industry can also cause
environmental damage. Hence, the government should have rules which support
industrial activities without causing environmental damage and could be quantified.
Eco-efficiency is a term that connects both economic and environmental parameters.
2.5. Eco-Efficiency
There are four different types of environmental technology: end of pipe technologies,
integrated technologies, eco-efficiency technologies and new system designs. Eco-

23
efficiency technologies and new system design are selected because of high potentials
application (Bleischwitz, 2002).
Eco-efficiency is a concept that connects environmental and economic on how
industries get the benefits with minimal impact to the environment. According to FIFA
(2003), cost will be reduced and increased competitiveness will be achieved through
realization of eco-efficiency and finally companies can realize better environmental
outcomes. Basically eco-efficiency indicate doing more with less – by using resources
more efficiently; it can improve environmental performance by reducing materials,
energy and other natural resources while minimizing cost and liabilities.
Concept of eco-efficiency refers to Vervaillie and Bidwell (2000) was developed by the
World Business Council for Sustainable Development (WBCSD) in 1992 and has been
largely accepted by the business world.
WBCSD defines eco-efficiency as: “Eco-efficiency is achieved by the delivery of
competitively-priced goods and services that satisfy human needs and bring quality of
life, while progressively reducing ecological impacts and resource intensity throughout
the life-cycle to a level at least in line with the earth’s estimated carrying capacity.
In 2000, WBCSD introduced 3 objectives of eco-efficiency through decreasing
resource consumption, decreasing impact to environment and providing high product
or service value. Generally, the purpose of these objectives are to offer opportunities
for business savings (Canada, 2002). According to WBSCD (2000), eco-efficiency
should increase recycling, improve product life, minimize damage to water body,
minimize air emission, minimize waste disposal and dispersion of toxic materials and
generate greater profits in accordance to its functionality.
24
The three objectives of eco-efficiency were detailed by WBSCD in 2001 by introducing
7 elements:
1. Reduce material intensity: reduce in material use such as raw material and
chemical substances and should generate less waste.
2. Reduce energy intensity: reduce the energy intensity before, during and after
processing
3. Reduce dispersion of toxic substances
4. Enhance material recyclability
5. Maximize sustainable use of renewable resources
6. Extended product life (durability)
7. Increase service intensity: increasing the service intensity of goods and services
According to WBCSD, reducing impacts to environment will enhance resource
productivity, and ultimately create benefit for competition.
2.5.1. Eco-efficiency in global business
Firms that use eco-efficient strategies will reduce costs and increased profits than
similar firms that do not adopt eco-efficient business strategies (Sinkin, 2008). Tahara et
al., (2005) used concept of eco-efficiency to define ”total CO2 efficiency”, ”direct CO2
efficiency”, and “indirect CO2 efficiency” using Input-Output (I-O) table analysis for
the evaluation of companies and industries and found that total CO2 efficiency of
industries were lower than companies. Figure 2.1 shows the setting of boundary for
CO2 efficiencies. Industries are refers to service industries, assembly industries, and
primary industries, whereas companies are refers to public services and medical
services.

25
Figure 2.1: Boundary Setting of CO2 Efficiency
Source: Tahara et al., (2005)
According to Amemiya et al. (2008), recycling waste of main products should decrease
the effect of environmental burdens by substitution or reuse for another process. By
recycling, eco-efficiency study shows higher conversion or yield and more energy
saving. Eco-efficiency can be performed by process modifications or improvements or
technological innovation, or also finding alternatives in order to create more value with
lower environment impact.
2.5.2. Eco-efficiency in Indonesia
Environmentally sound development is in accordance with the mandate of the laws and
regulations in Indonesia that is intended to provide the greatest possible benefit to the
surrounding environment affected by an activity. Another expected benefit is also in
social aspect that is for safety, comfort and welfare of the society.
Although all the elements of eco-efficiency is still not fully implemented, but basically
the government has begun implementing eco-efficiency concept. This can be seen from
Industry B
Industry C
Industry D
Industry A
Indirect CO2 emission Direct CO2 emission
Producer’s Price
Product
Cost
Gross Value Added

26
the government regulations on quality standards requirements for air emissions, and
wastewater of various types of industries.
According to Said (2002), the implementation of eco-efficiency concept in Indonesia
has been widely encouraged in agro industry sector. This concept aims to increase
resource productivity. The implementation of eco-efficiency has been initiated for
industries that are involved in palm oil, coconut and fishery.
Indonesia Water Resource Network ( JSDA) (2010), conducted various seminars related
to eco-efficiency. Discussion resolves around the management of water resources which
should implement the concept of Green Growth to institutionalize eco-efficiency,
particularly eco-efficiency in water infrastructure (BAPPENAS, 2010).
2.5.3. Measuring Eco-Efficiency
Eco efficiency is calculated as:
(Economic value added)/(Environmental impact added), ( Eq.1)
and can be represented by
(Product or Service value)/(Environmental influence). (Eq.2)
According to WBSCD (2000), Dunning (2004), products or service value is adapted to
the business that can be operated: quantity of goods or services produced or provided to
costumers or net sales. Therefore it can be expressed in volume or mass of raw material
or product of ongoing process. Besides, it can also be expressed as monetary, to show
eco-efficiency is related to money. Meanwhile environmental influences can be divided
into two parts: environmental influences during service creation and during service use.
Environmental influences during service creation involve the use of materials, energy

27
consumption, water consumption and emissions. Environmental influences during
service use concern on packaging usage, energy consumption, and emissions during use.
Taeko et al., (2004) mentioned that in Japan, product value can be shown as functions
and performance. Tabel 2.4 shows components as a function of product value
(numerator).
Table 2.4: Example of an Eco-Efficiency Indicator – Product value (Numerator)
Item Product
examples
Examples of items applied
Physical quantities - Amount of sales, production volume (units, kg,
tons, etc.)
Economic value - Amount of sales, profits or income (currency)
Functions and
performance
Refrigerators Capacity, cooling speed, freezing speed
Personal
computers
MPU professing capacity, hard disk capacity
Scanners Optical performance, media processing
performance, data processing performance
Washing
machines
Washing capacity, product service life
Printers Printing speed, image quality
Radiators Ease of disassembly, product service life,
number of parts
Cell phones Calculation speed, memory, LCD, battery
Source:(JEMAI, 2004)
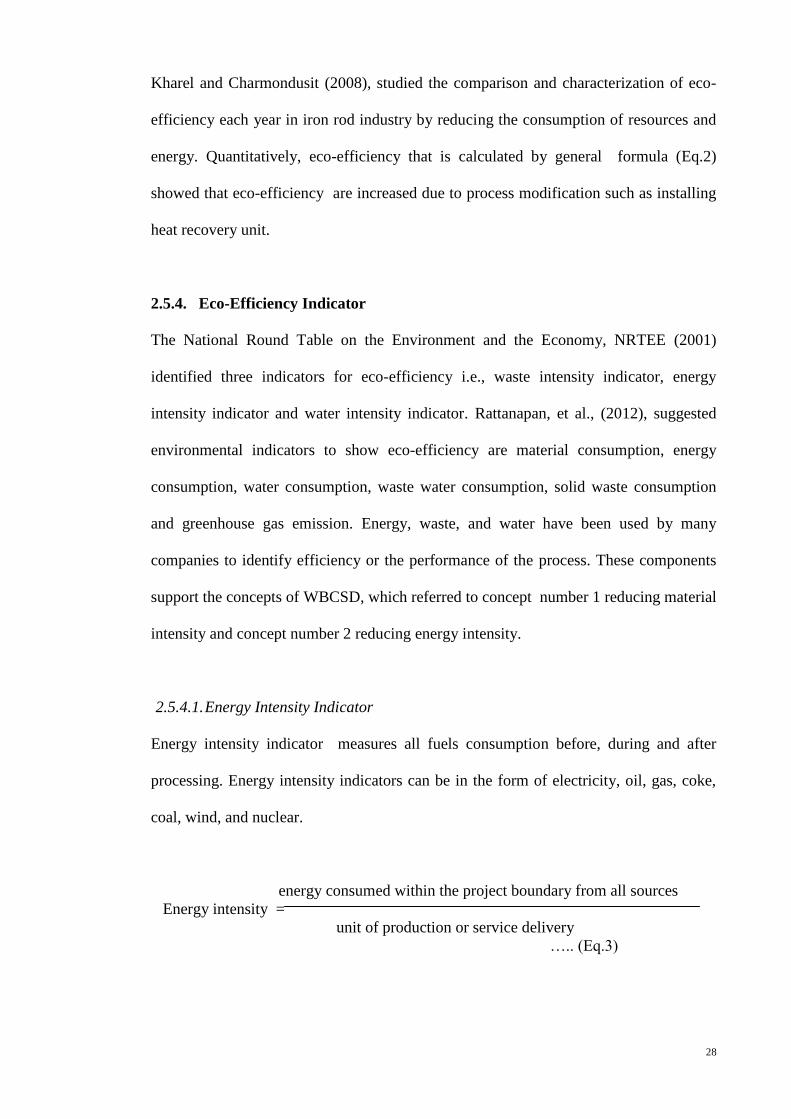
28
Kharel and Charmondusit (2008), studied the comparison and characterization of eco-
efficiency each year in iron rod industry by reducing the consumption of resources and
energy. Quantitatively, eco-efficiency that is calculated by general formula (Eq.2)
showed that eco-efficiency are increased due to process modification such as installing
heat recovery unit.
2.5.4. Eco-Efficiency Indicator
The National Round Table on the Environment and the Economy, NRTEE (2001)
identified three indicators for eco-efficiency i.e., waste intensity indicator, energy
intensity indicator and water intensity indicator. Rattanapan, et al., (2012), suggested
environmental indicators to show eco-efficiency are material consumption, energy
consumption, water consumption, waste water consumption, solid waste consumption
and greenhouse gas emission. Energy, waste, and water have been used by many
companies to identify efficiency or the performance of the process. These components
support the concepts of WBCSD, which referred to concept number 1 reducing material
intensity and concept number 2 reducing energy intensity.
2.5.4.1. Energy Intensity Indicator
Energy intensity indicator measures all fuels consumption before, during and after
processing. Energy intensity indicators can be in the form of electricity, oil, gas, coke,
coal, wind, and nuclear.
energy consumed within the project boundary from all sources
Energy intensity =
unit of production or service delivery
….. (Eq.3)
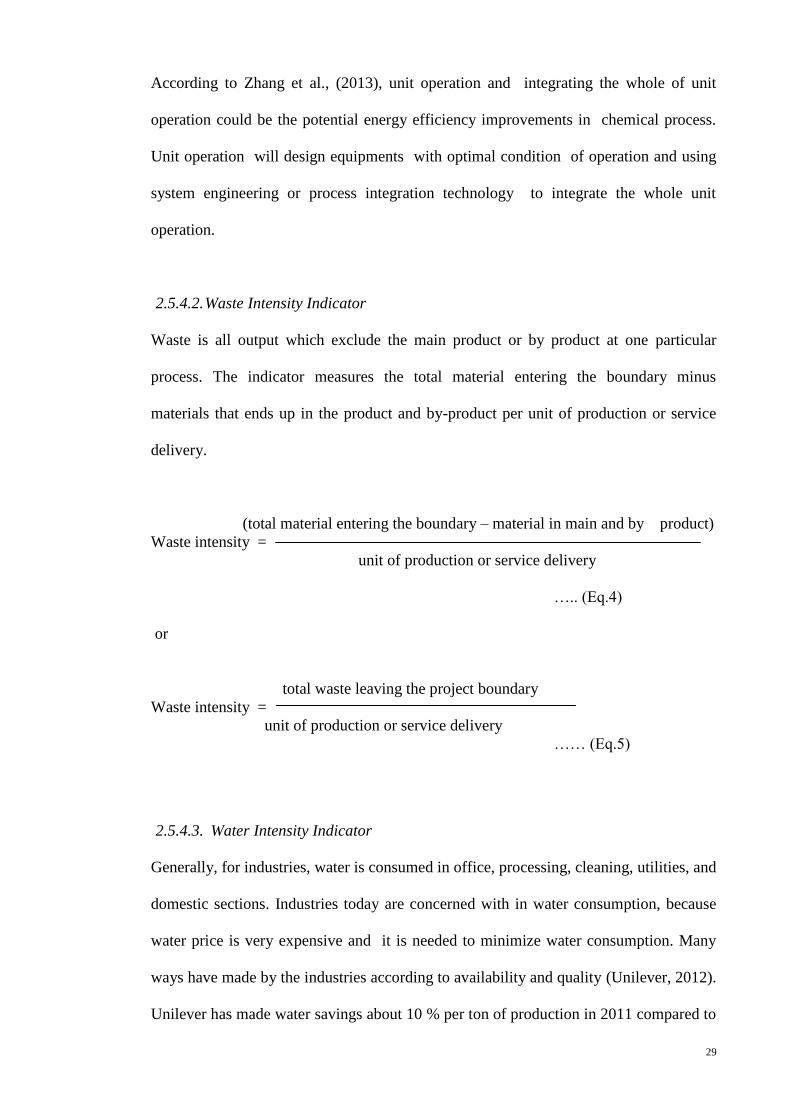
29
According to Zhang et al., (2013), unit operation and integrating the whole of unit
operation could be the potential energy efficiency improvements in chemical process.
Unit operation will design equipments with optimal condition of operation and using
system engineering or process integration technology to integrate the whole unit
operation.
2.5.4.2. Waste Intensity Indicator
Waste is all output which exclude the main product or by product at one particular
process. The indicator measures the total material entering the boundary minus
materials that ends up in the product and by-product per unit of production or service
delivery.
(total material entering the boundary – material in main and by product)
Waste intensity =
unit of production or service delivery
….. (Eq.4)
or
total waste leaving the project boundary
Waste intensity =
unit of production or service delivery
…… (Eq.5)
2.5.4.3. Water Intensity Indicator
Generally, for industries, water is consumed in office, processing, cleaning, utilities, and
domestic sections. Industries today are concerned with in water consumption, because
water price is very expensive and it is needed to minimize water consumption. Many
ways have made by the industries according to availability and quality (Unilever, 2012).
Unilever has made water savings about 10 % per ton of production in 2011 compared to

30
2010. This is done, among others, by water audits, advanced control and integration of
cooling and cleaning systems, investment in water treatment technologies to enable
water recovery and reuse, and also rainwater harvesting (Unilever, 2012).
water taken into boundary
Water intensity = … (Eq.6)
unit of production or service delivery
2.6. Routes To Eco-Efficiency
There are 10 types of management tools to improve the quality of products and profit by
developing environmental management which involves:
2.6.1. Cleaner production
Cleaner production is a preventive action, intends to minimize waste and emissions and
maximize product output by considering the environment aspects since raw material,
processing and consumption stages. It is intended to: choose raw materials that
contribute less impact to environment, making material and energy balances of the
process will produce cleaner processing. Cleaner production considers the entire life
cycle of products (EPA, 2007) including modifying process, selection of raw materials,
optimizing the use of energy and raw material, on site recovery and recycling, and
managing all used products in its life cycle.
Cleaner production reduces production cost, increases competitiveness of new and
improved technologies, reduces risk from site treatment, storage and disposal, improve
health and safety, etc.
31
Cleaner production and eco-efficiency has a symbiotic relationship, in which eco-
efficiency focusing on the strategic side of business as value creation and cleaner
production on the operational side of business as production (van Berkel, 2007).
2.6.2. Environmental management system
The first Rio Summit held in 1992 resulted in a commitment towards protection of the
environment across the world. An Environmental Management System (EMS) is a set
of processes and practices that enable an organization to reduce its environmental
impacts and increase its operating efficiency. EMS contains procedures which identifies
the impact to the environment and describe how to manage the company (USEPA,
2012).
The company’s commitment will be shown by certification of its EMS to the ISO 14001
standard. EMS will assist the company responsibility and commitment for the future
condition by reducing damage to the environment, which relates well to eco-efficiency
concept.
2.6.3. Environmental auditing
Environmental audits evaluates sets goals for the future ecological performance and
handles freely, objective, credible and this transparently. Today many companies use
environmental audits as a tool to determine compliance to attain a clean environment.
Environmental audit listed in ISO 19011 (2002), among others contains the basic
instructions on auditing, program management, environmental management system
audit.
Environmental audit is used as a tool to assist in assessing the condition of a company's
environmental management systems, to reduce risks to the environment caused by the
activities.
32
2.6.4. Public environmental reporting
Any activity that would cause impacts to the environment should be reported or made
some form of a report which aims to determine the impact of activity level, so that the
community and the government can monitor. Reporting aims to determine the
characteristics of activities and can be done periodically for the parameters that have a
tendency to damage (PSA, 2006).
According to Natural Heritage Trust (2000) there are some benefits by doing public
environmental reporting i.e.: increasing marketing chance, to intensify commitment, to
enhance relationships between government who executes the regulation, industry and
non government organization.
2.6.5. Design for environment
Planning stages of process or choosing of material are important, which the goal is to
reduce the environmental impact of the process. The design can be done by minimizing
the use of materials, reusable or recyclable. Based on this information is seen that the
design for the environment supports eco-efficiency concepts.
2.6.6. Product stewardship
The industries are the parties that contribute damage the environment. Therefore, the
industries have huge responsibility for maintaining environmental balance (EPA, 2005,
2012).
Product stewardship is done to protect the environment using product centered
approach. Thus, product stewardship should reduce the impacts of products since
processing until disposal. Product stewardship is also known as extended product

33
responsibility, is a shared responsibility in the product life cycle of the whole chain.
Stakeholder involved in the activity include designers, manufacturers, retailers,
consumers, waste managers and disposers to reduce impacts to the environment.
2.6.7. Life Cycle Assessment
According to Das (2005), Life Cycle Assessment (LCA) is a concept as well as a tool to
determine the amount of burden to the environment as a result of human activity. The
assessments of activities are reviewed from extraction until disposal, known as from
cradle to grave. The activities are from extracting phase of raw material, production
phase, distribution phase and use phase and disposal. Activities can also be reviewed
between cradle to grave, known as the gate to gate, such as during processing. Material
use, energy use and waste released to the environment are reviewed quantitatively and
qualitatively. The advantage of using LCA principles helping decision makers to choose
a series of activities that will give the smallest effect to the environment.
LCA has been standardized as a new standardization by the International Organization
for Standardization, ISO 14040 includes Principles and Framework and ISO 14044
includes Requirements and Guidelines (Finkbeiner, 2006). These new standardizations
changed Life Cycle Impact Assessment (LCIA) to the new standards.
Life cycle impact assessment (LCIA) is a tool to identify the impact of a product,
process or service over its life cycle by identifying quantitatively the energy and
materials used, and wastes released to the environment.
34
2.6.8. Supply chain management
A supply chain is a network of facilities and distribution of products from raw material
until finished products to the customer. According to Ganeshan and Harrison (1995),
this network are varies between industry or firm and is a combination of art and science
to improve the industry. Planning, source, making, delivering and returning are five
basic components of supply chain management. Planning will result in less cost and
more efficient by monitoring supply chain. Source continuity should be maintained
and make scheduling for the activities from production until delivery. Industry should
have a good solution for the consumers and be able to accept return for the excess or
defect product. These five components support eco-efficiency.
2.6.9. Environmental accounting
Process industry will deliver results in the form of main products and by-products. By
products usually give lower value than the main product. Sometimes byproducts can be
converted to some monetary value but it often becomes a burden to the environment as
a waste. As a waste by product, this potentially could damage the environment.
Accounting must be done to obtain environmental burdens of the activities, so as to
given information on how eco-efficient the activities are.
2.6.10. Ecological Footprint
Ecological footprint is a quantitative measure showing the appropriation of resources by
human beings (Klemes and Cucek, 2013) and based on Global footprint network (2012),
ecological footprint will measure the amount of resources use and the amount of waste
which is released to the earth using prevailing technology. According to Teijin (2012),
eco footprint can also be interpreted as the cost of conducting the activities. The
environmental costing is kept to a minimum, therefore the company can compete with
35
similar activities from other companies. Activities are assessed using life cycle analysis
and eco-efficiency analysis.
It can be concluded that in the global trend there are various assessment tools and
system which has been adopted and proven. Therefore industry should taken up a step
to adopt these tools for better management in industry, manufacturing and services.
2.7. Life Cycle Assessment (LCA)
People today are concerned with the issue of environmental degradation and decrease of
natural resources. In turn this causes entrepreneurs to improve, among others company
trends by implementing greener processes, starting from selecting raw materials,
processing, and packaging, to transportation. Prevention the pattern of activities carried
out the benefits and improving environmental performance simultaneously.
According to UNEP (2004), life cycle thinking is one of the main ways to reduce
emission to environment by reducing resource use and also to enhance performance of
socio-economic through life cycle. Life cycle perspective helps ensure that the
activities are environmentally sound, have competitive advantage, reduce costs, and
designing a result in better product.
LCA is currently regulated in ISO 14040 (2006) and ISO 14044 (2006). ISO 14040 is
about the technical requirements which describe the principles and framework and ISO
14044 is about requirements and guidelines. The structure of life cycle assessment is as
shown in Figure 2.2.

36
Figure 2.2: Structure of Life Cycle Assessment
Source: ISO 14040 (2006)
2.7.1. Goal and Scoping
Goal and scope is needed to limit the issues to be discussed which consists of the
purpose of doing LCA and the limits of the methodology to be used. Functional unit
will show the magnitude of the activities carried out, can be expressed as a unit of time,
flow rate, and system boundary will limit activities that will be reviewed.
2.7.2. Life Cycle Inventory
Life cycle inventory aims to collect all the data input-output that are relevant to a
system.
Steps of life cycle inventory include (Das, 2005):
Goal and Scope
Life Cycle
Interpretation
Life Cycle Inventory
Life Cycle Impact
Assessment
Functional unit
System boundary
Conclusion
37
a) Developing flow diagram that will show and explain stages of process, material
and energy balances. Stages in life cycle inventory are according to system
boundary.
b) Planning for data collection because it is very important to obtain accurate data.
c) Collecting data: data that should be collected primarily in this research involve
material balance, chemical using, energy balance and water balance, air
emission, wastewater and secondary data such as site visit and interviewing
experts in the same plant.
d) Evaluating of accuracy of all data that have been collected.
2.7.3. Life Cycle Impact Assessment
Life Cycle Impact Assessment is an assessment of the impact that occurs in the
environment and on human health due to an activity during the life cycle inventory.
Steps of life cycle assessment consist of (Das, 2005):
a. Select and define impact categories that relate with goal and scope
b. Classification to assign life cycle inventory results to the impact category
c. Characterization to know impact categories based on life cycle inventory
d. Normalization to compare impact categories on each other by dividing indicator
result to a reference value
e. Grouping to rank the indicator of impacts
f. Weighting to compare impact categories on each other based on importance or
relevance
g. Evaluating the potential impact after calculating selected category of impact.
Life cycle impact assessment is a step to evaluate the impact of inventory phase after
calculation, such as damage assessment and impact categories. Eco-Indicator 99 is
chosen because this methodology is more complete in its impact categories compared to
38
others; such as CML 92, Eco-Indicator 95. Impact assessment will be characterized by
calculating or quantifying the effect of burdens to environment. Eco indicator 99
methodology calculate indicator scores to construct an environmental assessment
through impact assessment of the activities. The higher the indicator, the greater the
environmental impact (Baayen, 2000).
The resulting scores present a suggestion for product enhancement.
According to Eco-Indicator 99, three types of environmental damage should be
evaluated: human health, ecosystem quality and resources. Selection of impact
categories involves,
Damage assessment of human health: respiratory organic, respiratory inorganic,
carcinogen, climate change, ozone layer depletion.
Damage assessment of ecosystem quality: acidification or eutrophication and
land use.
Damage assessment of resources: mineral and fossil resources.
Damage to Human Health are stated in Disability Adjusted Life Years (DALY), and
build on for carcinogen effects, respiratory effects, ozone layer depletion, climate
change and ionizing radiation.
Damages to Ecosystem Quality are expressed as Potentially Disappeared Fractions
(PDF), and shows disappearance of species in a certain area, because of environmental
issues. The damage is obtained by multiplying the PDF values to the area size and the
time period.
Damage category Ecosystem Quality consists of ecotoxicity, acidification and
eutrophication, land use and land transformation. Ecotoxicity is expressed as the

39
percentage of all species present in the environment living under toxic stress
(Potentially Affected Fraction or PAF). PAF is a toxic stress, not observable damage
should convert into real observable damage, i.e. convert PAF into PDF.
Damages to Resources are expressed as the surplus energy for the future mining of the
resources (as minerals and fossil fuel).
2.7.4. Life Cycle Interpretation
Life cycle interpretation is used to analyze and to assess the information generated from
the calculation of life cycle impact assessment (LCIA) based on the data contained in
the life cycle inventory (LCI). Conclusion obtained produce recommendations which
are reported in a transparent and consistent in accordance with the goal and scope.
CHAPTER 3
3. RESEARCH METHODOLOGY
3.1. Introduction
This chapter presents the framework that will support the methodology to be conducted
to achieve the objectives as listed in section 1.3. The activities involved are as shown in
Figure 3.1

40

41
Figure 3.1: Framework and Stages of Research Methodology
3.2. Setting the objectives of the study
The framework and stages of this study are based on the ISO 14040 and Eco-Efficiency
principles.
Setting the Objectives of Study
Inventory data collection:
material (rubber and chemicals)
consumption
energy consumption
water consumption
residual: air emission and wastewater
Conclusions and Recommendations
Interpretation and Evaluation
Calculation
-Life Cycle Impact Assessment (LCIA)
-Eco-Efficiency (WBCSD)
-Eco-Efficiency Indicator (NRTEE)
LCA methodology and software selection
Selection of 2 (two) Natural Rubber Latex
Concentrate Factories
42
3.3. Selection of 2 (two) Natural Rubber Latex Concentrate Factories
According to Haris (2010), currently there are fifteen latex concentrate factories in
Indonesia. Latex concentrates produced from natural rubber are commercially available
as High Ammonia (HA) latex concentrate and Low Ammonia (LA) latex concentrate.
Concentration of ammonia in High Ammonia latex concentrate is 6.0 -7.0 g NH3/ liter
of latex and 4 -5g NH3/ liter of latex for Low Ammonia latex concentrate. HA latex
concentrate is used to produce foam products, dipped goods, adhesives, elastic thread,
household and industrial gloves, balloons, rubber bands and finger cap. LA latex has
several advantages which include better quality, lower cost of production by way of
savings in preservatives, acid and lower cost of effluent treatment (INR, 2012).
Ammonia is added during the process to enhance the preservation of latex but
depending on specific requirements of the customer, various amounts are added to the
concentrated latex.
The scope of this study covers high ammonia latex concentrate processing since most of
the latex concentrate production in Indonesia produces HA latex concentrate.
Production of latex concentrate in Indonesia is 42,480 ton each year and mostly for HA
latex concentrate (Haris, 2010). This is because of the difficulty to maintain the stability
of LA latex concentrate. Selection of Factory A and Factory B for this study is based
on:
3.3.1. Location of the factory
Factory A and Factory B are located in North Sumatera, Indonesia. Thus it is expected
that the composition and substances of natural rubber are generally the same. Hence
information on the existing results are based on the differences in the processing of the
field latex.

43
Factory A is located in the city of Tebing Tinggi which is 60 km away from the city of
Medan at an altitude of 26 –34 m above sea level. Factory B is located at a distance
about 80 km from the city of Tebing Tinggi or 140 km from Medan at an altitude of 3
m above sea level. Figure 3.2 shows the location of the two factories.
Figure 3.2: Location of the Natural Rubber Latex Concentrate Factories
Source:Asia Maya.com- Sumatera,(2012)
3.3.2. The process and product
The two factories chosen produce latex concentrate as the main product and skim latex
as by-product and both use centrifugation as a separation process. There are ancillary
equipments and chemicals to support the operation of the whole process. In addition
there are also variations in the amount and types of chemicals used, which may result in
differences in the quality and quantity of the product. Figure 3.3 shows the scheme of
separation process in natural rubber latex concentrate.

44
Figure 3.3: Process Separation Scheme of Field Latex
3.3.3. Data availability
Basically, data availability is one of the reasons in the selection of factories. Adequate
and accurate data are expected to be the basis for the achievement of the existing
objectives described in Chapter 1.
3.4. Inventory Data Collection
Inventory data were collected to get an overview of the process for each factory. Data
collected include materials (rubber and chemicals) consumption, energy consumption,
water consumption, air emission and wastewater quality. The flow diagram of the
overall process of natural rubber latex concentrate is shown in the Figure 3.4
Process of
Separation
Process of
Coagulation
Latex Concentrate
Field Latex
Skim latex
Block Skim Rubber
Serum

45
Figure 3.4: Overall Process Flow in Natural Rubber Latex Concentrate Processing
3.4.1. Material Inventory
Materials were divided into two parts, rubber balance and chemical consumption.
3.4.1.1. Rubber
Rubber balance is made to determine the concentration or amount of overall dry rubber
which will show the amount of rubber in the input and output of the process. Figure 3.3
shows that the input of the process contained rubber with known composition from
laboratory analysis. The outputs that contain rubber such as in the pond, skim latex and
losses were also obtained from laboratory analysis. Losses or waste were obtained by
doing rubber balance which then give the efficiency and impact to environment from
natural rubber latex concentrate processing.
P R O C E S S
Field latex
Chemicals
Energy
Water
Skim latex
Water
Losses
Wastewater
Air Emission
Main Product: Latex Concentrate
P R O C E S S
Product: Block Skim Rubber
Lump
Energy
Chemicals

46
Rubber balance will show the composition of rubber in field latex (input) and rubber
output as main material in latex concentrate. The difference between rubber input and
output in main product and by product is waste and will be used in eco-efficiency
indicator determination. Data of rubber balance will be obtained directly from the
records of the natural rubber factories.
3.4.1.2. Chemicals
Chemicals used in natural rubber latex concentrate processing have the ability to pollute
the environment. These data are needed to evaluate the impact to the environment and
will be obtained directly from the records of natural rubber latex concentrate processing.
3.4.2. Energy consumption
Energy in natural rubber latex concentrate processing can be divided into two parts, the
energy used to produce concentrated latex and block skim rubber. The energy is
required to move the rotator during mixing for the purpose of homogenizing the
chemical preservatives and energy is also consumed in the centrifuge to separate rubber
and non rubber. The equipments that consume energy in latex concentrate processing
are onvangen tank, centrifuge, mixer and storage tank. Process production of block skim
rubber also use energy to move the conveyor, for cutting tools, pressing, and in the
drying process. The equipments that consume energy in block skim rubber are fan
basin, macerator, creper, hammer mill, dryer and pressing. Energy consumption data is
used to identify the impact to environment during process phase and obtained directly
from the records in natural rubber latex concentrate processing. Energy consumption
data will be used in energy intensity indicator as one of the indicators in eco-efficiency.

47
3.4.3. Water consumption
Most of the water is used to coagulate skim latex, others for cleaning the equipment and
washing the rubber lumps from plantation and solid rubber from coagulation pond.
Water consumption in natural rubber latex concentrate processing will be used to
determine the impact to environment due to water consumption and to identify water
intensity indicator in eco-efficiency indicator determination. Water consumption data
will be obtained directly from the records of natural rubber latex concentrate processing.
3.4.4. Residual
The processing of natural rubber latex concentrate also produces some residues
including gas, liquid and solid. Gas residue comes from chemical use, such as ammonia
and fuel combustion. Liquid residuals known as wastewater mainly consist of water,
which comes from cleaning of equipments in latex concentrate processing, washing the
coagulum and rubber lumps and from latex itself in block skim rubber processing.
Solid residue is rubber that did not participate as a product either in latex concentrate
and block skim rubber. Solid are usually found in wastewater from coagulation pond
have poor quality and sell at a lower price.
3.4.4.1.Gas
Gas as part of the residue in natural rubber latex concentrate processing will create air
emissions. Air emissions are emissions generated during the process, which comes from
stationary source, such as generator, dryer, and boiler. Air emissions data are obtained
by direct measurement of parameters in accordance to the standard parameter set by the
regulation of the Ministry of Environment Republic of Indonesia, Kep-
13/MENLH/3/1995 on standards of quality for air emission from stationary source as
shown in Table 3.1. These data are needed to determine if these emissions are still
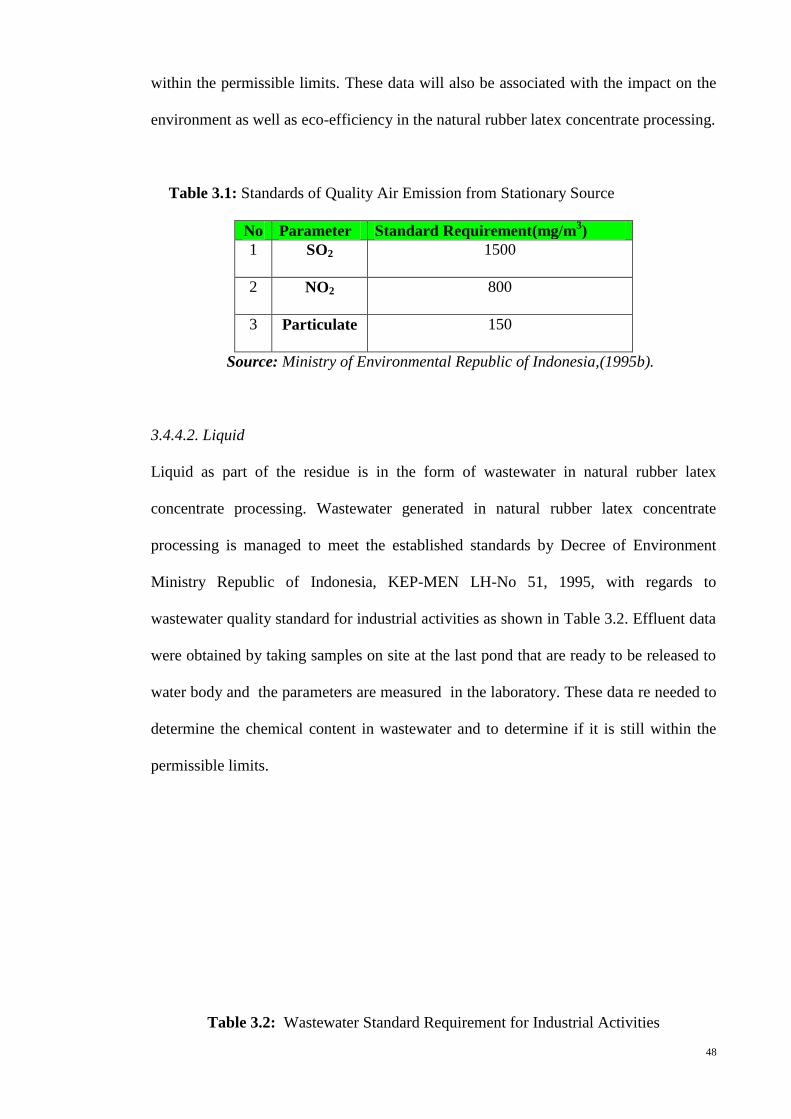
48
within the permissible limits. These data will also be associated with the impact on the
environment as well as eco-efficiency in the natural rubber latex concentrate processing.
Table 3.1: Standards of Quality Air Emission from Stationary Source
No Parameter Standard Requirement(mg/m3)
1 SO2
1500
2 NO2
800
3 Particulate
150
Source: Ministry of Environmental Republic of Indonesia,(1995b).
3.4.4.2. Liquid
Liquid as part of the residue is in the form of wastewater in natural rubber latex
concentrate processing. Wastewater generated in natural rubber latex concentrate
processing is managed to meet the established standards by Decree of Environment
Ministry Republic of Indonesia, KEP-MEN LH-No 51, 1995, with regards to
wastewater quality standard for industrial activities as shown in Table 3.2. Effluent data
were obtained by taking samples on site at the last pond that are ready to be released to
water body and the parameters are measured in the laboratory. These data re needed to
determine the chemical content in wastewater and to determine if it is still within the
permissible limits.
Table 3.2: Wastewater Standard Requirement for Industrial Activities

49
Source: Ministry of Environmental of Republic Indonesia, (KLH, 1995a)
3.4.4.3. Solid
Solid refers to rubber that did not contribute as a product either in latex concentrate
and block skim rubber. In this research, solid waste is usually found in wastewater from
coagulation pond and possess poor quality and thus sells at a lower price.
3.5. Life Cycle Assessment Methodology
In this study the environmental impact of natural rubber latex concentrate processing
during the life cycle is determined by using LCA methodology that follow the ISO
14000 series. Among the software available at University of Malaya research group
are Simapro 7, JEMAI, and GABI. Simapro7 provides more library function and thus
able to provide more extensive data in this work compared to JEMAI and GABI. Some
data were not found in GABI or JEMAI such as Diammonium phosphate, formic acid,
sulfuric acid and zinc oxide. Thus Simapro 7, is used for calculation of environmental
burdens during this study.
No. Parameter Unit Standard
Requirement
1.
2.
3.
4.
5
6.
pH
BOD5
COD
TSS
NH3 Total
N-Total
mg/ L
mg/ L
mg/ L
mg/ L
mg/ L
6-9
100
250
100
15
25

50
3.5.1. Procedure Life Cycle Assessment Methodology
3.5.1.1. Goal and Scope
The objective of the study is to assess the impact of water, energy and material uses and
releases to the environment in natural rubber latex concentrate processing to produce
latex concentrate and block skim rubber
3.5.1.2.System Boundary
The system boundary on natural rubber latex concentrate processing in this research is
chosen from entry field latex into the factory until production of concentrated latex as
the main product and block skim rubber as the by product. This system boundary is
shown in Figure 3.5 for Factory A and Figure 3.6 for Factory B.
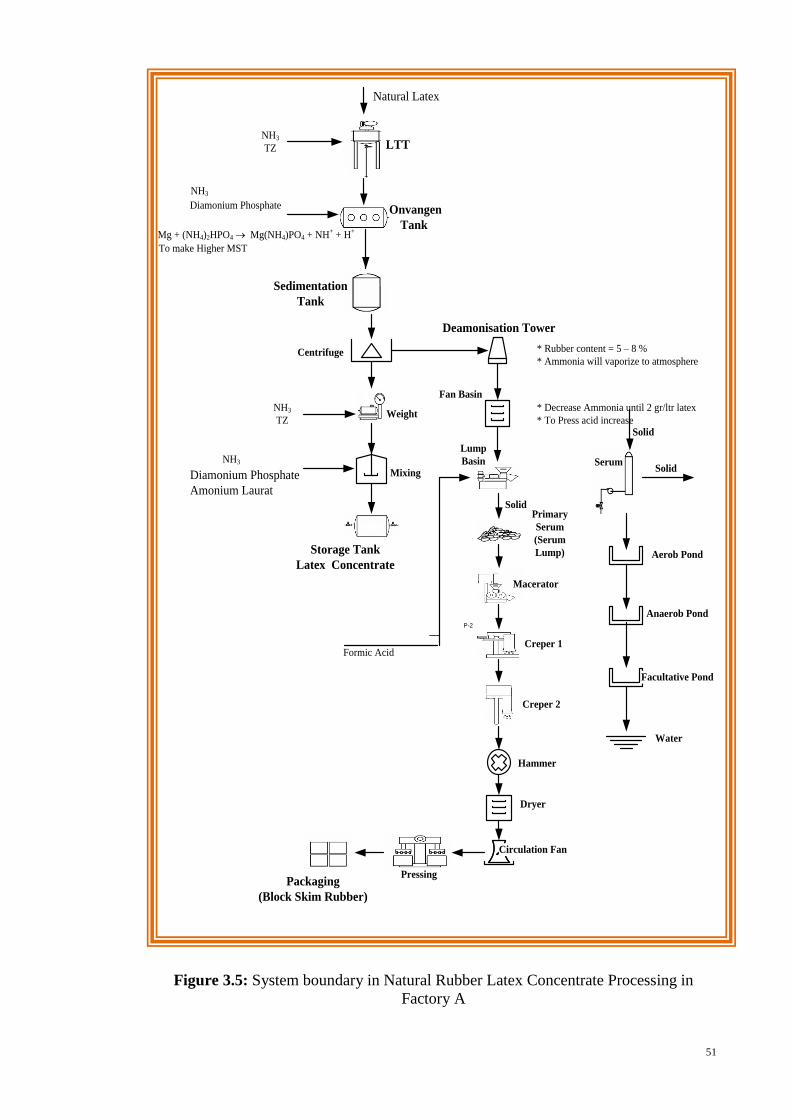
51
Hammer
Dryer
Circulation Fan
Mixing
Centrifuge
Deamonisation Tower
Fan Basin
Aerob Pond
Anaerob Pond
Facultative Pond
LTT
Onvangen
Tank
Natural Latex
NH3
TZ
NH3
Diamonium Phosphate
Mg + (NH4)2HPO4 ® Mg(NH4)PO4 + NH+ + H+
Sedimentation
Tank
Weight
Storage Tank
Latex Concentrate
NH3
TZ
NH3
Diamonium Phosphate
Amonium Laurat
Lump
Basin
SolidPrimary
Serum
(Serum
Lump)
Macerator
Creper 1
Creper 2
PressingPackaging
(Block Skim Rubber)
Formic Acid
Water
Solid
SolidSerum
* Rubber content = 5 – 8 %
* Ammonia will vaporize to atmosphere
* Decrease Ammonia until 2 gr/ltr latex
* To Press acid increase
To make Higher MST
P-2
Figure 3.5: System boundary in Natural Rubber Latex Concentrate Processing in
Factory A

52
Dryer
Cooler
Centrifuge/
Separator
Aerob Pond
Anaerob Pond
Facultative Pond
Diammonium Phosphate
Mg + (NH4)2HPO4 ® Mg(NH4)PO4 + NH+ + H+
Storage Tank
(Latex Concentrate)
NH3
Solid
Extruder
PressingPackaging
(Block Skim Rubber)
H2SO4
Water
Waste water
from
processing
SolidSerum
To make Higher MST
Weighing tank
Receiving Tank
Field Latex
Blending Tank
Coagulation
pond
Pre-breaker
Skim Latex
P-47
Lauric acid
Blow case
lauric acid
TZ
P-49
Figure 3.6: System boundary in Natural Rubber Latex Concentrate Processing in
Factory B

53
3.5.1.3. Functional Unit
The functional unit of the study is to process 1,000 kg concentrated latex and 1,000 kg
block skim rubber.
3.5.2 Life Cycle Inventory
Steps of life cycle inventory include (Das, 2005):
Making flow diagram that will show and explain stages of processes, materials
and energy balance. Stages in life cycle inventory is according to system
boundary as shown in Figure 3.5 and Figure 3.6
Planning for data collection; in this research collecting data such as rubber
balance, chemical consumption, energy consumption and water consumption, air
emission, wastewater quality
Collecting data; data that should be collected primarily such as measuring air
quality and wastewater quality and secondary data such as site visits and
interviewing with experts in both factories.
Evaluating all data that had been collected accurately.
3.5.3. Life Cycle Impact Assessment
Life cycle impact assessment is a step to evaluate the impact of natural rubber latex
concentrate processing, such as damage assessment and impact categories.
3.5.3.1. Eco-Indicator 99
Eco-Indicator 99 is chosen for calculating impacts and damages to the environment
because this methodology is based on the damage oriented approach (endpoint) and
directly express environmental problem as it is (Reno, 2010). Hierarchical version (HI)
54
is choosed as a damage model, because this version can be used in long and short term
perspectives. HI commonly use in the scientific community and policy makers
(M. Goedkoop, & Spriensma, R, 2001).
Three conditions affecting human and environment are used in this research. They are
human health, ecosystem quality and sufficient supply of resources. Eleven impact
categories were developed, namely carcinogen, respiratory organic and inorganic,
climate change, ozone layer depletion and ionizing radiation, ecotoxicity, acidification
and eutrophication, land use, land transformation, minerals and fossil fuel. Description
of damages and impact categories are presented in section 2.7.3
3.5.3.2.Normalization
Damages and impact categories have different units, it can not be compared to each
other directly. All components in damage assessment and impact categories can be
compared each other through normalization procedure.
3.5.3.3.Weighting
Weighting is done by following the procedures from Eco-Indicator 99 to obtain the
important categories after normalization and makes it possible to compare the categories
directly. The unit of weighting is point where one point shows the weightage of impact
from one mille-person equivalent (the impact per year on 1/1000 persons).
3.6. Eco-Efficiency Methodology
Eco-efficiency measurements on natural rubber latex concentrate processing use
calculation as proposed by WBCSD and NRTEE for eco-efficiency indicators.
55
Based on WBCSD (2000) calculation, the numerator is the mass which in this case is
the functional unit, with the reason this number remains constant as compared to
monetary values which are always fluctuating. Economic value or price of natural
rubber is not used because the price is always changing or fluctuates so it is difficult to
make conclusions. The denominator selected are damages and impact categories that
affect the environment by using eco-indicator 99.
Eco-efficiency with LCA based method will reduce eco-burden of the product and
enhance the price in the market. Better characteristics are obtained with this two
dimensional approach, resulting in lower cost at a higher value (Mestre, 2013).
According to WBCSD (2000) definition;
Eco-efficiency = (Mass)/(Environment influence or Environment burdens) …(Eq. 7)
Environmental influence or environmental burdens are defined according to eco-
indicator 99 as follows:
a. Damage assessment
- Human Health
- Ecosystem Quality
- Resources
b. Impact categories that are included in the damage assessment are:
- Carcinogens
- Respiratory organics
- Respiratory inorganics
- Climate change
- Radiation

56
- Ozone layer depletion
- Ecotoxicity
- Acidification/Eutrophication
- Land use
- Mineral
- Fossil fuels
According to NRTEE (2001), eco-efficiency indicator in this research consists of energy
intensity indicator, water intensity indicator, and waste intensity indicator. Energy data
were obtained by calculating the energy consumed for every equipment. Water
consumption was determined from the data in the factory and waste data was obtained
by measuring the total rubber entering the system boundary minus the material that ends
up in the product and co-product per unit of production.
energy consumed within the system boundary
Energy intensity = (Eq 8)
mass of product
(Rubber input–Rubber output) within the system boundary
Waste intensity = (Eq. 9)
mass of product
Water taken in within the system boundary
Water intensity = (Eq.10)
mass of product
3.7. Comparison between two factories
This study will compare primary data, environmental impact and the eco-efficiency
from both factories.

57
3.8. Interpretation and evaluation of the result
Interpretation is made after calculation of the impact and eco-efficiency from both
factories have been completed. This procedure is then continued by the evaluation step.
3.9. Conclusions and Recommendations
Conclusion and recommendations are presented after interpretation. Step has been
completed.

58
CHAPTER 4
4. RESULTS AND DISCUSSION
4.1 Introduction
This chapter presents the results obtained following the procedure described in Chapter
III. Discussion on the results are described in relation to the outcome of the study. Two
factories that produce concentrated latex as the main product and block skim rubber as a
by-product had been selected as test sites. Data were collected from both factories and
subsequent calculations using Eco-Indicator 99 were made to determine the life cycle
impact assessment. This step was followed by eco-efficiency calculation in order to
compare benefits of the activities against the impact resulting to environment.
4.2 Products
Factory A produces 3 different types of products namely rubber thread, rubber gloves,
rubber for export, while Factory B produces only a bulk intermediate product i.e. latex
concentrate known as centrifuged latex (Cenex)TM
.
The specifications for field latex and products are as described in Table 4.1 and Table
4.2 for Factory A and Factory B respectively.

59
Table 4.1: Specification of field latex and latex concentrate for Factory A
Parameter
Specification
Feed
( field latex)
Products (Latex Concentrate)
Rubber
Thread
Rubber
Gloves
Rubber for Export
Dry rubber content
(DRC)
(28-30)% (60-60.2) % (60-60.2) % (60-60.2) %
Volatile Fatty Acid
(VFA)
≤0.050% 0.02 0.02 0.02
TSC
max 61.3 max 61.3 max 61.3
PNo (P number)
≤0.0250%
NH3
LA: 0.4-0.5%
HA:>0.5-0.7%
4.5 g/ L latex 7-7.5 g/ L latex LA: 2.5-3 g/ L latex
HA: 7-7.5 g/ L latex
pH
9.90-10.20 10.50-10.90 10.50-10.90
Salts
0.5% - - -
Carbohydrate
1.5% - - -
Protein
1.6% - - -
Water
±66.9%
KOH number
0.60 0.60 0.60
Mechanical
Stability Time
(sec)
600 600 600
Source: Factory A, 2008

60
Table 4.2: Specification of field latex and concentrated latex for Factory B
Parameter Specification
Feed
( field latex)
Product (CENEXTM
)
Dry rubber content (DRC)
30-35% Min 60%
Volatile Fatty Acid (VFA)
≤0.050% Max 0.02
PNo ( P number)
≤0.0250%
NH3
(0.35-0.50)% (0.75-0.84) g/ L latex
KOH number
- Max 0.74
Mechanical Stability Time
(sec)
- Max 1600
Total Solid Content (TSC)
- Min 2%
Copper content (ppm)
- Max 8
Manganese content (ppm)
- Max 8
Color ( visual)
- not blue or grey
Odor (neutralization with
boric acid)
- Odorless
Source: Factory B, 2008
As can be seen from Table 4.1 and Table 4.2 parameter specifications in each factory
are different for both products and field latex. The main parameters for field latex are
DRC, VFA, NH3, while for products TSC, MST and KOH are also added. Generally for
products parameters will be adjusted depending on the market requirements.
Specifications for block skim rubber where the parameters of interest are similar for
both factories are shown in Table 4.3.

61
Table 4.3: Specification of block skim rubber for Factory A and Factory B
Parameter
Maximum content
N
2.70%
Ash
1.00%
Volatile component
1.50%
Impurities
0.03
Source: Factory A and Factory B, 2008
4.3 Natural Rubber Latex Concentrate Processing
Both factories produce latex concentrate as main product and skim latex as a side stream
using field latex as the feed material. Block skim rubber is produced from coagulation
of skim latex known as coagulum mix with cup lump from plantation. This solidified
rubber is another product sold by the two factories.
It is important to note that the main unit operation for concentrating field latex is
centrifugation. There are minor differences in terms of other processing activities such
as blending of chemicals and cutting up of solid rubber. Section 4.3.1 and 4.3.2 describe
the actual process activities as practiced by Factory A and Factory B.
4.3.1 Processing in Factory A
4.3.1.1 Latex Concentrate Processing
Factory A processes 70,000 liter of field latex per day. The type of products generated
will depend on the market demand. The description of the whole process of latex
concentrate begins with the arrival of the field latex in tankers as described in Figure
4.1.

62
Hammer
Dryer
Circulation Fan
Mixing
Centrifuge
Deamonisation Tower
Fan Basin
Latex Transport Tank
(LTT)
in Weight Tank A
Onvangen
Tank
NH3
TZ
NH3
Diamonium Phosphate
Sedimentation
Tank
Weight
Tank B
Concentrated Latex
NH3
TZ
NH3
Diamonium Phosphate
Amonium Laurate
Coagulation
Pond
SolidPrimary
Serum
(Serum
Lump)
Macerator
Creper 1
Creper 2
Pressing
Packaging
Formic Acid
P-4
P-5
Storage Tank
Field Latex
Block Skim Rubber
Figure 4.1: Flow Diagram Natural Rubber Latex Concentrate Processing in Factory A
63
i. Weighing
All field latex from the plantation is placed in Latex Transport Tank (LTT) and later
weighed in the factory in order to determine the amount of field latex collected per day.
Every LTT which delivers field latex to the Factory will be weighed using a weighing-
bridge. The system boundary starts from this Weight Tank A.
ii. Latex Reception Area
Each and every Latex Transport Tank (LTT) arriving at the Factory will be sampled in
order to analyze the concentration of dry rubber content (DRC), Ammonia (NH3) and
Volatile Fatty Acid (VFA). The specification of the field latex entering the factory has
to meet the requirements in accordance with Table 4.1. The factory management will
refuse the field latex consignment if the specifications fail to meet the criteria to meet
the desired product quality and to avoid extra costs incurred due to the addition of
chemicals.
Latex from LTT is pumped slowly into the receiving tank known as Onvangen Tank
(OT) to avoid foam formation. Once again samples are taken from the Onvangen Tank
to determine the DRC and NH3 content.
For every input consignment, 1 ml of 10 % diammonium phospate ( DAP) per liter
field latex is added into Onvangen Tank to improve the mechanical stability time (MST)
property. This procedure is necessary to eliminate Mg2+
and Ca2+
which are present in
the latex. Mg2+
and Ca2+
can influence latex stability according to the following
reaction :
Mg2+
+ (NH4)2 HPO4 → Mg (NH4) PO4 ↓+ NH4+ + H
+

64
Ammonia will be added into the Onvangen Tank to prevent coagulation of latex. The
amount of NH3 added varies depending on the time before sedimentation stage as
described below:
NH3 : 5-7 g/ L field latex, for latex which is processed before 12 noon
NH3 : 7-8 g/ L field latex, for the latex which is processed after 12 noon.
NH3 : 8-10 g/ L field latex, when latex is processed after 24 hours from reception stage.
The difference in the amount of ammonia added depends on the interval between
tapping and processing in the factory. Long intervals cause the increase in amino acids
quantity due to the breakdown of the proteins in the field latex. Ammonia is added to
deactivate the enzymes which break protein into amino acids.
Before sending to the sedimentation tank, the field latex is swirled for about 15
minutes to homogenize the field latex. Then sampling is conducted to determine the
concentrations of total solid content (TSC), dry rubber content (DRC), ammonia (NH3)
and volatile fatty acid (VFA).
iii. Sedimentation
From the Onvangen Tank (OT), the preserved field latex is pumped in to the
sedimentation tank and left for 2-3 hours to separate calcium (Ca) and magnesium (Mg)
and other impurities such as carbohydrates and proteins. This sedimentation activity
will increase the efficiency of the centrifuge and to improve the stability of
concentrated latex. The sediment that is formed will be separated from the field latex
and sent to secondary pond. The quality of latex is controlled in the sedimentation
tank by periodic analyses in the laboratory, especially on VFA and NH3.

65
iv. Centrifugation
The process of centrifugation basically is to separate the rubber from the non rubber
contents, so that concentrated latex with the required properties is produced, namely,
dry rubber content 60- 63% and density of 0.94 g/cm3. Skim latex with DRC 5- 8%,
density about 1.02 g/cm3 is produced as a side stream which can be further processed
into solid rubber.
During centrifugation, field latex flows by gravity through a feed tube into the plates of
a bowl centrifuge which then flow through distributor tubes due to centrifugal force. As
the bowl rotates, latex is dissociated into two fractions, a light dense concentrated
latex and heavy dense skim latex (Figure 4.2). During this process DRC in the
concentrated latex can be varied by adjusting the size of the hole of skim discharge
(serum screw). In order to obtain concentrated latex with lower DRC and skim latex
with higher DRC long serum screw is used. The length of the screw determines the
distance to the center of centrifuge. If a higher value of DRC of concentrated latex is
required, then a shorter serum screw can be used. Generally the efficiency of process
can be calculated as :
latex field ofWeight
latex edconcentrat ofWeight Efficiency Processing

66
Figure 4.2: Centrifugation process where the light dense stream is concentrated latex
and heavy dense stream is skim latex
Source: Factory A, 2008
v. Weight Tank B
From the centrifuge concentrated latex is poured into the Weight Tank B. Chemicals are
added to the weight tank, depending on the product requirement.
Latex concentrate from Weight Tank B will be analyzed to determine the quality of
concentrated latex, as shown in Table 4.4.
Concentrated latex
Skim Latex
Centrifuge

67
Table 4.4: Specification of concentrated latex in Weight Tank B
Parameter Productions of Latex Concentrate
Rubber Glove Rubber Thread Rubber for export
NH3 7 g/L latex 4.5 g/L latex 7-7,5 g/L HA
2,5-2,7 g/L LA
TSC Maximum 61.30% Maximum 61.30% Maximum 61.30%
DRC 60-60.20% 60-60.20% 60-60,20%
VFA 0.020 0.020 0.020 (HA)
KOH Maximum 0.60 Maximum 0.60 Maximum 0.60
pH 10.30 10.30 10
Source: Factory A, 2008
vi. Mixing Tank
From Weight Tank B, latex concentrate flows into a Mixing Tank ( MT), where
1.75ml - 2.0ml ammonium laurate is added per liter concentrated latex. The analysis of
concentrated latex is as shown in Table 4.5.
Table 4.5: Specification of concentrated latex in Mixing Tank
Parameter Concentrated latex
High Ammonia Low Ammonia
60 % 60,5% 60 % 60,5%
NH3 7-7.5 g/L latex 7.3-7.5 g/L latex 2.5-2.7 g/L latex 2.5-2.7 g/L latex
TSC Max.1.8%>DRC Max.1.8%>DRC Max.1.8%>DRC Max.1.8%>DRC
DRC 60-60.20 60.5 – 60.6 60-60.20 60.5 – 60.6
VFA < 0.020 < 0.020 < 0.018 < 0.018
Source: Factory A, 2008

68
vii. Storage Tank
Concentrated latex which has met the quality requirements of NH3, DRC, VFA, and
TSC will be kept in the storage tank (Figure 4.3), for 7-10 days before being sold. The
retention time of 7 to 10 days is necessary to increase the property of Mechanical
Stability Time (MST) to about 600 seconds.
Concentrated latex in the storage tank is stirred for 15 minutes everyday to homogenize
the contents.
Figure 4.3: Storage tank for concentrated latex
Source: Factory A, 2008

69
4.3.1.2 Block Skim Rubber (BSR) Processing
i. Coagulation pond
Skim latex from the centrifuge is flowed into deammoniation tower in order to reduce
ammonia content. From deammoniation tower skim latex flows through Fan Basin and
is fanned for about 10 hours in order to reduce ammonia content until it reaches ≤
1.10 g/L and flows into coagulation pond (Figure 4.4). According to Jawjit et.al., (2013)
deammonization is done in order to reduce the amount of acid used for coagulation. In
the coagulation pond, the skim latex will coagulate to form coagulum by adding 6 L
formic acid (90%) per ton skim latex. Coagulation is completed after 2-3 days.
The quantity of acid as coagulant depends on various factors such as the amount and
type of anticoagulant, duration of coagulation and the season. Coagulum from latex
often shows a tendency for surface darkening. To prevent this, a small quantity of
sodium bisulphite (1.2 g per kg DRC), dissolved in water may be added to the diluted
latex before coagulation (RBI, 2006).

70
Figure 4.4: Coagulation pond
Source: Factory A, 2008
ii. Macerator
Coagulum (clot) from coagulation basin is taken out from the basin and sent to an area
where the coagulum is cut into smaller pieces ( 30x30x10 cm3) as shown in Figure 4.5.
These coagulums together with the cup lumps taken from the plantation are milled to
form thin layer rubber sheets using a macerator reducer as shown in Figure 4.6. It was
observed that no waste and water loss are produced from this stage, but energy is used
to operate the macerator.

71
Figure 4.5: Pieces coagulum after size reduction
Source: Factory A, 2008

72
Figure 4.6: Macerator
Source: Factory A, 2008
iii. Creper
Sheets from the macerator reducer then enter a wash basin to separate acids, dirt such
as bits of wood and sand which are still attached to the sheets. Water in the wash basin
is replaced periodically. Acid content is not measured, so the water in the wash basin
would be replaced based on the experience of the workers through visual observation.
The sheets are lifted onto a conveyor, then milling is continued in Creper I to reach (3
x 3 x 0.5) cm3 thickness. Milling is further continued in Creper II to produce sheets of
(2 x 2 x 0.5) cm3 thickness. It is observed that no waste is generated in this unit, energy
is used to operate creper and there are no water losses.
Sheet

73
iv. Hammer Mill
The sheets from the creper then goes into the hammer mill where the sheets are further
cut resulting in crumbs of 0.3-0.4 cm thickness. It is found that no waste is generated in
this unit, energy is used to drive hammer mill motor and there is no water loss.
A set of cutters for size reduction from sheet into crumbs is shown in Figure 4.7.
Figure 4.7: A set of cutters for size reduction from sheet into crumbs
Source: Factory A, 2008

74
v. Dryer
The crumbs which have been cut to 0.3 -0.4cm sizes are inserted into boxes where
each box weighs about 35 kg of crumb rubber. The boxes are conveyed to a dryer
(Figure 4.8) operating at 1150C - 120
0C for 3-3.5 hours.
Figure 4.8: Set of dryer
Source: Factory A, 2008
vi. Cooling
After drying the crumb rubber from the dryer is cooled by using cooling fan and blower
until a temperature of 40 0C is reached. Cooling the crumb rubber is achieved within
30-40 minutes.

75
vii. Pressing
After the cooling stage, the 35 kg crumb rubber is pressed into block skim rubber and
wrapped in a plastic measuring 70 cm x 35 cm x 20 cm in size per package (Figure 4.9).
Figure 4.9: Pressing and block skim rubber after packaging
Source: Factory A, 2008
4.3.2 Processing in Factory B
The trade name of concentrated latex in the Factory B is CENEXTM
(Centrifuged Latex)
which indicates that the concentration process uses centrifugation. Initially, Factory B
produces high ammonia latex concentrate (HA)-type NC 405, low ammonia (LA)-type
NC 411 and NC 407 (very LA), but since 2000 only HA latex concentrate with fixed
specification as stated in Table 4.2 is produced. This is because it is very difficult to
maintain LA latex concentrate.
Packaging, Block Skim Rubber
Pressing

76
The products in Factory B can be classified as concentrated latex and solid rubber.
Liquid latex is used as raw material for centrifugation and solid rubber is compressed in
cup lump and is used as raw material in the Skim Rubber Plant. The flow process of
natural rubber latex concentrate for Factory B is as shown in Figure 4.10.
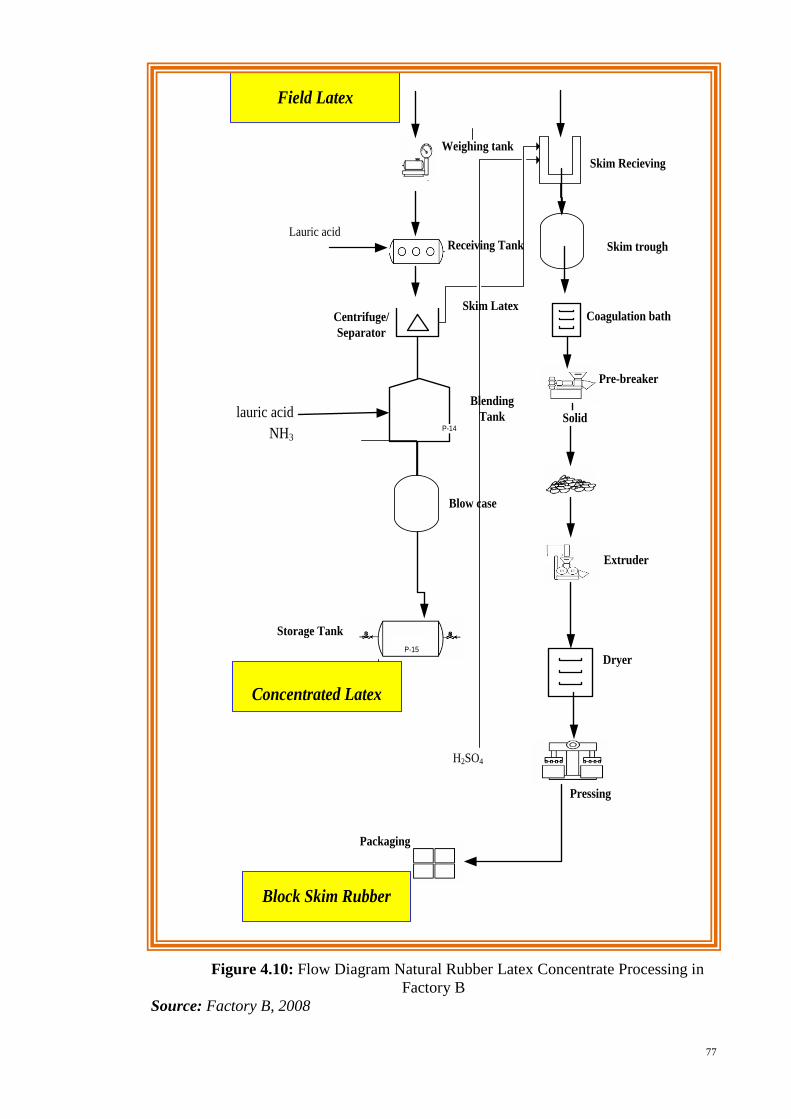
77
Dryer
Centrifuge/
Separator
Storage Tank
NH3
Solid
Extruder
Pressing
H2SO4
Weighing tank
Receiving Tank
Blow case
Coagulation bath
Pre-breaker
Skim Latex
Lauric acid
Blending
Tanklauric acid
Skim Recieving
Skim trough
Concentrated Latex
Packaging
Field Latex
Block Skim Rubber
P-14
P-15
Figure 4.10: Flow Diagram Natural Rubber Latex Concentrate Processing in
Factory B
Source: Factory B, 2008
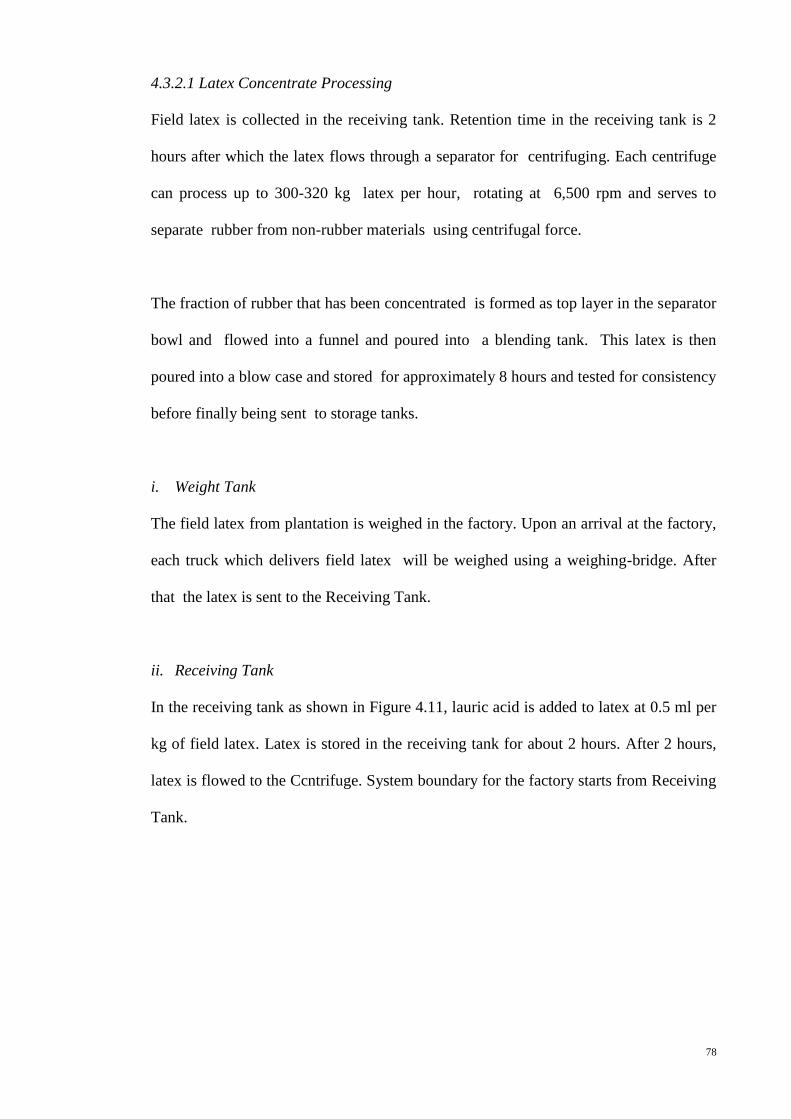
78
4.3.2.1 Latex Concentrate Processing
Field latex is collected in the receiving tank. Retention time in the receiving tank is 2
hours after which the latex flows through a separator for centrifuging. Each centrifuge
can process up to 300-320 kg latex per hour, rotating at 6,500 rpm and serves to
separate rubber from non-rubber materials using centrifugal force.
The fraction of rubber that has been concentrated is formed as top layer in the separator
bowl and flowed into a funnel and poured into a blending tank. This latex is then
poured into a blow case and stored for approximately 8 hours and tested for consistency
before finally being sent to storage tanks.
i. Weight Tank
The field latex from plantation is weighed in the factory. Upon an arrival at the factory,
each truck which delivers field latex will be weighed using a weighing-bridge. After
that the latex is sent to the Receiving Tank.
ii. Receiving Tank
In the receiving tank as shown in Figure 4.11, lauric acid is added to latex at 0.5 ml per
kg of field latex. Latex is stored in the receiving tank for about 2 hours. After 2 hours,
latex is flowed to the Ccntrifuge. System boundary for the factory starts from Receiving
Tank.
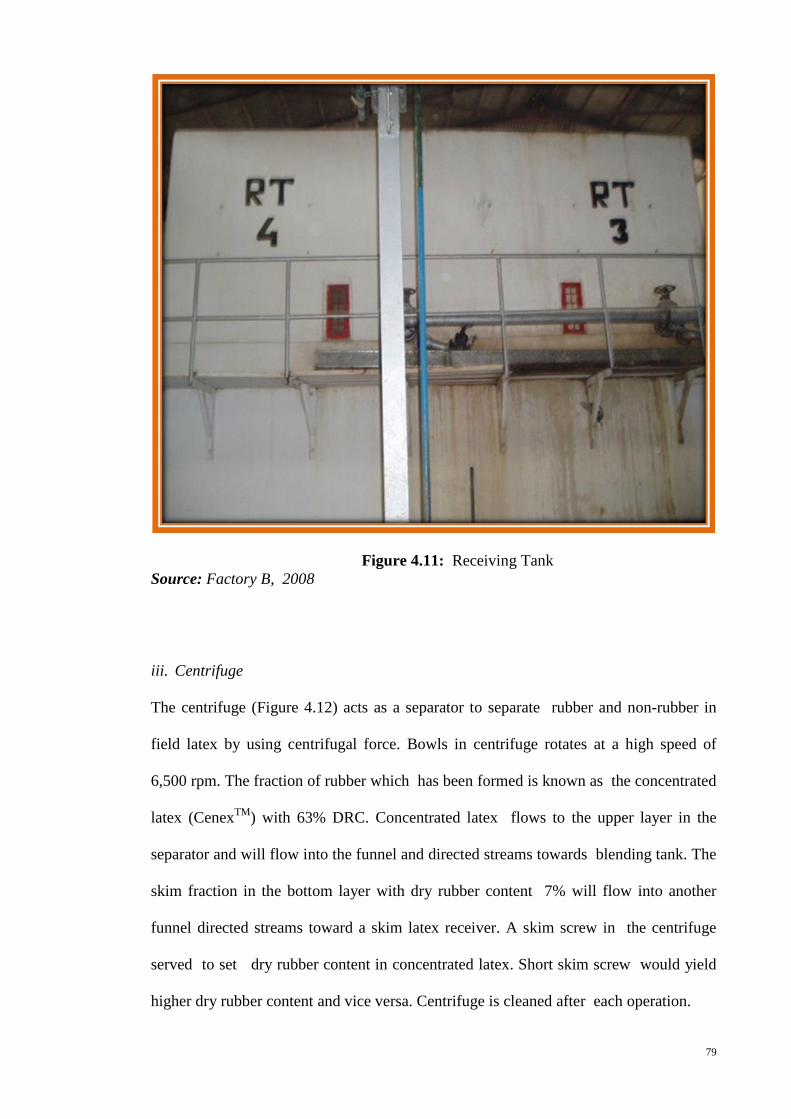
79
Figure 4.11: Receiving Tank
Source: Factory B, 2008
iii. Centrifuge
The centrifuge (Figure 4.12) acts as a separator to separate rubber and non-rubber in
field latex by using centrifugal force. Bowls in centrifuge rotates at a high speed of
6,500 rpm. The fraction of rubber which has been formed is known as the concentrated
latex (CenexTM
) with 63% DRC. Concentrated latex flows to the upper layer in the
separator and will flow into the funnel and directed streams towards blending tank. The
skim fraction in the bottom layer with dry rubber content 7% will flow into another
funnel directed streams toward a skim latex receiver. A skim screw in the centrifuge
served to set dry rubber content in concentrated latex. Short skim screw would yield
higher dry rubber content and vice versa. Centrifuge is cleaned after each operation.

80
Figure 4.12: Centrifuge in Factory B
Source: Factory B, 2008
iv. Blending Tank
In the blending tanks (Figure 4.13), 2 ml lauric acid (10%) is added per kg of
concentrated latex and the addition of ammonia ranged between 0.70-0.84% of the total
weight depending on the needs of the end product. From the blending tank, concentrated
latex flows to a blow case.
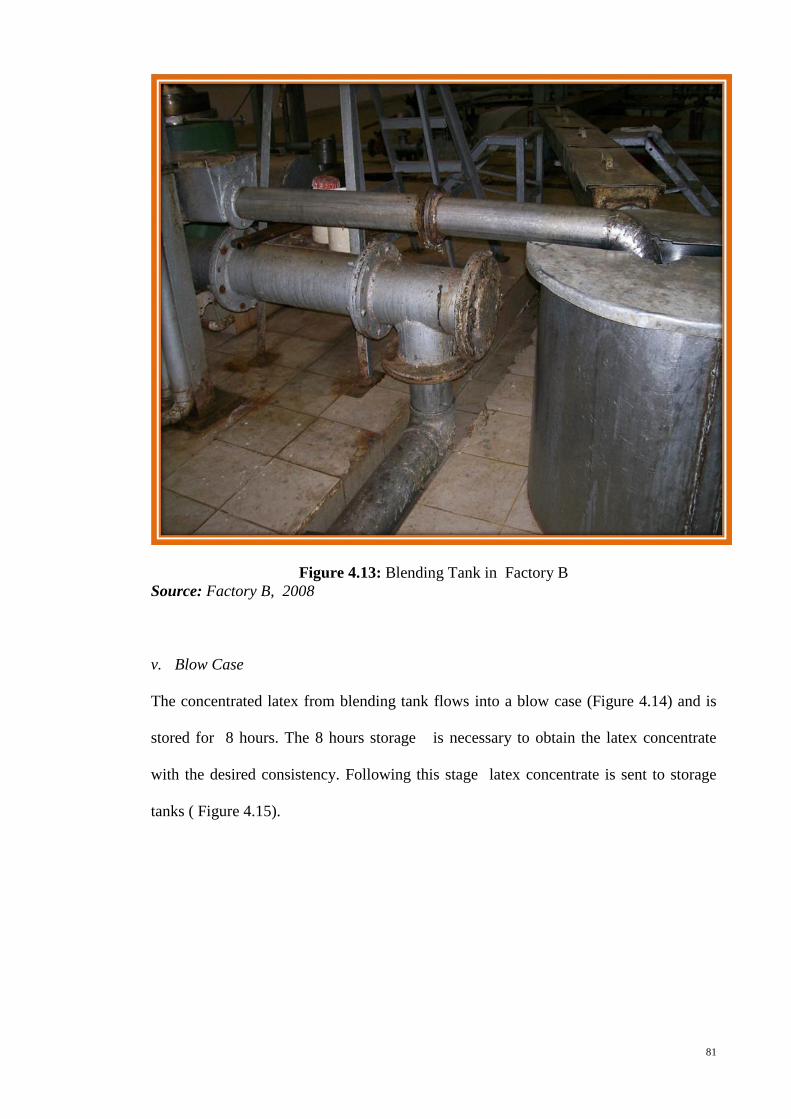
81
Figure 4.13: Blending Tank in Factory B
Source: Factory B, 2008
v. Blow Case
The concentrated latex from blending tank flows into a blow case (Figure 4.14) and is
stored for 8 hours. The 8 hours storage is necessary to obtain the latex concentrate
with the desired consistency. Following this stage latex concentrate is sent to storage
tanks ( Figure 4.15).
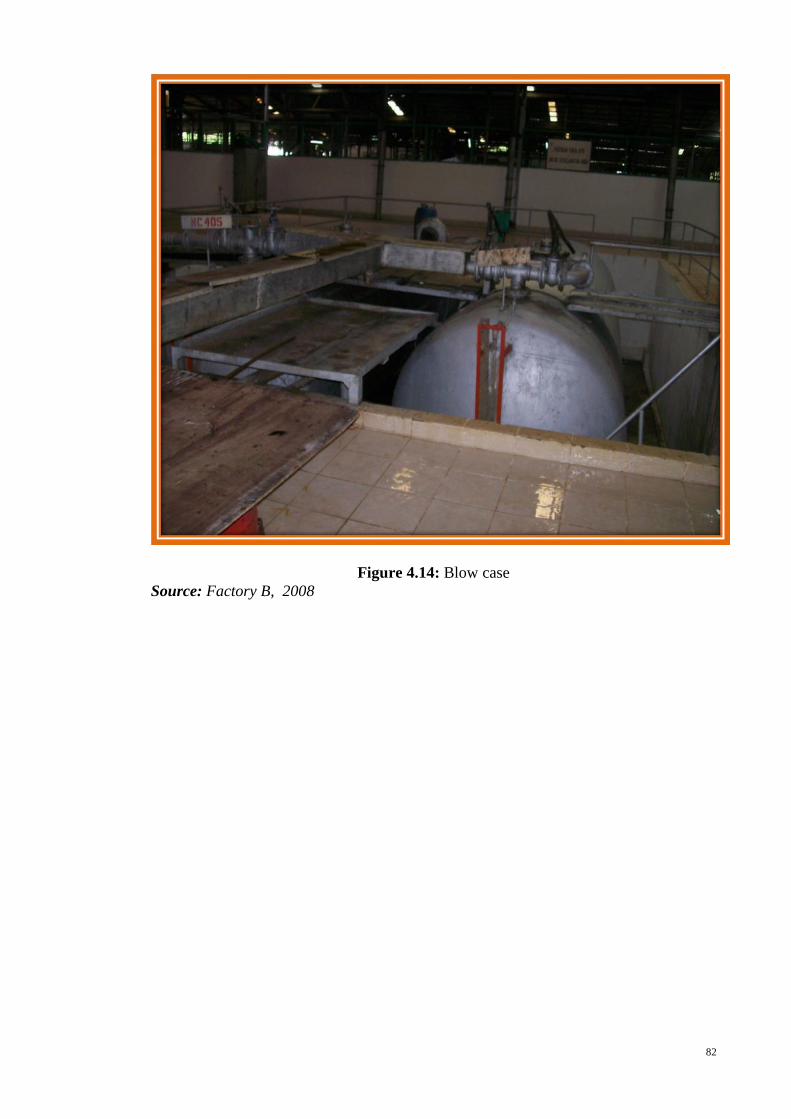
82
Figure 4.14: Blow case
Source: Factory B, 2008
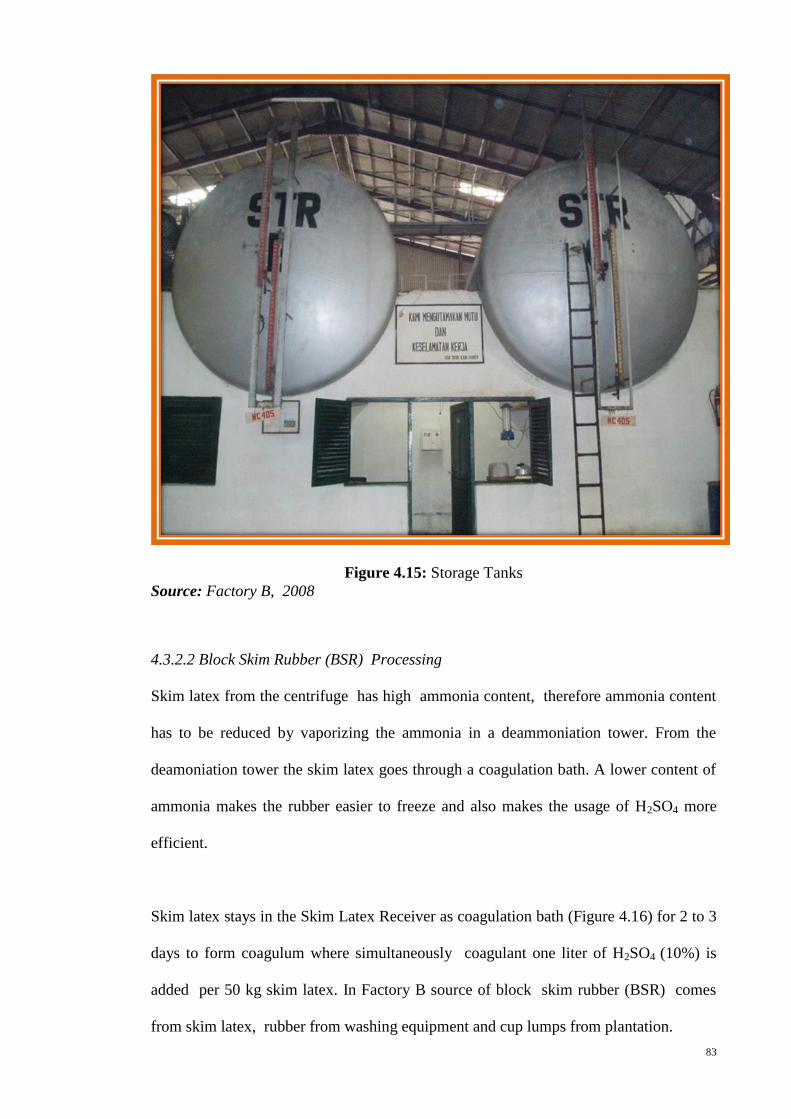
83
Figure 4.15: Storage Tanks
Source: Factory B, 2008
4.3.2.2 Block Skim Rubber (BSR) Processing
Skim latex from the centrifuge has high ammonia content, therefore ammonia content
has to be reduced by vaporizing the ammonia in a deammoniation tower. From the
deamoniation tower the skim latex goes through a coagulation bath. A lower content of
ammonia makes the rubber easier to freeze and also makes the usage of H2SO4 more
efficient.
Skim latex stays in the Skim Latex Receiver as coagulation bath (Figure 4.16) for 2 to 3
days to form coagulum where simultaneously coagulant one liter of H2SO4 (10%) is
added per 50 kg skim latex. In Factory B source of block skim rubber (BSR) comes
from skim latex, rubber from washing equipment and cup lumps from plantation.

84
Figure 4.16: Skim Latex Receiver
Source: Factory B, 2008
i. Pre-breaker
The coagulum is removed from the bath and enters a pre breaker machine (Figure 4.17),
where the coagulum is cut into thin layer crumbs of 7-7cm size with thin layer. The
crumbs are then washed in a circulation bath to remove impurities such as sand, and
excess acid which is still attached in the crumbs. After washing in the circulation bath,
the crumbs are lifted up by a bucket elevator and put into an extruder machine (Figure
4.18). There are no crumb losses and energy is used to operate the pre-breaker.
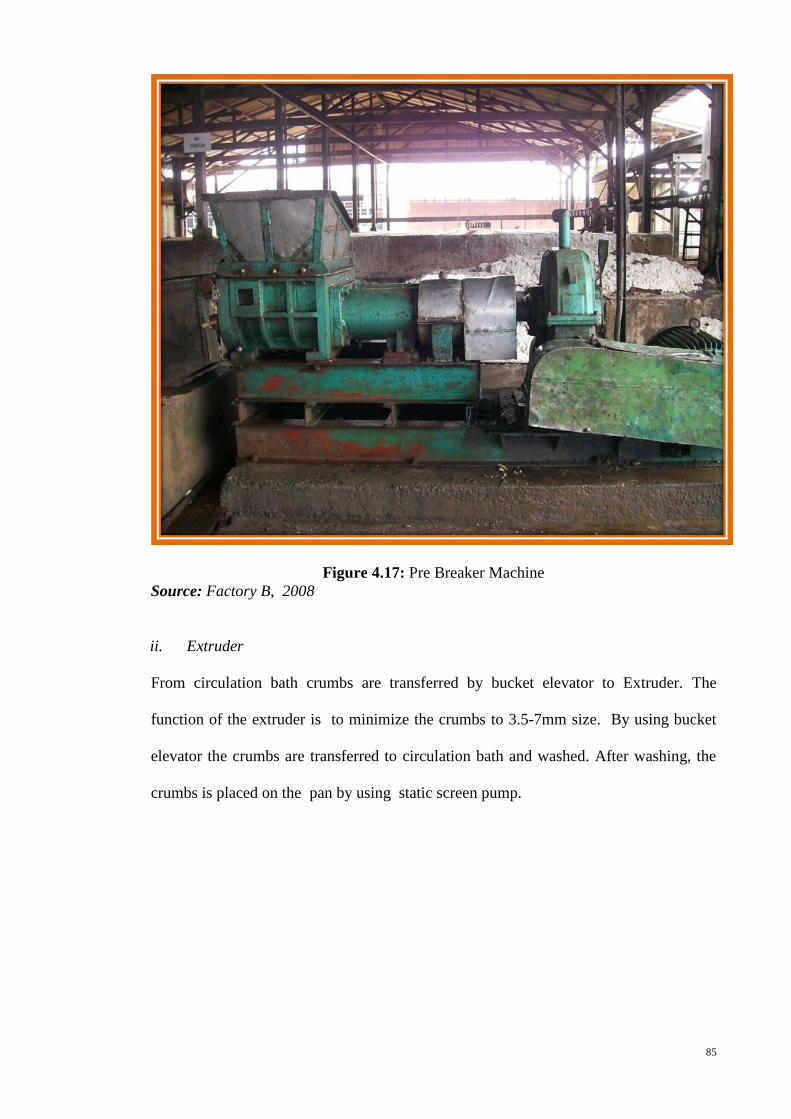
85
Figure 4.17: Pre Breaker Machine
Source: Factory B, 2008
ii. Extruder
From circulation bath crumbs are transferred by bucket elevator to Extruder. The
function of the extruder is to minimize the crumbs to 3.5-7mm size. By using bucket
elevator the crumbs are transferred to circulation bath and washed. After washing, the
crumbs is placed on the pan by using static screen pump.

86
Figure 4.18: Extruder
Source: Factory B, 2008
iii. Drying Machine (Dryer)
Drying machine is used to dry the crumbs by vaporizing the water content, in order to
prevent growth of fungi and microbes. The crumbs which still contains about 15-20%
water in the pan is placed in dryer (Figure 4.19). The dryer is equipped with burners
and an air blower to blow the hot air from the burners to the pan that contain crumb
rubber. Circulation of hot air through the crumbs cause water to evaporate. The first
burner is usually set at a temperature of 105-110 °C and a second burner at a
temperature of 110-125 °C and drying is conducted for 3.5 hours.
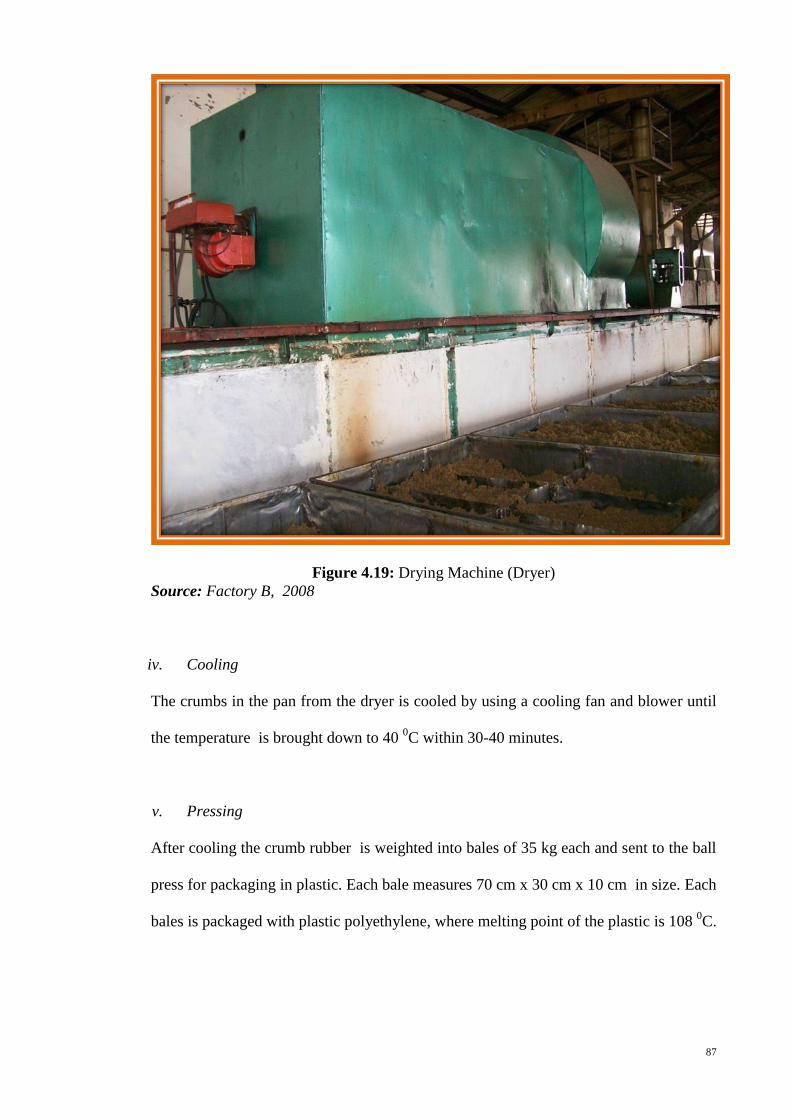
87
Figure 4.19: Drying Machine (Dryer)
Source: Factory B, 2008
iv. Cooling
The crumbs in the pan from the dryer is cooled by using a cooling fan and blower until
the temperature is brought down to 40 0C within 30-40 minutes.
v. Pressing
After cooling the crumb rubber is weighted into bales of 35 kg each and sent to the ball
press for packaging in plastic. Each bale measures 70 cm x 30 cm x 10 cm in size. Each
bales is packaged with plastic polyethylene, where melting point of the plastic is 108 0C.

88
4.3.3 Comparison of process activities between Factory A and Factory B
The main equipment for concentrating latex in both factories is the centrifuge which
acts as the separator for producing concentrated latex as the main product and skim
latex as a side stream. Further processing of skim latex is necessary to produce block
skim rubber as by product. Factory A has a sedimentation tank before the centrifuge
where Diammonium Phosphate (DAP) is added to the latex in sedimentation tank.
Adding of diammonium phosphate will bind Ca2+
and Mg2+
in the presence of NH+ ion
and phosphate ion PO43-
to form complex compounds that can precipitate as Ca2+
and
Mg2+
. However, Factory B adds diammonium phosphate to the fresh latex in the field to
allow for longer reaction time.
After centrifugation, Factory A uses a mixer to mix the chemicals such as ammonia,
ammonium laurate and diammonium phosphate before being stored in a storage tank.
However Factory B uses a blending tank where chemicals are added before entering a
blow case. A blow case is used to ensure the desired consistency by storing the latex for
about 8 hours. Chemicals used for the latex concentrate processing by both factories are
different except for ammonia which is used as an anti coagulant by both factories.
In the block skim rubber processing, Factory A employs different stages and with more
equipments compared to Factory B. Among the differences are, Factory A uses a
macerator which serves to cut coagulum and cup lump into smaller pieces, followed by
cutting tools, namely creper 1, creper 2 and hammer mill. Factory B uses cutting tools
such as, pre-breaker and extruder. Other equipments for drying and pressing unit are
similar. During block skim rubber processing, Factory A produces sheets of solid rubber
in the macerator before chopping, while Factory B chops solid rubber directly in pre
breaker.
89
4.4 Inventory Data Collection
The trend of rubber balance, energy consumption and water consumption is captured
based on field observations for different capacity processing of latex concentrate and
block skim rubber. This similarity can be explained by the fact that the factory used
similar technologies and production processes. The data in this study have been
observed under various conditions of processing field latex. Three different capacities of
processing field latex (high, low and medium) were selected and the average value was
used as basis of calculation.
Data collection are divided into four parts: material which includes rubber balance and
chemical consumption, energy, water and residue.
4.4.1 Material Data
The materials that are selected in this process are identified as rubber and chemicals.
The rubber is measured in terms of dry rubber content. The data were taken for
production capacity in three consecutive months ( August, September, October) in the
year 2008, in order to minimize variations.
4.4.1.1 Rubber balance
Freshly tapped field latex is in sterile condition, but upon exposure to air, field latex
can be contaminated or damaged through several mechanisms. Damage to field latex,
among others, can be caused by microorganisms from the air, cleanliness of equipment
and rainwater. Microorganisms will grow rapidly in the field latex and break the
proteins and carbohydrates into short-chain volatile fatty acids. At pH 4 to 5 the field
latex reaches iso-electric point which leads to coagulation. Very moist conditions favor
growth of microorganisms, so the surrounding areas need to be kept clean to reduce
humidity.
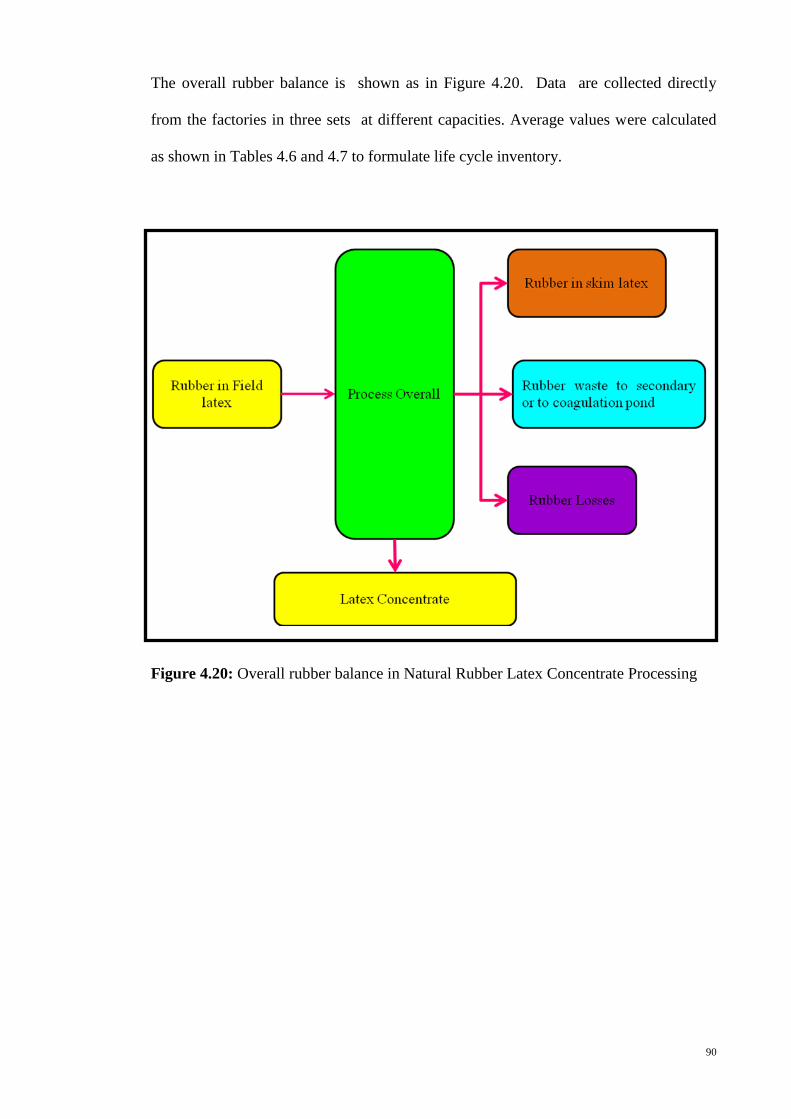
90
The overall rubber balance is shown as in Figure 4.20. Data are collected directly
from the factories in three sets at different capacities. Average values were calculated
as shown in Tables 4.6 and 4.7 to formulate life cycle inventory.
Figure 4.20: Overall rubber balance in Natural Rubber Latex Concentrate Processing
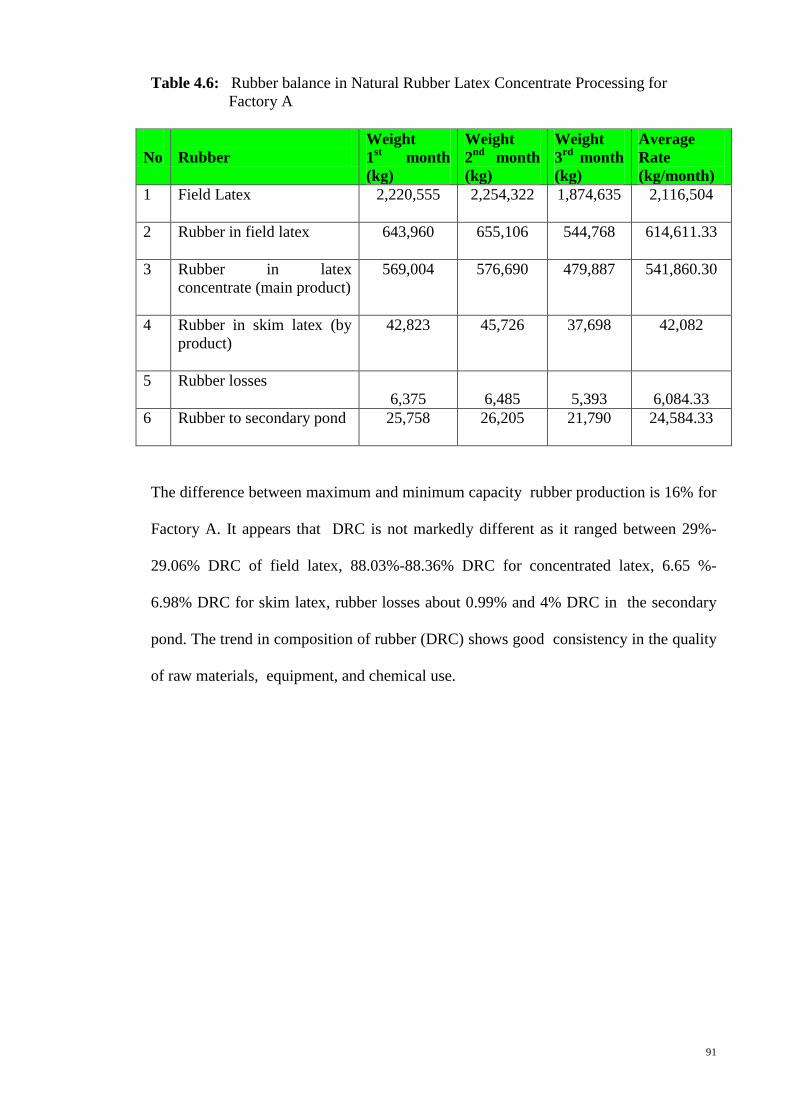
91
Table 4.6: Rubber balance in Natural Rubber Latex Concentrate Processing for
Factory A
No
Rubber
Weight
1st month
(kg)
Weight
2nd
month
(kg)
Weight
3rd
month
(kg)
Average
Rate
(kg/month)
1 Field Latex 2,220,555 2,254,322
1,874,635
2,116,504
2 Rubber in field latex 643,960 655,106
544,768
614,611.33
3 Rubber in latex
concentrate (main product)
569,004 576,690 479,887 541,860.30
4 Rubber in skim latex (by
product)
42,823 45,726 37,698 42,082
5 Rubber losses
6,375 6,485 5,393 6,084.33
6 Rubber to secondary pond
25,758 26,205 21,790 24,584.33
The difference between maximum and minimum capacity rubber production is 16% for
Factory A. It appears that DRC is not markedly different as it ranged between 29%-
29.06% DRC of field latex, 88.03%-88.36% DRC for concentrated latex, 6.65 %-
6.98% DRC for skim latex, rubber losses about 0.99% and 4% DRC in the secondary
pond. The trend in composition of rubber (DRC) shows good consistency in the quality
of raw materials, equipment, and chemical use.

92
Table 4.7: Rubber balance in Natural Rubber Latex Concentrate Processing for
Factory B
No
Rubber
Weight
1st month
(kg)
Weight
2nd
month
(kg)
Weight
3rd
month
(kg)
Average
Rate
(kg/month)
1 Field latex 3,274,230 2,406,910 2,846,127 2,842,422
2 Rubber in field latex 1,058,646 747,677 923,688 910,004
3 Rubber in latex concentrate
(main product)
951,824 670,496 829,637 817,319
4 Rubber in skim latex
(by product)
72,517 49,357 65,763 62,546
5 Rubber losses
10,390 7,100 6,450 7,980
6 Rubber to coagulation bath
23,915 20,724 21,838 22,159
The difference between maximum and minimum of field latex capacity is 26.5% for
Factory B. The values for DRC varies from 31.06% - 32.45% in field latex, by 89.68% -
89.91% in concentrated latex, 6.60% - 7.12% in skim latex, 0.70%-0.98% DRC losses,
2.26%-2.77% in coagulation bath. It can be observed that an average the range of
variability of DRC from various process is small i.e. <1%.
The trend of composition of rubber (DRC) in Factory B is similar Factory A and there
is a good consistency in quality of raw materials, equipment, and chemical use.
From the above information, it can be concluded that the composition of dry rubber
content is similar for Factory A and Factory B.
Factory B has higher DRC in field latex of about 32% whereas in Factory A, DRC
was about 29%. Anas, (2007), reported that the chemical properties of field latex can
be influenced by several factors such as types of clones, age of plant, tapping system
and climate.
93
It was reported at the National Workshop on Rubber Plant Breeding that the latest
rubber plants recommended for superior clones are from IRR series, IRR 5, IRR 32,
IRR 39, IRR 42, IRR 104, IRR 112 and IRR 118 (BF, 2012), (Hartoyo, 2013). Field
latex is very susceptible to destabilization caused by the presence of bacteria from the
air, yeast and molds in dust. Cleanliness is required during tapping because the entry of
these microorganisms caused the proteins to change into acids which will coagulated
the latex (Cecil, 2003) So cleanliness in tapping system greatly affects the quality of
field latex.
4.4.1.2 Chemical consumption
There are differences in the chemical consumption used at both plants, as shown in
Table 4.8. Factory A uses diammonium phosphate to remove Mg and Ca compounds
within the factory premise while Factory B add diammonium phosphate in the field to
enable more Ca and Mg substances to precipitate. Factory A uses a weak acid (formic
acid) for coagulating skim latex which requires longer time than Factory B which
uses a stronger acid (sulfuric acid).

94
Table 4.8: Chemical consumption for Factory A and Factory B
No Chemical Factory A Factory B
LATEX CONCENTRATE
1 Ammonia 28 g/ L field latex 0.8% on ton weight
of field latex
2 TZ 25% 1.5 ml/L conc. latex 500g/ ton conc. latex
3 Di-ammonium phosphate (DAP) 1.5 ml/ L conc. latex -
4 Ammonium laurate 2 ml/ L conc. latex -
5 Lauric Acid - 2 ml/ kg conc. Latex
BLOCK SKIM RUBBER
1 Formic acid 6 L/ 1,000 kg skim
latex
2 Sulphuric Acid 20 L/ 1,000 kg skim
latex
Source: Factory A and Factory B, 2008
i. Ammonia
Ammonia is added to field latex to prevent and to slow down microbial growth.
Microbes are able to convert protein and carbohydrate in rubber into volatile fatty
acids. If pH of the field latex decreases to 4.5-5.5 and reach its iso-electric point,
rubber will coagulate. Ammonia and water will react in the following manner (Eq. 4.1)
NH3+H2ONH4++OH
- …….. (Eq. 4.1)
OH- ions will neutralize the fatty acids which are formed by microbial activity.
At Factory A, ammonia is added in several stages to Onvangen Tank, Weight Tank A,
Weight Tank B and Mixing Tank with the total amount of 28g/ L field latex. Addition
of ammonia at Factory B is 0.8% of total weight of field latex andis added to Blending
Tank.

95
ii. Tetra Methyl Thiuram Disulphide (TMTD) and Zinc Oxide (ZnO), TZ 25%
TZ 25% dispersion is a preservative containing Zinc Oxide (ZnO) as activator and Tetra
Methyl Thiuram Disulphide ([(CH3)2NCS2-]2) which serves as a vulcanizing
accelerator. Normal usage of TZ is as anti fungicide. TZ 25% mixture contains equal
percentages (12.5%) of tetra methyl thiuram disulphide and zinc oxide in water.
Fraction of NaOH and dispersing material are also found in this mixture, which acts as a
primary and a secondary accelerator or sulfur as donor (vulcanizing agent) in most
sulfur-cured elastomers in the rubber industry. In Factory A, TZ is added to the Weight
Tank A and Weight Tank B at about 1.5 ml per L concentrated latex. In Factory B the
addition of 500 g TZ per ton concentrated latex takes place in Receiving Tank.
iii. Diammonium phosphate (DAP)
Diammonium phosphate (DAP) is used to enable ammonia NH+ ions to bind Ca
2+ and
Mg2+
and form complex compounds that precipitate (Anas, 2007), following the
reaction:
Mg+2
+NH4+ +PO4
-3 MgNH4PO4 (Eq. 4.2)
Factory A adds DAP in Onvangen Tank and Mixing Tank with total amount of 1.5
ml/ L concentrated latex, while Factory B adds DAP in the field.
Magnesium is removed from the latex before or during centrifugation to ensure high
quality of latex concentrate, by the addition of diammonium phosphate (DAP) to the
field latex. The exact amount of the salt should be used. Too much addition of DAP can
cause reduction of the mechanical stability of products, while too little DAP can cause
the undesirable reactions mentioned above to occur (Cecil, 2003).
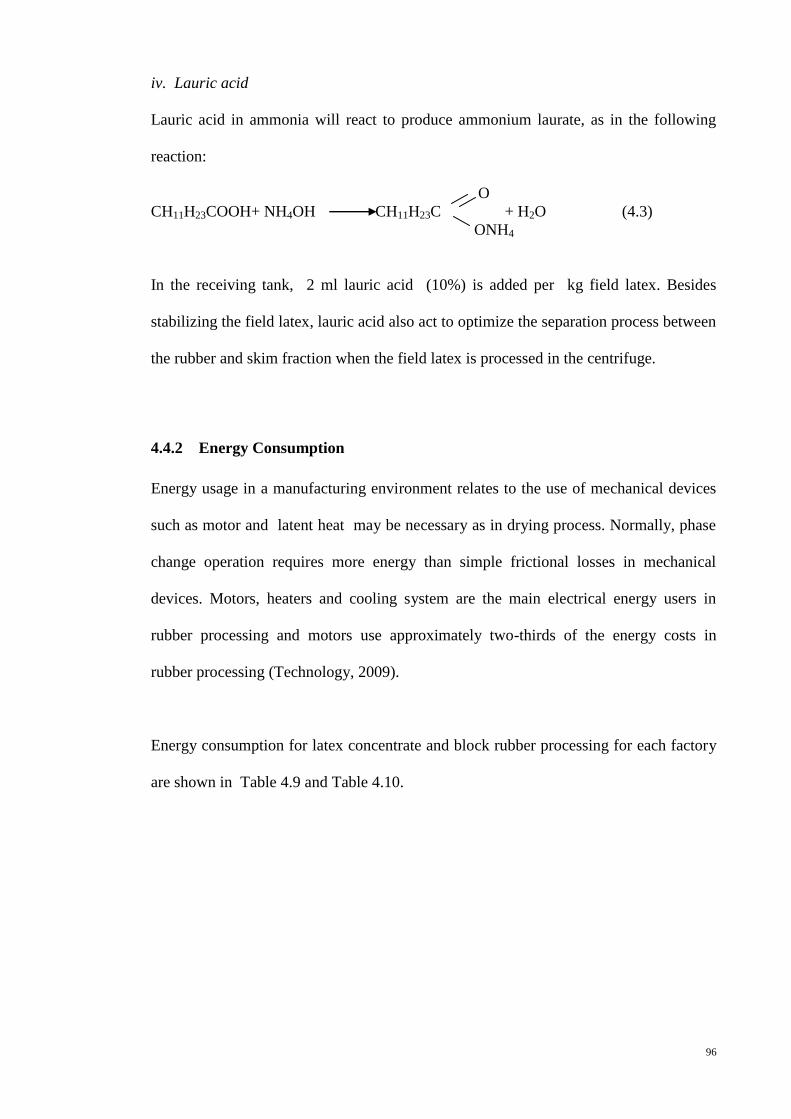
96
iv. Lauric acid
Lauric acid in ammonia will react to produce ammonium laurate, as in the following
reaction:
O
CH11H23COOH+ NH4OH CH11H23C + H2O (4.3)
ONH4
In the receiving tank, 2 ml lauric acid (10%) is added per kg field latex. Besides
stabilizing the field latex, lauric acid also act to optimize the separation process between
the rubber and skim fraction when the field latex is processed in the centrifuge.
4.4.2 Energy Consumption
Energy usage in a manufacturing environment relates to the use of mechanical devices
such as motor and latent heat may be necessary as in drying process. Normally, phase
change operation requires more energy than simple frictional losses in mechanical
devices. Motors, heaters and cooling system are the main electrical energy users in
rubber processing and motors use approximately two-thirds of the energy costs in
rubber processing (Technology, 2009).
Energy consumption for latex concentrate and block rubber processing for each factory
are shown in Table 4.9 and Table 4.10.

97
Table 4.9: Energy consumption Natural Rubber Latex Concentrate Processing for
Factory A
Energy
Energy
1st month
Energy
2nd
month
Energy
3rd
month
Average
Energy
(kWh) (kWh) (kWh) (kWh/month)
Energy for Latex Concentrate (kWh)
76,227
81,707
74,165
77,366.33
Latex Concentrate (kg)
569,004
576,690
479,887
541,860.3
Energy for Block Skim Rubber
(kWh)
6,150
6,032
4,325
5,502.33
Block Skim Rubber (kg)
30,760
30,170
21,630
27,520
Total Energy (kWh)
82,377
87,739
78,480
82,865.33
Increased production capacity of latex concentrate in Factory A from 479,887 kg to
576,690 kg, a simultan linear increase of energy use from 74,165 kWh to 81,707 kWh
(Table 4.7). Energy consumption of latex concentrate processing for Factory A varies
between 13.40% to 15.45% based on latex concentrate production capacity for each
month. The trend of energy consumption was not much different, showing the
equipment used still have the same ability.
Similarly, the increase in the production of block skim rubber, also means the increase
of energy usage. To process block skim rubber of Factory A, the amount of energy
consumption is 20% of production capacity of block skim rubber for each month.
The trend of linear increase in energy use for latex concentrate production and block
skim rubber showed that the quality of field latex meet the requirement standards that
have been set. Besides, the equipment used still has the same efficiency at each
processing.
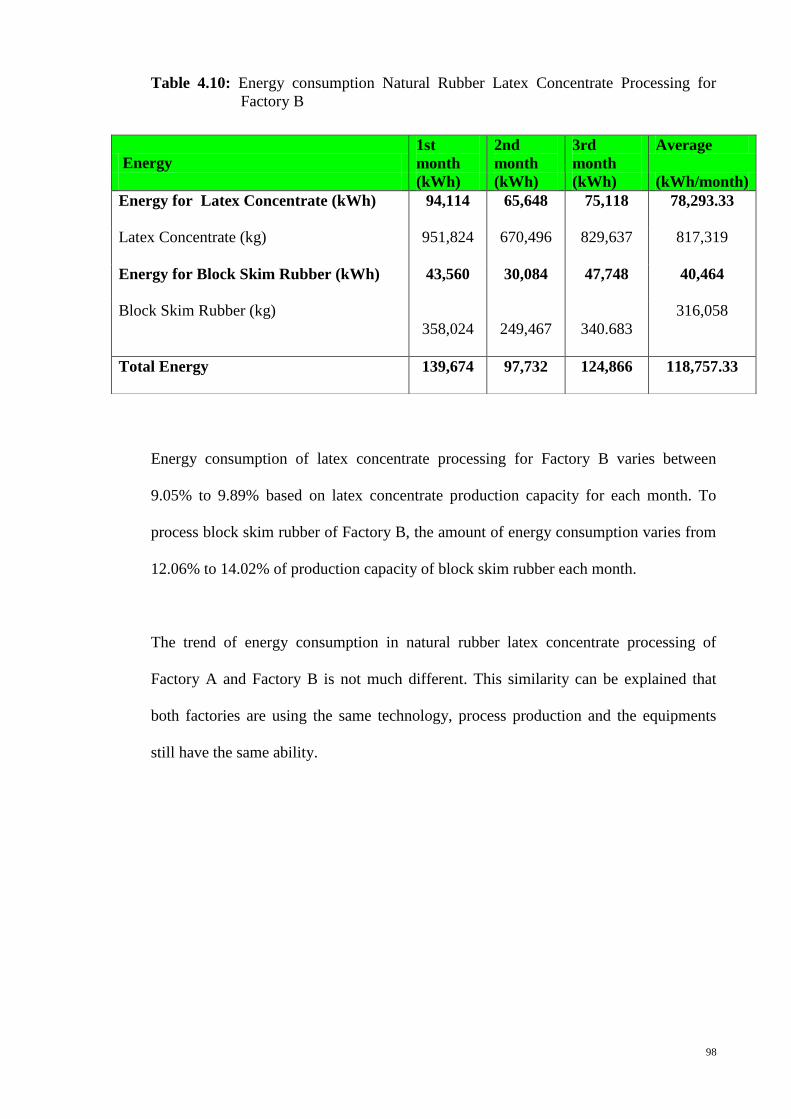
98
Table 4.10: Energy consumption Natural Rubber Latex Concentrate Processing for
Factory B
Energy consumption of latex concentrate processing for Factory B varies between
9.05% to 9.89% based on latex concentrate production capacity for each month. To
process block skim rubber of Factory B, the amount of energy consumption varies from
12.06% to 14.02% of production capacity of block skim rubber each month.
The trend of energy consumption in natural rubber latex concentrate processing of
Factory A and Factory B is not much different. This similarity can be explained that
both factories are using the same technology, process production and the equipments
still have the same ability.
Energy
1st
month
2nd
month
3rd
month
Average
(kWh) (kWh) (kWh) (kWh/month)
Energy for Latex Concentrate (kWh) 94,114
65,648
75,118
78,293.33
Latex Concentrate (kg)
951,824
670,496
829,637
817,319
Energy for Block Skim Rubber (kWh)
43,560
30,084
47,748
40,464
Block Skim Rubber (kg)
358,024 249,467 340.683
316,058
Total Energy
139,674
97,732
124,866
118,757.33

99
4.4.3 Water Consumption
Water is used for washing the equipment during batch processing of latex concentrate,
and washing of centrifuge has the highest water consumption. Every two hours
centrifuge should be washed to prevent the buildup of solids that can interfere with
rotation of centrifuge.
Block skim rubber processing uses water to wash the coagulum from coagulation pond
and cup lumps from plantation. In addition, washing is continued during rubber sheet
processing.
Water consumption data for Factory A and Factory B are given in Table 4.11 and Table
4.12 respectively.
Table 4.11: Water consumption in Natural Rubber Latex Concentrate Processing for
Factory A
Water Consumption
1st
month
2nd
month
3rd
month
Average
(m3/month)
(m3) (m
3) (m
3)
1. For Latex Concentrate (m3)
10,613
10,115
10,755
10,494
Latex Concentrate (kg)
569,004
576,690
479,887
541,860
2. For Block Skim Rubber (m3)
1,075
1,054
755
961
Block Skim Rubber (kg)
30,760
30,170
21,630
27,520
Total (m3
)
11,688
11,169
11,510
11,455

100
Data for water consumption for Factory A show that increase in production capacity of
concentrated latex from 479,887 kg to 576,690 kg, did not result in linear increase in
water consumption. Water consumption of latex concentrate processing for Factory A
varies between 1.75% to 2.24% of latex concentrate production capacity for each
month. The utilization of water for washing equipment is done manually and the
cleanliness of equipments is assessed visually, therefore water consumption is not
controlled. Consequently this situation will create an impact on eco-efficiency.
Meanwhile, water consumption in block skim rubber on Factory A shows consistency
of 3.49% for various block skim rubber processing capacity. It shows that coagulum
and cup lumps as raw materials are consistent in characteristic.
Table 4.12: Water consumption Natural Rubber Latex Concentrate Processing for
Factory B
Water Consumption
1st
month
2nd
month
3rd
month
Average
(m3) (m
3) (m
3) (m
3/month)
Water for Latex Concentrate (m3)
11,426
8,303
8,132
9,287
Latex Concentrate (kg)
951,824
670,596
829,637
817,319
Water for Block Skim Rubber (m3)
3,518
2,570
4,332
3,470
Block Skim Rubber (kg)
358,024
249,467
340,683
316,058
Total (m3
)
14,944
10,873
12,464
12,760

101
Processing capacity for Factory B, latex concentrate of 670,596 kg utilize 8,303 m3
water, while latex concentrate capacity processing of 829,637 kg consume 8,132 m3
water. This situation may arise due to manual washing of equipment, and the cleanliness
of equipments is only based on visually inspection. As a result water consumption is
not well controlled. Water consumption in latex concentrate processing is in the range
of 0.98% to 1.24% per kg latex concentrate production. In consequence this situation
will generate an impact on eco-efficiency.
Meanwhile, water consumption for block skim rubber processing of Factory B is in the
ranged from 0.98% to 1.27% per kg block skim rubber production. It demonstrates
consistency of water utilization in block skim rubber processing.
4.4.4 Residuals
The processing of natural rubber latex also produces some residues in term of emission
to the air as air emission, discharge to water as wastewater and losses (solid) in term of
wastes generation. In latex concentrate processing these residuals are in the form of
gasses through direct emission from the chimney, 1% of solid wastes appear in the
form of coagulated rubber and wastewater from washing the equipments. In the block
skim rubber processing, the residuals appear in the form of wastewater produced during
washing of the coagulum and cup lump. Solid losses are negligible.
4.4.4.1 Air Emission
In rubber processing, a furnace is used to produce heat by burning fuel, normally
releases smoke through a chimney. Smoke darker than a specified shade of grey is
officially classified as 'dark smoke' and is deemed as pollution. In order to prevent

102
smoke, dust, and fume emissions from damaging human health or causing nuisance, the
design of the chimney must comply with the relevant regulation of Indonesia.
Based on N0: Kep -205/ Bapedal/07/1996 requirement, the height of the chimney
should be 2 - 2.5 times higher than the height of surrounding buildings, to ensure good
dispersal of the effluent released through the chimney (BAPEDAL, 1996). Emission
parameters should adhere to the Regulation of the Ministry of Environment Republic of
Indonesia Kep-13/MENLH/3/1995 on standards of quality for air emission from
stationary source (KLH, 1995b).
The average concentration of the air emission parameters is obtained from
measurements of air emission. The fuel used in the furnace is diesel fuel which consist
of carbon and other elements such as: sulfur , Nitrogen. During combustion SOx and
NOx will be produced. Particulate is solid phase which is dispersed in the air due to
incomplete combustion.
In this study air emission parameters such SO2, NO2 and particulates were measured for
Factory A (Table 4.13) and Factory B (Table 4.14).
Table 4.13: Air emission concentration in Factory A
No Parameter Concentration(mg/m3) Standard Requirement
(mg/m3) 1 2 3
1 SO2
32.15 36.19 41.45 800
2 NO2
14.45 4.18 52.4 1000
3 Particulate
90.17 104.14 185 350

103
Table 4.14: Air emission concentration in Factory B
No Parameter Concentration(mg/m3) Standard Requirement
(mg/m3) 1 2 3
1 SO2
95.06 54.2 95 800
2 NO2
105 90.09 105 1000
3 Particulate
63.52 50.3 90.28 350
Based on measurements of air emission quality for Factory A and Factory B, air
emission concentration parameters for air comply with the applicable standard
requirements.
4.4.4.2 Wastewater
Although a variety of NR based products have greatly contributed benefits for the
development of mankind, the consequence of natural rubber processing has yet to
provide sustainable solution arising from its highly contaminated effluents. The rapid
growth of this industry generates large quantities of effluent coming from its processing
operations which is really a significant problem. According to Ganeshan, (1995), skim,
latex serum, uncoagulated latex and washings are the main sources of rubber
wastewater in Malaysia. Without suitable handling, discharge of wastewater from
rubber processing industry to the environment may cause crucial and long-term effect.
In Malaysia, regulatory requirements based on the Environmental Quality Act(1974),
for rubber processing industry has been enforced since 1978 (Revision, 2006). Most
rubber latex processing has a wastewater treatment plant. However more effort need to
be done to recover valuable by-products in the residual especially wastewater.
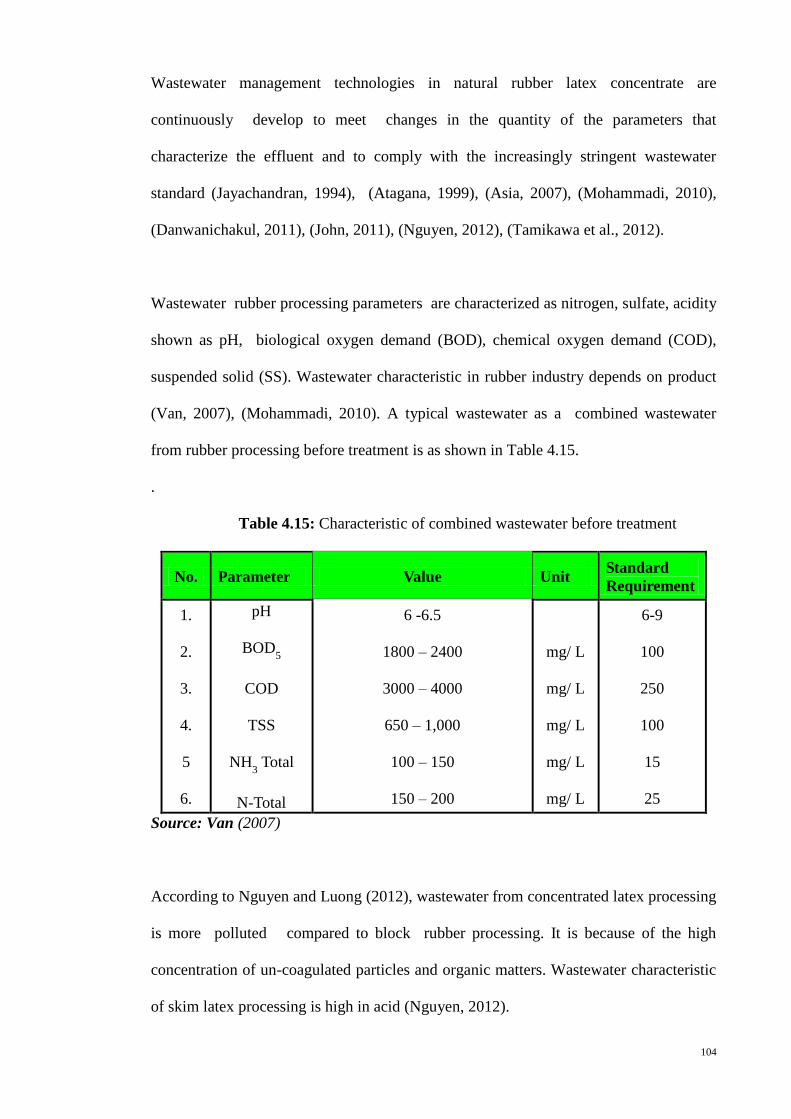
104
Wastewater management technologies in natural rubber latex concentrate are
continuously develop to meet changes in the quantity of the parameters that
characterize the effluent and to comply with the increasingly stringent wastewater
standard (Jayachandran, 1994), (Atagana, 1999), (Asia, 2007), (Mohammadi, 2010),
(Danwanichakul, 2011), (John, 2011), (Nguyen, 2012), (Tamikawa et al., 2012).
Wastewater rubber processing parameters are characterized as nitrogen, sulfate, acidity
shown as pH, biological oxygen demand (BOD), chemical oxygen demand (COD),
suspended solid (SS). Wastewater characteristic in rubber industry depends on product
(Van, 2007), (Mohammadi, 2010). A typical wastewater as a combined wastewater
from rubber processing before treatment is as shown in Table 4.15.
.
Table 4.15: Characteristic of combined wastewater before treatment
No. Parameter Value Unit Standard
Requirement
1.
2.
3.
4.
5
6.
pH
BOD5
COD
TSS
NH3 Total
N-Total
6 -6.5
1800 – 2400
3000 – 4000
650 – 1,000
100 – 150
150 – 200
mg/ L
mg/ L
mg/ L
mg/ L
mg/ L
6-9
100
250
100
15
25
Source: Van (2007)
According to Nguyen and Luong (2012), wastewater from concentrated latex processing
is more polluted compared to block rubber processing. It is because of the high
concentration of un-coagulated particles and organic matters. Wastewater characteristic
of skim latex processing is high in acid (Nguyen, 2012).
105
The high concentration of nitrogen contributes to undesirable eutrophication in rivers
and stream and increases oxygen and chemical demand if the surface water is used as
raw water feed for water supply. Sulfate comes from sulfuric acid which is used in the
coagulation of skim latex, and will liberate H2S to the environment which causes
malodor problems. The free H2S also inhibits the digestion process, which gives lower
organics removal efficiency. The odors are detectable even at extremely low
concentrations making water unpalatable for several hundred miles downstream from
the rubber processing factories (Rungruang, 2008). The quantity of acid used for
coagulation, is generally found to be higher than the actual requirement. The incomplete
coagulation results in the loss of rubber particles into the effluent. The excess acid not
only causes acidic effluent but also re-dissolves the rubber protein and causes delay in
coagulation. Hence, it is suggested that proper acid concentration be applied and
sufficient coagulation time should be identified to obtain optimum clear liquid after
complete coagulation (Van, 2007). Deammoniation is carried out before coagulation
and helps to reduce acid consumption. Danwanichakul et al., (2011) found that chitosan
in polyacrylamide solution can separate 80% of the solid rubber in skim latex and
quality of serum such as BOD, COD and pH become better than chitosan in sulfuric
acid solution.
Reducing COD in wastewater has been investigated by Jayachandran (1994), using
Acinetobacter sp. COD levels could be reduced by 39.5% from the previous COD of
22,000 mg/L.
Biological coagulation can be performed by using yeast which produced alcohol.
Fermentation alcohol will coagulate the latex by removing water around the protein,
thereby decreasing normal value hydration of the protein layer around the rubber
particle. In that way the latex will destabilize and coagulation takes place. Coagulation
in this way will not produce acid in the effluent (John, 2011).
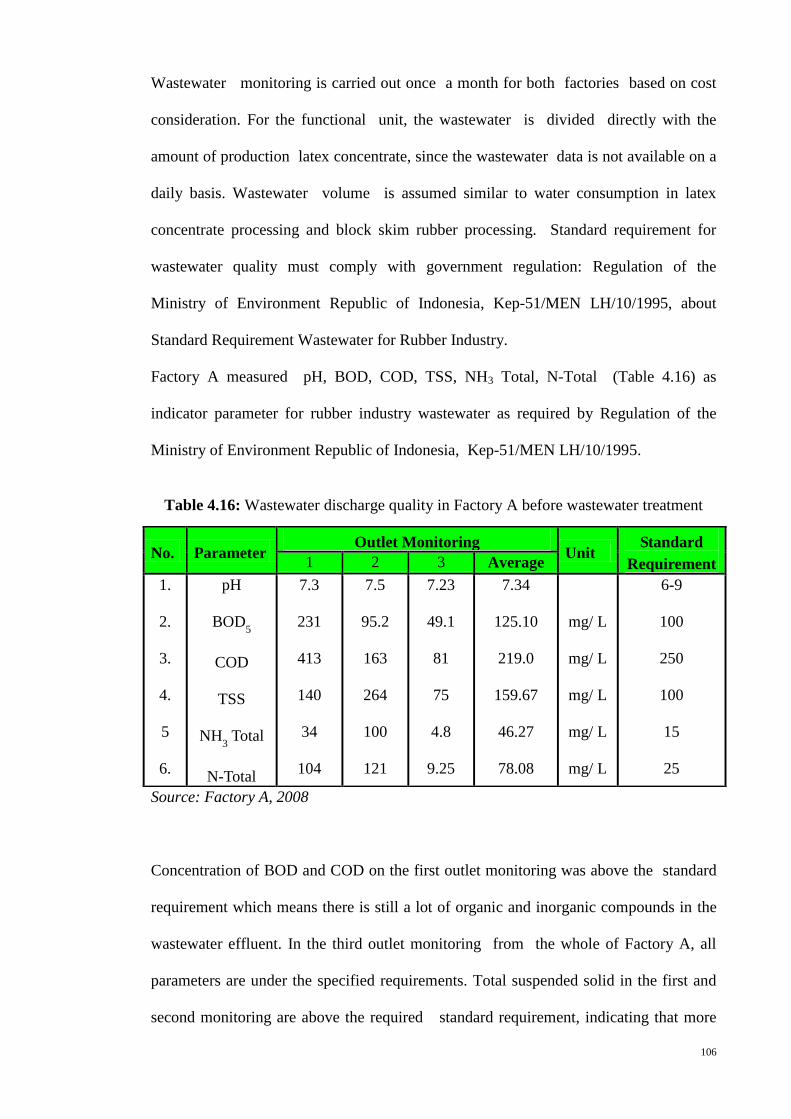
106
Wastewater monitoring is carried out once a month for both factories based on cost
consideration. For the functional unit, the wastewater is divided directly with the
amount of production latex concentrate, since the wastewater data is not available on a
daily basis. Wastewater volume is assumed similar to water consumption in latex
concentrate processing and block skim rubber processing. Standard requirement for
wastewater quality must comply with government regulation: Regulation of the
Ministry of Environment Republic of Indonesia, Kep-51/MEN LH/10/1995, about
Standard Requirement Wastewater for Rubber Industry.
Factory A measured pH, BOD, COD, TSS, NH3 Total, N-Total (Table 4.16) as
indicator parameter for rubber industry wastewater as required by Regulation of the
Ministry of Environment Republic of Indonesia, Kep-51/MEN LH/10/1995.
Table 4.16: Wastewater discharge quality in Factory A before wastewater treatment
Source: Factory A, 2008
Concentration of BOD and COD on the first outlet monitoring was above the standard
requirement which means there is still a lot of organic and inorganic compounds in the
wastewater effluent. In the third outlet monitoring from the whole of Factory A, all
parameters are under the specified requirements. Total suspended solid in the first and
second monitoring are above the required standard requirement, indicating that more
No. Parameter Outlet Monitoring
Unit Standard
Requirement 1 2 3 Average
1.
2.
3.
4.
5
6.
pH
BOD5
COD
TSS
NH3 Total
N-Total
7.3
231
413
140
34
104
7.5
95.2
163
264
100
121
7.23
49.1
81
75
4.8
9.25
7.34
125.10
219.0
159.67
46.27
78.08
mg/ L
mg/ L
mg/ L
mg/ L
mg/ L
6-9
100
250
100
15
25

107
rubber is carried to the effluent. It means that the effluent contains rubber that did not
coagulate, as a result of the addition of too much acid which causes re-dissolution of
protein, and coagulation will be disrupted. Re-dissolved protein causes high levels of
nitrogen into the first and second outlet monitoring where the allowable requirement is
25 mg/L. Total ammonia in the second outlet monitoring exceeds the standard
requirement which means the evaporation of ammonia on the de-ammoniation tower did
not function as expected.
Based on first outlet monitoring of wastewater in Factory B, as shown in Table 4.17,
COD, TSS and Total Nitrogen exceeded the values for allowable discharge
requirement. The high value of COD was dominated by inorganic chemical, while
organic compounds did not have an influence as BOD values are below the standard
requirement. Total suspended solid is above the standard requirement, indicating that
more rubber is carried in to the wastewater. Rubber in wastewater indicated that
coagulation did not work properly as a result of too much acid addition which can
cause re-dissolved protein, and therefore coagulation will be disrupted. Re-dissolved
protein causes high levels of Nitrogen (121 mg/L), while standard discharge
requirement allows only 25 mg/L.

108
Table 4.17: Wastewater discharge quality in Factory B before wastewater treatment
No. Parameter Outlet Measurement
Unit Standard
Requirement 1 2 3 Average
1.
2.
3.
4.
5
6.
pH
BOD5
COD
TSS
NH3-Total
N-Total
7.4
28
622
256
16
121
7.21
38
110
68
3.7
4.6
7.27
48
133
62
2.7
4.7
7.29
38
288.33
128.66
7.47
43.43
mg/ L
mg/ L
mg/ L
mg/ L
mg/ L
6-9
100
250
100
15
25
Source: Factory B
4.5 Life Cycle Inventory
The functional unit selected in this study is to produce 1 ton (1,000 kg) latex
concentrate and 1 ton (1,000 kg) block skim rubber and all the information below are
based on this functional unit.
4.5.1 Material
4.5.1.1 Rubber Balance
Latex as it appears from the tree regularly contains between 30-40% dry rubber content,
the other 60-70% being mainly serum. Shipping this quantity adds greatly to costs,
making exportation of ordinary latex uneconomic. Centrifugation is a simple way to
concentrate suspensions in liquids and separate rubber to form latex concentrate and a
by-product skim latex. Some rubber also makes its way to the coagulation pond and
there are losses in rubber along the process lines (Cecil, 2003). Based on observations
made by the DIW (2001) composition of rubber in concentrated latex varies from
79.1%-88.9%, in skim latex is 5.4%-14%, whereas losses is around 3%-8.9%.

109
Rubber to secondary pond in Factory A or rubber to coagulation pond in Factory B is
derived from cleaning of machinery and is used for the manufacturing of block skim
rubber. The composition of rubber balance from Factory A and Factory B are
represented in Table 4.18 and Table 4.19 respectively. The value of rubber component
are based on weight in kg and composition in percent.
Dry rubber content of latex concentrate from Factory A is 88.16% and 6.85% in the
coagulation pond.
Table 4.18: Rubber balance of Factory A
Dry rubber content of latex concentrate from Factory B is 89.81% and 6.75% in the
coagulation pond.
Component
Rubber balance
(kg)
Rubber
Percentage
I
N
P
U
T
Field latex
3,906
Rubber in field latex
1,134
29.04
O
U
T
P
U
T
Rubber in latex concentrate
(main product)
1,000
88.16
Rubber in skim latex (by
product)
78 6.85
Rubber losses
11
0.99
Rubber to secondary pond
45 4

110
Table 4.19: Rubber balance of Factory B
A sample calculation of rubber balance from Factory A and Factory B is given in
Appendix B.
The DRC in field latex of Factory A is slightly lower at 29.04% than Factory B where
DRC is 31.80%. DRC differences between Factory A and Factory B are mainly due to
the differences in process and chemical consumption as discussed in section 4.4.1.1.
Rubber composition differences can also occur in field latex due to different clone of
rubber trees and climate (Anas, 2007). The rubber composition in natural rubber latex
concentrate processing for Factory A and Factory B are still within the range reported
by the DIW (2001).
4.5.1.2 Chemical Consumption
Processing of natural rubber latex can have a variety of choices of chemicals to achieve
the same function. According to Anas, (2007), the use of ammonia is 20-23 kg per ton
of dry rubber and ammonium laurate is 1-1.2 kg per ton of dry rubber in concentrated
latex processing. The DIW (2001) made observations on 11 industries and reported that,
ammonia usage for these industries ranged from 12.2-25.3 kg/ ton of concentrated latex
Component
Rubber
balance (kg)
Rubber
Percentage
I
N
P
U
T
Field Latex 3,501
Rubber in field latex 1,113
31.8
O
U
T
P
U
T
Rubber in latex concentrate
(main product)
1,000 89.81
Rubber in skim latex
(by product)
75 6.75
Rubber losses
11 0.97
Rubber to coagulation pond
27 2.47
111
with an average of 21.1 kg/ ton of concentrated latex. Jawjit et al. (2012) observed that
ammonia consumption average about 16-18 kg ammonia per ton of concentrated latex.
Usage of TMTD and ZnO are equal at 0.5-0.7 kg per ton concentrated latex. DAP is
added to remove magnesium and calcium compounds from fresh latex, and its
consumption is about 2-2.5 kg per ton concentrated latex.
Chemical compounds which are used for both factories are shown in Table 4.20.
Factory A uses 102 kg ammonia per ton of concentrated latex and Factory B uses 80 kg
ammonia per ton of concentrated latex. Based on this information the use of ammonia in
both factories are still very high compared to Jawjit’s data. Jawjit et al (2012) reported
17 kg of ammonia is added per ton of concentrated latex. Factory A consumes 102.7 kg
of ammonia per ton of concentrated latex, higher then Factory B which consumes 80 kg
of ammonia per ton of concentrated latex. There are many aspects such as quality of
field latex, which will consume more ammonia. Beside, the addition of ammonia is
always based on routine practice without considering latex quality.
In the case of diammonium phosphate (DAP), Factory A adds DAP at the factory while
Factory B adds DAP to the latex in the field. Factory A adds DAP twice, first in
Onvangen Tank and second in Mixing Tank with the total amount of 5.28 L per ton of
concentrated latex. Factory B adds DAP in the field where Ca and Mg compounds
bind faster before being further processed in the factory . This is to ensure the latex
becomes more stable. Sedimentation of calcium and magnesium ions is expected to
ease the process of separation between concentrated latex and skim latex.
The addition of ammonium laurate is conducted differently in both factories, where
Factory A adds 2.13 L ammonium laurate per ton of concentrated latex, while Factory B
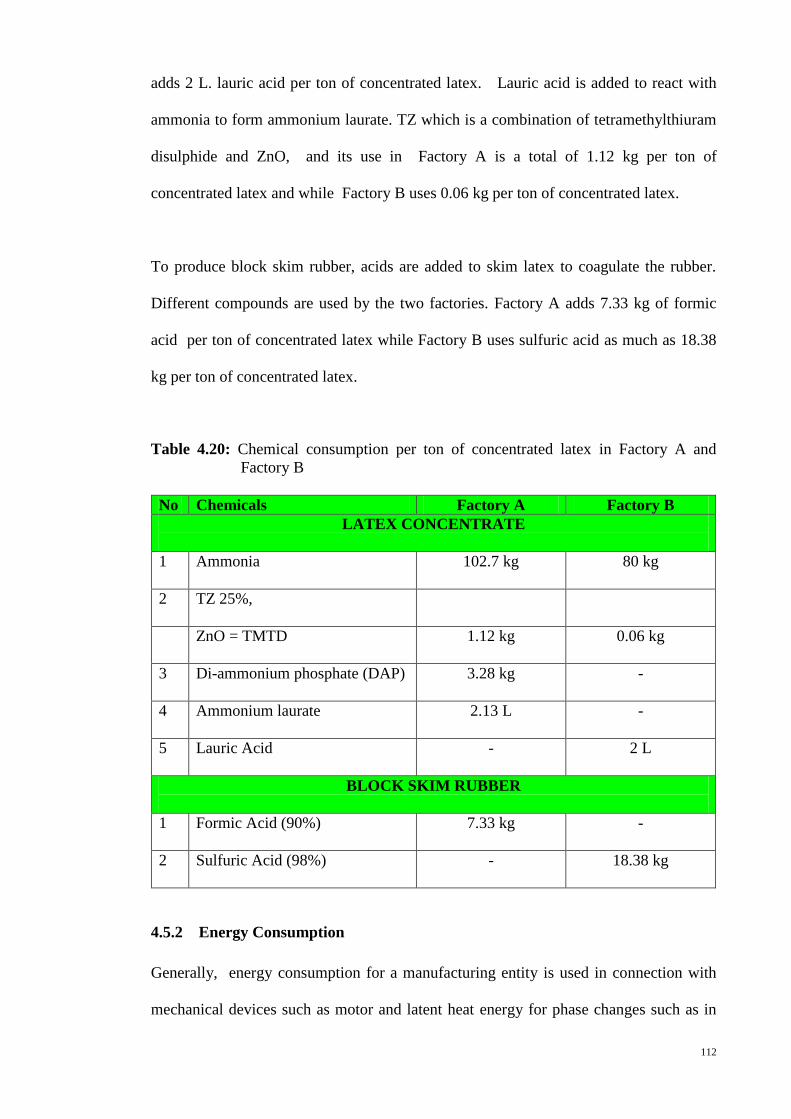
112
adds 2 L. lauric acid per ton of concentrated latex. Lauric acid is added to react with
ammonia to form ammonium laurate. TZ which is a combination of tetramethylthiuram
disulphide and ZnO, and its use in Factory A is a total of 1.12 kg per ton of
concentrated latex and while Factory B uses 0.06 kg per ton of concentrated latex.
To produce block skim rubber, acids are added to skim latex to coagulate the rubber.
Different compounds are used by the two factories. Factory A adds 7.33 kg of formic
acid per ton of concentrated latex while Factory B uses sulfuric acid as much as 18.38
kg per ton of concentrated latex.
Table 4.20: Chemical consumption per ton of concentrated latex in Factory A and
Factory B
No Chemicals Factory A Factory B
LATEX CONCENTRATE
1 Ammonia 102.7 kg
80 kg
2 TZ 25%,
ZnO = TMTD 1.12 kg
0.06 kg
3 Di-ammonium phosphate (DAP) 3.28 kg
-
4 Ammonium laurate 2.13 L
-
5 Lauric Acid -
2 L
BLOCK SKIM RUBBER
1 Formic Acid (90%) 7.33 kg
-
2 Sulfuric Acid (98%) - 18.38 kg
4.5.2 Energy Consumption
Generally, energy consumption for a manufacturing entity is used in connection with
mechanical devices such as motor and latent heat energy for phase changes such as in
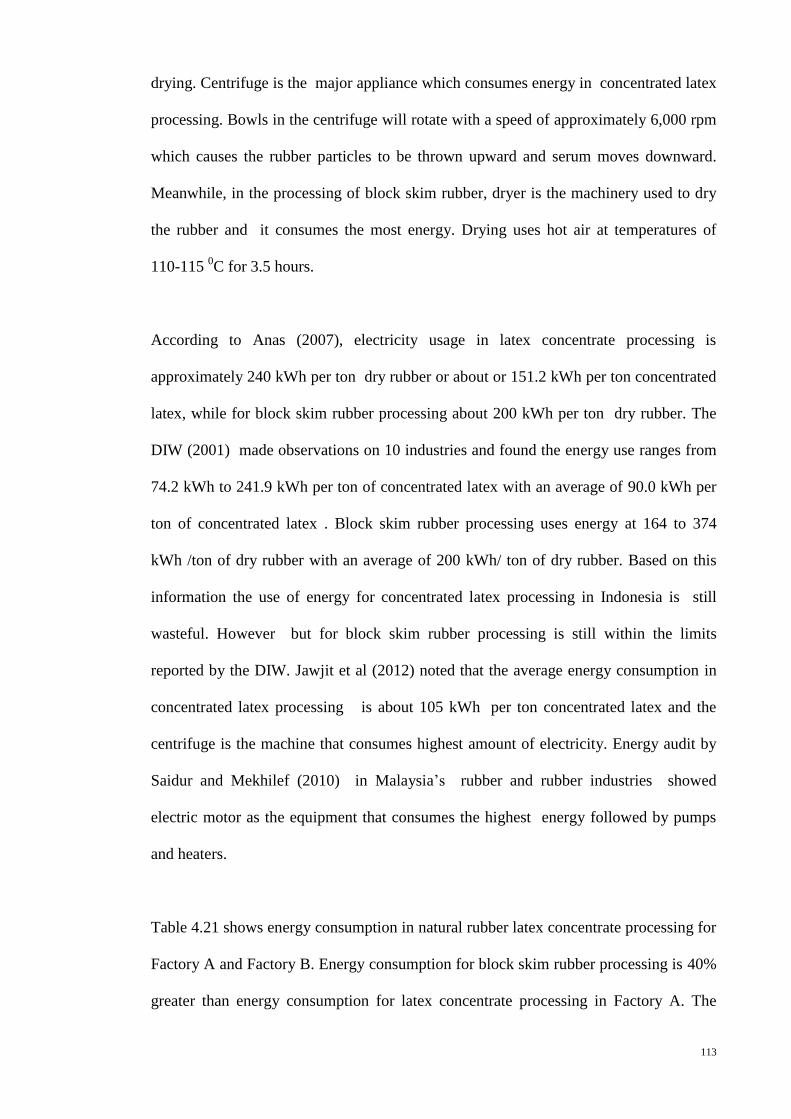
113
drying. Centrifuge is the major appliance which consumes energy in concentrated latex
processing. Bowls in the centrifuge will rotate with a speed of approximately 6,000 rpm
which causes the rubber particles to be thrown upward and serum moves downward.
Meanwhile, in the processing of block skim rubber, dryer is the machinery used to dry
the rubber and it consumes the most energy. Drying uses hot air at temperatures of
110-115 0C for 3.5 hours.
According to Anas (2007), electricity usage in latex concentrate processing is
approximately 240 kWh per ton dry rubber or about or 151.2 kWh per ton concentrated
latex, while for block skim rubber processing about 200 kWh per ton dry rubber. The
DIW (2001) made observations on 10 industries and found the energy use ranges from
74.2 kWh to 241.9 kWh per ton of concentrated latex with an average of 90.0 kWh per
ton of concentrated latex . Block skim rubber processing uses energy at 164 to 374
kWh /ton of dry rubber with an average of 200 kWh/ ton of dry rubber. Based on this
information the use of energy for concentrated latex processing in Indonesia is still
wasteful. However but for block skim rubber processing is still within the limits
reported by the DIW. Jawjit et al (2012) noted that the average energy consumption in
concentrated latex processing is about 105 kWh per ton concentrated latex and the
centrifuge is the machine that consumes highest amount of electricity. Energy audit by
Saidur and Mekhilef (2010) in Malaysia’s rubber and rubber industries showed
electric motor as the equipment that consumes the highest energy followed by pumps
and heaters.
Table 4.21 shows energy consumption in natural rubber latex concentrate processing for
Factory A and Factory B. Energy consumption for block skim rubber processing is 40%
greater than energy consumption for latex concentrate processing in Factory A. The
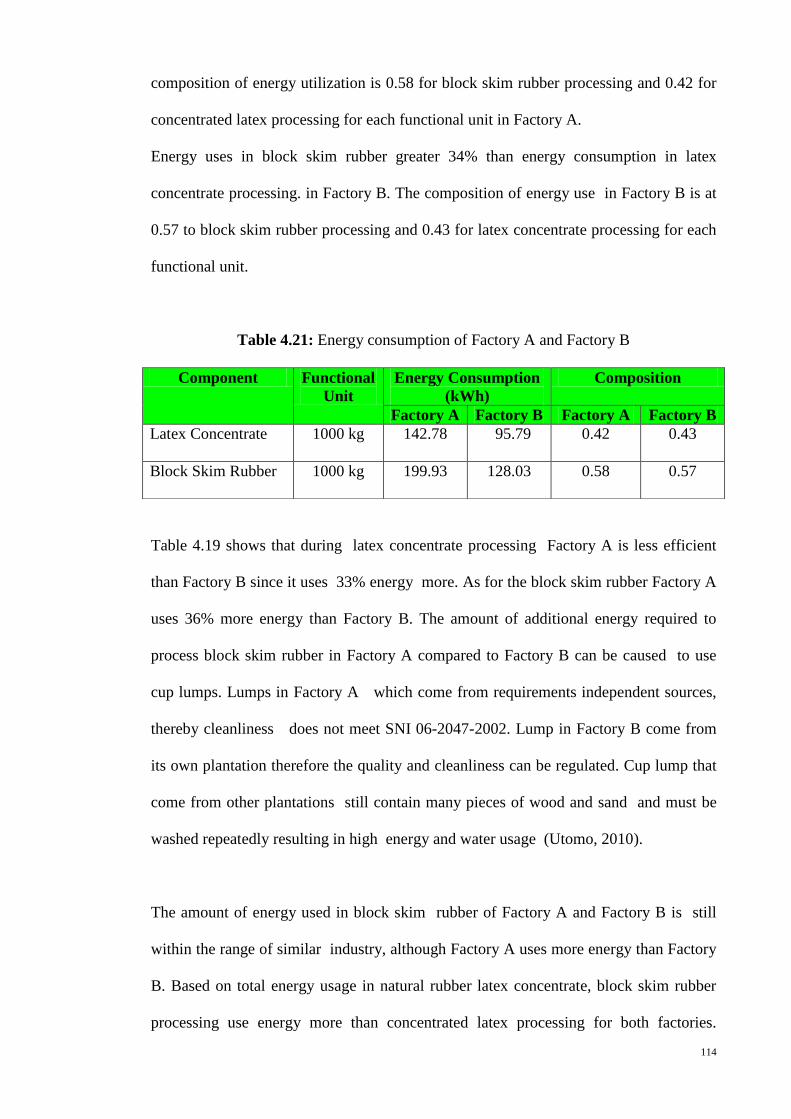
114
composition of energy utilization is 0.58 for block skim rubber processing and 0.42 for
concentrated latex processing for each functional unit in Factory A.
Energy uses in block skim rubber greater 34% than energy consumption in latex
concentrate processing. in Factory B. The composition of energy use in Factory B is at
0.57 to block skim rubber processing and 0.43 for latex concentrate processing for each
functional unit.
Table 4.21: Energy consumption of Factory A and Factory B
Table 4.19 shows that during latex concentrate processing Factory A is less efficient
than Factory B since it uses 33% energy more. As for the block skim rubber Factory A
uses 36% more energy than Factory B. The amount of additional energy required to
process block skim rubber in Factory A compared to Factory B can be caused to use
cup lumps. Lumps in Factory A which come from requirements independent sources,
thereby cleanliness does not meet SNI 06-2047-2002. Lump in Factory B come from
its own plantation therefore the quality and cleanliness can be regulated. Cup lump that
come from other plantations still contain many pieces of wood and sand and must be
washed repeatedly resulting in high energy and water usage (Utomo, 2010).
The amount of energy used in block skim rubber of Factory A and Factory B is still
within the range of similar industry, although Factory A uses more energy than Factory
B. Based on total energy usage in natural rubber latex concentrate, block skim rubber
processing use energy more than concentrated latex processing for both factories.
Component Functional
Unit
Energy Consumption
(kWh)
Composition
Factory A Factory B Factory A Factory B
Latex Concentrate
1000 kg 142.78 95.79 0.42 0.43
Block Skim Rubber
1000 kg 199.93 128.03 0.58 0.57
115
Dryer, circulation fan and pressing are the equipments in block skim rubber processes
that use the highest amount of energy.
The proper use of equipment and regular maintenance are important for consideration of
energy savings. It takes approximately 15 minutes for the centrifuge to achieve the
rotation of 6,000 rpm. Water is added to avoid friction between bowls and air in
centrifuge which can cause the bowls become hot and causes high energy loss. The field
latex will be conveyed to the centrifuge once the rotation is constant at 6,000 rpm,.
Energy consumption in natural rubber latex concentrate processing is used more for
block skim rubber processing especially in the drying process. Energy consumption
during drying involves sensible heat and latent heat for the phase change of water
content to be evaporated. It means that water content before drying must be in a
minimum amount to lower energy consumption.
4.5.3 Water Consumption
In the concentrated latex processing, water is used for cleaning machinery items, such
as the centrifuge bowl. In block skim rubber processing, water is used for washing the
acid from the coagulum and impurities such as sand, bits of wood from the cup lumps.
According to Anas (2007), the use of water is approximately 25 m3 per ton of dried
rubber in concentrated latex processing, while for the block skim rubber processing is
30 m3 per ton of dried rubber. According to observation by DIW (2001) on 11
industries, water consumption ranged from 1.8-15.8 m3 per ton of concentrated latex
with an average of 5.2 m3
per ton of concentrated latex. For block skim rubber
processing water consumption ranged from 6 - 56 m3
per ton of dried rubber with an

116
average of 23 m3
per ton of dried rubber. Jawjit et al. (2012) observed that the average
water consumption is about 6-7 m3 per ton of concentrated latex.
Table 4.22 shows water consumption for natural rubber latex concentrate processing in
Factory A and Factory B.
Table 4.22: Water consumption of Factory A and Factory B
The data show that water use in Factory A is 19.37 m3per ton of concentrated latex
which is 44.5% less than water consumption for block skim rubber, which is 34.93 m3
per ton of dried rubber. This is because Factory A uses lump from independent source
which is low in cleanliness (Utomo, 2010). Therefore more water is needed in the block
skim rubber processing.
Water used at Factory A in block skim rubber processing is more widely used for
washing coagulum, and washing the cup lump from independent source and washing
the thin layer of rubber at every stage before drying. Hence, cup lumps from
independent sources need to obtain as clean cup lumps before it is sold to the factory.
Water consumption for Factory B as shown in Table 4.20 is 11.36 m3/ton of
concentrated latex and the amount is nearly the same for block skim rubber processing
at 10.89 m3/ton of concentrated latex.
It is necessary to consider the use of water for both processes. Factory A uses 70 %
more water than Factory B for concentrated latex processing while water usage for
Component Functional
Unit
Water Consumption
(m3)
Composition
Factory A Factory B Factory A Factory B
Latex Concentrate
1000 kg 19.37 11.36 0.36 0.51
Block Skim Rubber
1000 kg 34.93 10.99 0.64 0.49

117
block skim rubber in Factory A is 2.18 times more compared to Factory B. It shows that
Factory B has already used the water efficiently.
Water consumption is closely related to the wastewater generated. The more water used,
the more the amount of wastewater discharge (effluent) to a system (Leong S.T.;
Muttamara S.; Laortanakul, 2003), (Rungruang, 2008). So water usage must be used
efficiently.
4.5.4 Residuals
4.5.4.1 Air Emission
Diesel fuel is used in Natural Rubber Latex Concentrate processing. The use of diesel
fuel generally is for all types of diesel engines with high rotation (above 1,000 RPM).
Arismunandar (1983) said that the black smoke containing particulates are harmful
exhaust gas components in diesel combustion. According to Nakula (1995), black
smoke in chimney is caused by incomplete combustion due to lack of oxygen, or the
amount of fuel is in excess. Under these conditions the carbon does not have enough
time to diffuse with oxygen, resulting in carbon in the solid phase and becoming
charred.
The average concentration of each parameter of air emission for Factory A and Factory
B are shown in Table 4.23. Factory A consumed more energy then Factory B at 342.71
kWh per ton of concentrated latex which consumed total energy of 223.82 kWh per ton
of concentrated latex. Total energy consumption influences the air emission
concentration for particulate. In general, parameters of air emission for both factories
are below the discharge limits according to Regulation of the Ministry of Environment
Republic of Indonesia Kep-13/MENLH/3/1995 (KLH, 1995b).

118
Table 4.23: Air emission concentration in Factory A and Factory B
No Parameter Concentration (mg/m3) Standard Requirement
(mg/m3) Factory A Factory B
1 SO2
36.6 81.4 800
2 NO2
23.7 100.0 1,000
3 Particulate
126.4 68.0 350
4.5.4.2 Wastewater
Excessive water consumption will lead to high wastewater that will increase the burden
on wastewater treatment system. Wastewater comes from coagulation pond and
washing of coagulum before further process. Total Nitrogen is the sum of: the amount
of N-organic + Total Ammonia + NO2 + NO3. Maximum load is defined as the amount
of parameters in 1 ton of dry rubber and based on Regulation of the Ministry of
Environment Republic of Indonesia, Kep-51/MEN LH/10/1995, for Standard
Requirement for rubber industry wastewater.
Wastewater parameters of the two factories are measured and compared to maximum
load that comply with requirement standard Regulation of the Ministry of Environment
Republic of Indonesia, Kep-51/MEN LH/10/1995 (Table 4.24). Wastewater parameters
of Factory A is higher than Factory B and some of the parameters e exceeds the
standard requirement. Total weight of ammonia in wastewater amounted to 1.62 kg per
ton of concentrated latex, almost 3 times the standard requirement. Excess of ammonia
from concentrated latex processing will interfere in the coagulation process. Rubber in
skim latex that has not coagulated will lead to high suspended solids. Total Suspended
Solid (TSS) in Factory A was 5.6 kg per ton of concentrated latex, which is beyond the
standard requirement. Atagana et al., (1999) conducted a study on treatment of
wastewater from rubber processing, which comes from natural rubber waste serum and

119
washing effluent by using fungi. He succeeded in reducing levels of BOD and
suspended solid meaning it can also reduce levels of COD. Ponds with effective design
and optimally operated can reduce over 95% biological oxygen demand (BOD) from
rubber wastewater (Ahmad, 1983). Nguyen and Luong (2012) concluded that
combining biological, physical and chemical treatment will provide high removal of
pollutant in wastewater of natural rubber processing at effective cost. Sludge from the
centrifuge also contains a high content of nutrients such as nitrogen, phosphorus,
potassium and magnesium because of DAP added.
Table 4.24: Wastewater weight of Factory A and Factory B
No Parameter Weight (kg) Maximum
load (kg)* Factory A Factory B
1 BOD5
4.4 0.4 4
2 COD
7.8 3.2 10
3 TSS
5.6 1.4 4
4 NH3-Total
1.7 0.1 0.6
5 N-Total
2.7 0.5 1
(*)Regulation of the Ministry of Environment Republic of Indonesia, Kep-51/MEN LH/10/1995

120
4.5.5 Summary Overall Process Flow in Natural Rubber Latex Concentrate
Processing
Figure 4.21 and Figure 4.22 are summarize of all material, energy, water air emission
and wastewater involved in natural rubber latex concentrate processing of Factory A
and Factory B.
Figure 4.21: Overall Process Flow in Natural Rubber Latex Concentrate Processing of Factory A
Concentrated
Latex
P R O C E S S I N G
Field latex (Rubber =1,134 kg)
Chemicals Ammonia = 102.7 kg ZnO = TMTD = 1.12 kg DAP = 3.28 kg Ammonium Laurate = 2.13 L
Energy = 142.78 kWh
Water = 19.37 m 3
Skim latex (Rubber = 123 kg
Water = 34.93 m 3
Losses (Rubber = 11 kg)
Wastewater : BOD5= 4.4 kg COD = 7.7 kg TSS = 5.6 kg NH3Total = 1.66 kg N-Total = 2.7 kg
Air Emission SO2 =36.6 mg/m3 NO2 = 23.7 mg/m3
Particulate = 126.4 mg/m3
Main Product: Latex Concentrate (Rubber = 1,000kg)
Block Skim Rubber P R O C E S S I N G
Product: Block Skim Rubber = 1,000 kg
Lump = 877 kg
Energy = 199.93 kWh
Chemical Formic acid = 7.33 kg

121
Figure 4.22: Overall Process Flow in Natural Rubber Latex Concentrate Processing of Factory B
Concentrated
Latex
P R O C E S S I N G
Field latex (Rubber =1,113 kg)
Chemicals Ammonia = 80 kg ZnO = TMTD = 0.06 kg Lauric acid = 2 L
Energy = 95.79 kWh
Water = 11.36 m 3
Skim latex (Rubber = 102 kg
Water = 10.99 m 3
Losses (Rubber = 11 kg)
Wastewater : BOD5= 0.4 kg COD = 3.2 kg TSS = 1.4 kg NH3Total = 0.1 kg N-Total = 0.5 kg
Air Emission SO2 =81.4 mg/m3
NO2 = 100.0 mg/m3
Particulate = 68.0 mg/m3
Main Product: Latex Concentrate (Rubber = 1,000kg)
Block Skim Rubber P R O C E S S I N G
Product: Block Skim Rubber = 1,000 kg
Lump =898 kg
Energy = 128.03 kWh
Chemicals Sulfuric acid = 18.38 kg

122
4.6 Life Cycle Impact Assessment (LCIA)
Life cycle impact assessment is calculated using Eco-Indicator 99, with Hierarchical
(HI) version as a damage model.
4.6.1 Characterization
According to Eco-Indicator 99, characterization consists of 11 impact categories that
give impact to air, water and soil: namely, carcinogen, respiratory organics, respiratory
inorganics, climate change, radiation, ozone layer, ecotoxicity,
acidification/eutrophication, land use, minerals, and fossil fuels (M. Goedkoop, &
Spriensma, R, 2001; M. Goedkoop, Schryver, A., & Oele, M, 2008).
Table 4.25 shows characterization of LCIA in natural rubber latex concentrate
processing Factory A and Factory B with functional unit producing of 1,000 kg latex
concentrate and 1,000 kg block skim rubber.
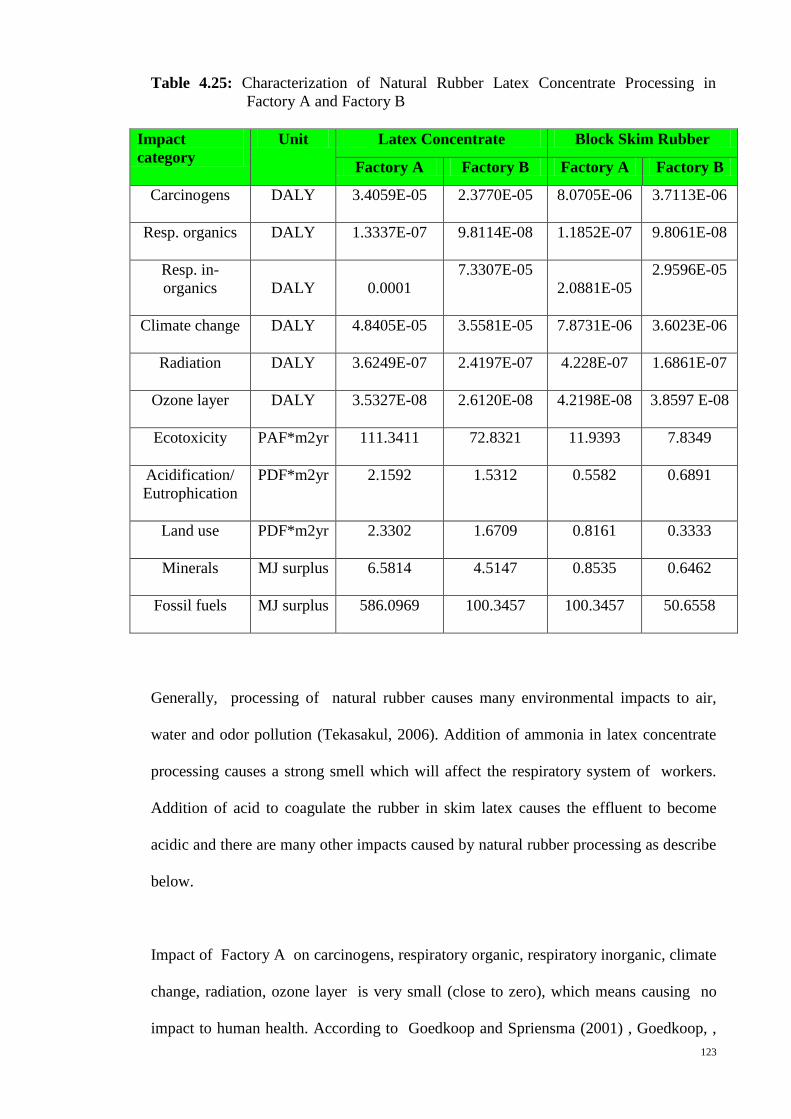
123
Table 4.25: Characterization of Natural Rubber Latex Concentrate Processing in
Factory A and Factory B
Impact
category
Unit Latex Concentrate Block Skim Rubber
Factory A Factory B Factory A Factory B
Carcinogens
DALY
3.4059E-05
2.3770E-05 8.0705E-06
3.7113E-06
Resp. organics
DALY
1.3337E-07
9.8114E-08 1.1852E-07
9.8061E-08
Resp. in-
organics
DALY
0.0001
7.3307E-05
2.0881E-05
2.9596E-05
Climate change
DALY
4.8405E-05
3.5581E-05 7.8731E-06
3.6023E-06
Radiation
DALY
3.6249E-07
2.4197E-07 4.228E-07
1.6861E-07
Ozone layer
DALY
3.5327E-08
2.6120E-08 4.2198E-08
3.8597 E-08
Ecotoxicity
PAF*m2yr
111.3411
72.8321 11.9393
7.8349
Acidification/
Eutrophication
PDF*m2yr
2.1592
1.5312 0.5582
0.6891
Land use
PDF*m2yr
2.3302
1.6709 0.8161
0.3333
Minerals
MJ surplus
6.5814
4.5147 0.8535
0.6462
Fossil fuels
MJ surplus
586.0969
100.3457 100.3457
50.6558
Generally, processing of natural rubber causes many environmental impacts to air,
water and odor pollution (Tekasakul, 2006). Addition of ammonia in latex concentrate
processing causes a strong smell which will affect the respiratory system of workers.
Addition of acid to coagulate the rubber in skim latex causes the effluent to become
acidic and there are many other impacts caused by natural rubber processing as describe
below.
Impact of Factory A on carcinogens, respiratory organic, respiratory inorganic, climate
change, radiation, ozone layer is very small (close to zero), which means causing no
impact to human health. According to Goedkoop and Spriensma (2001) , Goedkoop, ,

124
(2008) , disability scale runs from 0 ≤ DALY ≤ 1, where zero means healthy and one
means death. Impact value on ecotoxicity of latex concentrate process separation
amounted to 111.3411 PAF*m2yr and is about 10 times larger than the processing of
block skim rubber. The PAF unit shows the percentage of species are exposed to a
concentration above No Observed Effect Concentration (NOEC). This means high
value of PAF will increase the number of species that are affected (M. Goedkoop, &
Spriensma, R, 2001). Impact to ecotoxicity gives stress to the ecosystem caused by use
of chemical. Impact on ecotoxicity by latex concentrate separation predominantly
comes from use of ammonia which is equal to 91.1965 PAF*m2yr and for
manufacturing block skim rubber, it is derived from use of formic acid as coagulant
with a value 4.4794 PAF m2yr*and plastic wrap 4.5773 PAF*m
2yr. Impact on minerals
and fossil fuels on the separation process during latex concentration is also dominated
by ammonia as preservatives. For block skim rubber manufacturing impact on
minerals derived from water, impact on fossil fuel is derived from the use of formic
acid with a value of 49.124 MJ Surplus and plastic wrap 43.9574 MJ Surplus.
Impact of Factory B is the same as impact of Factory A, in which carcinogens,
respiratory organic, respiratory inorganic, climate change, radiation, ozone layer are
very small (close to zero), which means causing no impact to human health. Impact
value on ecotoxicity of latex concentrate process separation amounted to 72.8321
PAF*m2yr and is about 10 times larger than the manufacture of block skim rubber.
Impact to ecotoxicity gives stress to the ecosystem caused by use of chemical. Impact
on ecotoxicity from latex concentrate separation predominantly comes from use of
ammonia which is equal to 71.0392 PAF*m2yr. Impact on manufacturing block skim
rubber is derived from sulfuric acid as coagulant with a value 2.2354 PAF*m2yr and

125
plastic packaging 4.5773 PAF*m2yr. Impact on minerals and fossil fuels on the
separation of latex concentrate is also dominated by ammonia as preservative.
Impact to block skim rubber manufacturing for minerals is 79.66% derived from
sulfuric acid and impact to fossil fuel is 86.78% is derived from the use of plastic
packaging with a value of 43.9575 MJ Surplus.
4.6.2 Normalization of Characterization
Normalization shows the relative impact value of the total impact from a country or a
region as a reference in one year and expressed as person equivalents (Yusoff, 2005)
The normalization value is based on European standards. The number of impact
categories that is already normalized shows the number of person affected in one year.
Normalization of impact categories for Natural Rubber Latex Concentrate Processing
Factory A and Factory B is as shown in Table 4.26 and Fig 4.23.

126
Table 4.26: Normalization of Characterization of Natural Rubber Latex Concentrate
Processing in Factory A and Factory B
Impact
Category Latex Concentrate Block Skim Rubber
Factory A Factory B Factory A Factory B
Carcinogens
3.8861E-03 2.7121E-03 9.2084E-04 4.2346E-04
Resp. organics
1.5217E-05 1.1195E-05 1.3523E-05 1.1189E-05
Resp.
inorganics
1.1169E-02 8.3643E-02 2.3825E-03 3.3769E-03
Climate
change
5.5523E-03 4.0598E-03 8.9833E-04 4.1102E-04
Radiation
4.1361E-05 2.7608E-05 4.8241E-05 1.9238E-05
Ozone layer
4.0308E-06 2.9803E-06 4.8148E-06 4.4039E-06
Ecotoxicity
1.9462E-03 1.2731E-03 2.0870E-04 1.3695E-04
Acidification/
Eutrophication
3.7743E-04 2.6765E-04 9.7576E-05 1.2045E-04
Land use
4.0731E-04 2.9207E-04 1.4266E-04 5.8266E-05
Minerals
8.7204E-04 5.9820E-04 1.1309E-04 8.5620E-05
Fossil fuels
7.7658E-02 5.7363E-02 1.3296E-02 6.7119E-03

127
Figure 4.23: Normalization of Characterization of Natural Rubber Latex Concentrate
Processing in Factory A and Factory B
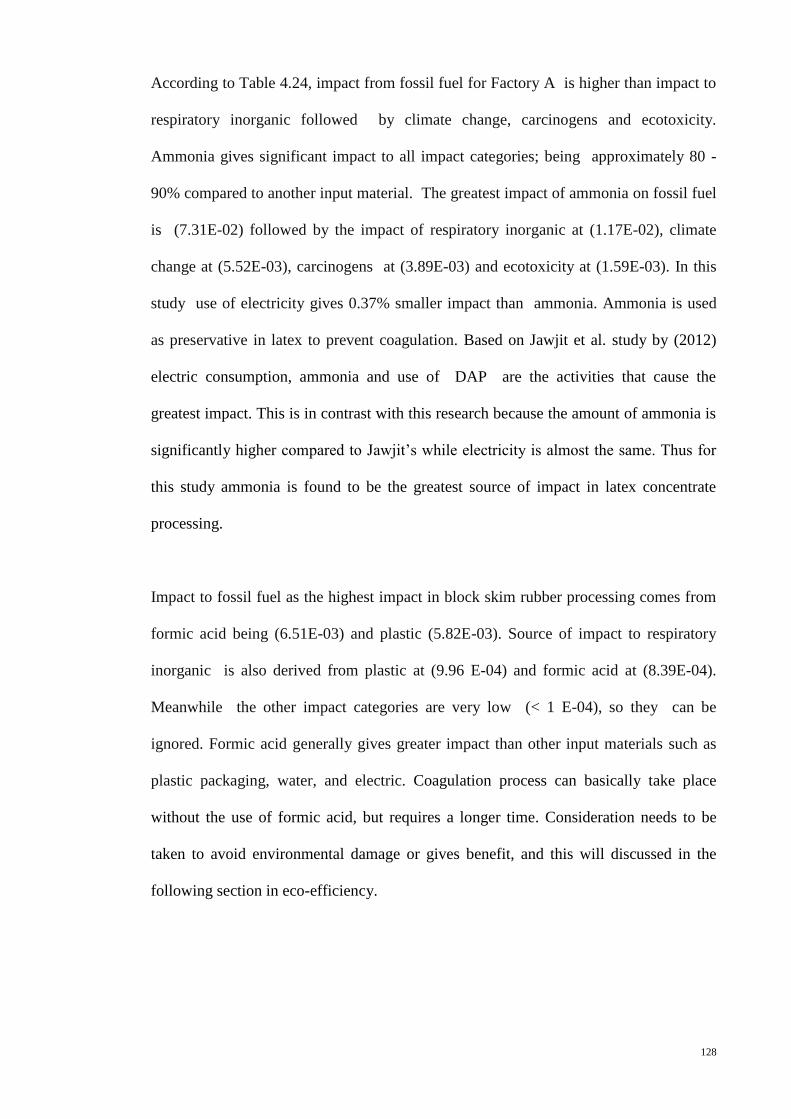
128
According to Table 4.24, impact from fossil fuel for Factory A is higher than impact to
respiratory inorganic followed by climate change, carcinogens and ecotoxicity.
Ammonia gives significant impact to all impact categories; being approximately 80 -
90% compared to another input material. The greatest impact of ammonia on fossil fuel
is (7.31E-02) followed by the impact of respiratory inorganic at (1.17E-02), climate
change at (5.52E-03), carcinogens at (3.89E-03) and ecotoxicity at (1.59E-03). In this
study use of electricity gives 0.37% smaller impact than ammonia. Ammonia is used
as preservative in latex to prevent coagulation. Based on Jawjit et al. study by (2012)
electric consumption, ammonia and use of DAP are the activities that cause the
greatest impact. This is in contrast with this research because the amount of ammonia is
significantly higher compared to Jawjit’s while electricity is almost the same. Thus for
this study ammonia is found to be the greatest source of impact in latex concentrate
processing.
Impact to fossil fuel as the highest impact in block skim rubber processing comes from
formic acid being (6.51E-03) and plastic (5.82E-03). Source of impact to respiratory
inorganic is also derived from plastic at (9.96 E-04) and formic acid at (8.39E-04).
Meanwhile the other impact categories are very low (< 1 E-04), so they can be
ignored. Formic acid generally gives greater impact than other input materials such as
plastic packaging, water, and electric. Coagulation process can basically take place
without the use of formic acid, but requires a longer time. Consideration needs to be
taken to avoid environmental damage or gives benefit, and this will discussed in the
following section in eco-efficiency.

129
Figure 4.23 shows that in latex concentrate processing of Factory B, fossil fuel provides
the highest impact followed by respiratory inorganic, climate change and carcinogen.
Impact to fossil fuel has the value of (5.7363E-02), which means there is impact to
(5.7363E-02) persons within one year period. Ammonia contributes impact more than
90% in almost all the impact categories which provides the greatest impact on fossil
fuel that is equal to (5.69E-02) followed by the impact of respiratory inorganic at
(8.17E-03), climate change at (3.99E-03), carcinogens at (2.57E-03) and ecotoxicity at
(1.24 E-03). In this study the use of electricity contributes 0.32% smaller impact to
fossil fuel compared to ammonia.
Meanwhile, for block skim rubber-making processing in Factory B, the greatest impact
occurs in fossil fuel, followed by respiratory inorganic, carcinogens, climate change,
ecotoxicity and acidification/ euthrophication. Impact to fossil fuel derived from the use
of plastic packaging is (5.82E-03), followed by the use of sulfuric acid which is used as
coagulant to coagulate skim latex. Impact of respiratory inorganic, derived from
sulfuric acid is (2.19E-03). In general, plastic and sulfuric acid gave negative impacts
in the impact categories such as carcinogens, climate change, ecotoxicity and
acidification/ euthriphication although in smaller numbers ranging from (1E-05) to (1E-
04).
4.6.3 Damage Assessment
Damage assessment consists of impact categories which involve three types of
damages:
Damage to Human Health, to show number of years lived taken by disability and
the number of years of life lost, which is expressed in units Disability Adjusted
Life Years (DALYs). The impact categories under damage to Human Health are:

130
carcinogens, respiratory organic, respiratory inorganic, climate change,
radiation, ozone layer.
Damage to Ecosystem Quality, to show the species is missing in one area in
certain period. The impact categories under damage to Ecosystem quality are:
ecotoxicity, acidification/eutrophication, landuse.
Damage to Resources, to show a surplus of energy needed that must be replaced
for the future to extract minerals or fossil fuels.
Table 4.27 shows the damage assessment of Life Cycle Impact Assessment in Natural
Rubber Latex Concentrate of Factory A and Factory B and the graphical representation
of the table is shown in Figure 4.24.
Damage to Human Health in Factory A derived from ammonia is 0.00016 DALY,
12.9725 PDF*m2yr damage to Ecosystem Quality and 557.2908 MJ Surplus damage to
Resources. Ammonia gives damage value greater than 80% compared to all the other
materials used in latex concentrate processing.
Formic acid and plastics packaging provide damage in block skim rubber manufacturing
in which formic acid gives 40% impact on human health, 49% impact on the resources
and 34% impact on eco-system quality. Plastic packaging is used to cover the block
skim rubber gives 32% impact on human health, 32% impact on ecosystem quality and
43% impact on resource. The three damage categories cannot be compared with each
other because different unit are used.
While for Factory B, ammonia contributes more than 90% damage, which is the highest
damage for all damage categories in latex concentrate processing. Plastic wrapping
contributes 86% damage to resources and 45% to ecosystem quality, and sulfuric acid

131
contributes 58% damage to human health and 38% to ecosystem quality in block skim
rubber processing.
Table 4.27: Damage Assessment in Natural Rubber Latex Concentrate Processing in
Factory A and Factory B
Damage
Category
Unit Latex Concentrate Block Skim Rubber
Factory A Factory B Factory A Factory B
Human Health DALY 0.018E-02 0.013E-02
3.7408E-05
3.7214E-05
Ecosystem
Quality
PDF*m2yr 15.6235 10.4853
2.5683
1.8059
Resources MJ surplus 592.6783 437.4452
101.1992
51.3020
Figure 4.24: Damage Assessment of Latex Concentrate Processing
in Factory A and Factory B
4.6.4 Normalization Damage Assessment
Normalization of damage categories in Natural Rubber Latex Concentrate Processing
for Factory A and Factory B is shown in Table 4.26 and Figure 4.25. It is clear that

132
Resources and Human Health are dominating damages both for latex concentrate
processing and block skim rubber processing.
Ammonia contributes damage of 0.0738 PE (94.03%) in resources and 0.019 PE
(89.60%) to human health, which means 0.0738 persons in one year are affected under
resources and 0.019 persons in one year under human health in Factory A. Overall,
ammonia contributes the highest impact (92.80%) with the total impact of 0.1024 PE.
High impact in block skim rubber processing in Factory A is derived from formic acid
that contributes 0.0066 PE (49%) to resources and wrapping plastic contributes 0.0058
PE (43%) to resources. Overall, formic acid gives impact of 47%, wrapping plastic
41% and water 10% with the total impact 0.0181 PE.
According to Jawjit et al. (2012), electricity causes 42% impact to human health and
54% to resources while ammonia contribute 14% to human health and 25% impact to
resources. Lauric acid as coagulant was found to be the main cause of ecosystem
quality problems (28%). Plastic as a covering for block rubber was not included in
Jawjit’s study.
Table 4.28: Normalization of Damage Assessment Natural Rubber Latex Concentrate
Processing in Factory A and Factory B
Damage Category
Unit Latex Concentrate Block Skim Rubber
Factory A Factory B Factory A Factory B
Human Health
0.0211 0.0152 0.0043
0.042
Ecosystem
Quality
0.0027 0.0018 0.0004
0.0003
Resources
0.0785 0.0580 0.0134
0.0068

133
Figure 4.25: Normalization Damage Assessment of Latex Concentrate Processing in
Factory A and Factory B
Resources has the highest damage both in concentrated latex processing and block skim
rubber processing in Factory B. The source of damage in latex concentrate processing
derived from ammonia has a value of 0.0575 PE (99.24%). Overall, ammonia gives a
very dominant impact amounting to 98.77% with the total impact of 0.0750 PE.
Block skim rubber processing in Factory B contributes high damage in resources caused
by plastic packaging at 0.0058 PE(85.75%) and sulfuric acid contributes damage of
0.0042PE (58.28%) in human health. Overall, plastic packaging (64.66%) provides the
greatest impact followed by sulfuric acid (27.51%) with the total impact 0.0113 PE.
From the information above ammonia contributes a very dominant effect on latex
concentrate processing in which Factory A give greater impact than Factory B. The use
of plastics and acid as coagulant contribute to impact in block skim rubber processing.

134
4.6.5 Weighting
4.6.5.1 Weighting per impact category
Weighting is done following the procedures from Eco-Indicator 99, to know the
important categories after normalization, and makes it possible to directly compare the
categories. The unit of weighting is point in which one point indicate the weighted
impact from one mille-person equivalent (the impact per year from 1/1,000 persons).
Weighting in Natural Rubber Latex Concentrate processing of Factory A and Factory B
is shown in Table 4.29 and Figure 4.26. After weighting, fossil fuel (75%) is still the
most affected impact category, followed by respiratory inorganic (11%), climate change
(5%), carcinogens(4%) and ecotoxicity (3%) from total impacts of 30.9985pt in latex
concentrate processing. The weighted value to fossil fuels is 23.2974 pt, indicating
impact equivalent to 0.023 persons (in Europe) in a year, the majority of 21.9274 pt
(75%) cause is related to use of ammonia. Ammonia contributes impact in respiratory
in-organics with weighting value of 3.1476 pt, the same as 10% from total impact in
weighting. Impact because of using electricity after weighting is nearly zero compared
to ammonia.
In block skim rubber processing, fossil fuel is the highest impact, followed by
respiratory inorganics, carcinogens and climate change. Impacts to fossil fuel comes
from formic acid at 1.9527 pt (49%) and wrapping plastic at 1.7473 pt (43.81%).
Overall impact to block skim rubber processing in Factory A comes from formic acid at
2.5504 pt (46.52%) and plastic packaging at 2.2218 pt (40.45%). According to
Varžinskas et al., (2009) plastic packaging gives the most impact during manufacturing
(5.1 mPt), while in usage 0.31 mPt and disposal 0.025 mPt. It appears that impact
during manufacturing is bigger than usage and disposal, so the use of plastic packaging

135
should be as efficient as possible. Excessive size and thickness will have a large impact
on the environment.
Table 4.29: Weighting per impact category Natural Rubber Latex Concentrate
Processing in Factory A and Factory B
Impact
Category
Unit Latex Concentrate Block Skim Rubber
Factory A Factory B Factory A Factory B
Carcinogens Pt 1.1658 0.8136 0.2763
0.1270
Resp. organics Pt 0.0046 0.0034 0.0041
0.0034
Resp. inorganics Pt 3.5062 2.5093 0.7148
1.0131
Climate change Pt 1.6569 1.2179 0.2695
0.1233
Radiation Pt 0.0124 0.0083 0.0145
0.0058
Ozone layer Pt 0.0012 0.0009 0.0014
0.0013
Ecotoxicity Pt 0.7785 0.5092 0.0838
0.0548
Acidification/
Eutrophication
Pt 0.1510 0.1071 0.0390 0.0482
Land use Pt 0.1629 0.1168 0.0571
0.0233
Minerals Pt 0.2616 0.1795 0.0339
0.0257
Fossil fuels Pt 23.2974 17.2090 3.9887
2.0136
136
Figure 4.26 : Weighting per impact category Natural Rubber Latex Concentrate
Processing in Factory A and Factory B

137
Impact to fossil fuels in Factory B is the highest followed by respiratory in-organics,
climate change, carcinogens and ecotoxicity in latex concentrate processing. Ammonia
affects impact most in all impact categories.
After weighting, fossil fuel (76%) is still the most affected impact category in Factory
B, followed by respiratory inorganic (11%), climate change (5%), carcinogens(4%) and
ecotoxicity (2%) from total impacts of 22.675pt in latex concentrate processing. The
weighted value to fossil fuels is 17.209 pt, indicating impact equivalent to 0.017 persons
(in Europe) in a year. The majority of 217.081 pt (75%) is caused by use of ammonia.
Ammonia contributes impact in respiratory inorganics in weighting value of 2.4519 pt,
the same as 11% from total impact in weighting. Impact because of electricity usage
after weighting is near to zero compared to ammonia.
Block skim rubber processing contributed the most impact to fossil fuels, followed by
respiratory in-organics, carcinogens and climate change. Plastic packaging contributes
the highest impact (64%), and sulfuric acid (28%) from the total impacts of 3.4393 pt.
Plastic packaging gives impact most in fossil fuels and sulfuric acid gives impact most
to respiratory in-organics.
4.6.5.2 Weighting not per impact category
Weighting not per impact category also known as weighting to three parameters of
damage for Factory A and Factory B is shown in Table 4.30 and represented in Figure
4.27. Weighting to resources is 76% from total weighting and is the highest, followed
by human health at 20% in latex concentrate processing. Ammonia contributes the
highest impact at 93% from total weighting of 30.9985 pt. Ammonia contributes 94%
impact in resources, 90% in human health and 83% in ecosystem quality. Impact from

138
other materials is less than 1%, and it can be neglected. This is different from latex
concentrate production in Thailand, where impact is mainly caused by electricity (49%)
and followed by ammonia (22%) (W. Jawjit, et al., 2012).
Weighting to resources is 73% from total weighting of 5.4827 pt and is the highest,
followed by human health (23%) in block skim rubber processing. The activity that
contributes impact to environment are formic acid which contributes 47% especially in
resources, wrapping plastics contributes 40% mainly in resources and water at 10%
based on total weighting.
Table 4.30: Weighting not per impact category Natural Rubber Latex Concentrate
Processing in Factory A and Factory B
Damage Category
Unit Latex Concentrate Block Skim Rubber
Factory A Factory B Factory A Factory B
Human Health Pt 6.3472 4.5534 1.2804
1.2739
Ecosystem
Quality
Pt 1.0924 0.7331 0.1796
0.1262
Resources Pt 23.5590 17.3884 4.0227
2.0393

139
Figure 4.27 : Weighting not per impact category Natural Rubber Latex Concentrate
Processing in Factory A and Factory B
Ammonia contributes the highest weighting of 99% from total weighting of 22.675,
and ammonia contributes weighting of 76% in resources and 20% in human health in
latex concentrate processing in Factory B. Weighting from other materials is less than
1% and it can be neglected.
Weighting to resources is 59% from total weighting and is the highest, followed by
human health at 37% in block skim rubber processing. Plastic packaging contributes
the highest impact (64%) followed by sulfuric acid (28%) in total weighting. Plastic
packaging contributes weighting of 51% in resources, formic acid contributes 12% to
human health from total weighting and sulfuric acid contributes weighting of 22% to
human health from total weighting. Weighting to other damage categories by other
materials is very small, being less than 5%.

140
4.7 Eco-Efficiency
4.7.1 Calculation of Eco-Efficiency
The Eco-Efficiency concept is suitable for the industrial world because its practical
approach makes it possible to balance environmental and economic benefits (Maxime,
2006). According to WBCSD ( 2000), eco efficiency is calculated as Eq. (2):
Eco-Efficiency = (Product or Service Value/ Environmental Impact)
In this research product or service value is functional unit or mass of field latex to
process, and environmental impact as impact categories or damages in Eco-Indicator 99.
Based on the Life Cycle Impact Assessment for the Natural Rubber Latex Concentrate
Processing for Factory A and Factory B, there were some impact categories that are
significant and some are very small and can be neglected.
Table 4.31 shows the weighting in natural rubber latex concentrate processing in
Factory A and Factory B and Table 4.32 displays percentage of impact categories which
compare impact category to the total impact. Percentage of each impact category to the
total impact on each factory in latex concentrate processing is almost similar, in which
total impact to Factory A is 30.9985 pt and Factory B is 22.675 pt. Fossil fuels is very
dominant in impact categories and has the highest percentage value followed by
respiratory in-organics, climate change and ecotoxicity.
Respiratory organics, radiation, ozone layer due to the latex concentrate processing for
both Factory A and Factory B have very small impact compared to the total impact and
could be neglected in this research. Therefore the environmental parameters that
influence environmental impact in latex concentrate processing selected for eco-
efficiency calculations are: carcinogens, respiratory inorganics, climate change,
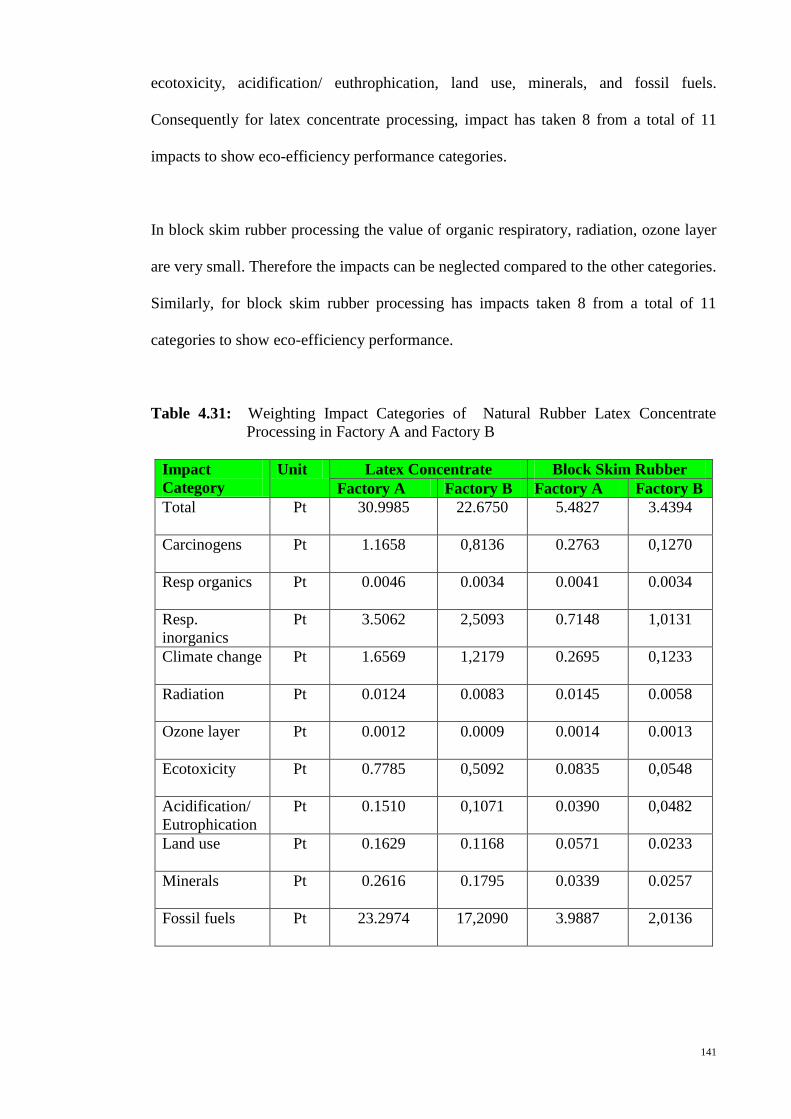
141
ecotoxicity, acidification/ euthrophication, land use, minerals, and fossil fuels.
Consequently for latex concentrate processing, impact has taken 8 from a total of 11
impacts to show eco-efficiency performance categories.
In block skim rubber processing the value of organic respiratory, radiation, ozone layer
are very small. Therefore the impacts can be neglected compared to the other categories.
Similarly, for block skim rubber processing has impacts taken 8 from a total of 11
categories to show eco-efficiency performance.
Table 4.31: Weighting Impact Categories of Natural Rubber Latex Concentrate
Processing in Factory A and Factory B
Impact
Category
Unit Latex Concentrate Block Skim Rubber
Factory A Factory B Factory A Factory B
Total Pt 30.9985 22.6750 5.4827 3.4394
Carcinogens Pt 1.1658 0,8136 0.2763 0,1270
Resp organics Pt
0.0046 0.0034 0.0041 0.0034
Resp.
inorganics
Pt
3.5062
2,5093
0.7148
1,0131
Climate change Pt 1.6569 1,2179 0.2695 0,1233
Radiation Pt 0.0124 0.0083 0.0145 0.0058
Ozone layer Pt 0.0012 0.0009 0.0014 0.0013
Ecotoxicity Pt 0.7785 0,5092 0.0835 0,0548
Acidification/
Eutrophication
Pt 0.1510 0,1071 0.0390 0,0482
Land use Pt 0.1629 0.1168 0.0571 0.0233
Minerals Pt 0.2616 0.1795 0.0339 0.0257
Fossil fuels Pt 23.2974 17,2090 3.9887 2,0136

142
Table 4.32: Percentage of Weighting Impact Categories of Natural Rubber Latex
Concentrate Processing in Factory A and Factory B
Impact
Category
Unit Latex Concentrate Block Skim Rubber
Factory A Factory B Factory A Factory B
Total Pt 30.9985 22.6750 5.4827 3.4394
Carcinogens % 3.76 3.59 5.04 3.69
Resp organics % 0.01 0.01 0.07 0.10
Resp.
inorganics
% 11.31 11.07 13.04 29.45
Climate change % 5.35 5.37 4.92 3.59
Radiation % 0.04 0.04 0.26 0.17
Ozone layer % 0.00 0.00 0.03 0.04
Ecotoxicity % 2.51 2.25 1.52 1.59
Acidification/
Eutrophication
% 0.49 0.47 0.71 1.40
Land use % 0.53 0.52 1.04 0.68
Minerals % 0.84 0.79 0.62 0.75
Fossil fuels % 75.16 75.89 72.75 58.54
Eco-efficiency in natural rubber latex concentrate processing is calculated based on the
Eq. (2) is shown in Table 4.33 and the graph to represent the table is shown in Figure
4.28.
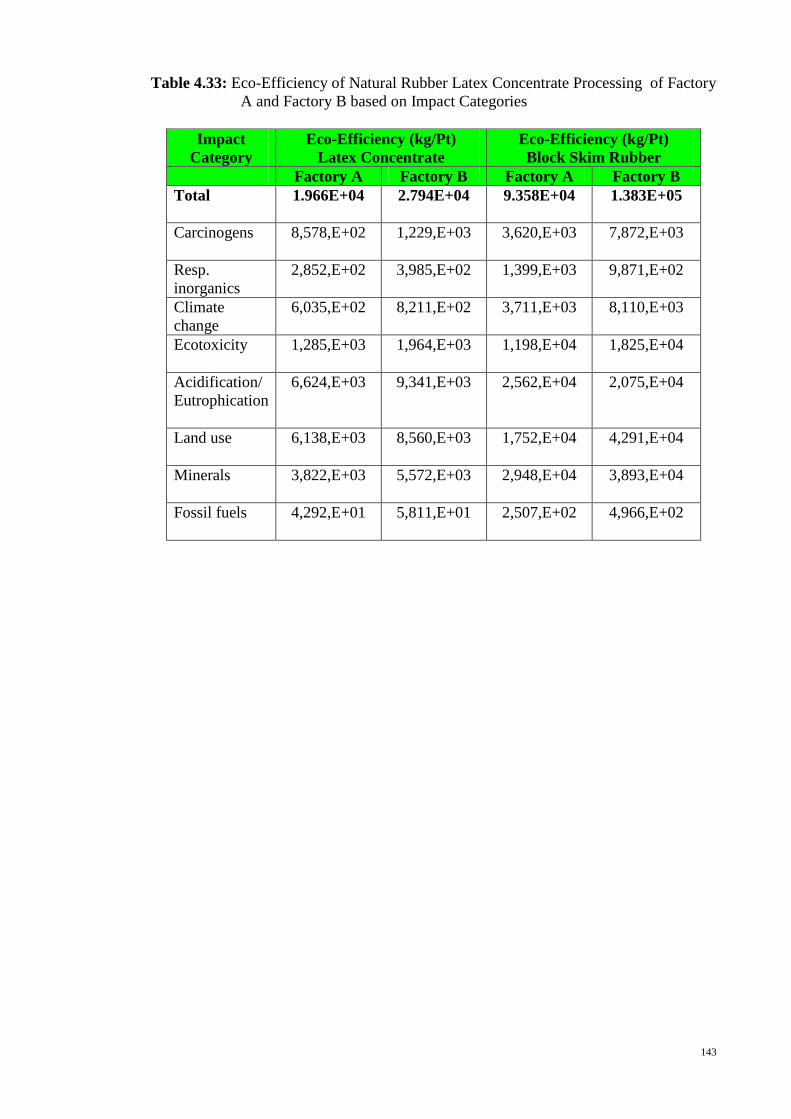
143
Table 4.33: Eco-Efficiency of Natural Rubber Latex Concentrate Processing of Factory
A and Factory B based on Impact Categories
Impact
Category
Eco-Efficiency (kg/Pt)
Latex Concentrate
Eco-Efficiency (kg/Pt)
Block Skim Rubber
Factory A Factory B Factory A Factory B
Total 1.966E+04 2.794E+04 9.358E+04 1.383E+05
Carcinogens 8,578,E+02 1,229,E+03 3,620,E+03 7,872,E+03
Resp.
inorganics
2,852,E+02 3,985,E+02 1,399,E+03 9,871,E+02
Climate
change
6,035,E+02 8,211,E+02 3,711,E+03 8,110,E+03
Ecotoxicity 1,285,E+03 1,964,E+03 1,198,E+04 1,825,E+04
Acidification/
Eutrophication
6,624,E+03 9,341,E+03 2,562,E+04 2,075,E+04
Land use 6,138,E+03 8,560,E+03 1,752,E+04 4,291,E+04
Minerals 3,822,E+03 5,572,E+03 2,948,E+04 3,893,E+04
Fossil fuels 4,292,E+01 5,811,E+01 2,507,E+02 4,966,E+02

144
Figure 4.28: Eco-Efficiency of Natural Rubber Latex Concentrate Processing in
Factory A and Factory B based on Impact Categories

145
Based on Eq.2 higher product or service value, and lower environmental impact will
increase the value of eco-efficiency. Product or service value, in this research is mass of
concentrated latex which should have high dry rubber content (DRC). There are several
factors that determine dry rubber content (DRC) in latex concentrate processing, and it
includes:
Chemical: chemical serves as a preservative or stabilizer. Besides, it also
bind metals that can disrupt the on going process.
Equipments: equipments should work in accordance with the requirement.
Centrifuge should have rotation of 6000 rpm, to ensure separation process
has a high efficiency.
Environmental impacts are due to chemical, energy and water used in the process.
Small environmental impact will be obtained when the amount of these three elements
are small with maximized function of each element.
From Table 4.33, eco-efficiency for latex concentrate processing of Factory B is
greater than Factory A in all impact categories. Ammonia is a compound that gives a
significant impact of more than 90% in both factories resulting in small eco-
efficiency value. The amount of ammonia is more in Factory A than Factory B that
influence the eco-efficiency. Ammonia gives impact more in fossil fuels (75.2%) and
respiratory in-organics (11.3%) for Factory A, while 75.3 % effect to fossil fuels and
10.8% effect to respiratory inorganic for Factory B.
Eco-efficiency of block skim rubber processing of Factory B is greater than Factory
A. Formic acid contributes impact of 35.6% and plastic 31.9% to fossil fuels which will
give small eco-efficiency value in Factory A. Respiratory inorganic also affect small

146
eco-efficiency because of impact by formic acid 4.6% and plastic 5.5%. Plastic (50.8%)
was found to be the main cause for impact to fossil fuels and sulfuric acid 19.1 % to
respiratory in-organics that influence the eco-efficiency in Factory B.
Figure 4.28 shows that eco-efficiency in natural rubber latex concentrate of Factory B is
better than Factory A.
Eco-efficiency as a function of three parameters of damage assessment can be seen in
Table 4.34 and in Figure 4.29. It appears that damage to resource provides the worst
eco-efficiency in natural rubber latex concentrate processing for both factories followed
by human health problem. Therefore it needs to manage the resource and human health
need to be properly managed to improve the eco-efficiency.
Table 4.34: Eco-Efficiency of Natural Rubber Latex Concentrate Processing in Factory
A and Factory B based on Damage Assessment
Damage
Category
Eco-Efficiency (kg/Pt)
Latex Concentrate
Eco-Efficiency (kg/Pt)
Block Skim Rubber
Factory A Factory B Factory A Factory B
Human Health 157.5508 219.6171 780.9549 785.0200
Ecosystem Quality 915.4207 1364.0149 5568.7057 7919.5900
Resource 42.4467 57.5094 248.5912 490.3750
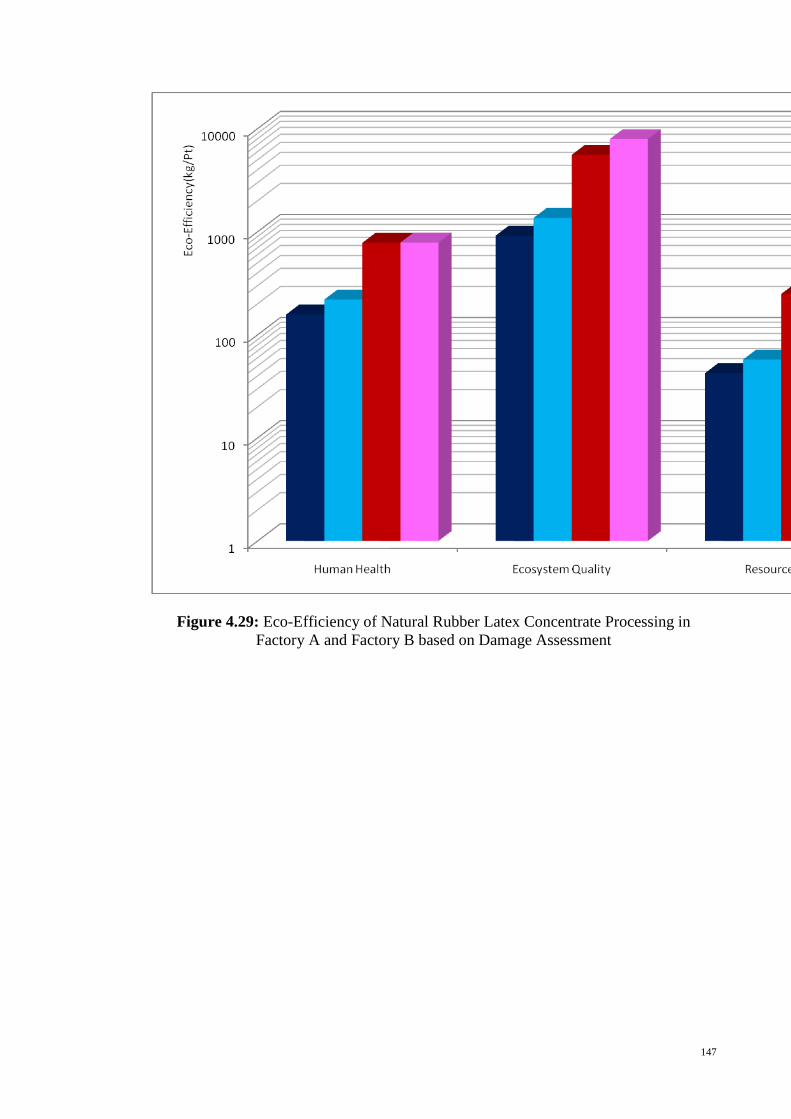
147
Figure 4.29: Eco-Efficiency of Natural Rubber Latex Concentrate Processing in
Factory A and Factory B based on Damage Assessment

148
Basically the suitable use of raw materials and secondary materials in process industry
will reduce waste, which in turn can reduce the impact on the environment. According
to Table 4.35, when all impact categories or damage assessment is made in a single
score, then the sequence of components that provides impact starting from high to low
at Factory A for latex concentrate are : Ammonia 92.7%, Diammonium Phosphate
4.5%, Zinc Oxide 1.4 %, Water 1%, Electricity 0.3% with total impact of 30.998 pt.
For block skim rubber processing, the sequence of impact is caused by: Formic acid
46.5%, Plastic 40.5%, Water 10.4% and Electricity 2.6% with total impact of 3.439 pt.
The same result is obtained for Factory B where the sequence of components that
provide the impacts in the latex concentrate processing are: Ammonia 98.8%, Water
0.8%, Electricity 0.3% and Zinc Oxide 0.1% with total impact of 22.675 pt. The
sequence impact in block skim rubber processing are: plastic 64.5%, sulfuric acid
27.6%, water 5.2% and electricity 2.7% with total impact of5.483 pt.
Percentage of the effect of chemicals, energy and water use in natural rubber latex
concentrate processing based on the resulting impact is shown in Table 4.35.

149
Table 4.35: Effect of the chemicals, energy and water in Natural Rubber Latex
Concentrate Processing
Percentage of the effect of
chemicals, energy and water
Diagram
Latex Concentrate for Factory A
with total Impact 30.998 pt
Latex Concentrate for Factory B
with total Impact 22.675 pt
Block Skim Rubber for Factory
B with total Impact 3.439 pt
Block Skim Rubber for Factory
A with total Impact 5.483 pt

150
Ammonia is a compound which gives dominant impact on concentrated latex in
Factory A and Factory B. Ammonia has a pungent odor that can damage health of
workers’, especially to the respiratory system. The smell of ammonia will also affect the
community around the factory. Both factories are located near to settlement.
High amount of ammonia usage can be caused by:
A longer interval period between tapping and separation process in the factory ,
due to the distance between plantation and factory.
Quality of field latex entering the factory is highly uncertain due to weather
condition. Therefore it is very difficult to set a fixed amount of ammonia.
Excess ammonia leads to high use of acid for neutralization in coagulation pond. The
excess acid not only causes acidic effluent but also re-dissolves the rubber protein and
causes delay in coagulation. The incomplete coagulation results in the loss of rubber
particles into the effluent. Reduction of ammonia levels in skim latex can be done using
the de-ammoniation tower with long trough length of 100 m, which can reduce levels
of ammonia by 50% (2001). Deammoniation had been done before coagulation as
one of the solutions to reduce ammonia in skim latex. Hence, use of ammonia must be
properly quantified, so that sequential impact can be avoided.
Preparation and storage of ammonia are done under proper control. Ammonia are
usually bought in a gas form, reaction with water to form ammonium hydroxide causes
rise in temperature and ammonia will evaporate more easily. To prevent unnecessary
loss, reaction must be done under low temperature.

151
To reduce loss due to evaporation of ammonia, ammonia solution should be placed in
the chiller.
Diammonium phosphate is the second highest chemical that gives impact in Factory A,
which can cause eutrophication. Magnesium is removed from the latex before
centrifugation to ensure high quality latex concentrate, by the addition of diammonium
phosphate (DAP). The exact amount of the salt should be used. A large amount of DAP
added can cause decrease of the mechanical stability of products (Cecil, 2003).
Reducing the amount of added DAP can cause lengthening of sedimentation time (W.
Jawjit, et al., 2012). Lengthening of sedimentation from 10-12 hours to 20-24 hours will
reduce 14%-19% impact to euthrophication (W. Jawjit, et al., 2012), therefore increase
in eco-efficiency.
Contributors of impact in block skim rubber at Factory A are formic acid, plastic, water
and electricity. Meanwhile contributors to impact on Factory B are: plastic, sulfuric
acid, water and electricity.
The plastic used for packaging block skim rubber should be used with the precise size
so that the volume and weight meet minimum desirable dimensions. This will lead to
minimum impact to the environment (Mahat and MacRae, 1992).
4.7.2 Eco-Efficiency Indicator
Eco-Efficiency Indicator is determined by three factors: waste intensity, energy
intensity and water intensity as shown in Table 4.36 and Figure 4.30 for Factory A
and Factory B in natural rubber latex concentrate processing Calculation is done
according to the equations (4), (5), (6) in Chapter III.

152
Table 4.36: Eco-Efficiency Indicator Factory A and Factory B in Natural Rubber Latex
Concentrate Processing
Eco-Efficiency
Indicator
Latex Concentrate Block Skim Rubber
Factory A Factory B Factory A Factory B
Waste Intensity
(kg/kg)
0.0112 0.0108 Nil Nil
Energy Intensity
(kWh/kg)
0.1428 0.0958 0.20 0.1280
Water Intensity
(m3/kg)
0.0194 0.0116 0.0349 0.0110

153
Figure 4.30: Eco-Efficiency Indicator of Natural Rubber Latex Concentrate Processing
in Factory A and Factory B
154
4.7.2.1.Waste Intensity
The definition of waste here is rubber which did not participate as a product in latex
concentrate and block skim rubber, which is also known as rubber losses. This
definition is similar to DIW definition (DIW, 2001) , in which losses is defined as:
% lost DRC = (DRC in field latex (kg) - DRC in conc. latex (kg) - DRC in skim rubber
(kg)/ DRC in field latex (kg)) x 100%.
Based on Table 4.34 waste in latex concentrate processing for both factories almost
show the same losses, which is equal to 1% of rubber contained in the field latex.
Waste rubber is usually taken from drainage system originating from coagulation to the
wastewater treatment pond. Waste is usually sold at a low price. Waste intensity in
Factory A is 0.0112 and Factory B 0.0108, which is almost the same for both factories.
Waste intensity influences the amount of wastewater parameters, such as BOD5,
COD, TSS, N-Total and NH3N (total ammonia) as shown in Table 4.22.
For the production of block skim rubber, there was no waste, because all the rubber
entered to the first stage, Macerator in Factory A and Pre-breaker in Factory B, become
block skim rubber as a product. It should be understood that wasteentails double
payment, namely, cost of raw material and management or disposal of the waste (Das,
2005).
Based on Table 4.16 and Table 4.17 the dry rubber content of latex concentrate as the
main product is in the range of 88% -90%, side product as coagulum 9% -11% and,
losses 1% from DRC in field latex.
Reduction of waste can be achived in several ways:

155
Rubber trap for coagulation pond should be able to work well, so there is no
rubber passing into the channel towards wastewater treatment plant.
The acid should be added as needed to coagulate rubber in skim latex
completely.
4.7.2.2. Energy Intensity
The source of energy for industries in Indonesia comes from the government electricity
company (PLN), but some use their own power plant by using generator. Private
power plants generally use diesel oil as fuel and the cost of energy consumption varies
depending on the amount of fuel used. At first many industries in Indonesia use fuel
diesel because the price is relatively cheaper than gasoline. But since the year 2009,
the Indonesian government set the same price for gasoline and fuel diesel, so now the
industry has begun to change their power plant by using gasoline.
Energy in natural rubber latex concentrate processing is used to operate equipments
such as centrifuges, macerator, creper , hammer mill and drying machine. As for energy
intensity, Factory A has greater energy intensity compared to Factory B both in
concentrated latex processing and block skim rubber processing. Centrifuge is the
equipment that uses the most energy in concentrated latex processing. In block skim
rubber processing, dryer is the equipment that uses the most energy followed by
hammer mill, and presses. Therefore more attention is required to use energy more
efficiently. Factory A emits higher air emissions compared to Factory B, based on
measurements of air emissions that have been set by the government namely SO2, NO2,
and particulate. This is supported by the results on air emission as discussed in section
4.4.4. This indicates that factory B is more eco-efficient in term of energy use.
156
Relatively, energy use cause less impact on the environment compared to chemical, but
based on section 4.5.2, energy consumption for both factories are still higher compare
to similar industries. So reducing energy consumption should be pursued. Energy
consumption for block skim rubber processing is 40% more compared to latex
concentrate processing for Factory A.
Energy consumption for block skim rubber processing is higher by 34% compared to
latex concentrate processing in Factory B. The two conditions above show that energy
consumption in block skim rubber is still higher than latex concentrate processing,
whereas the selling price of latex concentrate is U.S. $1.82 per kg of latex concentrate
(MRB, 2012) and higher than the average price of block skim rubber at U.S. $1.4/ kg
block skim rubber (Alibaba, 2012). As a result, reducing energy consumption for both
commodities, especially block skim rubber processing should be done. Reducing energy
consumption is one way to reduce the impact on the environment as well as one element
of the 7 elements in eco-efficiency.
Reduction of energy consumption can be achieved in several ways:
Start up of centrifuge takes 10-15 minutes to get rotation bowls in centrifuge at
6,000 rpm before the latex can be fed into the bowls. Friction between air inside
the bowls, makes the bowls becomes hot and causes energy loss. Water is added
bring down the temperature. Lots of energy loss in centrifuge occur during start
up, given every 2-3 hours centrifuge must be stopped for cleaning.
According to Jawjit et al. (2012), to reduce energy consumption during start up,
installation of inverter to some centrifuge allowing distribution of electric
current to machines until the desired rotation are met. This method can reduce
energy consumption by 10-12%.

157
Replace the old centrifuge (clutch and gear system) with a new machine by
using variable pulley to adjust RPM (revolution per minute) of the centrifuge
method can reduce energy consumption by 20% (DIW, 2001)
Crumbs entering the dryer should have as little water content as possible, so that
the energy required for phase change (latent heat) of water become less.
Improved controll of rubber moisture and combustion conditions may reduced
energy consumption by about 15% (DIW, 2001)
Motor as a driver on the equipments such as centrifuge, macerator, creper,
hammer, in natural rubber latex concentrate processing should be energy
efficient. Motors, heaters system are the main electrical energy users in rubber
processing and motors use approximately two-thirds of the energy costs in
rubber processing (Technology, 2009).
Centrifuge is a tool which uses energy the most in the process to separate
concentrated latex; for block skim rubber processing, hammer mill is a device
that uses energy more after the dryer. Based on energy audit by Saidur (2010),
electric motor used more energy followed by heater and cooling system in
rubber industry. Emission of CO2, SO2, NOx and CO will be increased by
increasing the speed power of motor but simultaneously will increase energy
saving. Oversized motors are inefficient and equipment needs to be carefully
matched. Saidur (2010) stated that saving energy could be done by regular
maintenance of motorized equipments such as cutter. This activity has the
potential to reduce energy by one third (W. Jawjit, et al., 2012). Furthermore,
controlling rubber moisture and combustion will reduce energy consumption by
15%.

158
Reducing water consumption will have an impact on reducing the volume of
wastewater and also reduces energy consumption. Water in the factory is
distributed by the pump using energy derived from the use of electricity.
In order to reduce fossil fuel usage, Reno (2010) offer sugarcane bagasse as
energy alternative which will produce biofuel with less impact to the
environment to substitute fossil fuel.
4.7.2.3.Water Intensity
A great quantity of the water consumed in latex concentrate processing is used for
cleaning equipment and surrounding processing area. For block skim rubber processing,
water is used for washing solid rubber from skim latex and cup lumps from plantation
known as bokar which has poor quality and cleaning surrounding area. Based on eco-
efficiency calculation, water intensity for Factory A on latex concentrate processing is
1.7 times greater than Factory B, and 3 times higher on block skim rubber processing.
Thereby Factory B is found to be more eco-efficient in water consumption.
Based on Table 4.20 water consumption varies greatly. The increase in processing
capacity of latex concentrate and block skim rubber does not follow increase in water
consumption. Water usage is not standardized and still is based on the habits and visual
measurements. As a result, over-consumption of water use will affect eco-efficiency.
Block skim rubber processing uses more water than latex concentrate processing at
Factory A and Factory B. So it will give low eco-efficiency or high water intensity.
Water consumption is higher in block skim rubber, certainly will lower the eco-
efficiency considering the price of block skim rubber is lower than latex concentrate.
Reducing water consumption can be done in several ways:

159
1. The excessive amount of acid in coagulum would require a large quantity of
water to clean the coagulum
2. Cup lumps (bokar) from the plantation must be clean with no wood or sand that
will require a large quantity of water to clean. Lumps should meet the
requirement of SNI 06-2047-2002.
3. Utilize high pressure cleaning systems with pressures up to 500 kPa, to wash the
floor in processing area in a short time and reducing water consumption . This
system can reduce water consumption up to 60%.
4. Use waterless cleaning equipment with function as a sweeper and brushes for
cleaning the equipments such as sedimentation tanks, centrifuge before rinsing
with water. This technique can reduce water consumption and takes a short time
to do, and minimize water to wastewater treatment.
5. To reprocess the water that has been used, and then reused. Basically the
function of water in the latex concentrated separation process to clean the
floor in factory area and most widely used for cleaning tools such as: skim gutter
and centrifuge bowl. Meanwhile, the centrifuge bowl used more water than other
equipments, because it should be washed every 2 hours to avoid clogging.
Technologies that are used to treat wastewater for reuse can involve
improvements of methods such as: precipitation and sedimentation, biological
treatment, filtration through media or membranes, reverse osmosis.
Reprocessing of wastewater in natural rubber latex concentrate processing can
be done to reuse the water by separating rubber particles, or chemical
compounds such as excess ammonia and excess acid. Therefore usage of fresh
water is reduced. Reprocessing water is offered in a simple way as shown in
Figure 4.31.

160
Wastewater from Cleaning
Filter Membrane
Coarse material
Figure 4.31: Reprocessing of wastewater
6. Companies can use rainwater harvesting because the rainfall in North Sumatra
is quite high, especially in the months of August until February. The maximum
rainfall is 313.1 mm rainfall in January and minimum of 63.2 mm in August
(Dephut, 2002). Waste minimization can also reduce water consumption,
because waste needs water for cleaning.
Clean Water

161
CHAPTER 5
5. CONCLUSION AND RECOMMENDATION
6.
5.1 Conclusions
The concentration of field latex is achieved through centrifugation, which is a
mechanical separation process employing centrifugal force at 6500 rpm to produce a
concentrated field latex layer and a skim rubber layer. For both factories DRC in field
latex ranges between 29% to 32% and after centrifugation 88%-90% dry rubber
content goes towards latex concentrate and of 9.22% dry rubber content goes towards
coagulation pond to form block skim rubber. A by product skim rubber is obtained after
coagulation. The overall DRC losses is 1%.
Natural rubber latex concentrate processing requires chemicals additives that may
affect the health of workers or the community around the factory. Factory A uses more
chemical than Factory B both in latex concentrate processing and block skim rubber
processing. Energy is needed to drive the motors and pumps as well as for the drying
process. Generally processing block skim rubber processing consumes energy more
than latex concentrate processing. Factory A is less efficient than Factory B since it uses
30% more energy. As for block skim rubber Factory A uses 36% more energy than
Factory B. Natural rubber latex concentrate processing also requires a lot of water
which will result in wastewater which needs treatment. Factory A uses 70% more water
than Factory B for concentrated latex processing, while for block skim rubber
processing, Factory A uses water 2.18 times more compare to Factory B. Therefore,
chemical, energy and water are three components required in natural rubber latex
concentrate processing, but furthermore will give negative impact on the environment.

162
According to ADB (2008) increase in material consumption are related to increased in
residuals as wastes or pollution. Materials need to be used efficiently, irrespective
wether they are from renewable non-renewable sources. Higher rubber losses in natural
rubber latex concentrate processing will contribute more load more on the wastewater
system.
Impact on environment of the natural rubber latex concentrate processing is calculated
using the Eco-Indicator 99 method. A similar trend of impact to the environment in
latex concentrate processing was shown by both factories. Fossil fuel is very dominant
in impact categories and has the highest percentage value followed by respiratory in-
organics, climate change and ecotoxicity. Ammonia which is used as preservative
during the process is a very important compound to avoid latex coagulation, but at the
same time it is a volatile compound. Based on the impact categories as in section 4.6
ammonia is the chemical that contribute the most impact.
In block skim rubber processing, fossil fuel gives the highest impact, followed by
respiratory in-organics, carcinogens and climate change, and plastic packaging.
Based on research conducted, Factory A contribute higher environmental impact than
Factory B for latex concentrate processing and block skim rubber processing. Damage
to resources is very high and is dominated by fossil fuel.
Ammonia gives the highest impact in latex concentrate processing (92.7%) for Factory
A with total impact of 30.998 Pt and for Factory B is 98.8% with total impact of 22.675
Pt.
163
The highest impact in block skim rubber processing for Factory A is caused by formic
acid at 46.5% and plastic at 40.5% with total impact of 5.483 Pt, while for Factory B is
caused by plastic at 64.5%, sulfuric acid at 27.6% with total impact of 3.439 Pt.
Excess ammonia will result in sequential impact, where ammonia itself cause air
emission and wastewater pollution. The acid consumption to coagulate skim latex
becomes higher, because the acid will be used to neutralize the excess ammonia. Higher
acid consumption will cause difficulty for the rubber in skim latex to coagulate and as
a result amount of suspended solid becomes high. Therefore ammonia must be in a
minimum level before entering the coagulation pond to avoid acid excess.
For eco-efficiency measurement, 8 impact categories were chosen from 11 impact
categories as the most influential impacts which cause environmental damage from
latex concentrate processing and block skim rubber processing. It appears that damage
to resource provides the smallest eco-efficiency in natural rubber latex concentrate
processing for both factories followed by human health. Therefore there is a need to
manage the resource and human health in order to improve the eco-efficiency.
Eco-Efficiency Indicator is determined by three factors: waste intensity, energy
intensity and water intensity. Waste intensity influences the amount of wastewater
parameters, such as BOD5, COD, TSS, Total-N and NH3N (ammonia total).Waste
intensity is almost the same for both factories.
Based on eco-efficiency indicator, water intensity for Factory A for latex concentrate
processing and block skim rubber processing is greater than Factory B. Therefore
factory B is found to be more eco-efficient in water consumption.
164
As for energy intensity, Factory A has greater energy intensity compared to Factory B
both for latex concentrate processing and block skim rubber processing. Factory A give
greater emissions compared to Factory B. This indicates that factory B is more eco-
efficient in energy consumption.
5.2 Recommendations
In this study, some suggestions are proposed to increase the eco-efficiency in natural
rubber latex concentrate processing:
1. Proper usage of ammonia should be investigated so that the amount used is not
excessive, and in accordance with its function as a preservative and it should not
affect on the coagulation process.
2. Proper usage of acid as coagulant use during skim latex coagulation should be
investigated, so that loading on the wastewater treatment should be reduced if
not eliminated due to acid content in the effluent. Consideration should be given
to the process that does not use acid as coagulant for the coagulation process.
3. There is a need to calculate impacts to environment arising from usage of
equipment elaborate more such as centrifuge, sedimentation tank, mixer,
storage tank and any other equipment.
4. Impact to environment of some chemicals such as lauric acid, ammonium laurate
and tetramethylthiuram disulphide in this study is unknown. This material
should be entered into a data inventory in latex concentrate processing.
5. This study only covers the processes in the plant. Further study studies need to
include transport from plantation to the factory and from factory to consumer.

165
References
ADB. (2008). Toward Resource-Efficient Economies in Asia and The Pacific. Manila:
Institute For Global Environmental Strategies (IGES).
Ahmad, I. (1983). Improved anaerobic digestion of rubber effluent using the upflow
anaerobic filter. Paper presented at the Rubber Research Institute of Malaysia
Planters Conference, Malaysia, Kuala Lumpur.
Alibaba. (2012). Price of crumb rubber/epdm chips/crumb rubber granule, 2012, from
http://www.alibaba.com/product-
gs/713057870/Price_of_crumb_rubber_epdm_chips.html?s=p
Amemiya, T., Ryuji, M., & Yoshikuni, Y. (2008). LCA and Eco-efficiency Study of
Automobile Shredder Residue Recycling Process. Paper presented at the The
Eight International Conference on EcoBalance, Tokyo.
Amir, A. S. (2012). Penurunan Produksi, 2013, from
http://www.karetalam.com/article/prod2012jan
Anas, A. (2007). Teknologi Pengendalian Mutu Lateks Kebun dan Proses
Pengolahannya. Medan: Balai Penelitian Sungei Putih, Pusat Penelitian Karet
.
Arismunandar, W. (1983). Motor Diesel Putaran Tinggi. Jakarta: Pradnya Paramita
.
Asia, I. O., & Akporhoner, E.E. (2007). Characterization and physicochemical treatment
of wastewater from rubber processing factory. International Journal of Physical
Science, 2(3), 061-067.
Asiamaya. (2012). Sumatera, 2012, from http://asiamaya.com/peta/sumatera.htm
Asif, M., Muneer, T., & Kelley, R. (2007). Life cycle assessment: A case study of a
dwelling home in Scotland. Building and Environment, 42(3), 1391-1394.
Atagana, H. I., Ejechi, B. O., & Ayilumo, A. M. (1999). Fungi Associated with
Degradation of Wastes from Rubber Processing Industry. Environmental
Monitoring and Assessment, 55(3), 401-408.
Baayen, H. (2000). Eco-indicator 99 Manual for Designers: Ministry of Housing,
Spatial Planning and the Environment, Director Industry- and Consumer.
Keputusan Kepala Badan Pengendalian Dampak Lingkungan No:Kep-
205/Bapedal/07/1996 tentang Pedoman Teknis Pengendalian Pencemaran Udara
Sumber tidak Bergerak (1996).
BAPPENAS. (2010). Development of Nation Policy on Eco-efficiency Water
Management in Indonesia. Bangkok: BAPPENAS.

166
Benedetto, L. D., & Klemes, J. (2009). The Environmental Performance Strategy Map :
an integrated LCA approach to support the strategic decision-making process.
Journal of Cleaner Production, 17, 900-906.
BF. (2012). The Selected Land for Rubber Planting, 2012, from http://benefits-
rubber.blogspot.com/2012/02/selected-land-for-rubber-planting.html
Bleischwitz, R. (2002). Cognitive and institutional perspectives of eco-efficiency.
Wuppertal Papers(123), 1-26.
Braungart, M., McDonough, W., & Bollinger, A. (2007). Cradle-to-cradle design:
creating healthy emissions – a strategy for eco-effective product and system
design. Journal of Cleaner Production, 15(13-14), 1337-1348. doi:
10.1016/j.jclepro.2006.08.003
Canada, G. o. (2002). Eco-Efficiency : Good Business Sense. In I. Canada (Ed.).
Canada: Industry Canada.
Cecil, J., & Mitchell, P. (2003). Processing of Natural Rubber, FAO (AGST)
Consultants: Ecoport version by Peter Griffee, FAO.
Chemicalland21. (2013). Tetramethylthiuram disulfide Retrieved 21 December, 2013,
from
http://www.chemicalland21.com/specialtychem/perchem/TETRAMETHYLTHI
URAM%20DISULFIDE.htm
Clark, K. (2005). For Customers, Shoppers, and Users, It's Kimberly-Clark.
Danwanichakul, P., Lertsurasakda, P., & Wiwattanasit, R. (2011). Correlation between
Dry Rubber Content in Field Latex and Vixcosity Measured with Efflux Time
Method. TIChE International Conference, 34(5), 551-555.
Das, T. K. (2005). Toward zero discharge: innovative methodology and technologies
for process pollution prevention. New Jersey: John Wiley & Sons, Inc.
Dephut. (2002). Data dan Informasi Kehutanan Propinsi Sumatera Utara, 2012, from
http://www.dephut.go.id/INFORMASI/INFPROP/Infsumut.pdf
DIW. (2001). Industrial Sector Code of Practice for Pollution Prevention (Cleaner
Technology), Department of Industrial Work. Ministry of Industry.
Dunning, P. (2004). "Eco-efficiency Indicator Handbook" for Products. Japan: Japan
Environmental Management Association for Industry (JEMAI).
EC. (2008). European Platform on Life Cycle Assessment (LCA): European
Commission.
EPA. (2005). State Of Environment Report 2004. Ghana: Environmental Protection
Agency.

167
EPA. (2007, 11 January). Cleaner production Save money, protect the environment
2008, from [email protected]
EPA. (2012). Product Stewardship, 2012, from
http://www.epa.gov/epawaste/conserve/tools/stewardship/index.htm
FIFA. (2003). Eco Efficiency, from
http://www.fifa.asn.au/default.asp?V_DOC_ID=789
Finkbeiner, M., Inaba, A., Tan, R., Christiansen, K., & Kluppel, H-J. (2006). The New
International Standards for Life Cycle Assessment: ISO 14040 and ISO 14044
.
Ganeshan, R., & Harrison, T. P. (1995). An introduction to supply chain management.
Penn State University, USA.
GFN. (2012). Footprint Basics - Overview, Global Footprint Network Retrieved
February, 2012, from
http://www.footprintnetwork.org/en/index.php/GFN/page/footprint_basics_over
view/
Goedkoop, M., & Spriensma, R. (2001). The Eco-indicator 99 A damage oriented
method for Life Cycle Impact Assessment. In P. C. B. V (Ed.).
Goedkoop, M., Schryver, A., & Oele, M. (2008). Introduction to LCA with SimaPro 7:
Pre Consultants.
Group, F. (2010). Industry Market Research for Business Leaders, Strategiest, Desicion
Makers: China Reports Retrieved April 12th, 2011, from
http://www.freedoniagroup.com/brochure/25xx/2575smwe.pdf
Haris, U., Henry, P., Ary, A. A., & Dadi, R. M. (2010). The Economic Potential of Skim
Latex Processing on The Latex Concentrate Industry : Indonesian Case. Bogor
Research Centre For Rubber Technology, Indonesian Rubber Research Institute
Hartoyo, D. (2013). Raising Rubber Plant, from
http://htysite.blogspot.com/2013/02/raising-rubber-plant.html
Henrik, N. (2006). Strategic Life-Cycle Modeling for Sustainable Product Development.
Master, Blekinge Institute of Technology, Sweden. (Licentiate Dissertation
Series No. 2006:08)
Ho, C. C., & Ng. W. L. (1979). Surface study on the rubber particles in pretreated
Hevea latex system. Colloid and Polymer Science, 257(4), 406-412.
INR. (2012). Centrifuged Latex of 60% of Dry Rubber Content (CENEX) Retrieved 4
February, 2012, from http://www.indiannaturalrubber.com
IRSG. (2012). Global Rubber Demand Forecast To Reach 27.2 Million Metric Tons In
2012, International Rubber Study Group from
http://www.rubberworld.com/RWmarket_report.asp?id=711
168
IRSG. (2013). Statictical Summary of World Rubber Situation 2013
ISO35. (2004). Natural rubber latex concentrate -Determination of mechanical stability
ISO 35 (5 (Monolingual) ed., pp. 4): ISO.
ISO126. (1982). Rubber latex, natural - Determination of dry rubber content. In ISO
(Ed.), ISO 126 (2 (Monolingual) ed.): ISO.
ISO127. (2012). Rubber, natural latex concentrate -Determination of KOH number ISO
127 (4 (Monolingual) ed., pp. 10): ISO.
ISO506. (1992). Rubber latex, natural, concentrate -Determination of volatile fatty acid
number ISO 506 (3 (Monolingual) ed., pp. 4): ISO.
ISO14040. (2006). Environmental management -Life cycle assessment -Principles and
framework ISO 14040 (pp. 20): ISO.
ISO14044. (2006). Environmental management – Life cycle assessment –Requirements
and guidelines ISO 14044 (1 (Monolingual) ed., pp. 46): ISO.
ISO19011. (2002). Guidelines for quality and/or environmental management systems
auditing. ISO 19011 1 (Monolingual) from
http://www.iso.org/iso/home/store/catalogue_ics/catalogue_detail_ics.htm?csnu
mber=31169
IZA. (2011). Zinc Oxide Properties, International Zinc Association Retrieved 21
December, 2013, from http://www.zinc.org/info/zinc_oxide_properties
Jawjit, W., Pavasant, P., & Kroeze, C (2013). Evaluating environmental performance of
concentrated latex production in Thailand. Journal of Cleaner Production, xxx,
1-8. doi: 10.1016/j.jclepro.2013.11.016
Jawjit, W., Praser, P., & Carolien, K. (2012). Evaluating Environmental Performance of
Concentrated Latex Production in Thailand. Paper presented at the The 18th
Greening of Industry Network Conference, Sweden.
Jayachandran, K., Suresh, P. V., & Chandrasekaran, M. (1994). A novel Acinetobacter
sp for treating highly acidic rubber latex centrifugation effluent. Biotechnology
Letter, 16(6), 649-654. doi: 10.1007/BF00128616
JEMAI. (2004). Eco-efficiency indicator handbook for products Retrieved from
http://www.jemai.or.jp/JEMAI_DYNAMIC/data/current/detailobj-2003-
attachment.pdf
John, S., Issac, J. M., & Joseph, R. (2011). Mechanical Properties of Natural Rubber
Latex Coagulated by a Novel Coagulant-Yeast. International Journal of
Advanced Engineering Sciences and Technologies, 8(2), 177-178.
JSDA. (2010). Eco–efficiency dan Diskusi Kebijakan Infrastruktur Air di Indonesia,
from http://jsdaindonesia.org/

169
Kaebernick, H., Kara, S., & Sun, M. (2003). Sustainable Product Development and
Manufacturing by Considering Environmental Requirements”, Robotics and
Computer. Integrated Manufacturing Journal, 19(6), 461-468.
Kharel, G. P., & Charmondusit, K. (2008). Eco-efficiency evaluation of iron rod
industry in Nepal. Journal of Cleaner Production, 16(3), 1379-1387.
Khasreen, M., Banfill, P., Menzies, G. (2009). Life-Cycle Assessment and the
Environmental Impact of Buildings: A Review. Sustainability, 1, 674-701. doi:
10.3390/su1030674
Klemes, J. J., & Cucek, L. (2013) LCA and Environmental Footprints as Assessment
Tool. Kuala Lumpur.
Keputusan Menteri Lingkungan Hidup No. 51 Tahun 1995 tentang Baku Mutu Limbah
Cair Bagi Kegiatan Industri (1995a).
Ministry of Environmental Republic of Indonesia, Keputusan Menteri Negara
Lingkungan Hidup No 13 tahun 1995 tentang Baku Mutu Emisi Sumber Tidak
Bergerak (1995b).
Leong S.T.; Muttamara S.; Laortanakul, P. (2003). Reutilization of wastewater in a
rubber-based processing factory: a case study in Southern Thailand. Resources,
Conservation and Recycling, 37(2), 159-172.
Mahat, M. S., & MacRae, I. C. (1992). Rhizopus oligosporus grown on natural rubber
waste serum for production of single cell protein: a preliminary study. World
Journal of Microbiology and Biotechnology, 8(1), 63-64. doi:
10.1007/bf01200687
Maxime, D., Marcotte, M., & Arcand, Y. (2006). Development of eco-efficiency
indicators for the Canadian food and beverage industry. Journal of Cleaner
Production, 14(6-7), 636-648.
Mestre, A., & Vogtlander, J. (2013). Eco-efficient value creation of cork products: an
LCA-based method for design intervention. Journal of Cleaner Production, 57,
101-114. doi: 10.1016/j.clepro.2013.04.023
Mohammadi, M., et al. (2010). Treatment of wastewater from rubber industry in
Malaysia. African Journal of Biotechnology, 9(38), 6233-6243.
MRB. (2012). Natural Rubber Market Review. Retrieved from
http://www3.lgm.gov.my/digest/digest/digest-11-2012.pdf
Nguyen, H. N., & Luong, T. T. (2012). Situation of wastewater treatment of natural
rubber latex processing in the Southeastern region, Vietnam. Journal of
Vietnamese Environment, 2(2), 58-64.
NHT. (2000). Public Environmental Reporting -An Australian Approach, Natural
Heritage Trust Australia: Natural Heritage Trust.

170
NRTEE. (2001). Eco-efficiency Indicators. Canada: Renouf Publishing Co. Ltd.
OSHA. (2013). Ammonia Refrigeration. Properties of Ammonia. Retrieved from
www.osha.gov website:
PSA. (2006). Guidelines-For the Preparation of a Public Environmental Report for the
Upgrading and expasion of a foundry at Cromwell Road, Kilburn. South
Australia: Planning SA-Primary Industry and Resources SA.
Rahman, N., & Haris, U. (2009). Rubber Downstream Industry Development in
Indonesia:Current Status, Opportunities and Challenges. Bogor: Indonesian
Rubber Research Institute.
Rattanapan, C., Suksaroj, T. T., Ounsaneha, W. (2012). Development of Eco-efficiency
Indicators for Rubber Glove Product by Material Flow Analysis. Procedia-
Social and Behavioral Sciences, 40. doi: 10.1016/j.sbspro.2012.03.167
RBI. (2006). Latex Preservation and Concentration,Rubber Board India. Retrieved from
http://rubberboard.org.in/ManageCultuvation.asp?id=192
Reno, M., Lora., E., Palacio, J., Venturini, O., Buchgeister, J., & Almazan, O. (2010). A
LCA (life cycle assessment) of the methanol production from sugarcane
bagasse. Energy, 139, 91-99. doi: 10.1016/j.energy.2010.12.010
Environmental Quality Act 1974 (2006).
Roberson, J. (2012). Plantation Establishment. Thailand: Ban Dung Life.
Rungruang, N., & Babel, N. (2008). Treatment of Natural Rubber Processing
Wastewater by Combination of Ozonation and Activated Sludge Process. Paper
presented at the International Conference on Environmental Research and
Technology, Parkroyal Penang, Malaysia.
Said, E., G. (2002). Eco-Efficiency Initiatives In The Agroindustry Sector And The
Implementation Of Factor-Four Principles. 4th APRCP.
Saidur, R. M., S. (2010). Energy use, energy savings and emission analysis in the
Malaysian rubber producing industries. Applied Energy, 87(8), 2746-2758.
Shifhit, H. (2012). Perbedaan Karet Alam dan Karet Sintetis Retrieved 10 February,
2012, from http://budidayareviewkaret.blogspot.com/2012/03/perbedaan-karet-
alam-dan-karet-sintetis.html
Sinkin, C., Wright, C. K., & Burnett, R. D. (2008). Eco-efficiency and firm value.
Journal of Accounting and Public Policy, 27, 167-176.
Swadaya, T. P. P. (2008). Panduan Lengkap Karet
Taeko, A., Kurihara, S., Takahashi, T., Hirano, N., Horii, YU., & Nakaniwa, C. (2004).
"Eco-efficiency Indicator Handbook" for product.

171
Tahara, K., Sagisaka, M., Ozawa, T., Yamaguchi, K., & Inaba, A. (2005). Comparison
"of CO2 efficiency" between company and industry. Journal of Cleaner
Production, 13, 1301-1308.
Tamikawa, D., Yamashita, T., Hatamoto, M., Fukuda, M., Takahashi, M., & Syutsubo,
K., et al. . (2012). Development of an Appropriate Treatment Process for
Wastewater from a Natural Rubber Processing Factory. Transactions on
GIGAKU 1, 01010, 1-8.
Technology, T. (2009). Energy efficiency in rubber processing Practical worksheets for
industry, from http://www.tangram.co.uk/
Teijin. (2012). Eco footprint and eco-efficiency Retrieved 5 January, 2013, from
http://www.teijinaramid.com/sustainability/eco-footprint/
Tekasakul, P., Tekasakul, S. (2006). Environmental Problemn Related to Natural
Rubber Production in Thailand. Journal of Aerosol Science, 21(2), 122-129.
Thaitex. (2012). Natural Latex, 2012, from
http://www.thaitexgroup.com/rubber_latex/latex_specification
UNEP. (2004). Eco-efficiency for the Dairy Processing Industry. Sydney: The UNEP
Working Group for Cleaner Production in the Food Industry.
UNEP. (2011). Towards a Life Cycle Sustainability Assessment: Making informed
choices on products (pp. 86).
Unilever. (2012). Reducing water use in manufacturing Retrieved 27 July, 2012, from
http://www.unilever.com/sustainable-
living/water/reducingwateruseinmanufacturing/
University, P. (2013). Formic Acid. Retrieved from
http://www.princeton.edu/~achaney/tmve/wiki100k/docs/Formic_acid.html
USEPA. (2012). Environmental Management Systems (EMS. Retrieved from
http://www.epa.gov/agriculture/tems.html#What%20is%20an%20Environmenta
l%20Management%20System?
Uson, A., Capilla, A., Bribian, I., & Scarpellini, S. (2011). Energy efficiency in
transport and mobility from an eco-efficiency viewpoint. Energy, 36, 1916-
1923. doi: 10.1016/j.energy.2010.05.002
Utomo, T. P., Hasanudin, U., & Suroso, E. (2010). Comparative Study of Low and
High-Grade Crumb Rubber Processing Energy. Lecture Notes in Engineering
and Computer Science, 2185(1), 2449-2453.
van Berkel, R. (2002). Application of life cycle assessment for imrpoving the eco-
efficiency of suppy chains. Paper presented at the The Muresk 75th
Anniversary
Conference, Perth.

172
van Berkel, R. (2007). Cleaner production and eco-efficiency initiatives in Western
Australia 1996-2004. Journal of Cleaner Production, 15(8-9), 741-755.
Van, H., et al. (2007). Waste Abatement And Management In Natural Rubber
Processing Sector: Asian Institute of Technology School of Environment,
Resources and Development, Bangkok.
Varžinskas, V., Staniškis, J., & Lebedys, A. (2009). Life Cycle Assessment of Common
Plastic Packaging for Reducing Environmental Impact and Material
Consumption. Environmental Research, Engineering and Management, 4(50),
P. 57 - 65, 4(50), 9. doi: 10.1065/Ica2003.02.106
Verfaillie, H. A., Bidwell, R. (2000). Measuring Eco-efficiency:a guide to reporting
company performance: World Business Council for Sustainable Development
(WBSCD).
WBSCD. (2000). Eco-efficiency. Switzerland: World Business Council for Sustainable
Development (WBSCD)
White, J., De, S.K. (2001). Rubber Technologist’s Handbook (Vol. 1). Shawbury, UK:
Smithers Information Ltd.
Yusoff, S. (2005). Feasibility of Life Cycle Management for Improved Environmental
Management-Case Study on Malaysian Palm Oil Industry. Ph.D, University
Malaya, Malaysia.
Zhang, N., Smith, R., Bulatov, I., & Klemes, J. (2013). Sustaining high energy
efficiency in existing processes with advanced process integration technology.
Applied Energy, 101, 26-32.

173
APPENDIX A
Publication by Author
1. 2nd International Conference on Environmental Research and Technology
(ICERT). , 2-4 June, 2010, Penang, Malaysia, Impacts of Climate Change on
Natural Resources: Case in Latex Concentrate Processing.
Seri Maulina1*, Nik Meriam Nik Sulaiman
1, Noor Zalina Mahmood
2
2. 4th
Environmental Physics Conference, Hurgada, Egypt, Eco-Efficiency
Analysis: Creating more values with less impact in latex concentrate
processing, 10-14 March 2010, Hurgada, Egypt.
Seri Maulina1*, Nik Meriam Nik Sulaiman
1, Noor Zalina Mahmood
2
3. Sriwijaya International Seminar on Energy Science and Technology 2009, Eco-
efficiency indicators in latex concentrate processing: energy intensity,
Universitas Sriwijaya Kampus Bukit Besar Palembang. UNSRI, Indonesia, 14 –
15 Oktober 2009.
Seri Maulina
4. Chemeca 2009 Conference, Burswood Entertainment Complex, Perth, Australia,
Life Cycle Assessment and Eco-Efficiency: case in latex concentrate processing,
27-30 September 2009
Seri Maulina1*, Nik Meriam Nik Sulaiman
1, Noor Zalina
2
5. The 8th International Conference on Eco Balance, Tokyo, Life Cycle Impact
Assessment of different usage of Latex Concentrate Processing: Rubber Thread,
Rubber Export, Rubber Glove, 9-12 December 2008,
Seri Maulina1*, Nik Meriam Nik Sulaiman
1, Noor Zalina
2
6. 15th Regional Symposium on Chemical Engineering (RSCE) in conjunction
with the 22nd Symposium of Malaysian Chemical Engineers (SOMCHE),
Comparison life cycle impact assessment of block skim rubber production by
using different coagulant, 2-3 December 2008, Kuala Lumpur
7. International Symposium on Environmental Management: Hazardous-
Environmental Management Toward Sustainability, Life cycle impact
assessment of block skim rubber from natural rubber, 22-23 September 2008,
Royal Hill Resort & Spa Nakorn Nayok , Thailand.
Seri Maulina1*, Nik Meriam Nik Sulaiman
1, Noor Zalina
2
8. Third Regional Symposium on Environment and Natural Resources (RSENR3):
Life Cycle Impact Assessment of Latex Concentrate from Natural Rubber, 5-6
Agust 2008, Kuala Lumpur.
9. Submission writing to International Journal of Engineering Research and
Technology. Title: Overview source of impact to environment in natural rubber
latex concentrate processing using LCA as a tool.
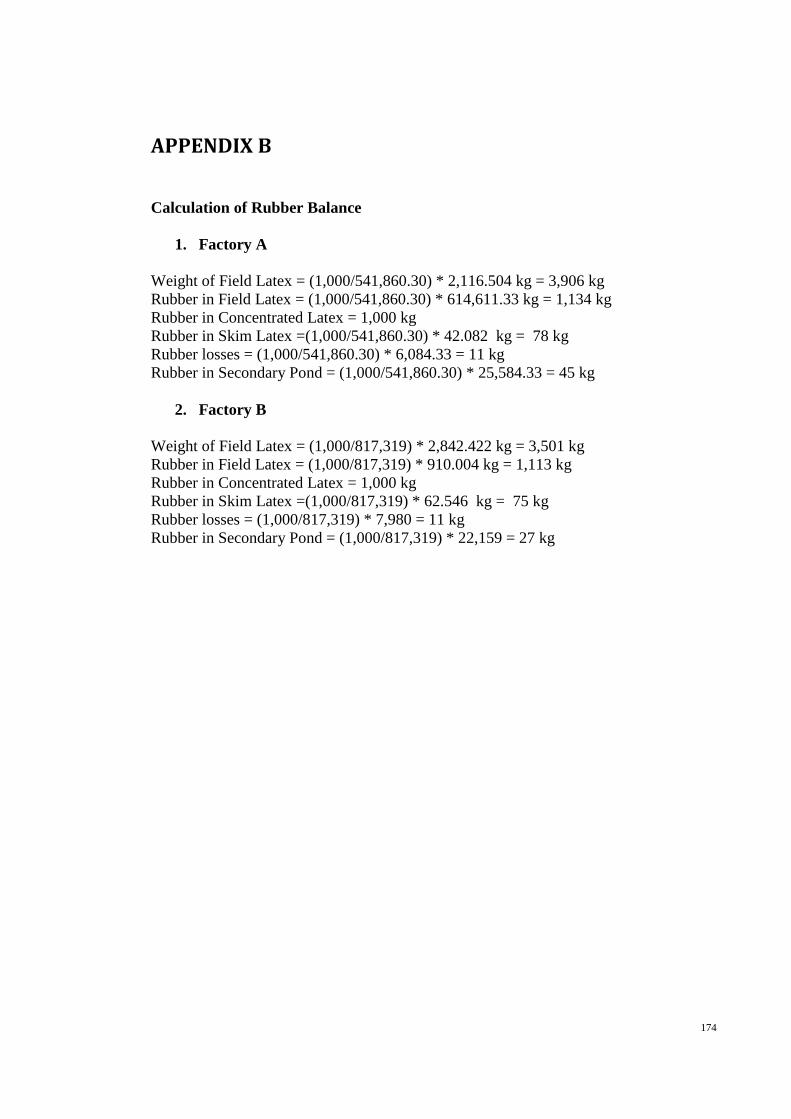
174
APPENDIX B
Calculation of Rubber Balance
1. Factory A
Weight of Field Latex = (1,000/541,860.30) * 2,116.504 kg = 3,906 kg
Rubber in Field Latex = (1,000/541,860.30) * 614,611.33 kg = 1,134 kg
Rubber in Concentrated Latex = 1,000 kg
Rubber in Skim Latex =(1,000/541,860.30) * 42.082 kg = 78 kg
Rubber losses = (1,000/541,860.30) * 6,084.33 = 11 kg
Rubber in Secondary Pond = (1,000/541,860.30) * 25,584.33 = 45 kg
2. Factory B
Weight of Field Latex = (1,000/817,319) * 2,842.422 kg = 3,501 kg
Rubber in Field Latex = (1,000/817,319) * 910.004 kg = 1,113 kg
Rubber in Concentrated Latex = 1,000 kg
Rubber in Skim Latex =(1,000/817,319) * 62.546 kg = 75 kg
Rubber losses = (1,000/817,319) * 7,980 = 11 kg
Rubber in Secondary Pond = (1,000/817,319) * 22,159 = 27 kg
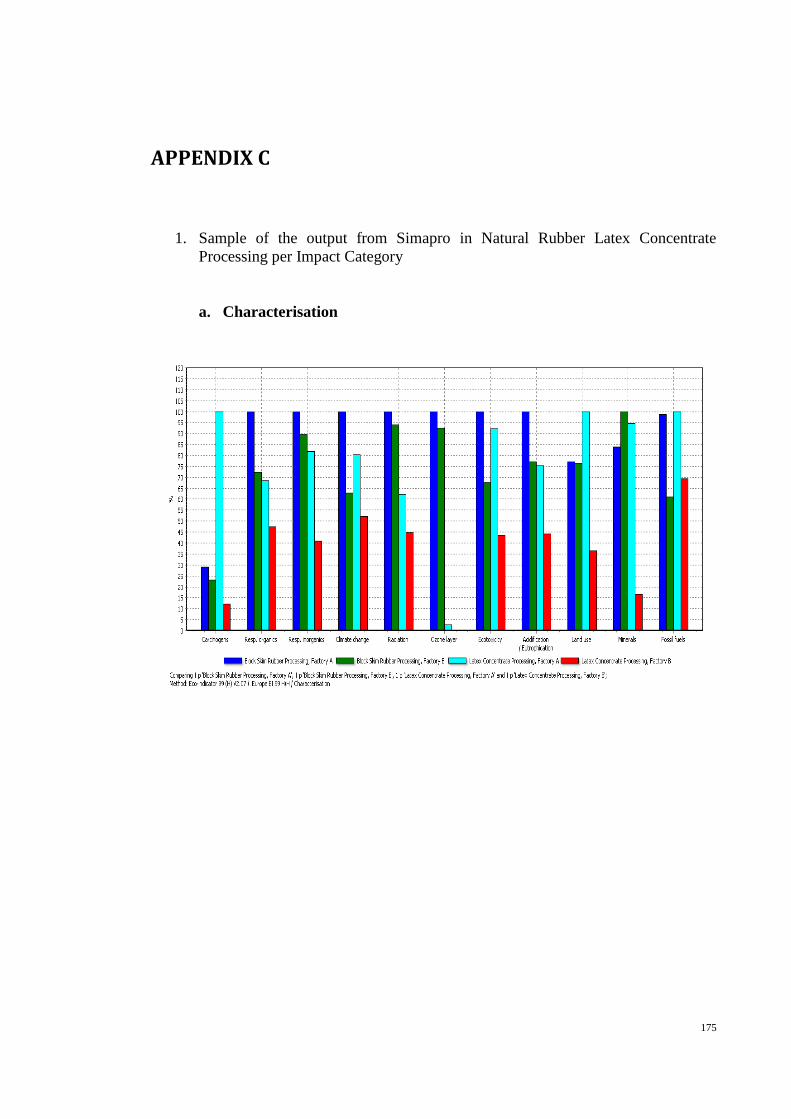
175
APPENDIX C
1. Sample of the output from Simapro in Natural Rubber Latex Concentrate
Processing per Impact Category
a. Characterisation

176
b. Normalisation
c. Weighting

177
2. Sample of the output from Simapro in Natural Rubber Latex Concentrate
Processing base on damage
a. Damage Assessment
b. Normalisation of Damage Assessment

178
c. Weighting of Damage Assessment