Enhanced Radar Backscattering due to Oriented Ice Particles at 95 ...
16
Enhanced Radar Backscattering due to Oriented Ice Particles at 95 GHz during StormVEx ROGER MARCHAND Department of Atmospheric Sciences, University of Washington, Seattle, Washington GERALD G. MACE Department of Atmospheric Sciences, University of Utah, Salt Lake City, Utah A. GANNET HALLAR AND IAN B. MCCUBBIN Division of Atmospheric Sciences, Desert Research Institute, Reno, Nevada, and Storm Peak Laboratory, Steamboat Springs, Colorado SERGEY Y. MATROSOV AND MATTHEW D. SHUPE Cooperative Institute for Research in Environmental Sciences, University of Colorado Boulder, and NOAA/Earth System Research Laboratory, Boulder, Colorado (Manuscript received 20 December 2012, in final form 13 April 2013) ABSTRACT Nonspherical atmospheric ice particles can enhance radar backscattering and attenuation above that expected from spheres of the same mass. An analysis of scanning 95-GHz radar data collected during the Storm Peak Laboratory Cloud Property Validation Experiment (StormVEx) shows that at a least a small amount of enhanced backscattering was present in most radar scans, with a median enhancement of 2.4 dB at zenith. This enhancement will cause an error (bias) in ice water content (IWC) retrievals that neglect particle orientation, with a value of 2.4 dB being roughly equivalent to a relative error in IWC of 43%. Of the radar scans examined, 25% had a zenith-enhanced backscattering exceeding 3.5 dB (equivalent to a relative error in IWC in excess of 67%) and 10% of the scans had a zenith-enhanced backscattering exceeding 6.4 dB (equivalent to a relative error in IWC in excess of 150%). Cloud particle images indicate that large en- hancement typically occurred when planar crystals (e.g., plates and dendrites) were present, with the largest enhancement occurring when large planar crystals were falling out of a supercooled liquid-water layer. More modest enhancement was sometimes due to planar crystals, but it was also sometimes likely a result of horizontally oriented nonspherical irregularly shaped particles. The analysis also shows there is a strong correlation (about 20.79) between the change in slant 458 depolarization ratio with radar scan elevation angle and the magnitude of the zenith-enhanced backscattering, suggesting that measurements of the slant de- polarization ratio can be used to improve radar-based cloud microphysical property retrievals. 1. Introduction It has long been known that nonspherical atmospheric ice particles can increase or enhance radar backscat- tering and attenuation above that expected from spheres of the same mass, even when the particles are small compared with the radar wavelength (e.g., Atlas et al. 1953). This is particularly true when nonspherical ice particles are oriented such that their largest dimension is perpendicular to the radar beam. Because of aero- dynamic effects, both planar ice crystals (such as plates and dendrites) and columnar crystals tend to fall with their larger dimension near horizontal. As a result, re- flectivity measurements from near-zenith-pointing ground- based radars and near-nadir-pointing spaceborne radars are potentially prone to being affected by ice crystal orientation. This includes the National Aeronautics Corresponding author address: Roger Marchand, Department of Atmospheric Sciences, University of Washington, 408 ATG Building, Seattle, WA 98195-1640. E-mail: [email protected] 2336 JOURNAL OF ATMOSPHERIC AND OCEANIC TECHNOLOGY VOLUME 30 DOI: 10.1175/JTECH-D-13-00005.1 Ó 2013 American Meteorological Society
Transcript of Enhanced Radar Backscattering due to Oriented Ice Particles at 95 ...

Enhanced Radar Backscattering due to Oriented Ice Particles at 95GHzduring StormVEx
ROGER MARCHAND
Department of Atmospheric Sciences, University of Washington, Seattle, Washington
GERALD G. MACE
Department of Atmospheric Sciences, University of Utah, Salt Lake City, Utah
A. GANNET HALLAR AND IAN B. MCCUBBIN
Division of Atmospheric Sciences, Desert Research Institute, Reno, Nevada, and Storm Peak Laboratory,
Steamboat Springs, Colorado
SERGEY Y. MATROSOV AND MATTHEW D. SHUPE
Cooperative Institute for Research in Environmental Sciences, University of Colorado Boulder,
and NOAA/Earth System Research Laboratory, Boulder, Colorado
(Manuscript received 20 December 2012, in final form 13 April 2013)
ABSTRACT
Nonspherical atmospheric ice particles can enhance radar backscattering and attenuation above that
expected from spheres of the same mass. An analysis of scanning 95-GHz radar data collected during the
Storm Peak Laboratory Cloud Property Validation Experiment (StormVEx) shows that at a least a small
amount of enhanced backscattering was present in most radar scans, with a median enhancement of 2.4 dB at
zenith. This enhancement will cause an error (bias) in ice water content (IWC) retrievals that neglect particle
orientation, with a value of 2.4 dB being roughly equivalent to a relative error in IWC of 43%. Of the radar
scans examined, 25%had a zenith-enhanced backscattering exceeding 3.5 dB (equivalent to a relative error in
IWC in excess of 67%) and 10% of the scans had a zenith-enhanced backscattering exceeding 6.4 dB
(equivalent to a relative error in IWC in excess of 150%). Cloud particle images indicate that large en-
hancement typically occurred when planar crystals (e.g., plates and dendrites) were present, with the largest
enhancement occurring when large planar crystals were falling out of a supercooled liquid-water layer. More
modest enhancement was sometimes due to planar crystals, but it was also sometimes likely a result of
horizontally oriented nonspherical irregularly shaped particles. The analysis also shows there is a strong
correlation (about20.79) between the change in slant 458 depolarization ratio with radar scan elevation angleand the magnitude of the zenith-enhanced backscattering, suggesting that measurements of the slant de-
polarization ratio can be used to improve radar-based cloud microphysical property retrievals.
1. Introduction
It has long been known that nonspherical atmospheric
ice particles can increase or enhance radar backscat-
tering and attenuation above that expected from spheres
of the same mass, even when the particles are small
compared with the radar wavelength (e.g., Atlas et al.
1953). This is particularly true when nonspherical ice
particles are oriented such that their largest dimension
is perpendicular to the radar beam. Because of aero-
dynamic effects, both planar ice crystals (such as plates
and dendrites) and columnar crystals tend to fall with
their larger dimension near horizontal. As a result, re-
flectivity measurements from near-zenith-pointing ground-
based radars and near-nadir-pointing spaceborne radars
are potentially prone to being affected by ice crystal
orientation. This includes the National Aeronautics
Corresponding author address: Roger Marchand, Department
of Atmospheric Sciences, University of Washington, 408 ATG
Building, Seattle, WA 98195-1640.
E-mail: [email protected]
2336 JOURNAL OF ATMOSPHER IC AND OCEAN IC TECHNOLOGY VOLUME 30
DOI: 10.1175/JTECH-D-13-00005.1
� 2013 American Meteorological Society

and Space Administration (NASA) CloudSat radar
(Stephens et al. 2008) and the ground-based radars that
have been deployed for many years by the U.S. De-
partment of Energy (DOE) Atmospheric Radiation
Measurement Program (ARM; e.g., Clothiaux et al.
2000), among others. Enhanced backscattering for ze-
nith and near-nadir-pointing radars (relative to what
would be expected for spheres of the same mass or rel-
ative to off-nadir viewing) tends to increase with the size
of the cloud particles and with the radar frequency, but
non-Rayleigh scattering effects are important at 95GHz
and higher frequencies, as ice particles often reach sizes
that are not small compared to the radar wavelength at
these frequencies. Electromagnetic modeling of scat-
tering at 95GHz with the discrete dipole approximation
by Okamoto (2002) indicates that for small particles
(effective radius , 100mm), the effect of plate and col-
umn orientation on radar (copolar) reflectivity is less
than 2 dB, but for larger particles differences can be as
large as 8 dB.
In spite of this potentially large enhancement in radar
reflectivity, few cloud microphysical retrievals using
95-GHz radar reflectivity data have taken ice particle
orientation into consideration, and instead generally
treat ice particles as spheres or randomly oriented ice
crystals. Exceptions include the experimental retrieval
of ice water content byMatrosov andHeymsfield (2008)
and the variational radar–lidar ice cloud (VarCloud)
retrieval created by Delanoe and Hogan (2010) and
extended by Stein et al. (2011). These retrievals assume
horizontally aligned oblate spheroids with a fixed axial
ratio of 0.6 for ice cloud particles. These authors found
that using a spheroidal assumption in the same retrieval
produces a retrieved ice water content that is reduced by
on average 50% in clouds with a reflectivity factor larger
than 0 dBZ.
There are at least two reasons why the effect of ori-
ented ice crystals is not commonly incorporated into
radar-based retrievals. One is that while planar crystals
are at times found in aircraft in situ observations, many
clouds appear to contain few such crystals, especially
midlatitude clouds with temperatures below 2208C(Korolev et al. 2000; Heymsfield 2003). Korolev et al.
analyzed in situ observations of particles with maximum
dimensions greater than 125mm in size, from several
aircraft flights. These authors found that while the max-
imum frequency of occurrence of dendrites ismuch larger
at temperatures above2208C than below2208C, even at
warmer temperatures the majority of cases showed no
dendrites at all. Rather, they found the dominant ice
particle habit to be irregular particles and that dendritic
ice particles tend to occur in isolated cells embedded in
zones of irregularly shaped ice particles. In such cells the
fraction of dendrites was often large and reached 100%.
Assuming oriented particles are present in a radar-based
retrievalwill result in equally large errors (underestimates)
of ice water content when they are not present.
On the other hand, the frequent presence of oriented
ice crystals has been inferred from ground-based (scan-
ning) lidar depolarization measurements (e.g., Sassen
and Benson 2001; Westbrook et al. 2010), in some air-
craft measurements in mixed-phase altocumulus (e.g.,
Carey et al. 2008; Hogan et al. 2003), in the analysis
of cloud-top visible wavelength polarized reflectances
(e.g., Chepfer et al. 1999; Noel and Chepfer 2004), and in
the analysis of NASA Cloud–Aerosol Lidar and In-
frared Pathfinder Satellite Observations (CALIPSO)
lidar depolarization observations of both ice and mixed-
phase clouds (Noel and Chepfer 2010; Sassen et al. 2012;
Zhou et al. 2012). The effect of specular reflection from
oriented crystals was sufficiently problematic for
CALIPSO ice cloud microphysical retrievals that the
lidar pointing was eventually changed from the original
0.38 off-nadir pointing to 38 off-nadir pointing, in order
to reduce greatly its occurrence and strength. The frac-
tion of particles responsible for causing this specular
reflection is not very large. Zhou et al. (2012) estimate
the fraction of such particles to range from 0% to 6% for
mixed-phase clouds and from 0% to 3% for ice clouds
with temperatures greater than 2358C. Though few in
number, if these crystals are large enough, then they
will nonetheless significantly increase or perhaps even
dominate the observed radar reflectivity.
A second reason the effect of oriented ice crystals is
not often incorporated into radar-based retrievals is
that few available remote sensing observations provide
a signal that is uniquely or predominantly a response to
particle orientation, and extracting information on ori-
entation generally requires simultaneously determining
the particle size and the particle shape to some degree.
The aforementioned lidar depolarization measure-
ments, for example, do contain information on particle
orientation. However, combining radar and lidar data
requires assumptions on how the shape and ratio of
oriented to nonoriented particles change with particle
size, because scattering at radar wavelengths is generally
much stronger from the larger particles in the particle
size distribution, while visible light (lidar) scatters effi-
ciently from small ice particles and is typically domi-
nated by the much more numerous small particles. In
spite of these difficulties, Okamoto et al. (2010) have
developed a CloudSat–CALIPSO radar–lidar retrieval
that uses the measured radar reflectivity, lidar back-
scatter, and lidar depolarization ratio in combination
with scattering models for horizontally oriented plates
(with an assumed aspect ratio of 3) and various sets of
OCTOBER 2013 MARCHAND ET AL . 2337

randomly oriented ice or ice spheres. These authors
found that this algorithm retrieves significantly larger
effective radius and smaller ice water content (at times
an order of magnitude different) than the same algo-
rithm when polarization data and horizontal plates are
not used. The largest errors typically occurred in the
temperature range between2208 and2108C, where theretrieved effective radius was greater than 200mm. Of
course, a combined lidar–radar approach is limited to
those cloudy regions where the lidar has not been heavily
attenuated, and it generally requires accounting for
multiple scattering where the lidar does penetrate.
While not measured by CloudSat, 95-GHz radar de-
polarization measurements have also seen some inves-
tigation of their potential to retrieve (or at least provide
constraints on) cloud ice particle type and orientation
(Aydin and Tang 1997; Matrosov et al. 2001; Reinking
et al. 2002; Aydin and Singh 2004), and this includes
combining radar observations of different depolar-
ization types (Matrosov et al. 2005). Nonetheless, we are
not aware of any operational algorithms (or even large
observational datasets) where retrieved ice particle
type and orientation are obtained from millimeter-
wavelength radar reflectivity and depolarization
measurements.
In this article, in situ cloudmicrophysical observations
and scanning 95-GHz (W band) polarimetric radar data,
gathered during the Storm Peak Laboratory Cloud
Property Validation Experiment (StormVEx), are used
to characterize the frequency and strength of enhanced
backscattering due to oriented ice crystals, as well as to
investigate the relationship between enhanced back-
scattering and slant linear 458 depolarization ratio
measurements. The main reason a slant linear configu-
ration was used during StormVEx is because slant linear
is expected to be less susceptible to small flutter in the
horizontal orientation of particles than the more tradi-
tional horizontal–vertical linear depolarization ratio
(LDR; Reinking et al. 2002). StormVEx was conducted
between November 2010 and April 2011 (Mace et al.
2010). Storm Peak Laboratory (SPL) is a mountain-top
station located near Steamboat Springs, Colorado. With
an altitude of 3220m, this station is frequently in cloud
during the winter months (Borys andWetzel 1997). One
of the primary achievements of this experiment was the
acquisition of a large collaborative dataset of remote
sensing data and in situ measurements in liquid, ice, and
mixed-phase clouds. During StormVEx, the U.S. DOE
ARM deployed a suite of remote sensing equipment
near SPL, and the extensive array of aerosol measure-
ment equipment normally operated at SPL (Hallar et al.
2011a,b) was expanded to include a variety of cloud
particle probes.
Previously, Matrosov et al. (2012) (the same authors
as the present study) published a case study analysis of
the radar slant linear depolarization ratio measured
during StormVEx. This article examines individual ca-
ses with rounded graupel, pristine dendrites, rimed
dendrites, and a mixture of graupel, dendrites, and col-
umns. The study shows that changes in the measured
slant depolarization ratio between zenith and off-zenith
angles are indicative either of planar or columnar ice
crystals. The present study extends this earlier work,
presenting a statistical analysis from thousands of radar
scans, as well as focusing on the effects of oriented
crystals on the (copolar) reflectivity. In section 2, the
technique used to identify and estimate the magnitude
of enhanced backscattering from the scanning radar
data is described, and in section 3 these data are ana-
lyzed in the context of the in situ cloud data gathered at
SPL. Section 4 provides additional discussion.
2. Scanning radar data
During StormVEx, the scanning W-band ARM cloud
radar (SWACR) was positioned approximately 2.4 km
southwest and just over 400m below SPL. The radar
rotated through a fixed sequence of modes, which in-
cludedmaking six range–height indicator (RHI) horizon-
to-horizon scans at six different azimuth angles, about
once each half-hour. Figures 1–3 each show examples
of the observed radar (copolar) reflectivity (top-left
panels) and depolarization ratio (top-right panels).
The depolarization ratio (DR) in decibels (dB) is de-
fined as
DR5 dB(Zcross-polar)2 dB(Zcopolar) , (1)
where dB(Z)5 10 log10(Z), Zcross-polar is the cross-polar
reflectivity factor, and Zco-polar is the copolar reflectivity
factor (both having units of mm6m23). During Storm-
VEx, the radar was configured to use slant linear 458depolarization as discussed by Matrosov et al. (2012).
Because attenuation by gases and small liquid drops is
the same at both polarizations, DR is unaffected by
these sources of attenuation as long as there is sufficient
signal-to-noise ratio in both measurements. The radar
data shown in these panels have been limited to those
regions where the signal exceeds the estimated radar
noise by 3 dB (approximately 235 dBZe at 1 km). The
copolar reflectivity in Fig. 1 shows a narrow column of
large reflectivity (values near 10 dBZe) directly above
the radar, with significantly smaller values on either side.
The large reflectivity values directly above the radar are
not because of some unusual cloud that just happened to
be centered over the radar at the time of this scan; this
2338 JOURNAL OF ATMOSPHER IC AND OCEAN IC TECHNOLOGY VOLUME 30

FIG. 1. Example of radar data showing large enhanced backscattering effect: (top left)
copolar 95-GHz scanning radar reflectivity; (top right) slant 458 DR; (middle left) radar
copolar reflectivity vs scan (elevation) angle for the region 0.5–1km above the radar (white
box shown in top left); and (middle right) DR vs elevation angle for the same region. Black
diamond shows location of SPL. Elevation angles away from zenith (elevation 5 908) arefarther from the radar and so are expected to show a reduction in reflectivity because of
increased path attenuation. Dashed lines show the fit of a simple model where radar re-
flectivity is only due to randomly oriented particles and path attenuation. The fit is de-
termined using the observed reflectivity at elevation angles of zenith and 358 (black line),
258–358 (light blue line), and 1458–1558 (red line). The poor fit of the black line to the
observations, as well as between black and colored lines, demonstrates that the change in
reflectivity with the scan angle is not because of path attenuation and that scattering from
oriented ice particles is important; see text. (bottom) Images of sample cloud particles taken
by the CPI. The large particle at the top is 300mm wide, and all the images are to scale.
OCTOBER 2013 MARCHAND ET AL . 2339

same feature is observed in all six radar scans under-
taken at this time (each about 1min apart), and similar
features are seen in a significant fraction of the RHI
scans acquired during the experiment. Rather, we con-
tend that the large values of reflectivity in Fig. 1 and in
most of the other instances of this phenomenon are
because of enhanced backscattering by oriented ice
crystals. The radar depolarization ratio in the top-right
panel of Fig. 1 shows a cone with low depolarization
values directly above the radar and increasing values of
depolarization on both sides for altitudes between the
surface and 1.5 km. As discussed by Matrosov et al.
(2012), this pattern in the slant depolarization ratio is
expected for horizontally oriented planar ice crystals,
and indeed the cloud particle imager (CPI) at SPL
showed that this cloud contained a variety of particle
types including planar ice crystals. The CPI is a single-
particle imaging probe that captures 2D images of par-
ticles using a charge-coupled device (CCD) camera with
an image resolution of about 2.3mm, and is capable of
imaging particles of up to about 2mm (Lawson et al. 2001).
A sample of CPI images is shown at the bottom of Fig. 1.
The largest plate shown here is about 300mm wide.
Near the top of the cloud in Fig. 1 (above about
1.5 km), depolarization values remain low, showing little
if any change with the scan angle. Low depolarization
values with no scan angle dependence are indicative
of quasi-spherical ice particles or small water droplets
(Matrosov et al. 2012). Figure 2, for example, shows
results for a cloud primarily composed of liquid water
but also containing some heavily rimed irregularly sha-
ped ice particles. Figure 1 shows little if any enhance-
ment in near-zenith radar reflectivity above 1.5 km,
which is indicative of there being few (if any) oriented
ice crystals and consistent with the low depolarization
ratio at all elevation angles in this region.
While the presence of enhanced backscattering is
obvious in Fig. 1, more often the effect is significantly
more subtle. Figure 3, for example, shows a more typical
case. In this case, CPI observations show the cloud was
mixed phase, almost entirely composed of water droplets,
and relatively small planar ice crystals (with maximum
FIG. 2. As in Fig. 1, but for a case with no reflectivity enhancement at nadir. Microphysical observations at
SPL show this cloud consisted of water droplets with a few heavily rimed ice particles. Images of sample cloud
particles not shown.
2340 JOURNAL OF ATMOSPHER IC AND OCEAN IC TECHNOLOGY VOLUME 30

dimensions generally less than 200mm). The small
magnitude of the enhanced backscattering is likely be-
cause of the small size of the planar crystals in this case.
However, it is also possible there are some large particles
in this cloud that are partly responsible for the enhanced
backscattering, and which were not sampled by the CPI
because they were relatively few in number. Sampling
limitations of the CPI are discussed later in this section.
FIG. 3. As in Fig. 1, but for a case where reflectivity enhancement in copolar reflectivity is small (though still
discernible). The presence of oriented ice crystals remains easily discernible from the change in slant 458 de-
polarization ratio with elevation angle.Microphysical observations at SPL show this cloud consisted of a mix of water
droplets and small (max dimension , about 200mm) planar crystals.
OCTOBER 2013 MARCHAND ET AL . 2341

While the effect of enhanced backscattering is much less
obvious in the copolar radar reflectivity, the signature of
planar ice crystals remains strong in the depolarization
ratio.
The bottom-left panels of Figs. 1–3 show the mean
radar reflectivity in the altitude range between 0.5 and
1 km above the radar, as a function of the radar scan
elevation angle for elevation angles between 208 and
1608. This region is denoted by the white box in the top
panels. All three figures show a peak in reflectivity near
zenith (elevation angle of 908), with the reflectivity de-
creasing away from zenith. Because the altitude is fixed,
the farther the angle from zenith, the longer the path-
length through the atmosphere becomes; and one ex-
pects a larger path attenuation. Assuming horizontally
homogenous conditions, one can write
dB[Zobs(uel)]5 dB(Zcloud)2Atten3 dist(uel) , (2)
where Zobs is the observed copolar reflectivity (units of
mm6m23) and depends on the elevation angle uel; Zcloud
is the copolar reflectivity of the cloud particles (which in
the absence of oriented particles will be independent of
the elevation angle and also in mm6m23); Atten is the
path attenuation at zenith (which includes attenua-
tion resulting from both gasses and cloud particles in
dBkm21); and dist is the distance from the radar to the
reflectivity observation point (km). Thus, for homoge-
nous conditions and in the absence of oriented particles,
one can determineZcloud andAtten fromZobs at any two
elevation angles. The black dashed lines in Fig. 1 show
how this equation compares to the observations when
Zcloud and Atten are determined using elevation angles
of 358 and 908. The black line fits the observed re-
flectivities rather poorly in Fig. 1. There is no choice for
Atten that fits the observations for all elevation angles.
This demonstrates that Zcloud varies with the elevation
angle, which we attribute to nonspherical horizontally
oriented ice particles.
Rewriting Eq. (2) to allow the cloud reflectivity to
vary with elevation angle—that is, an enhanced back-
scattering (EB) term—we obtain
dB[Zobs(uel)]5 dB(Zconst)1dB[ZEB(uel)]
2Atten3 dist(uel) , (3)
where Zconst is the component of the cloud reflectivity
that does not change with the elevation angle and ZEB
accounts for the change in reflectivity due to oriented
particles. The total cloud reflectivity (constant 1 en-
hanced backscattering) is given by dB[Zcloud(uel)] 5dB(Zconst)1 dB[ZEB(uel)], or equivalently Zcloud(uel)5Zconst 3 ZEB(uel). It is somewhat unintuitive but note
that ZEB has no units. It is a multiplicative factor [or
equivalently, an additive factor when using a logarithmic
representation as is done in Eq. (3)].
Having examined hundreds of radar RHI scans col-
lected during StormVEx, we have found that (when
horizontally homogenous conditions occur) observa-
tions at low elevation angles are consistently well mod-
eled by Eq. (2), such as in Fig. 2, and are frequently
accompanied by a change in the slope of the observed
reflectivity curve with elevation angle (an inflection
point), typically between about 358 and 508, such as in
Fig. 3. In our analysis, we assume that the change in the
observed reflectivity at low elevation angles (specifically
elevation angles lower than 358 or greater than 1458) ispredominately due to attenuation and ZEB is small com-
pared with Zconst [i.e., dBZEB(uel , 358 or uel . 1458) �dBZconst] and can be neglected. We can thus fit Eq. (2) to
the observations at these low angles to determine
Zconst and Atten. This assumption may not always be
valid, and we will discuss the implications of this as-
sumption further in the following section. Using the
observed reflectivity at zenith along with Zconst and
Atten (determined from reflectivity measurements
at low elevation angles), the zenith-enhanced back-
scattering dB[ZEB(908)] is then readily obtained from
Eq. (3).
The dashed red and cyan lines in Figs. 1–3 show the
results of fitting Eq. (2) to the observations using data in
the intervals 258–358 and 1458–1558. The two solutions
are not identical because of spatial heterogeneity in the
observed cloud reflectivity. In our analysis, we use the
difference in these two solutions to identify homoge-
neous cases, and include only cases where the estimated
zenith-enhanced backscattering differs by no more than
1.5 dB, the estimated path attenuation differs by no
more than 1 dB, and the estimated path attenuation is
positive. This last condition removes cases where there
is a gap (or thin cloud region) directly above the radar
that is surrounded by equally reflective cloud on both
sides—a rare occurrence. The retrieved value is taken
as the average of the two estimates. Applying this ap-
proach, the example in Fig. 1 yields an estimate for the
zenith-enhanced backscattering of just over 7 dB, while
the example in Fig. 2 yields a result near 0 dB, and Fig. 3
just over 1.2 dB.
A weakness of these conditional requirements for
identifying homogeneity is that cases where a cloud is
directly above the radar but with gaps (or equally thin
cloud) on both sidesmay be included. In effect, if a cloud
really is centered over the radar, then it can be mis-
interpreted as a case of enhanced backscattering.
However, as will be described in the next section, we
have manually examined more than 250 of the RHI
2342 JOURNAL OF ATMOSPHER IC AND OCEAN IC TECHNOLOGY VOLUME 30
scans used in this analysis and found only 16 cases where
this occurred or, more broadly, where we suspected that
heterogeneity in the cloud had resulted in a bad re-
trieval. Removing these 16 cases had only a trivial effect
on the statistics presented in the next section, giving us
confidence that the homogeneity criteria are sufficient to
capture the effect of oriented snow crystals on back-
scattering at W band.
Another limitation of the retrieval for ZEB is that
since only a narrow range of low-elevation angles can
be used in estimating Zcloud and Atten, the estimate of
these parameters can be sensitive to small spatial-
scale variability in the observed reflectivity. We will
discuss this further in the context of the observations
shown in the next section. Overall, we found that us-
ing a vertical interval from 0.5 to 1 km reduced the
variability in the reflectivity versus elevation angle
curve over using either a half-as-narrow or twice-as-
wide vertical interval. Also, instead of applying the
technique to each individual RHI scan, we averaged
the six RHI scans collected over a total time span
of about five minutes and fit the model [Eq. (2)] over
a 108 range (rather than simply using the observed
values at the end points). Both of these changes
modestly improved the results by increasing the frac-
tion of RHI scans that meet the requirements for ho-
mogeneity.
3. Analysis
During StormVEx, a total of 38 616 RHI scans were
made, from which we obtained 6463 temporally aver-
aged or composite RHI scans (each separated by about
one-half hour). To ensure good signal-to-noise ratio
in the associated depolarization ratio, we limited the
analysis to those cases where the observed reflectivity
at zenith was greater than210 dBZe, which occurred in
approximately 36% of these scans. The technique de-
scribed in the previous section was applied to estimate
the enhanced backscattering at zenith and path attenu-
ation. This approach requires cloud that is horizontally
homogenous over the region analyzed. The homogene-
ity conditions, described in the previous section, further
reduced the analysis set to 983 RHI scans or about 15.3%
of the possible 6463 RHI scans. This is more than 40%
of the RHI scans with a zenith reflectivity greater
than 210 dBZe.
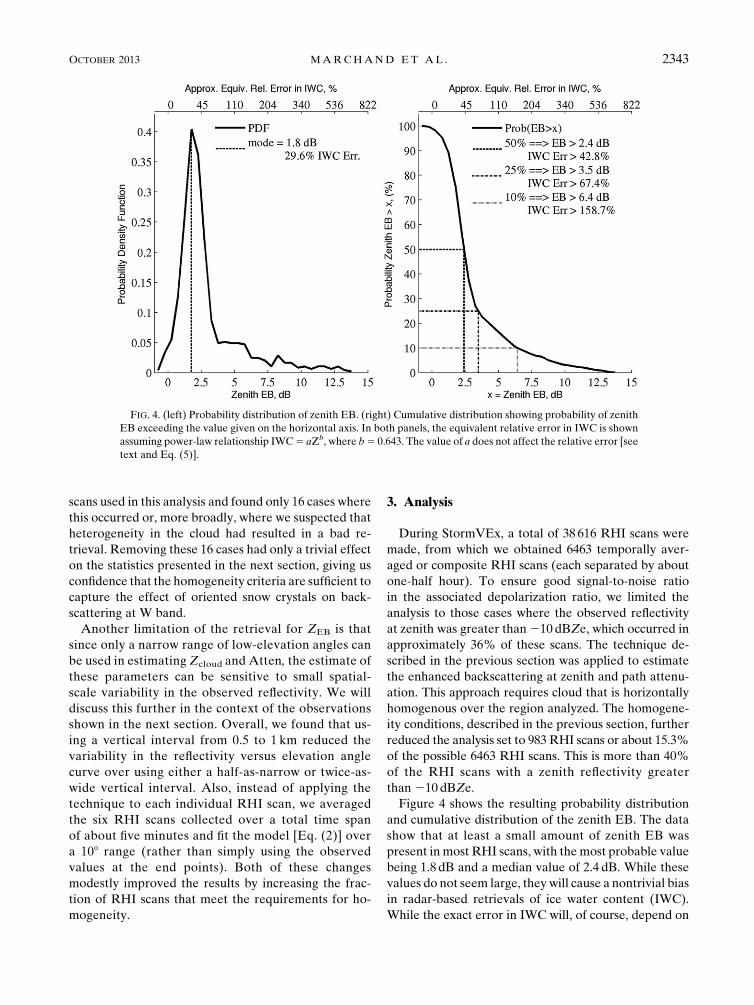
Figure 4 shows the resulting probability distribution
and cumulative distribution of the zenith EB. The data
show that at least a small amount of zenith EB was
present in most RHI scans, with themost probable value
being 1.8 dB and a median value of 2.4 dB. While these
values do not seem large, they will cause a nontrivial bias
in radar-based retrievals of ice water content (IWC).
While the exact error in IWC will, of course, depend on
FIG. 4. (left) Probability distribution of zenith EB. (right) Cumulative distribution showing probability of zenith
EB exceeding the value given on the horizontal axis. In both panels, the equivalent relative error in IWC is shown
assuming power-law relationship IWC5 aZb, where b5 0.643. The value of a does not affect the relative error [see
text and Eq. (5)].
OCTOBER 2013 MARCHAND ET AL . 2343

the details of the IWC retrieval, we can gauge the error
by noting that the relationship between IWC and radar
reflectivity is often represented by a power-law rela-
tionship of the form IWC(Z) 5 aZb, where a and b are
constants (Sassen et al. 2002). Defining the relative error
in IWC as
IWC rel err5 100
�IWC(Zcloud)2 IWC(Zconst)
IWC(Zconst)
�, (4)
noting that dB(Zcloud) 5 dB(Zconst) 1 dB(ZEB) and
substituting the above power-law expression into this
definition, one obtains
IWC rel err5 100[100:1bdB(ZEB)2 1]. (5)
Thus a power-law relationship with a constant value of
b results in a one-to-one relationship between the ad-
ditional reflectivity because of enhanced backscattering
and the relative error in IWC. This simple relationship is
a consequence of the fact that we have defined ZEB as
a simple additive factor in logarithm space. A variety of
values have been proposed for b, ranging from 0.58 to
about 0.8 (Sassen et al. 2002). A reasonable value of b50.643 implies a median error of 2.4 dB is equivalent to
a relative error or relative bias in IWC of about 43%.
Larger values of b imply slightly larger errors. For ex-
ample, using a value of b 5 0.8 would yield a relative
error of about 56%. While the median value of zenith
EB is modest, the distribution is skewed toward larger
values, with values exceeding 10 dB on a few occasions.
Of the homogenous cloud cases, 25% had a zenith EB
exceeding 3.5 dB (equivalent to a relative error in IWC
near 67%) and 10% of the cases had a zenith EB ex-
ceeding 6.4 dB (equivalent to a relative error in IWC in
excess of 150%).
The scatterplot in Fig. 5 examines the relationship
between the zenith EB, the radar depolarization ratio,
and the cloud particle types as determined from CPI
observations at SPL. In this figure, the color symbols
represent a variety of cloud particle categories as sum-
marized in Table 1. Red symbols denote cases where
planar ice crystals were observed, while circles of all
colors represent cases where water droplets were the
dominant (most numerous) cloud particle. The large
numbers of red symbols and circles indicate that planar
ice crystals and mixed-phased clouds were common.
This particle type classification was obtained by
manual examination of particle images gathered by the
CPI within 15 minutes of the associated RHI scan. All
RHI scans where CPI data were available and that had
a zenith EB greater than 4 dB or aDRDiff 45 (described
below) greater than 4 dB were examined. In this region
of the scatterplot, all gray diagonal crosses indicate
times where CPI images were unavailable or captured
only a few particles, insufficient to assign a particle
category. Most often this occurred simply because the
cloud base was just above SPL. However, periods with
low particle concentrations may not be well represented
and, while the CPI was aspirated, low winds speeds may
reduce the size of the sampling volume, such that, our
classification results may be biased to periods with
stronger winds or larger particle concentrations. Particle
fall speeds are also potentially a factor, as more slowly
falling particles are less likely to pass through the sam-
pling volume during the observation time window than
larger particles. A randomly selected sample of points
with values less than 4 dB was also examined. This
sampling represents roughly half the points where CPI
data were gathered. In total there are 122 points with
a CPI-based particle-type classification.
In Fig. 5, the difference in the observed depolarization
ratio at zenith minus that observed at an elevation angle
of 458, which we call DR Diff 45, is shown along the
horizontal axis. For planar particles, the depolarization
ratio is expected to increase from values at zenith that
are close to the radar polarization cross-coupling iso-
lation limit (about221.8 dB) for the ARM radar during
StormVEx to a maximum value at the lowest elevation
angles (Matrosov et al. 2012; see also middle-right
FIG. 5. Scatterplot showing relationship between zenith EB and
change inDR given byDiff 45. Color symbols are defined inTable 1.
Region identified by the orange ellipse is discussed in the text.
2344 JOURNAL OF ATMOSPHER IC AND OCEAN IC TECHNOLOGY VOLUME 30

panels of Figs. 1 and 3). Spherical particles, rounded
(heavily rimed) irregulars, and columns are expected to
produce little or no change in depolarization ratio with
the elevation angle (Fig. 2). The choice of 458 used here
for the elevation angle is guided by theoretical consid-
erations for Ka band that suggest the impact of particle
flutter on the slant linear depolarization ratio will be
minimal around 458 (Reinking et al. 2002). However, we
find no significant sensitivity in our results for any rea-
sonable choice.
There are red symbols in Fig. 5 that have low zenith
EB, demonstrating that the presence of planar crystals
does not guarantee that zenith EB will be large. In most
of these cases, in particular the mixed-phase clouds (red
circles), planar crystals are not the dominant particle
type. There are, however, a few cases where planar
crystals are the most common particle type (red di-
agonal crosses). The CPI data for these cases show large
numbers of small plates.
As expected, most of the cases where the CPI showed
the ice particles to be heavily rimed (green symbols in
Fig. 5) have only modest values for zenith EB and DR
Diff 45. There are, however, a few cases where only
heavily rimed particles were imaged by the CPI and yet
there is a zenith EB or DR Diff 45 greater than 4 dB.
Most of these cases appear to contain rimed dendrites or
rimed plates (green triangles), and it is likely that some
of these particles may continue to be horizontally ori-
ented. It is also possible that relatively pristine planar
crystals were present in these cases and simply not
sampled by the CPI. Manual surface observations taken
during StormVEx support this possibility. During the
experiment a black felt surface was occasionally used to
manually capture falling crystals for visual inspection of
the crystal type, and on several occasions the collected
samples revealed a multitude of heavily rimed particles
with one or two seemingly miraculous pristine (or nearly
pristine) sector plates or dendrites. CPI sampling limi-
tations are certainly a factor with respect to the blue
circles with large zenith EB. The blue circles represent
cases where the CPI is dominated by water drops and
imaged few, if any, ice particles. When cloud water is
present, the number of water drops can greatly exceed
the number of ice crystals, often by a factor of 100 or
more. In these circumstances the CPI tends to spend
most of its time imaging water drops, with little chance
of capturing more rarely occurring ice particles (Lawson
et al. 2006). However, measurements from particle siz-
ing probes at SPL (specifically a Droplet Measurement
Technology Particle Imaging Probe and Cloud Imaging
Probe), which have larger sampling volumes, show that
large ice particles were present in these cases. The CPI
data are perhaps best used in confirming the presence of
particle types and identifying the type of the most nu-
merous or dominant particles, rather than trying to ex-
clude or limit the range of particle types present. In the
context of the present analysis, theCPI data certainly show
that planar ice crystals were common, and that when these
particles are present, there is strong correlation between
DR Diff 45 and the estimated value for the zenith EB.
TABLE 1. Description of cloud particle classes and symbols used in figures. While particle columns were not rare, only on very few
occasions were columns observed to be dominant habit. Field observations suggest there were periods with needles, aggregates composed
of columns, aggregates composed of dendrites, aggregates composed of plates, and in one case, a polycrystal consisting of rounded heavily
rimed particles with needlelike projections.
Symbol Description
Red diagonal cross Cloud dominated by pristine plates, sector plates, or dendrites. Few, if any, water drops and at most
light riming. Some cases include columns or capped columns.
Red triangle Cloud dominated by irregularly shaped planar structures. Typically heavily sublimated
or partially melted dendrites. Original crystal structure is often uncertain. Little,
if any, riming is present (but may have existed before melting), and water droplets are rare.
Red square Zenith EB greater than 10 dB. CPI showed only a small number of ice crystals; all were large
plates or large and broad columns. Some crystals were slightly rimed.
Red circle Cloud dominated by water droplets, but at least one planar crystal was observed.
Blue circle Cloud dominated by liquid water droplets to the point where identification of ice type is
problematic. Fewer than five ice crystals observed, typically small and heavily rimed
particles. No planar crystals are observed.
Green circle Cloud dominated by water droplets, but heavily rimed particles or rimed columns are also present.
Green plus Cloud dominated by heavily rimed particles. Water drops may be presented but not in large numbers.
Original crystal habit is often difficult or impossible to determine or appears to be columns. In some
cases, rimed or pristine columns are also present.
Green triangle Cloud dominated by heavily rimed particles, some of which are very likely dendrites or plates.
Water drops may be present, but not in large numbers. In some cases, rimed or small pristine
columns are also present.
Gray diagonal cross No classification possible or attempted.
OCTOBER 2013 MARCHAND ET AL . 2345

Including all points in Fig. 5, the correlation between
DRDiff 45 and the zenith EB is about20.79, indicating
that about half the variation in zenith EB is captured by
DRDiff 45. A least squares linear fit to the data is shown
by the black line. The data are scattered about this line
with a root-mean-square (RMS) difference of about
1.5 dB. The correlation coefficient and RMS fit indicate
that measurements of the slant depolarization ratio
could be used to improve radar-based retrievals [meaning
that measurements of DR Diff 45 could be used to de-
tect the presence of (some) oriented ice and perhaps
estimate the size of the expected zenith enhancement in
copolar reflectivity when needed, albeit with an RMS
uncertainty of about 1.5 dB]. We note that DR Diff 45
requires radar measurements at only nadir and 458, isnot affected by path attenuation, and does not require
the strict homogeneity conditions being used in the
present analysis (though one would still be assuming the
same particle shapes and orientations at both angles).
Perhaps surprisingly, Fig. 5 suggests that the largest
zenith EB for any given value of DR Diff 45 (see the
region highlighted by the orange ellipse in Fig. 5) often
occurs when the cloud is primarily composed of irregu-
larly shaped planar crystals (red triangles) that appear to
be sublimating or melting planar crystals. The retrieval
for the zenith EB given in section 2 assumes that the
copolar reflectivity enhancement at low elevation angles
is small compared to enhancement in the zenith direc-
tion (such that the cloud particle scattering is constant).
We speculate that these larger EB values are at least
partly because of the reflectivity being significantly im-
pacted by the crystal orientation even at low elevation
angles, perhaps because of there being few nonoriented
ice crystals. Many of the largest enhanced backscatter-
ing cases appear to have occurred when small numbers
of planar crystals were falling out of a mixed-phase re-
gion. The largest observed EB (the red square in Fig. 5)
is one such case. The CPI data collected at this time
show only a small number of ice crystals, all of which
were large plates or large and broad columns (the only
time such columns were observed in our sampling).
The linear fit in Fig. 5 has a nonzero intercept value of
about 0.77 dB. This nonzero value could be due to a va-
riety of causes. For example, the ARM radar had a
rather poor cross-polar isolation of about 221.8 dB and
it is possible that there are cases where the cross-polar
reflectivity of oriented ice crystals is present but below
the isolation level, and so is undetected. Another pos-
sibility is that the estimated attenuation could be biased
high, which would cause the retrieved zenith EB to be
biased high. However, examination of the attenuation
retrieval results, which are discussed later in this section,
suggests that the bias is smaller than 0.77 dB. Perhaps
the most likely reason for the nonzero intercept is that
nonspherical, irregular particles and columns, which are
expected to generate little to noDRDiff 45 signal, cause
a slight increase in zenith EB. An analysis of irregular
(heavily rimed) particles observed from aircraft optical
array probes by Hogan et al. (2012) indicates that most
heavily rimed particles are not spherical, but are better
modeled as oblate spheroids with an axial ratio near 0.6
(and typically ranging from case to case between about
0.5 and 0.75, and with some dependence on particle
size). These authors found that using a horizontally
oriented oblate spheroid model significantly improved
the forward calculation of radar reflectivity (from the
aircraft observation size distribution) compared against
coincident observations from ground-based 9.7-GHz
radar. The presence of relatively modest positive zenith
EB values for CPI cases containing only heavily rimed
particles (green pluses in Fig. 5), as well as the positive
mode in the distribution of zenith EB in Fig. 4 with few
data points near 0 dB, is consistent with irregular parti-
cles being nonspherical and having some horizontal
orientation.
Both panels in Fig. 6 show scatterplots of the retrieved
total path attenuation against DRDiff 45, the difference
being that the left panel includes only cases where the
total column liquid water path (LWP) estimated from
measurements of the ARM microwave radiometer is
less than 20 gm22 and the right panel includes only cases
where the LWP is greater than 20 gm22. Details on the
ARM two-channel microwave radiometer retrieval are
given by Liljegren (1999) and Westwater et al. (2001).
The total path attenuation is due to both gasses (pri-
marily water vapor) and cloud condensate (primarily
liquid water). The purpose of the left panel is to provide
insight into the retrieved attenuation when the contri-
bution from liquid water must be small and the path
attenuation is primarily due to water vapor. The right
panel includes cases where there is significant attenua-
tion due to liquid water, but also includes cases where
the liquid water occurs above 1 km and so does not
contribute to the path attenuation of the analyzed region
of the cloud.
Because of the statistical technique used in the LWP
retrieval, the retrieval is prone to produce both small
negative and positive values for the LWP when there is
no liquid water in the cloud, and in the case of super-
cooled liquid water there are relatively larger uncer-
tainties because of uncertainties in the dielectric
constant of liquid water below 08C, which may bias the
LWP retrieval (Westwater et al. 2001; Marchand et al.
2003). We have selected a conservative value for the
LWP threshold of 20 gm22, which should ensure that
the actual LWP is less than 50 gm22, equivalent to a
2346 JOURNAL OF ATMOSPHER IC AND OCEAN IC TECHNOLOGY VOLUME 30

path attenuation of less than 0.2 dBkm21 at 94GHz. For
the range of pressures and temperatures present at
StormVEx, the gaseous attenuation is expected to vary
between about 0.3 and 0.8 dBkm21. Thus, while some of
the spread shown in the left panel of Fig. 6 is likely be-
cause of real variability in water vapor and small
amounts of liquid water, much of the variability is be-
cause of error in the estimated value of attenuation.
There are few cases where the estimated attenua-
tion exceeds 2 dBkm21. An examination of these cases
shows that while some of these outliers may be because
of heterogeneities in the observed cloud copolar re-
flectivity (i.e., small-spatial-scale variability in the re-
flectivity versus elevation angle curve), most cases show
little heterogeneity; and we suspect these unreasonably
large values for the path attenuation, are a result of vi-
olating the assumption that the cloud reflectivity is
constant at low elevation angles—though it is also pos-
sible there has been a significant underestimate of the
microwave-radiometer-retrieved LWP. Nonetheless,
even with these outliers, the RMS variability is only
about 0.2 dBkm21, the mean value is near 1 dBkm21,
and the intercept value is near 0.7 dBkm21, indicating
there is little bias in the estimated path attenuation,
perhaps a few tenths of a decibel per kilometer at most.
The right panel of Fig. 6 shows that liquid water adds
significant path attenuation with a mean attenuation
about 1 dBkm21 larger than the low-LWP cases shown
in the left panel. An examination of the handful of cases
where the estimated path attenuation is greater than
4 dB km21 suggests these are not errors because of
heterogeneity in the observed clouds but rather cases
with large amounts of liquid water, including several
cases where freezing drizzle may be present. We note
that any attenuation due to liquid water (or wet snow)
on the radar dome will also add to the path attenuation.
With typical total path attenuation less than about
2 dBkm21, cases where the enhanced backscattering
exceeds 2 dB are usually visually easy to identify in the
observed RHI scan and represent more than half of all
cases.
4. Summary and discussion
In summary, an analysis of 95-GHz scanning radar
data collected during StormVEx shows that at least a
small amount of enhanced backscattering (EB) because
of horizontally oriented ice crystals was present in most
radar scans, with a median enhancement of 2.4 dB at
zenith compared with reflectivity at low elevation an-
gles. This is roughly equivalent to a relative bias error in
ice water content (IWC) of about 43%. While the me-
dian value of the zenith EB is modest, the distribution is
skewed toward larger values, with values occasionally
exceeding 10 dB. In 25% of the cases, the zenith EB
exceeded 3.5 dB (equivalent to a relative error in IWC in
excess of 67%) and 10% of the cases had a zenith EB
exceeding 6.4 dB (equivalent to a relative error in IWC
in excess of 150%). These results suggest that without
some means of identifying the effect of orientation on
zenith or nadir backscatter, (bias) errors in the clima-
tologies of radar-retrieved IWC for warm ice clouds
FIG. 6. Scatterplots showing relationship between retrieved path attenuation (vertical axis) and change in DR.
Color symbols as in Fig. 5 and defined in Table 1. (left) Points where the total columnLWP is estimated to be less than
20 gm22. (right) Points where the LWP is estimated to be larger than 20 gm22.
OCTOBER 2013 MARCHAND ET AL . 2347

(T . 2208C) or mixed-phase clouds should be antici-
pated, and are likely to be significant. The analysis also
shows there is a strong correlation (about 20.79) be-
tween the change in slant 458 depolarization ratio with
radar scan elevation angle and the magnitude of the
zenith EB, suggesting that measurements of the slant
depolarization ratio could be used to improve radar-
based retrievals by helping account for ice crystal
orientation.
Cloud particle imager data indicate that large en-
hancement typically occurred when planar crystals were
present. While more modest enhancements were some-
times clearly a result of planar crystals, at other times the
enhancement appears to be because of nonspherical
irregularly shaped particles, consistent with the analy-
sis of Hogan et al. (2012). These irregularly shaped
particles often appear to be heavily rimed columns and
broken dendrites, though this observation is somewhat
speculative, as the rime makes the identification am-
biguous. The largest enhancement seems to have occurred
when large planar crystals were falling out of a liquid-
water layer into a region with little ice condensate—
conditions in which oriented and planar ice crystals
have been noted to occur during other experiments
(e.g., Westbrook et al. 2010; Carey et al. 2008; Hogan
et al. 2003).
The retrieval for the zenith-enhanced backscattering
used here is based on a simple model that assumes the
radar backscattering at low elevation angles is only due
to path attenuation and a constant cloud reflectivity. We
do not expect the estimated value for enhanced back-
scattering obtained here to be the same as what one
would get for scattering from the same particles being
randomly oriented or relative to what one would get
from spheres of the same mass. Our enhanced back-
scattering estimate represents a practical measure on the
effect of oriented ice crystals and its strengthwill depend
on many factors, including the relative abundance and
size of oriented to nonoriented particles. The assump-
tion of constant cloud reflectivity at low elevation angles
may be violated when only oriented ice is present. In
general, we expect changes in reflectivity because of
oriented ice at low elevation angles to increase the es-
timate for the zenith EB, and this will depend slightly
on the polarization state [as we expect the off-zenith
copolar reflectivity measured with slant 458 depolar-
izationwill be smaller than thatmeasuredwith horizontal-
transmit horizontal-receive (HH)polarization, for example].
Regardless, cases where the change in scattering at low
elevation angles is due to oriented ice crystals are certain
to produce large errors in any radar-based retrieval for
the ice water content that does not take the particle ori-
entation into account. In general, a more sophisticated
approach could be developed that uses a model for the
oriented ice particle scattering with elevation angle.
Such a retrieval would require deriving additional
parameters, or making assumptions, constraining the
shape of the size distribution, the axial ratio of the
oriented ice crystal (with size), and the relative con-
tribution of oriented particles to randomly oriented
particles.
The results presented in section 3 are not sensitive to
small changes in the thresholds used to ensure homo-
geneous conditions. For example, tightening the differ-
ence threshold between the estimated zenith EB from
the two elevation angle ranges used from 1.5 to 1.0 dB
changes the correlation coefficient from 20.79 to 20.8.
While it is possible that enhanced backscattering differs
under the conditions studied than in less homogenous
conditions, we note that the analysis region is only 4 km
wide and that the 983 composite scans included repre-
sent more than 40% of the total number of such scans
where the zenith reflectivity was greater than210 dBZe.
The ridgeline upon which SPL sits runs north–south and
the larger-scale midtropospheric flow usually had a
strong westerly component. Local-scale flows at low
levels were complicated, but cases where there was a
strong low-level upslope flow were not rare. While to-
pographic uplift at the radar site may be responsible for
some amount of the inhomogeneity in the radar analysis
region, a visual examination of the radar data suggests
this was not a dominant factor. In regard to both Figs. 2
and 3, for example, the larger reflectivities are actually
on the left side of the figure (that is, farther from the
mountain), whereas one might expect any upslope flow
to create larger water contents and particle sizes closer
to the mountain. Also, comparison of reflectivity dis-
tributions at the edges of the analysis region (not shown)
indicates no statistical difference when looking toward
the ridgeline (x 5 12 km) or away from the ridgeline
(x 5 22 km). The small size of the analysis regions is
certainly key, as differences in the reflectivity distribu-
tion become evident when looking farther from the
ridge (e.g., x 5 15 km). The short distance between the
radar and SPL also likely helps ensure that particle
properties measured at SPL (2.4 km from the radar) are
representative much of the time.
The radar data gathered during StormVEx are not
well suited to studying the duration of oriented ice
crystal events. The radar RHI scans (which took a total
of about 5min) were done only about once each half
hour. So, even if we detect oriented ice crystals one-half
hour apart in consecutive radar scans, we have no good
way to know if they were present during the entire pe-
riod between the scans. Also, the analysis technique was
focused on homogeneous conditions and cases where
2348 JOURNAL OF ATMOSPHER IC AND OCEAN IC TECHNOLOGY VOLUME 30
the radar scans at every half hour pass the homogeneity
criteria for some extended period are infrequent. These
issues aside, our visual interpretation is that there is no
‘‘characteristic scale’’ of oriented ice crystal occurrence,
and there were events where oriented ice crystals were
present for many consecutive hours and events where
they occurred only briefly (for less than an hour, perhaps
even only a few minutes).
Naturally, the question arises as to how representative
StormVEx results might be of clouds in other regions. It
seems possible or even likely that the orographic uplift
created by the Park Range of the RockyMountains near
Steamboat Springs is a key component in ensuring the
temperatures and supersaturations needed for frequent
and vigorous growth of planar crystals during Storm-
VEx. Planar ice crystals have been frequently observed
in other mountainous regions during the winter, for
example, in wintertime systems passing over the Cas-
cades during the Improvement of Microphysical Parame-
terization throughObservational Verification Experiment
(IMPROVE) field experiments in Oregon (Woods et al.
2005), as well as in many earlier surface and aircraft
measurements in the Pacific Northwest Cascades (e.g.,
Hobbs 1975), and other mountains regions (e.g.,
Choularton et al. 2008; Sassen 1984; Rogers and Vali
1987). Nonetheless, as discussed in the introduction,
both satellite and aircraft data show that oriented ice
crystals do occur in other regions. In particular, low-
level mixed-phase clouds with ice falling from thin su-
percooled liquid water layers are a common occurrence
in the Arctic (Shupe et al. 2006), and in situ measure-
ments have shown that these clouds sometimes (and
perhaps often) contain dendrites, plates, and other
crystal types that are likely to be oriented (e.g., Earle
et al. 2011; Korolev et al. 1999). Of particular interest is
that Korolev et al. (1999) observed sublimating irregu-
larly shaped particles that appear quite similar to what
we observed during StormVEx, and which we found to
often show large zenith-enhanced backscattering. If
oriented crystals are less frequent outside of moun-
tainous regions, then it nonetheless seems likely that
oriented crystals will cause equally large errors in
millimeter-wavelength radar-based retrievals when they
do occur. TheAtmospheric SystemResearch program is
currently placing scanning polarimetric 95- or 35-GHz
radars at all of its fixed sites, as well as in its two mobile
instrument suites. Radar observations from these
systems, perhaps along with observations from other
scanning radars (such as the Chilbolton site), could be
used to more quantitatively address this question,
both with respect to the presence of (copolar) reflec-
tivity enhancement and its relationship to depolar-
ization ratio.
In regard to the depolarization ratio, the main reason
a slant linear configurationwas used during StormVEx is
because slant linear is expected to be less susceptible to
small flutter in the horizontal orientation of particles
than the more traditional horizontal–vertical linear de-
polarization ratio (LDR; Reinking et al. 2002). Thus, we
expect that an EB–LDR relation will be much noisier
than the EB to slant linear DR relation, and suggest that
field programs consider making observations using slant
458 depolarization in addition to LDR.
It is also noteworthy that enhanced backscattering
was frequently observed both below and within cloud
mixed-phase regions, but less frequently near cloud
top. The lack of enhanced backscattering at cloud top is
likely due to ice particles being smaller and possibly
more spherical, though it could also be that they are less
likely to be horizontally oriented (perhaps partly due
to increased turbulence). The vertical variability and
presence of oriented particles in regions where lidar will
not be able to penetrate, their potentially large impact
on copolar reflectivity observations, the likely size-
dependent nature of crystal orientation, and the added
complexity (degrees of freedom) that oriented particles
introduce into the retrieval process, all argue strongly
for further research into retrieval techniques that in-
clude radar measurements of different depolarization
types (e.g., Matrosov et al. 2005) and/or multiwave-
length reflectivity ratios that could be indicative of
particle types (e.g., Kneifel et al. 2011; Leinonen et al.
2012).
Acknowledgments. The StormVEx campaign was
supported by the Office of Biological and Environ-
mental Research of the U.S. Department Energy
(DOE) as part of the Atmospheric System Research
program, the National Science Foundation, and the
NASA CloudSat project. The Desert Research In-
stitute’s SPL is an equal opportunity service provider
and employer, and is a permitee of the Medicine Bow–
Routt National Forests. We would especially like to
thank and acknowledge the hard work of many people
who made this research possible, including the many
DOE ATSC and ASR staff (especially, Kevin Widener,
Nitin Bharadwaj, Rich Coulter, and Brad Orr), Storm
Peak Laboratory (SPL) local volunteers, the Steam-
boat Ski and Resort Corporation, the U.S. Forest
Service, the Grand Junction National Weather Ser-
vice office, Stratton Park Engineering Company
(SPEC) Incorporated, and all of the graduate stu-
dents (Betsy Berry, Stewart Evans, Ben Hillman,
Will Mace, Clint Schmidt, Carolyn Stwertka, Adam
Varble, and Christy Wall), who put considerable ef-
fort into collecting data.
OCTOBER 2013 MARCHAND ET AL . 2349

REFERENCES
Atlas, D., M. Kerker, and W. Hitschfield, 1953: Scattering and at-
tenuation by non-spherical atmospheric particles. J. Atmos.
Terr. Phys., 3, 108–119, doi:10.1016/0021-9169(53)90093-2.
Aydin, K., and C. Tang, 1997: Relationships between IWC and
polarimetric radar measurands at 94 and 220GHz for hexag-
onal columns and plates. J. Atmos.Oceanic Technol., 14, 1055–
1063.
——, and J. Singh, 2004: Cloud ice crystal classification using a
95-GHz polarimetric radar. J. Atmos. Oceanic Technol., 21,
1679–1688.
Borys, R. D., and M. A. Wetzel, 1997: Storm Peak Laboratory:
A research, teaching and service facility for the atmospheric
sciences. Bull. Amer. Meteor. Soc., 78, 2115–2212.
Carey, L. D., J. Niu, P. Yang, J. A. Kankiewicz, V. E. Larson, and
T. H. Vonder Haar, 2008: The vertical profile of liquid and ice
water content in midlatitude mixed-phase altocumulus clouds.
J. Appl. Meteor. Climatol., 47, 2487–2495.
Chepfer, H., G. Brogniez, P. Goloub, F. M. Breon, and P. Flamant,
1999: Observations of horizontally oriented ice crystals in cirrus
clouds with POLDER-1/ADEOS-1. J.Quant. Spectrosc. Radiat.
Transfer, 63, 521–543, doi:10.1016/S0022-4073(99)00036-9.
Choularton, T. W., and Coauthors, 2008: The influence of small
aerosol particles on the properties of water and ice clouds.
Faraday Discuss., 137, 205–222, doi:10.1039/B702722M.
Clothiaux, E. E., T. P. Ackerman, G. G. Mace, K. P. Moran,
R. T. Marchand, M. A. Miller, and B. E. Martner, 2000: Ob-
jective determination of cloud heights and radar reflectivities
using a combination of active remote sensors at the ARM
CART sites. J. Appl. Meteor., 39, 645–665.
Delanoe, J., and R. J. Hogan, 2010: Combined CloudSat–CALIPSO–
MODIS retrievals of the properties of ice clouds. J. Geophys.
Res., 115, D00H29, doi:10.1029/2009JD012346.
Earle, M. E., P. S. K. Liu, J. W. Strapp, A. Zelenyuk, D. Imre,
G. M. McFarquhar, N. C. Shantz, and W. R. Leaitch, 2011:
Factors influencing the microphysics and radiative properties
of liquid-dominated Arctic clouds: Insight from observations
of aerosol and clouds during ISDAC. J. Geophys. Res., 116,
D00T09, doi:10.1029/2011JD015887.
Hallar, A. G., G. Chirokova, I. B. McCubbin, T. H. Painter,
C. Wiedinmyer, and C. Dodson, 2011a: Atmospheric bio-
aerosols transported via dust storms in western United States.
Geophys. Res. Lett., 38, L17801, doi:10.1029/2011GL048166.
——,D.H.Lowenthal,G.Chirokova,R.D.Borys, andC.Wiedinmyer,
2011b: Persistent daily new particle formation at a mountain-
top location. Atmos. Environ., 45, 4111–4115, doi:10.1016/
j.atmosenv.2011.04.044.
Heymsfield, A. J., 2003: Properties of tropical and midlatitude ice
cloud particle ensembles. Part I: Median mass diameters and
terminal velocities. J. Atmos. Sci., 60, 2573–2591.
Hobbs, P. V., 1975: The nature of winter clouds and precipitation
in the Cascade Mountains and their modification by artifi-
cial seeding. Part I: Natural conditions. J. Appl. Meteor., 14,
783–804.
Hogan, R. J., P. N. Francis, H. Flentje, A. J. Illingworth, M. Quante,
and J. Pelon, 2003: Characteristics of mixed-phase clouds. I:
Lidar, radar and aircraft observations from CLARE’98.Quart.
J. Roy. Meteor. Soc., 129, 2089–2116.——, L. Tian, P. R. A. Brown, C. D. Westbrook, A. J. Heymsfield,
and J. D. Eastment, 2012: Radar scattering from ice aggregates
using the horizontally aligned oblate spheroid approximation.
J. Appl. Meteor. Climatol., 51, 655–671.
Kneifel, S., M. S. Kulie, and R. Bennartz, 2011: A triple-frequency
approach to retrieve microphysical snowfall parameters.
J. Geophys. Res., 116, D11203, doi:10.1029/2010JD015430.
Korolev, A. V., G. A. Isaac, and J. Hallett, 1999: Ice particle habits
inArctic clouds.Geophys. Res. Lett., 26, 1299–1302, doi:10.1029/
1999GL900232.
——, ——, and ——, 2000: Ice particle habits in stratiform clouds.
Quart. J. Roy. Meteor. Soc., 126, 2873–2902, doi:10.1002/
qj.49712656913.
Lawson, R. P., B. A. Baker, C. G. Schmitt, and T. L. Jensen, 2001:
An overview of microphysical properties of Arctic clouds
observed inMay and July 1998 during FIREACE. J. Geophys.
Res., 106 (D14), 14 989–15 014.
——, D. O’Connor, P. Zmarzly, K. Weaver, B. Baker, Q. Mo, and
H. Jonsson, 2006: The 2D-S (stereo) probe: Design and pre-
liminary tests of a new airborne, high-speed, high-resolution
particle imaging probe. J. Atmos. Oceanic Technol., 23, 1462–
1477.
Leinonen, J., S. Kneifel, D. Moisseev, J. Tyynel€a, S. Tanelli, and
T. P. Nousiainen, 2012: Evidence of nonspheroidal behavior in
millimeter-wavelength radar observations of snowfall. J. Geo-
phys. Res., 117, D18205, doi:10.1029/2012JD017680.
Liljegren, J. C., 1999: Automatic self-calibration of ARM micro-
wave radiometers. Microwave Radiometry and Remote Sens-
ing of the Earth’s Surface and Atmosphere, P. Pampaloni and
S. Paloscia, Eds., CRC Press, 433–443.
Mace, J., and Coauthors, 2010: STORMVEX: The Storm Peak Lab
Cloud Property Validation Experiment science and opera-
tions plan. U.S. Department of Energy Rep. DOE/SC-ARM-
10-021, 44 pp.
Marchand, R., T. Ackerman, E. R. Westwater, S. A. Clough,
K. Cady-Pereira, and J. C. Liljegren, 2003: An assessment of
microwave absorption models and retrievals of cloud liquid
water using clear-sky data. J. Geophys. Res., 108, 4773,
doi:10.1029/2003JD003843.
Matrosov, S. Y., andA. J. Heymsfield, 2008: Estimating ice content
and extinction in precipitating cloud systems from CloudSat
radarmeasurements. J. Geophys. Res., 113,D00A05, doi:10.1029/
2007JD009633.
——, R. F. Reinking, R. A. Kropfli, B. E. Martner, and B. W.
Bartram, 2001: On the use of radar depolarization ratios
for estimating shapes of ice hydrometeors in winter clouds.
J. Appl. Meteor., 40, 479–490.
——, ——, and I. V. Djalalova, 2005: Inferring fall attitudes of
pristine dendritic crystals from polarimetric radar data.
J. Atmos. Sci., 62, 241–250.
——, G. G. Mace, R. Marchand, M. D. Shupe, A. G. Hallar, and
I. B. McCubbin, 2012: Observations of ice crystal habits with
a scanning polarimetric W-band radar at slant linear depo-
larization ratiomode. J.Atmos.OceanicTechnol., 29, 989–1008.
Noel, V., and H. Chepfer, 2004: Study of ice crystal orientation in
cirrus clouds based on satellite polarized radiance measure-
ments. J. Atmos. Sci., 61, 2073–2081.
——, and ——, 2010: A global view of horizontally oriented crys-
tals in ice clouds from Cloud-Aerosol Lidar and Infrared
Pathfinder Satellite Observation (CALIPSO). J. Geophys.
Res., 115, D00H23, doi:10.1029/2009JD012365.
Okamoto, H., 2002: Information content of the 95-GHz cloud radar
signals: Theoretical assessment of effects of nonsphericity
and error evaluation of the discrete dipole approximation.
J. Geophys. Res., 107, 4628, doi:10.1029/2001JD001386.
——, K. Sato, and Y. Hagihara, 2010: Global analysis of ice mi-
crophysics from CloudSat and CALIPSO: Incorporation of
2350 JOURNAL OF ATMOSPHER IC AND OCEAN IC TECHNOLOGY VOLUME 30

specular reflection in lidar signals. J. Geophys. Res., 115,
D22209, doi:10.1029/2009JD013383.
Reinking, R. F., S. Y. Matrosov, R. A. Kropfli, and B. W. Bartram,
2002: Evaluation of a 458 slant quasi-liner radar polarizationstate for distinguishing drizzle droplets, pristine ice crystals,
and less regular ice particles. J. Atmos. Oceanic Technol., 19,
296–321.
Rogers, D. C., and G. Vali, 1987: Ice crystal production by
mountain surfaces. J. Climate Appl. Meteor., 26, 1152–1168.
Sassen, K., 1984: Deep orographic cloud structure and composition
derived from comprehensive remote sensing measurements.
J. Climate Appl. Meteor., 23, 568–583.——, and S. Benson, 2001: A midlatitude cirrus cloud climatology
from the Facility for Atmospheric Remote Sensing. Part II:
Microphysical properties derived from lidar depolarization.
J. Atmos. Sci., 58, 2103–2112.
——, Z. Wang, V. I. Khvorostyanov, G. L. Stephens, and
A. Bennedetti, 2002: Cirrus cloud ice water content radar al-
gorithm evaluation using an explicit cloud microphysical
model. J. Appl. Meteor., 41, 620–628.
——, V. K. Kayetha, and J. Zhu, 2012: Ice cloud depolarization for
nadir and off-nadir CALIPSO measurements. Geophys. Res.
Lett., 39, L20805, doi:10.1029/2012GL053116.
Shupe, M. D., S. Y. Matrosov, and T. Uttal, 2006: Arctic mixed-
phase cloud properties derived from surface-based sensors
at SHEBA. J. Atmos. Sci., 63, 697–711.
Stein, T. H. M., J. Delanoe, and R. J. Hogan, 2011: A comparison
among four different retrieval methods for ice-cloud proper-
ties using data from CloudSat, CALIPSO, and MODIS.
J. Appl. Meteor. Climatol., 50, 1952–1969.Stephens, G. L., and Coauthors, 2008: CloudSat mission: Perfor-
mance and early science after the first year of operation.
J. Geophys. Res., 113, D00A18, doi:10.1029/2008JD009982.
Westbrook, C. D., A. J. Illingworth, E. J. O’Connor, and R. J.
Hogan, 2010: Doppler lidar measurements of oriented planar
ice crystals falling from supercooled and glaciated layer
clouds. Quart. J. Roy. Meteor. Soc., 136, 260–276, doi:10.1002/
qj.528.
Westwater, E. R., Y. Han, M. D. Shupe, and S. Y. Matrosov, 2001:
Analysis of integrated cloud liquid and precipitable water
vapor retrievals from microwave radiometers during the Sur-
face Heat Budget of the Arctic Ocean project. J. Geophys.
Res., 106 (D23), 32 019–32 030.
Woods, C. P., M. T. Stoelinga, J. D. Locatelli, and P. V. Hobbs,
2005: Microphysical processes and synergistic interaction be-
tween frontal and orographic forcing of precipitation during
the 13 December 2001 IMPROVE-2 event over the Oregon
Cascades. J. Atmos. Sci., 62, 3493–3519.
Zhou, C., P. Yang, A. E. Dessler, Y. Hu, and B. A. Baum, 2012:
Study of horizontally oriented ice crystals with CALIPSO
observations and comparisonwithMonteCarlo radiative transfer
simulations. J. Appl. Meteor. Climatol., 51, 1426–1439.
OCTOBER 2013 MARCHAND ET AL . 2351


![[Chu] Backscattering Spectrometry](https://static.fdocuments.in/doc/165x107/553e2752550346b9308b4919/chu-backscattering-spectrometry.jpg)