
Enhanced Power System State Estimation Techniques...
66
Enhanced Power System State Estimation Techniques for the Incorporation of Variable Energy By Reshma Francy A Thesis Presented to the Masdar Institute of Science and Technology in Partial Fulfillment of the Requirements for the Degree of Master of Science In Engineering Systems and Management © 2013 Masdar Institute of Science and Technology All rights reserved
Transcript of Enhanced Power System State Estimation Techniques...

Enhanced Power System State Estimation
Techniques for the Incorporation of Variable Energy
By
Reshma Francy
A Thesis Presented to the
Masdar Institute of Science and Technology
in Partial Fulfillment of the Requirements for the Degree of
Master of Science
In
Engineering Systems and Management
© 2013 Masdar Institute of Science and Technology
All rights reserved


Abstract
For many decades, state estimation has been a critical technology in the energy management systems
utilized by transmission system operators. Over time, it has become a mature technology that provides
an accurate representation of system state under fairly stable and well understood system operation.
The integration of variable energy resources such as wind and solar generation, however, introduce new
dynamics and uncertainties into the system. Along with increase in variability which needs real time
monitoring, state estimation will be extended to the distribution networks which increase the size of the
problem. Conventional solutions to this problem result in large problem sets being solved at a faster
rate thereby becoming computationally intensive. This thesis builds upon the Weighted least Square
approach to SE and enhances the approach to SE by combining the concepts of event triggering, tracking
update mechanism and incorporation of weather information. The result of the thesis is a SE which can
overcome the challenges of novelty or variability, complexity and weather events which threaten the
reliability of the power grids.
ii

This research was supported by the Government of Abu Dhabi to help fulfill the vision of the late
President Sheikh Zayed Bin Sultan Al Nahyan for sustainable development and empowerment of the
UAE and humankind.
iii

Acknowledgments
I would like to thank the Almighty for giving me a blessed life and for his guidance throughout my course
in Masdar. I am indebted to my father Mr. Francy Joseph and mother Mrs. Mini Francy who brought
me into this world. I wish to extend my gratitude to Dr. Amro M. Farid, my advisor, without whom this
thesis would not have been possible and Dr. Kamal Yocef-Toumi who contributed his precious time and
effort to be present at the joint workshops held every semester. I am grateful to Dr. Ambrose Adegbege
who was part of my research team for his valuable input during the first year of my work in Masdar.
I am also thankful to my fiance for his support through the difficult times I faced. Also I would like to
thank my research team and all the friends from around the world whom I met here in Masdar.
Reshma Francy, Masdar City, May 15, 2013.
iv

Contents
1 Introduction 1
1.1 Research Motivation . . . . . . . . . . . . . . . . . . . . . . . . . . . . . . . . . . . . 1
1.2 Research Objectives and Questions . . . . . . . . . . . . . . . . . . . . . . . . . . . . . 3
1.3 Research Approach . . . . . . . . . . . . . . . . . . . . . . . . . . . . . . . . . . . . . 4
1.4 Research Scope . . . . . . . . . . . . . . . . . . . . . . . . . . . . . . . . . . . . . . . 4
1.5 Novelty and Contribution . . . . . . . . . . . . . . . . . . . . . . . . . . . . . . . . . . 6
1.6 Thesis Organization . . . . . . . . . . . . . . . . . . . . . . . . . . . . . . . . . . . . . 6
2 Background 8
2.1 Evolving Measurement & Communication Technologies in Power Grids . . . . . . . . . 8
2.1.1 Supervisory Control & Data Acquisition . . . . . . . . . . . . . . . . . . . . . . 9
2.1.2 Enhanced Measurement Devices . . . . . . . . . . . . . . . . . . . . . . . . . . 10
2.1.3 Enhanced Communication Technologies . . . . . . . . . . . . . . . . . . . . . . 10
2.1.4 Enhanced Data Processing . . . . . . . . . . . . . . . . . . . . . . . . . . . . . 11
2.2 Classification . . . . . . . . . . . . . . . . . . . . . . . . . . . . . . . . . . . . . . . . 11
2.2.1 Static State Estimators . . . . . . . . . . . . . . . . . . . . . . . . . . . . . . . 11
2.2.2 Dynamic State Estimation . . . . . . . . . . . . . . . . . . . . . . . . . . . . . 12
2.3 VER systems . . . . . . . . . . . . . . . . . . . . . . . . . . . . . . . . . . . . . . . . 13
2.4 Relevant Tools Used . . . . . . . . . . . . . . . . . . . . . . . . . . . . . . . . . . . . 14
2.4.1 WLS Algorithm . . . . . . . . . . . . . . . . . . . . . . . . . . . . . . . . . . 15
2.4.2 Event Triggering . . . . . . . . . . . . . . . . . . . . . . . . . . . . . . . . . . 17
v
2.4.3 Western Electric Rules . . . . . . . . . . . . . . . . . . . . . . . . . . . . . . . 17
2.4.4 Tracking . . . . . . . . . . . . . . . . . . . . . . . . . . . . . . . . . . . . . . 18
2.5 Chapter Summary . . . . . . . . . . . . . . . . . . . . . . . . . . . . . . . . . . . . . . 18
3 Implementation of Event Triggered State Estimation 20
3.1 Triggering Criterion . . . . . . . . . . . . . . . . . . . . . . . . . . . . . . . . . . . . . 21
3.2 Simulation Methodology . . . . . . . . . . . . . . . . . . . . . . . . . . . . . . . . . . 22
3.3 Results . . . . . . . . . . . . . . . . . . . . . . . . . . . . . . . . . . . . . . . . . . . . 24
3.4 Chapter Summary . . . . . . . . . . . . . . . . . . . . . . . . . . . . . . . . . . . . . . 26
4 Implementation of Event Triggered Tracking State Estimation 27
4.1 ETTSE Algorithm . . . . . . . . . . . . . . . . . . . . . . . . . . . . . . . . . . . . . . 27
4.2 Methodology and Results . . . . . . . . . . . . . . . . . . . . . . . . . . . . . . . . . . 28
4.2.1 Methodology . . . . . . . . . . . . . . . . . . . . . . . . . . . . . . . . . . . . 28
4.2.2 Results . . . . . . . . . . . . . . . . . . . . . . . . . . . . . . . . . . . . . . . 29
4.3 Chapter Summary . . . . . . . . . . . . . . . . . . . . . . . . . . . . . . . . . . . . . . 31
5 Weather Aided State Estimation 32
5.1 Motivation . . . . . . . . . . . . . . . . . . . . . . . . . . . . . . . . . . . . . . . . . . 32
5.2 Methodology . . . . . . . . . . . . . . . . . . . . . . . . . . . . . . . . . . . . . . . . 34
5.2.1 Collect Weather Data . . . . . . . . . . . . . . . . . . . . . . . . . . . . . . . . 35
5.2.2 Process Weather Information . . . . . . . . . . . . . . . . . . . . . . . . . . . . 36
5.2.3 Execute Power Generation/Consumption Function . . . . . . . . . . . . . . . . 36
5.2.4 Power Flow Analysis . . . . . . . . . . . . . . . . . . . . . . . . . . . . . . . . 37
5.2.5 Process the Results of the Power Flow Analysis . . . . . . . . . . . . . . . . . . 37
5.3 Modelling . . . . . . . . . . . . . . . . . . . . . . . . . . . . . . . . . . . . . . . . . . 38
5.4 Results . . . . . . . . . . . . . . . . . . . . . . . . . . . . . . . . . . . . . . . . . . . . 40
5.5 Chapter Summary . . . . . . . . . . . . . . . . . . . . . . . . . . . . . . . . . . . . . . 43
6 Conclusion and Future Work 44
6.1 Conclusions . . . . . . . . . . . . . . . . . . . . . . . . . . . . . . . . . . . . . . . . . 44
6.1.1 Objectives Achieved . . . . . . . . . . . . . . . . . . . . . . . . . . . . . . . . 44
6.1.2 Novel Contributions . . . . . . . . . . . . . . . . . . . . . . . . . . . . . . . . 45
6.2 Future Work . . . . . . . . . . . . . . . . . . . . . . . . . . . . . . . . . . . . . . . . . 46
vi

6.2.1 Future Academic Work . . . . . . . . . . . . . . . . . . . . . . . . . . . . . . . 46
6.2.2 Industrial Application . . . . . . . . . . . . . . . . . . . . . . . . . . . . . . . 46
vii

List of Tables
3.1 Computation time of the three SE approaches . . . . . . . . . . . . . . . . . . . . . . . 26
3.2 Relative error of the two SE approaches compared to FSE . . . . . . . . . . . . . . . . . 26
4.1 Relative error of the two SE approaches compared to FSE . . . . . . . . . . . . . . . . . 29
4.2 Computation time of the three SE approaches . . . . . . . . . . . . . . . . . . . . . . . 29
viii
List of Figures
1.1 The Wester Electric Grid U.S.A . . . . . . . . . . . . . . . . . . . . . . . . . . . . . . 2
1.2 The block diagram of the EMS . . . . . . . . . . . . . . . . . . . . . . . . . . . . . . . 5
2.1 Outline of the SCADA application in Power Grid monitoring . . . . . . . . . . . . . . . 9
2.2 Variation in phase angle in Texas Independent Synchrophasor Network on April 4,2009 . 14
3.1 IEEE 14 bus system . . . . . . . . . . . . . . . . . . . . . . . . . . . . . . . . . . . . . 23
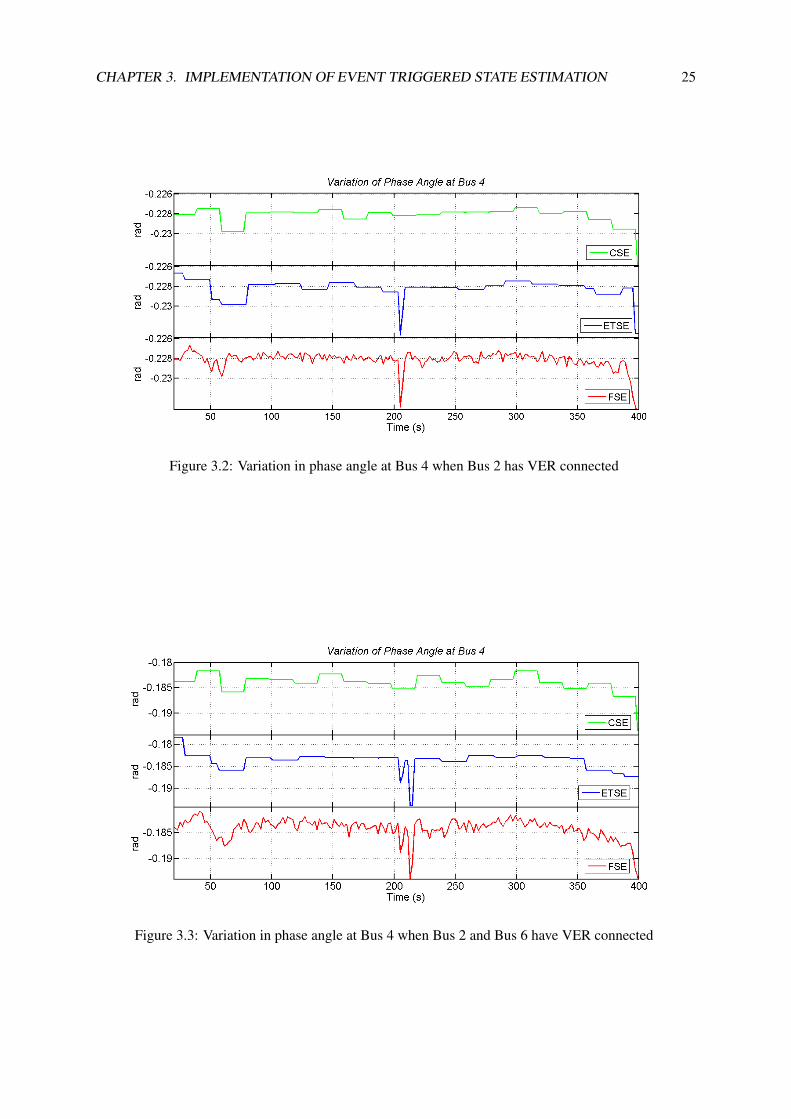
3.2 Variation in phase angle at Bus 4 when Bus 2 has VER connected . . . . . . . . . . . . 25
3.3 Variation in phase angle at Bus 4 when Bus 2 and Bus 6 have VER connected . . . . . . 25
4.1 Variation in the phase angle at Bus 5 presented by the different SE approaches for Case 1 30
4.2 Variation in the phase angle at Bus 5 presented by the different SE approaches for Case 2 30
4.3 Variation in the update provided by ETTSE compared to the update provided by FSE for
wind profile in Case 1 . . . . . . . . . . . . . . . . . . . . . . . . . . . . . . . . . . . . 30
5.1 Block diagram of integration of WASE . . . . . . . . . . . . . . . . . . . . . . . . . . . 33
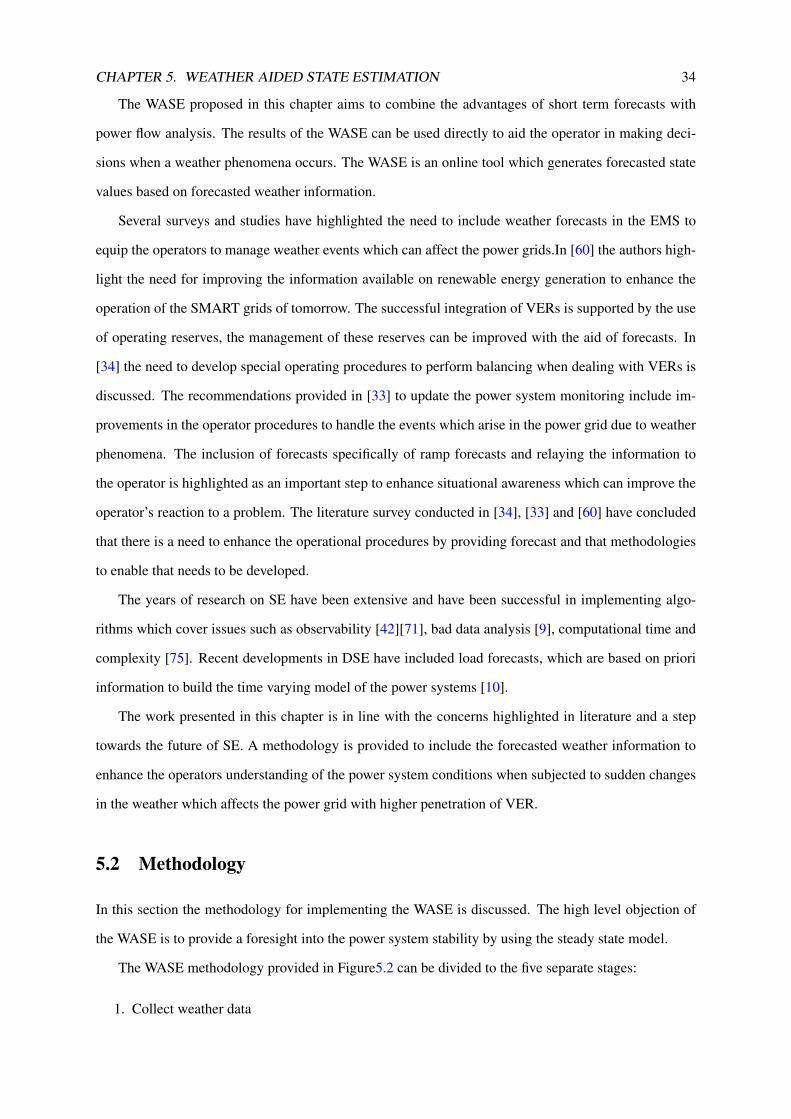
5.2 Block diagram of proposed WASE methodology . . . . . . . . . . . . . . . . . . . . . . 35
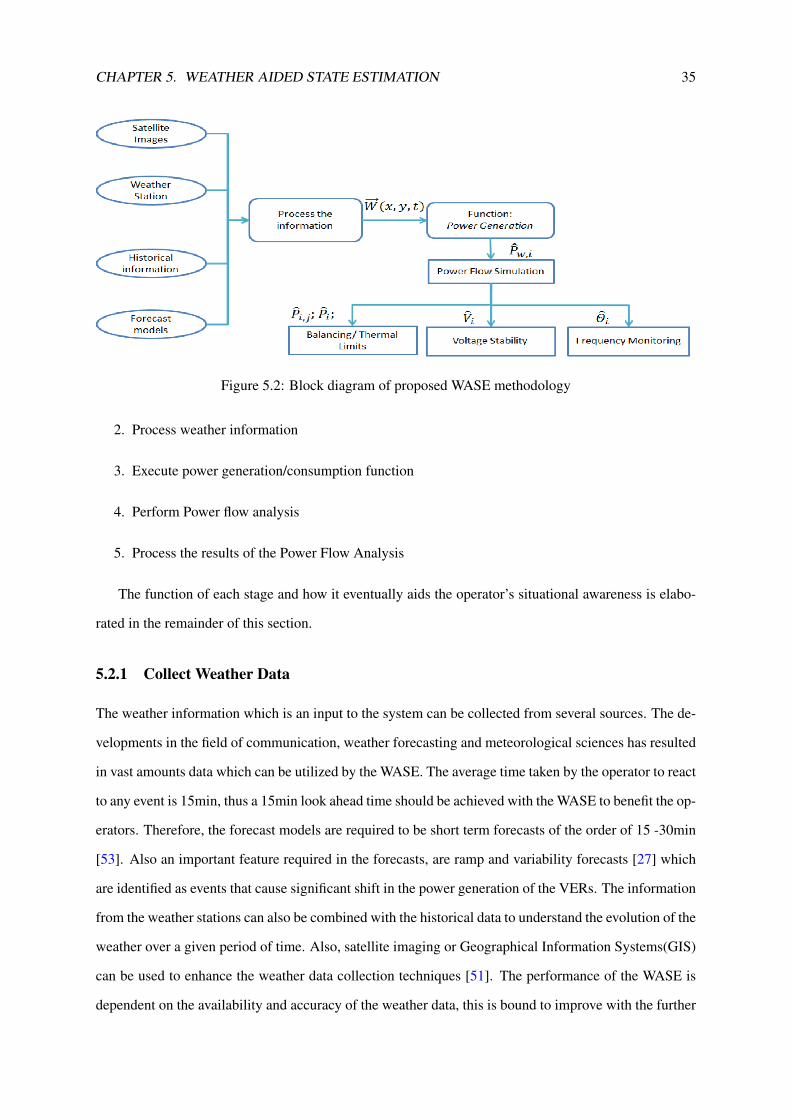
5.3 Collection of weather data . . . . . . . . . . . . . . . . . . . . . . . . . . . . . . . . . 36
5.4 The power function which can be adopted to generate the power injection profile . . . . 37
5.5 Processing of the powerflow results . . . . . . . . . . . . . . . . . . . . . . . . . . . . 38
5.6 Graphical representation of the WASE weather modeling . . . . . . . . . . . . . . . . . 39
5.7 Forecasted power generation profile . . . . . . . . . . . . . . . . . . . . . . . . . . . . 41
5.8 Collection of generator parameters from the power flow analysis . . . . . . . . . . . . . 41
ix

5.9 Collection of voltage and phase angle from the power flow analysis . . . . . . . . . . . . 42
5.10 List of essential parameters of critical buses and tie lines . . . . . . . . . . . . . . . . . 42
x

CHAPTER 1
Introduction
Every large complex system requires a monitoring system to provide the information necessary to en-
sure reliable operation. In power systems, the bus voltage and phase angles are identified as the state
of the power system. Real time accurate estimates of the states enable the calculation of power flow
between the branches, the power injections at the buses and other important parameters. The method of
estimating the state is called state estimation (SE) and this forms the core of every Energy Management
System (EMS) today. The advantage of the state estimator is that it provides a means to monitor all the
parameters of the power system, with fewer real time measurements from the field. The state estimator,
therefore, becomes the key component of the monitoring system used in power grids.
In this thesis, the existing techniques and practices in the field of SE are reviewed and built upon
to arrive at new approaches to achieve real time system state updates. The remainder of this chapter
provides the research motivation in Section 1.1, followed by the research objectives and questions in
Section 1.2 . Section 1.3 provides a brief description of the research approach adopted and Section 1.4
provides the scope of the research. Section 1.5 points out the novelty of the research contribution and
lastly in Section 1.6outlines the remainder of the thesis.
1.1 Research Motivation
In recent years, the power generation portfolio has expanded to include Variable Energy Resources
(VERs) such as wind and solar generation to meet increasing energy demand and environmental objectives[19].
1
CHAPTER 1. INTRODUCTION 2
Figure 1.1: The Wester Electric Grid U.S.A
These sources inject uncertain amounts of power at time scales faster and generally dissimilar to that
previously found in typical load profiles [19]. As a result, in order to keep the balance of load and gener-
ation, the state of all power system buses becomes highly variable. Under these conditions conventional
measurement and state estimation (SE) techniques which perform the update of the states only at regu-
lar intervals [19] may introduce errors which may impede the acquisition of an accurate picture of the
system state; thus further impairing downstream situational awareness and decision making [19].
Traditionally, state estimation as a monitoring technique has only been implemented in the bulk
electric or transmission system. VER penetration is likely to challenge this status quo. As a network,
the transmission system is generally meshed in structure [28] and represents comparatively few nodes
per geographic area. The distribution system on the other hand is extremely radial in structure and
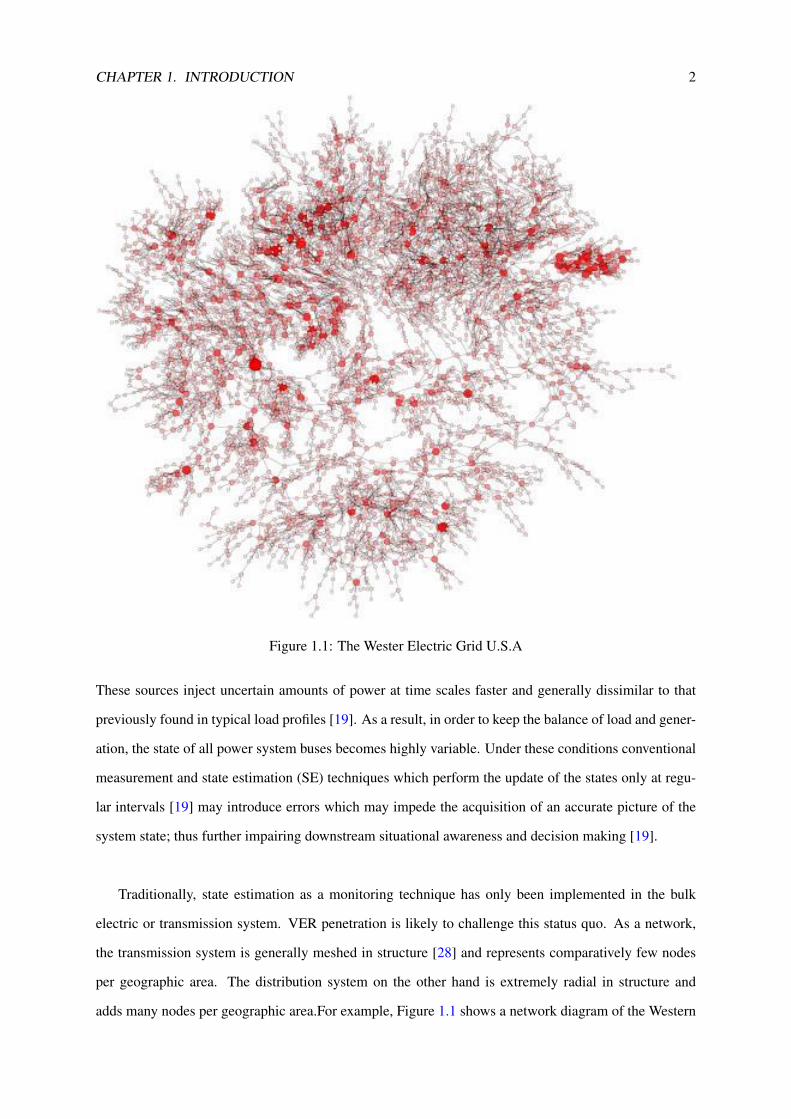
adds many nodes per geographic area.For example, Figure 1.1 shows a network diagram of the Western

CHAPTER 1. INTRODUCTION 3
Interconnection Electric grid of the U.S.A. Each red dot on the grid represents a node in the network. The
size of the network increases dramatically with the inclusion of distribution systems at the periphery of
the system. Unlike large scale thermal generation, VERs are often implemented as distributed generation
(DG) near this periphery; thus motivating the need for a monitoring system that extends to include the
distribution system.
Such an increase in the size of the network under observation increases the computational load on
existing algorithms for SE. Meanwhile, the integration of VER to such complex networks demands real-
time decision making which requires real-time monitoring. The conventional approach of decreasing the
time interval between consecutive updates may not effectively address the real-time monitoring require-
ment. More computationally efficient solutions are necessary to avoid severe computational facilities.
The higher penetration of VER increases the vulnerability of the power systems to variability in the
weather and events such as ramp of wind speed, cumulus clouds etc. The higher impact of the weather
on the power grid requires improvements in the EMS as well. The work in this thesis aims to enhance
the features of the EMS to incorporate features to improve operator’s awareness to such events.
1.2 Research Objectives and Questions
From the motivation presented in Section 1.1, the following research objective is outlined for the thesis:
Research Objective: To develop enhanced power system state estimation techniques that mitigate
the challenges posed by the integration of VER into the power grid.
These challenges as previously described in the motivation include: novelty, complexity and abrupt
weather phenomena.
• Novelty: The variability of the VER introduces considerable novelty in the system measurements.
• Computational Complexity: Expansion of the power system network which increases the prob-
lem size.
• Weather Phenomena: Higher penetration of VER in power grids leaves it vulnerable to weather
phenomena.
Based on the challenges which are identified, research questions were created to address them:
Research Question 1. How can a Classical State Estimation (CSE) algorithm be enhanced to account
for the novelty introduced by VER?

CHAPTER 1. INTRODUCTION 4
Research Question 2. How can a CSE be enhanced to reduce computational load when addressing
large complex networks?
Research Question 3. How can CSE be enhanced with new weather based information to improve the
operators awareness and reaction to weather events?
1.3 Research Approach
State Estimation is an iterative algorithm which uses principles of optimization to estimate the states
from a measurement set which becomes the input to the SE. In this thesis, the CSE[64], which reflects
the industrial practice is taken as a starting point. Further details on its formulation are provided in
Chapter 2. It is then enhanced to address each of the research questions posed in Section 1.2. The
different approaches corresponding to the research questions are as follows:
• Event Triggered State Estimation (ETSE):This approach introduces a triggering mechanism
when there exists sufficient novelty in the power system measurements.
• Event Triggered Tracking State Estimation(ETTSE):This approach introduces a computationally
efficient updating mechanism between successive state estimation triggers.
• Weather Aided State Estimation (WASE):This approach utilizes available weather forecasts to
present operators with advance information on abrupt weather events.
Throughout the thesis, a Fast State Estimator (FSE) is defined as an ideal case, where the updates are
performed for every instant that the measurements are received. The remaining approaches are compared
to the FSE to measure their performance and advantages.
1.4 Research Scope
The focus of this research is to enhance the SE approaches by taking the inputs to be the same as found
in literature, with the exception of the WASE. The scope of the work in this thesis is limited to the SE
which is placed within the EMS as shown in the Figure 1.2.

CHAPTER 1. INTRODUCTION 5
Figure 1.2: The block diagram of the EMS
The following assumptions are made which dictates the boundary of the research:
• Observability: This defines the case when the available measurement sets are sufficient to de-
termine the states of the entire network. Several methods are being developed to ensure state of
the art algorithms that can identify the complete measurement set and ensure the success of the
state estimation which is carried out. In this thesis the measurement set adopted is tested to ensure
observability, as described in Chapter 2 and no additional work is done for the same.
• Bad Data Analysis:This step is performed to determine the accuracy of the estimates. In reality,
the SCADA (Supervisory Control And Data Acquisition) measurements brought to the SE can be
erroneous or time skewed. In any application of SE it is essential to check the estimates before
being sent for decision making. In this work the SCADA measurements are provided with a
Gaussian distribution error and therefore does not require Bad Data Analysis.

CHAPTER 1. INTRODUCTION 6
• Weather forecast:The weather information used in WASE is added to the system as an input.
There was no work performed on the forecast techniques, the thesis assumes that weather forecast
variables such as temperature, wind speed, irradiance etc. is a time varying spatial map.
1.5 Novelty and Contribution
This thesis represents a novel contribution in regards to all three research questions.
• Trigger Criteria: The Event Triggered State Estimation derives inspiration from the work in [36]
and introduces the trigger criteria which is based on the Western Electric Rules [74]. This specific
trigger criteria is new to literature [24]
• Combination of Trigger Criteria and Tracking: The work of Fred Schweppe in [63] is ex-
panded to the trigger criteria introduced in this thesis. The combination of the two ensures faithful
tracking of the states without expensive computation [25]
• Implementation of Weather Aided ETTSE: The incorporation of a weather information into
state estimation also represents a novel contribution. It can run online and in parallel to the ETTSE
to enhance the situational awareness of the operators. The emphasis is on the benefits to the control
centers if there is sufficient sharing of information between the meteorological department and the
power control centers.
1.6 Thesis Organization
The thesis is explained over the remaining 6 chapters:
• Chapter 2 gives the necessary background information about the field of SE. The literature gap is
identified to support the work done in the remaining chapters.
• Chapter 3 presents the implementation of an Event Triggered State Estimation (ETSE) for power
networks incorporating VER. The proposed framework represents an improvement over Classical
State Estimation (CSE) as it captures the variability associated with the VER while maintaining a
high fidelity of the power network states. The efficacy of the ETSE is demonstrated as compared
to existing CSE on a standard IEEE 14 bus system.
• Chapter 4 builds upon the work of event-triggering in Chapter 3. Specifically, the concept of
tracking saves significant computational effort at minimal expense of error by allowing for the

CHAPTER 1. INTRODUCTION 7
update of system state between two consecutive triggered instances. The new event-triggered
tracking state estimator (ETTSE) is demonstrated on the standard IEEE 14-bus system and the
results are observed for an arbitrarily chosen bus. Finally, the update provided by the ETTSE, at
each step is observed to highlight the benefit of the new scheme.
• Chapter 5 introduces the concept of bringing together the area of weather forecast and commu-
nication of weather events to the SE algorithms.The incorporation of The Weather Aided State
Estimator (WASE) is run in parallel to the ETTSE to provide warnings or alerts to the operators
to enhance their reaction to weather events. The WASE is used to augment the performance of the
ETTSE by determining the instances to trigger based on the forecasted data.
• Chapter 6 provides the conclusions drawn from the work presented in the thesis along with the
area of future work.

CHAPTER 2
Background
This chapter provides the literature upon which the work presented in this thesis is developed in four
parts. First,the complimentary measurement system which provides the input to the SE is described in
Section 2.1.1. Next, Section 2.2 provides the classification of SE approaches found in the literature.
The area of SE has been widely researched since the introduction of the idea to power systems by Fred
Schweppe. In order to put in context the contribution of this thesis, it is important to describe the several
versions of SE that have emerged from years of research in this field. Thirdly, Section 2.3 illustrates the
VER model which is adopted in later in the case study simulation. Finally, the tools used for building the
three flavours of SE presented in this thesis are presented in Section 2.4. The concept of Event Triggered
State estimation from existing literature is provided in Section 2.4.2 along with the brief overview of the
WER and the application of the same is presented in 2.4.3. The concept of tracking is introduced in
Section 2.4.4.
2.1 Evolving Measurement & Communication Technologies in Power Grids
For decades the field of monitoring and control for power grids has been dominated by SCADA systems[39].
The deregulation of the power grids along with the integration of VER has triggered improvements in
the SCADA design. The changing needs of the power grid monitoring systems have given rise to new
technology such as synchrophasor devices [17].
8

CHAPTER 2. BACKGROUND 9
2.1.1 Supervisory Control & Data Acquisition
Power grids are large complex infrastructure systems and have buses which are geographically dis-
tributed which require measurements to be centralized from remote points to the central control center.
The measurements collected are used as inputs to the SE algorithm.The system responsible for this task
is called SCADA:Supervisory Control And Data Acquisition[1]. The main components of the SCADA
system are as follows:
• Remote Terminal Units: Collect the data from the remote locations.
• Communication Network: Allows the half duplex communication between the various devices in
the system at the different levels.
• Master Terminal Unit: Processes the information from the remote location and produce informa-
tion to display.
• Operator Console: Delivers the information to the operator.
RTUs and MTUs are data processing units which can communicate with one another through the
communication network of the SCADA. The processed information is provided to the operator through
the operator console. In the context of the application of SCADA to SE, the RTU collects the data from
the sensors on the field and relays the data to the MTU through the communication network. The MTU
provides the necessary data to the SE algorithm. The output which is the state vector is provided to the
display units at the operator console. The block diagram depicting the application is provided in Figure
2.1.
Figure 2.1: Outline of the SCADA application in Power Grid monitoring
Despite the heavy reliance on SCADA as a mature and extensively adopted technology, they do suf-
fer from some technical limitations especially in legacy implementations[38]. The data relayed through
SCADA suffer from unsynchronized data, data loss and measurement error. Also, there is a need to have
faster control and protection systems which cannot be supported by the current SCADA design [72].

CHAPTER 2. BACKGROUND 10
2.1.2 Enhanced Measurement Devices
The recent development in the area of power system measurement is the Phasor Measurement Unit
(PMU) which is based on synchrophasor technology[17]. Synchrophasor technology makes use of time
synchronizing techniques, coupled with the computer-based measurement technique, to measure the
magnitude and phase angle differences in real time [58] [71]. The PMU provides time stamped data
sampled at the rate of 60 samples per second which provides real time monitoring of the parameter
being measured. The PMU has a positive effect on the accuracy of SE algorithms, several SE algorithms
which take into account the data provided by the PMU [59] have been developed. The other applications
of PMU which include fault detection [16], line outage detection [70], overall stability monitoring [48].
The PMU has several advantages while at the same time faces challenges which prevent the large
scale implementation in the power grid. Though the PMU provides synchronized data, the amount
of data which is produced due to its higher sampling time results in communication overheads and
communication networks have to be updated to handle the extra flow of information [32]. The other
factors such as calibration of the equipment and developing testing methods are still in the nascent phase
and also inhibit the implementation of PMU in the grid [69].
2.1.3 Enhanced Communication Technologies
The concept of SMART grids is placing new demands on the information and communication technolo-
gies applied in power systems The dominance of SCADA is being replaced by a heterogeneous land-
scape of communication technologies which enable faster communication and reduce the latency[77].
The communication network and protocols are being updated to include communication over power
lines [21], fiber optics [68], wireless communication [8] and cognitive radio among others [30].
Also, the needs of two way communication and automation of the controls have resulted in the re-
placement of the SCADA architecture with Advanced Metering Infrastructure (AMI)[3]. This addresses
the key concerns of implementing demand side management and faster automated control actions which
is limited in SCADA [65].
The improvements in the measurement technologies supported by the improvements in communica-
tion enable collection of large amounts of data which calls for enhanced data processing.

CHAPTER 2. BACKGROUND 11
2.1.4 Enhanced Data Processing
The new landscape of measurement and communication technologies have resulted in enhancements in
the data processing involved to produce useful information. The main function of the ICT enabled in
the EMS of the power system is to ensure the reliable operation of the grid. Therefore the conversion of
the large volumes of data into useful information to aid the operators actions is an essential part of the
EMS.
The need for enhanced data processing due to the enhancements in ICT has led to the work in the
field of Wide Area and Monitoring Systems (WAMS) [61]. The WAMS complements the SCADA to
enable faster processing of the data[12] [76]. Also, the Real Time Dynamics Monitoring System is
another platform created to enhance the visibility of the power system with the help of the new metering
devices [2].
2.2 Classification
The decades of research in the area of SE have resulted in the creation of a variety of SE algorithms
and approaches. Literature reviews on the types of SE algorithms are presented in [66] [52] [73] and
[23]. SE also has different approaches based on application of the algorithms such as Conventional SE
[52], Distributed SE or Multi Area State Estimation(MASE)[29]. SE algorithms are broadly classified
into Static State Estimator (SSE) and Dynamic State Estimator (DSE). A brief overview of the two are
provided below:
2.2.1 Static State Estimators
Static state estimation assumes the power system to be quasi-static, which implies the system state
stays constant between the two consecutive updates of the state vector. Therefore, to improve real time
monitoring of the grid the updates need to be performed within shorter intervals. The most widely
used form of SSE in industry is the weighted least square (WLS) method [73]. It is formulated as an
optimization problem which attempts to reduce the least square error between the measurement set and
the estimate calculated using the corresponding power flow equations. The WLS uses the Newton-
Raphson algorithm to arrive at the state estimates and is elaborated further in Section 2.4.1.
The literature does provide variations of the WLS, each trying to improve specific aspects of the
WLS. The Fast Decoupled State Estimator [31][26] is one such variation in which the voltage and phase
angles are processed separately. The voltage values are concerned with the reactive measurements such

CHAPTER 2. BACKGROUND 12
as the reactive power injection and reactive power flow. On the other hand, phase angles are related to
the active power injection and active power flow. The algorithm enables parallel processing which can
improve computation time. The Regularized Least Square for power systems proposed in [15] proposes
a variation of the WLS which addresses the issue of observability and is able to function in the case of
partial observability. Static SE also includes the Sequential SE which has the advantage of being able
to perform updates with partial measurement set. These sequential SE addresses the problem with bad
data and loss of data.
Algorithms other than the Newton Raphson are also used to solve the WLS.In [37] the Levenberg
MarquardtLM) algorithm is used to solve the WLS representation of the problem for ill conditioned
systems or in other words systems which do not have complete observability.
The work presented in this thesis adopts the work presented in [64] [62] where WLS is used to
represent the estimation as a least square optimization solved using Newton Raphson method [29]. Also
the Static SE that performs the update at regular intervals is modified and the emphasis is on how the
triggering mechanism is performed.
2.2.2 Dynamic State Estimation
Dynamic State Estimation (DSE) is a step closer to real time monitoring when compared to SSE. There
are two parts to the DSE: Prediction and Filtering [66]. The prediction of the state variables involves the
modeling of the power system behavior. The prediction is calculated based on a mathematical model
which takes into account the nonlinearities of the measurement functions unlike in SSE where a linear
model is developed for the ease of computation [45]. The power system incorporating nonlinearity of
the power flow equations increases the computational expense of the DSE and therefore is not widely
implemented in reality [80].
The algorithms used to perform the prediction include Artificial Neural networks [67] and Fuzzy logic
[43] which are also computationally complex. However, their accuracy is questionable when there are
random events such as in the case of VER or load fluctuations[55].
The second part of a DSE includes the filters used to filter out the bad data by combining the pre-
dicted information along with the actual measurements on arrival. The Extended Kalman Filter is widely
used to perform this filtering [79].There are several other methods which are provided in literature. The
DS is well suited when the dynamics of the power system are smooth and follow the historical trend.
The variations which are stochastic such as fluctuations by VERs, weather related load fluctuations, fluc-
tuations caused by charging of electric vehicles etc. are not easily addressed. Therefore, in this thesis

CHAPTER 2. BACKGROUND 13
the theory of SSE is adopted and enhanced to fit the challenges outlined in Chapter 1.
2.3 VER systems
The variability introduced by solar and wind generation necessitates the need for improved real-time
monitoring so as to improve situational awareness, decision-making and automatic control[19]. These
sources are called variable because of two complimentary characteristics: uncertainty and intermittency.
They are uncertain in that their inputs of solar irradiance and wind speed are stochastic in nature and
hence require prediction. Forecast model accuracy for wind or solar energy has improved in recent years
and remains as a field of active research [53][14]. VERs are intermittent in the sense that they are not
dispatch able like conventional generators and hence introduce a new set of dynamics into the power
grid.
In order to incorporate VERs into studies on SE, a stochastic input-to-output model of the VER is
required. This paper presents a model for wind generation although a similar approach may be taken for
solar generation. In-built controllers can reduce the variability in the wind power output, but wind speed
ramps or sudden gusts may still cause significant fluctuations.
The model used within this work is as follows. The power output of a wind turbine is related to the
wind velocity via [35]
Pw(v) =12×µAv3 (2.1)
Here, Pw(v) is the wind power; µ is the air density; A the area of cross section of the flow tube. The
wind power is related to the mechanical power Pm from the turbine through the following [35]:
Pm =Cv×Pw(v) (2.2)
The turbine coefficient Cv depends on the turbine design and could be modeled as non-linear alge-
braic equation [50] [44]. The electrical power output is proportional to the mechanical power of the
turbine through :
Pe = η×Pm (2.3)
where η is the generator efficiency and it varies with the choice of generator [5].
Any change in the active power injection at a bus will affect the state variables throughout the system.
In [4], the effect of wind generation on the phase angle is established using field data from an experi-
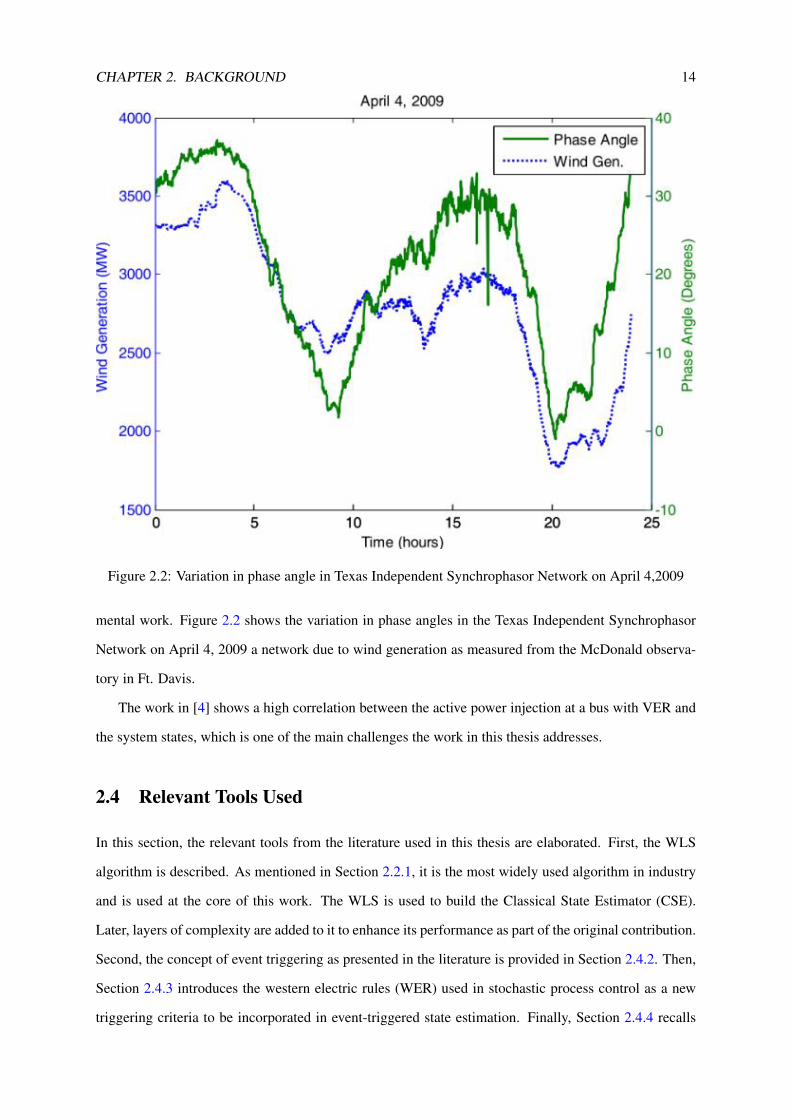
CHAPTER 2. BACKGROUND 14
Figure 2.2: Variation in phase angle in Texas Independent Synchrophasor Network on April 4,2009
mental work. Figure 2.2 shows the variation in phase angles in the Texas Independent Synchrophasor
Network on April 4, 2009 a network due to wind generation as measured from the McDonald observa-
tory in Ft. Davis.
The work in [4] shows a high correlation between the active power injection at a bus with VER and
the system states, which is one of the main challenges the work in this thesis addresses.
2.4 Relevant Tools Used
In this section, the relevant tools from the literature used in this thesis are elaborated. First, the WLS
algorithm is described. As mentioned in Section 2.2.1, it is the most widely used algorithm in industry
and is used at the core of this work. The WLS is used to build the Classical State Estimator (CSE).
Later, layers of complexity are added to it to enhance its performance as part of the original contribution.
Second, the concept of event triggering as presented in the literature is provided in Section 2.4.2. Then,
Section 2.4.3 introduces the western electric rules (WER) used in stochastic process control as a new
triggering criteria to be incorporated in event-triggered state estimation. Finally, Section 2.4.4 recalls

CHAPTER 2. BACKGROUND 15
the tracking state estimation formulation adopted from [63] for later use in the event-triggered tracking
state estimator in Chapter 4.
2.4.1 WLS Algorithm
Classical state estimation as applied to power systems was originally introduced in [64]. Since then,
it has gained widespread adoption in industry and has received much developmental attention in the
literature [66] [73]. Here, the classical variant of the power system state estimation is presented as a
weighted least square (WLS) problem solved by the common method of normal equations.
Given an N bus network, the state vector at time k is x(k) = [θ 1 . . . θ N , V1 . . .VN] where θ i
and Vi are the phase angle and voltage respectively at the it h bus. The state vector x(k) is derived from a
measurement set z(k) of length M which is obtained from the network through the SCADA system.The
measurements obtained may be of many types. These include the active power injection Pi and reactive
power injection Qi at a bus i, the active power flow Pi j and the reactive power flow Qi j between buses
i and j, voltage measurements Vi or time stamped measurements from the phasor measurement units
(PMUs) [Vi, θ i].
The measurement vector z(k) is related to the state vector x(k) through the following [64]:
z(k) = h(x(k))+ ε(k) (2.4)
where ε(k) is the measurement error at time k and it is assumed to be normally distributed such that
a weighting matrix may be constructed for the individual measurement error variances σ2 as:
W = diag(σ1−2,σ2
−2...σM−2) (2.5)
h(x(k)) is the function vector of length M that consists of the power flow equations that define power
injections into buses and flows within branches. Explicitly, they are:
Pi = |V i|n
∑j=0|V j(Gi jcos(θ i−θ j)+Bi jsin(θ i−θ j)) (2.6)
Qi = |V i|n
∑j=0|V j(Gi jsin(θ i−θ j)−Bi jcos(θ i−θ j)) (2.7)
Pi j = |V i||V j|(Gi jcos(θ i−θ j)+Bi jsin(θ i−θ j))−Gi|V i|2 (2.8)
Qi j = |V i||V j|(Gi jsin(θ i−θ j)−Bi jcos(θ i−θ j))+Bi|V i|2 (2.9)

CHAPTER 2. BACKGROUND 16
from which an Mx2N Jacobian matrix H(x) and a gain matrix G can be defined:
H(x) =∂h(x)
∂x(2.10)
G(xc) = HTWH(x) (2.11)
Prior to presenting CSE as solved by the method of normal equations, care must be taken to ensure
that the measurement set yields full observability of the network [13] [56]. The measurement set must
include a set of independent measurements of size greater than the length of the state vector i.e. M≥N
[6] . This ensures that the matrix (HT WH) is non-singular.
The WLS formulation of CSE is then presented as a minimization of the square error:
min : f = [z(k)−h(x(k))] (2.12)
s.t.zi(k) = hi(x(k))+ ε i(k) (2.13)
CSE is executed and the state vector is updated at regular intervals. The iterative Newton-Raphson
procedure used to solve for the state estimate x(k), by normal equations is presented in Algorithm 1 [6].
Algorithm 1
1. Receive z from SCADA
2. Initialise state vector x= xc and iteration counter c
3. Compute the measurement residual rc = z - h(xc)
4. Obtain H(xc) and G(xc);
5. Solve for the linear system G(xc) δxc = HT W[z-h(xc)]
6. Update the state vector and the iteration counter xi+1 +δxc; c= c+1.
7. Check stopping criterion at a maximum count cmax
8. If stopping criterion is satisfied: x = xc
For the above described algorithm to converge to the optimal solution full observability of the system
should be guaranteed. The literature has shown that the condition for full observability require for the
Gain Matrix G(xc) to be nonsingular [7] [22]. This simultaneously requires that the no. of measurements
is greater than the number of state variables to be estimated.

CHAPTER 2. BACKGROUND 17
2.4.2 Event Triggering
The concept of event triggered state estimation has been in existence in several feedback based control
systems which have highly networked communication systems [41]. The primary goal of event-triggered
state estimation in communication networks of control systems is to reduce the communication over-
heads [46]. However, in this thesis the concept of identifying the novelty in the measurement in used to
identify the events in the weather conditions which can cause considerable change in the state variables
in a power system with high penetration of VER.
The application of event triggering in the field of state estimation for power systems is relatively
new and is presented in [36]. Here, the SE is performed using the WLS algorithm only when there is
considerable novelty in the measurement. The authors[36] apply the set membership adaptive filtering
(SMAF)estimator and the trigger is set based on the novelty in the measurements. When the error
identified is higher than the predefined threshold the algorithm performs an update of the state vector
using the process of SMAF. The approach described in [36] is applied to a MASE and the results show
reduced communication overheads.
In this thesis, the approach to state estimation provided in [36] is adopted and applied to the WLS
estimation algorithm. The CSE based on WLS is enhanced to ETSE using the concept of triggering only
when an event occurs. The event triggered approach to SE is tested in a central state estimation scheme
in the presence of VER. Also, the criteria for identifying the events differs from the work in [36]. In this
thesis, the WER is implemented as the trigger criteria which is described in the following section.
2.4.3 Western Electric Rules
The Western Electric Rules (WER) are used in the analysis of control charts to monitor statistical process
control[74]. The rules are formulated to pick up non-random variations or trends in the process output
so that necessary control action can be implemented. The rules are defined with respect to a central limit
and the distance of recent measurements from the central limit. In stochastic process monitoring, the
central limit µ is taken as the average of the measurement over a period of time or the expected value of
the measurement. The WER are:
Western Electric Rules
1. If the measurement point lies outside µ ± 3σi
2. If the measurement point lies outside µ ± 2σi
3. If the measurement point lies outside µ ± σi

CHAPTER 2. BACKGROUND 18
4. If the measurement point lies outside µ
Where, σi is the standard deviation of the measurements in a given observation window. The above
given rules are modified to observe the output of the VER and used as a trigger in the ETSE proposed in
Chapter 3.
2.4.4 Tracking
The concept of tracking was first introduced in [63] where they provide an update mechanism for the
state vector in between consecutive executions of the entire WLS algorithm. The tracking mechanism
is added to the ETSE created in Chapter 1 to provide a new Event Triggered Tracking SE- ETTSE
algorithm. The advantage of applying tracking to a SE used in a power system with VER integrated to
it is shown in Chapter 4.
The tracking method utilizes the available state estimate x(k−1) and current measurement set z(k)
to evaluate the update δx which should be added to the state estimate x(k−1) to obtain x(k) .
x(k) = x(k−1)+δx (2.14)
The δx is obtained by solving the following:
δx = G−1(xt)H(xt)(W (z−h(x(k)))) (2.15)
Where xt is the state vector which is obtained from executing the WLS at time t when the trigger
is set. The inverse matrix G−1 also known as the gain matrix and the Jacobian H(xt) is calculated
only when the trigger is set and is estimated using the Algorithm 1. The Gain matrix and the Jacobian
matrix once calculated retain their value till the next event is identified. The method of tracking is
computationally less intensive as the Gain matrix is not computed for each update. The combination of
triggering and tracking provide a near real time monitoring without significant computational overheads
and is illustrated in Chapter 4.
2.5 Chapter Summary
The chapter provided an overview of the literature upon which this thesis i developed. The complimen-
tary measurement system SCADA described in The Section 2.1.1 provided the outline of the compli-
mentary measurement system also highlighted the problems faced. The new synchrophasor technology

CHAPTER 2. BACKGROUND 19
which is incorporated into the SCADA and the improvements in the communication and do not com-
pletely solve the problem of real time monitoring. Despite the improvements available in the physical
components of the monitoring systems there is a need to develop algorithms to process the large amounts
of data and convert them into useful information and address the issues of variability introduced by
VERs.
The chapter also highlights the two main types of SE which is presented in literature. Since the
thesis is aimed at providing practical and simple approach to the needs of the power systems the simple
SSE is adopted. The SSE is further enhanced with features such as event triggering and tracking which
were described in Section 2.4.

CHAPTER 3
Implementation of Event Triggered State Estimation
In this Chapter existing state estimation techniques are enhanced by building upon the recent work
on event triggered state estimation (ETSE)[36].Conventionally, the computation of classical SE occurs
at fixed intervals whereas the recently published ETSE algorithm has a varying time interval. In the
presence of VER, the regular interval based conventional SE algorithms may be unable to track the
variability associated with such VER. At the same time, reducing the interval and computing the SE
more times than required is a computationally intensive process. The concept of ETSE is to perform
state estimation only when triggered by considerable novelty” in the measurements from the field. The
ETSE algorithm in [36] addressed novelty purely on the basis of the distance between the measured and
previously estimated state. Such triggering ensures that the computational overheads are reduced and
while the dynamics of the system states are closely followed.
The remainder of the chapter develops into three sections. Section 3.1 covers the formulation of the
event-triggered state estimator while the simulation methodology is presented in Section 3.2 Section 3.3
presents the results using the IEEE 14 bus benchmark example but with VER integrated into two of the
buses. Results from the ETSE are compared against two CSE implementations of relatively slow and
fast computation intervals.
20

CHAPTER 3. IMPLEMENTATION OF EVENT TRIGGERED STATE ESTIMATION 21
3.1 Triggering Criterion
The concept of event triggered state estimation was first introduced as a technique to reduce communica-
tion overheads in distributed state estimators[36]. In contrast, in this thesis the focus is on the inclusion
of an event criterion to trigger when there is considerable novelty in the wind power output.
A number of triggering criteria can be used to capture the variability in the VER. In [36], the trigger
is set by the square root error of the current measurement and the previous estimate. Here, the event is
characterized as a considerable variation in the active power injection at the VER buses as considered
by the Western Electric Rules [74] as explained in Section2.4.3.
Here, the rules are applied to observe the active power injection at the buses with wind generation
over a window that grows in size until the conditions of the triggering criterion are met; at which point
it is reset back to a size of two.
Let the active wind power injection at time k at bus i be Pwi(k)and µ=Pwi(k)be the average of the
measurements within a given observation window of size defined as Si(k);
Si(k) =
2 τ(k−1) = 1
Si(k−1)+1 τ(k−1) = 0(3.1)
Pwi(k) =∑
Si(k)j=1 Pwi(k− j)
Si(k)(3.2)
where τ(k) is a boolean trigger which decides whether to perform state estimation upon receiving
Pwi(k) . The value of the previous trigger is used to update the window size.
The Western Electric Rules (WER) recognizes events such as ramps but cannot pick up random
events such as gusts which may result in sudden spikes. In order to capture such an event, an additional
criterion is introduced as follows:
|Pwi(k)−Pwi(k−1)| ≥ α×Pwi(k− j) (3.3)

CHAPTER 3. IMPLEMENTATION OF EVENT TRIGGERED STATE ESTIMATION 22
τ(k) =
1 Pwi(k)≥ (Pwi(k)+3σi)∨Pwi(k)≤ (Pwi(k)+3σi)
1 ∨2j=0(Pwi(k− j)≥ (Pwi(k)+2σi))≥ 2
1 ∨2j=0(Pwi(k− j)≤ (Pwi(k)−2σi))≥ 2
1 ∨4j=0(Pwi(k− j)≥ (Pwi(k)+1σi))≥ 4
1 ∨4j=0(Pwi(k− j)≤ (Pwi(k)−1σi))≥ 4
1 ∨8j=0(Pwi(k− j)≥ (Pwi(k)))≥ 8
1 ∨8j=0(Pwi(k− j)≤ (Pwi(k)))≥ 8
1 |Pwi(k)−Pwi(k−1)| ≥ α×Pwi(k− j)
0 O.W
(3.4)
The algorithm for the ETSE is as follows:
1. Receive active power measurement Pwi(k) from all the buses with wind generation
2. Update Si(k) and compute Pwi(k)
3. Update τ(k)
4. If τ(k)= 1 receive measurement set of the entire network and perform SE using Algorithm 1
5. Else if τ(k)= 0 then x(k) =x(k-1)
6. Wait for Pwi(k)
3.2 Simulation Methodology
In Section 3.1, the performance of the ETSE is studied relative to CSE by evaluating three different SE
approaches:
• The fast SE (FSE) which runs Algorithm-1 for every instant the measurement set is available (2s).
• The new ETSE which executes Algorithm-2.
• The CSE which executes Algorithm-1 every 10s.
The FSE is to mimic the real time SE and is used as a benchmark to compare the new ETSE and
CSE. The CSE is implemented to reflect the current practice in SE in energy management systems.
In each case, the wind speed follows the composite wind speed model presented in [50].This is
taken as a stochastic input to the DFIG wind turbine model provided in SimPower [47].These results are

CHAPTER 3. IMPLEMENTATION OF EVENT TRIGGERED STATE ESTIMATION 23
Figure 3.1: IEEE 14 bus system

CHAPTER 3. IMPLEMENTATION OF EVENT TRIGGERED STATE ESTIMATION 24
integrated into the IEEE 14-bus system [49] as shown in Figure3.1.The three SE approaches are tested
for two levels of VER penetration:
• when Bus 2 has VER connected,
• when Bus 2 and Bus 6 are replaced with VER.
The measurement set is obtained from the power flow analysis performed in PSAT. The measure-
ment set is defined such that the system is observable. A normally distributed measurement error of
standard deviation 0.2 and mean 0.5 is introduced to the measurement set before executing the SE. The
tuning parameter α is set to 0.25. The entire simulation is conducted within a Matlab environment on a
Windows 7 HP laptop with an Intel Core i5 CPU running at 2.27Ghz.
The results of the simulations are assessed on the basis of both computation time and relative error.
The computation time for the three SE approaches and two VER penetration levels is recorded for a
simulation interval of [2s, 400s]. Relative error is assessed on the basis of the norm of the deviation of
the CSE and ETSE approaches relative to the FSE which records the state vector. The phase angle at
Bus 4 is arbitrarily chosen for inspection.
norm(err) =
√n
∑j=0
err2j (3.5)
3.3 Results
This section presents the results of the simulation methodology explained in the previous section. The
simulation results include the graph of the variation in phase angle at Bus 4 which is observed by the
various SE approaches. The computation time as well as the relative error is also recorded for the
different SE approaches.
The Figure3.2 shows the variations of the phase angle at Bus 4 for the three different SE approaches.
The ETSE algorithm has a variable time interval between consecutive updates while the CSE on the
other hand, has a fixed time interval of 10s. The variable time interval in the ETSE is able to detect the
drop in phase angle at t=204s, but this is missed by the CSE.
The Figure 3.3 shows the variability in phase angle at Bus 4 with VER connected at Bus 2 and Bus 6.
The ETSE captures the drop in the phase angle at t=204s and t=208s which is missed by the CSE.
As seen in Table 3.1, the computation time taken for FSE is the highest since it invokes the optimiza-
tion Algorithm 1 for every instant the new measurement is obtained. There is a significant reduction in
CHAPTER 3. IMPLEMENTATION OF EVENT TRIGGERED STATE ESTIMATION 25
Figure 3.2: Variation in phase angle at Bus 4 when Bus 2 has VER connected
Figure 3.3: Variation in phase angle at Bus 4 when Bus 2 and Bus 6 have VER connected

CHAPTER 3. IMPLEMENTATION OF EVENT TRIGGERED STATE ESTIMATION 26
Approaches FSE(s) ETSE(s) CSE(s)Processing Time-bus2 109.618 53.69 20.148Processing Time- bus2 and bus4 211.25 64.273 20.19
Table 3.1: Computation time of the three SE approaches
Approaches ETSE CSEMeasure of error at bus 4-1 WIND GEN 1.01e-2 5.04e-2Measure of error at bus 4- 2WIND GEN 2.4e-2 1.748e-1
Table 3.2: Relative error of the two SE approaches compared to FSE
the computation time in the CSE followed by the ETSE.
The Table 3.2 shows the relative error for the phase angle at Bus 4 for the new ETSE and the CSE.
In both the scenarios of wind integration the ETSE has less error than the CSE. The relative error is used
to compare the fidelity of the ETSE and CSE approaches.
3.4 Chapter Summary
The numerical as well as graphical results presented in this chapter have highlighted how ETSE is
a better choice over the CSE and FSE. The combination of WER to create the trigger criteria in the
application of SE is unique and the improvements in computational time and relative error in comparison
to the FSE and CSE establishes the same. The ETSE successfully incorporates the variability exhibited
in the power systems, in the operation of the SE.
CHAPTER 4
Implementation of Event Triggered Tracking State Estimation
In Chapter 3 the concept of ETSE using the variability in the wind is introduced. In the ETSE the WLS
is performed only when triggered. The ETSE addresses the problem of variability introduced in the
system due to integration of VER. Along with increase in variability which needs real time monitoring,
state estimation will be extended to the distribution networks which increase the size of the problem as
highlighted in Chapter 1. Conventional solutions to this problem result in large problem sets being solved
at a faster rate thereby becoming computationally intensive. This chapter builds upon the contribution
presented in Chapter 3 where SE is only called in the case of considerable novelty in the evolution of
the system state. Specifically, the concept of tracking saves significant computational effort at minimal
expense of error by allowing for the update of system state between two consecutive triggered instances.
The remainder of the chapter develops into three sections. The Section 4.1 provides the algorithm
which combines the triggering criterion and the formula for tracking[63]. The methodology and the
results using an IEEE 14 bus system are outlined in Section 4.2.
4.1 ETTSE Algorithm
Although SE has traditionally only been used in transmission EMS, the incorporation of Distribution
Generation (DG) has now let to SE methods to be included in Distribution Management System (DMS)
[ref]. Distribution systems are characterized by more buses per unit area thereby dramatically increasing
the problem size. The resulting computational expense, restricts the ability to sample at a higher speed
27

CHAPTER 4. IMPLEMENTATION OF EVENT TRIGGERED TRACKING STATE ESTIMATION28
to improve monitoring. The increase in network size, the increase in variability and the limitations on
computational capability together are the motivation of this chapter to look into different state estimation
approaches to the enhance real time monitoring.
Traditionally, CSE executes the WLS algorithm at regular but relatively slow intervals (10-30s) un-
der the assumption that the power system under observation evolves quasi statically between consecutive
executions of the WLS. The increasing penetration of VER in recent years has introduced greater dy-
namics thus potentially violating this assumption. To keep up with the variation in the states, reductions
in the CSE execution interval has been proposed as a solution. Here, the concept of tracking in Chap-
ter 2 and triggering in Chapter 3 are now combined to give a more computationally efficient ETTSE
algorithm with improved real time monitoring capability as an alternative solution.
Algorithm 3
1. Receive active power measurement Pwi(k) from all the buses with wind generation
2. Update Si(k) and compute Pwi(k) using Equation 3.1 and Equation 3.2
3. Update τ(k) using Equation 3.4
4. If τ(k)= 1 receive measurement set of the entire network and perform SE using Algorithm 1
5. Else if τ(k)= 0 then update δx using Equation [from background] and x(k) using Equation from
background
6. Wait for Pwi(k)
The Algorithm 1 which executes the gain matrix is only performed when the trigger is set. The
remaining step to update the state vector is performed using Equation [from background] and [from
background]. The results of this new approach are studied in a case study in the following section.
4.2 Methodology and Results
4.2.1 Methodology
The standard IEEE 14 bus system[50] is used to illustrate the scheme proposed in this chapter. The mea-
surement set is predefined to be : Voltage measurement at Bus 1, Power injection (active and reactive) at
Bus 2, 3 7, 8, 10, 11, 12 and 14 and Power flow (active and reactive) on branches between the following
buses 1-2; 2-3; 2-4; 2-5; 4-5; 4-7; 4-9; 5-6; 6-11; 6-13; 7-9 and 12-13.

CHAPTER 4. IMPLEMENTATION OF EVENT TRIGGERED TRACKING STATE ESTIMATION29
Standard methods of observability[3] are applied to assure that the measurement set results in a full
column rank of H given by Equation (6). The tuning parameter α in Equation 3.4 is set to 0.25. The
following 3 scenarios are observed and compared against each other:
1. Execute Algorithm 1 every 2s interval which is Fast SE (FSE)
2. Perform Event Triggered State Estimation(ETSE) using Algorithm 2
3. Perform Event triggered Tracking State Estimator (ETTSE) using Algorithm 3
The FSE is the ideal scenario which is used as the benchmark to assess the ETTSE. In each case, the
wind speed follows the composite wind speed model presented in [49]. This is taken as a stochastic input
to the DFIG wind turbine model provided in SimPower[47] to obtain the variability in power injection
at Bus 2. These results are integrated into the IEEE 14-bus system. MATPOWER is used to obtain the
power flow measurements for variation in the power injection. Two different wind profiles are used to
test the three scenarios.
A normally distributed measurement error of standard deviation 0.07 per unit (p.u) and mean 0.06
p.u is introduced
The results of the simulations are assessed on the basis of the relative error. Relative error is assessed on
the basis of the norm using Equation 3.5.
4.2.2 Results
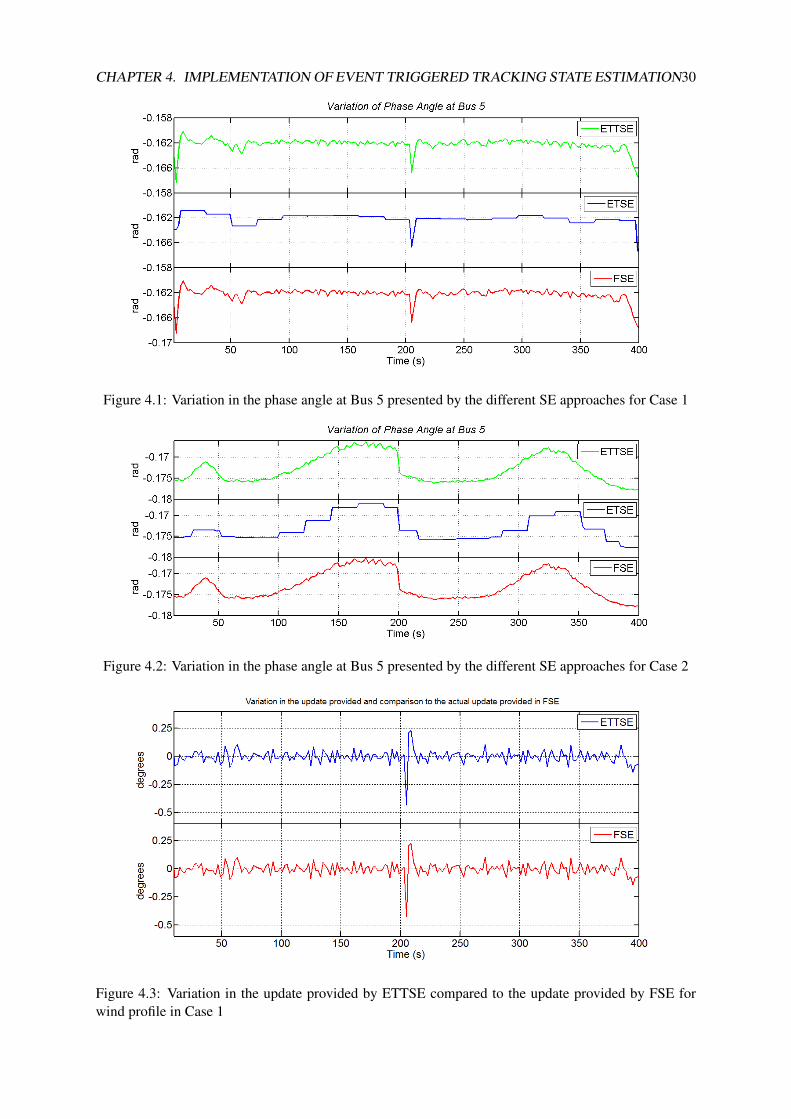
The results in the variation of the phase angle at Bus 5 for two different wind profiles are studied. Case 1
represents a spike in the wind power injection and in Case 2 there are ramp events and higher variability.
Also, the δ x is observed and compared to the difference between the real update obtained from the FSE.
Case ETSE ETTSECase 1 1.04x10⁻² 3.9x10⁻⁴Case 2 2.9x10⁻² 1.2x10⁻³
Table 4.1: Relative error of the two SE approaches compared to FSE
Approaches FSE(s) ETTSE(s) ETSE(s)Processing Time-Case 1 218.71 29.19 28.96Processing Time- Case 2 268.83 33.95 32.44
Table 4.2: Computation time of the three SE approaches
CHAPTER 4. IMPLEMENTATION OF EVENT TRIGGERED TRACKING STATE ESTIMATION30
Figure 4.1: Variation in the phase angle at Bus 5 presented by the different SE approaches for Case 1
Figure 4.2: Variation in the phase angle at Bus 5 presented by the different SE approaches for Case 2
Figure 4.3: Variation in the update provided by ETTSE compared to the update provided by FSE forwind profile in Case 1

CHAPTER 4. IMPLEMENTATION OF EVENT TRIGGERED TRACKING STATE ESTIMATION31
As can be seen in Figure 4.1 and Figure 4.2 the modulation in the phase angle for the different
wind profiles have been faithfully captured by the ETTSE. The Table 4.1 shows the relative error for the
phase angle at Bus 5 for the new ETSE and the ETTSE. In both cases of wind power injection profile
the ETTSE has less error than the ETSE. The relative error is used to compare the fidelity of the ETSE
and ETTSE approaches.
The difference x(k)-x(k-1) for the phase angle estimate at Bus 5 is recorded for the FSE and compared
to the δx calculated at every update using the equation (15), for the corresponding state variable. Fig 4.
observes that the ETTSE method is able to provide accurate update of the state variables at the same time
the update mechanism in ETTSE represented by Equation [from background]is not complex compared
to the computation of the WLS in Algorithm 1.
The Table 4.2 provides the computation time of the three SE approaches. The computation time
for the FSE is certainly much higher than the ETTSE and ETSE. Though the ETTSE has a higher
computation time than ETSE, the difference is negligible.
4.3 Chapter Summary
The ETTSE is an improvement to the ETSE described in Chapter 3, and provides a better reflection of
the variability in the system states. The computational time of the ETTSE is comparable to the ETSE
and is significantly lower than the FSE, at the same time the relative error is also well below ETSE.
The combination of the computationally less intensive method to achieve tracking between consecutive
triggers is a good combination for large power systems with higher penetration of VER.
CHAPTER 5
Weather Aided State Estimation
In this chapter, the concept of SE from Chapter 2 is expanded to include meteorological information.
In the Weather Aided State Estimator (WASE), short term forecasted data is used to identify different
weather phenomena. The WASE creates an early warning system which can improve the situational
awareness of the operators and can provide the information necessary to take appropriate action before
the weather phenomena affects the power grid operation. The WASE is an algorithm which runs in
parallel to an ETSE or ETTSE and alerts the operator of the upcoming weather events. The simulation
emphasizes the need to introduce appropriate policy for information sharing between the weather sta-
tions and the power grid control centers as highlighted in [19]and the importance of developing short
term forecasts to aid SE algorithms in the future.
The remainder of the chapter develops into four sections. The Section 5.1 provides the motivation
for WASE. The methodology is provided in Section 5.2 and the modelling is provided in Section 5.3,
followed by results in Section 5.4 .
5.1 Motivation
The share of renewable energy in the generation mix is set to increase over the coming years to meet the
growing energy demand and at the same time address the issues of climate change and carbon emissions
[19]. Currently the power grids are subjected to fluctuations in load and in the future will be affected by
the fluctuations in generation due to the increase in the presence of VER [40]. The higher penetration of
32

CHAPTER 5. WEATHER AIDED STATE ESTIMATION 33
the VER in the power grids increases the vulnerability of the system towards weather phenomena such
as wind gusts, cumulus clouds, ramp events etc. In order to maintain the reliability of the power grid
operation it is necessary to improve the monitoring and control systems[20] to capture the effect of the
weather on the power grids.
The WASE aims to aid the operator with the prediction of the system states to ensure that the three
main operations listed below can be improved in the presence of fluctuations introduced by the VER.
The power system operator is mainly concerned with the following three responsibilities:
• Balancing generation and load which is performed by ensuring frequency stability.
• Maintain voltage stability.
• Maintain thermal limits which includes monitoring the power flow through the tie lines.
The Figure 5.1 shows the block diagram of the integration of WASE into the current structure used
in EMS.
Figure 5.1: Block diagram of integration of WASE
The market layer takes into consideration the weather forecasts and the load forecasts to perform
economic dispatch, but the results from the economic dispatch are refreshed at a much slower rate than
desired. The time scale of this operation ranges from 5min to 1hour. The low frequency of operation of
the market layer will not be able to capture the sudden events in the weather and thus does not improve
the operator’s situational awareness. Moreover the markets perform a security constraint economic
dispatch [78] which is merely an approximation of the power system states.
CHAPTER 5. WEATHER AIDED STATE ESTIMATION 34
The WASE proposed in this chapter aims to combine the advantages of short term forecasts with
power flow analysis. The results of the WASE can be used directly to aid the operator in making deci-
sions when a weather phenomena occurs. The WASE is an online tool which generates forecasted state
values based on forecasted weather information.
Several surveys and studies have highlighted the need to include weather forecasts in the EMS to
equip the operators to manage weather events which can affect the power grids.In [60] the authors high-
light the need for improving the information available on renewable energy generation to enhance the
operation of the SMART grids of tomorrow. The successful integration of VERs is supported by the use
of operating reserves, the management of these reserves can be improved with the aid of forecasts. In
[34] the need to develop special operating procedures to perform balancing when dealing with VERs is
discussed. The recommendations provided in [33] to update the power system monitoring include im-
provements in the operator procedures to handle the events which arise in the power grid due to weather
phenomena. The inclusion of forecasts specifically of ramp forecasts and relaying the information to
the operator is highlighted as an important step to enhance situational awareness which can improve the
operator’s reaction to a problem. The literature survey conducted in [34], [33] and [60] have concluded
that there is a need to enhance the operational procedures by providing forecast and that methodologies
to enable that needs to be developed.
The years of research on SE have been extensive and have been successful in implementing algo-
rithms which cover issues such as observability [42][71], bad data analysis [9], computational time and
complexity [75]. Recent developments in DSE have included load forecasts, which are based on priori
information to build the time varying model of the power systems [10].
The work presented in this chapter is in line with the concerns highlighted in literature and a step
towards the future of SE. A methodology is provided to include the forecasted weather information to
enhance the operators understanding of the power system conditions when subjected to sudden changes
in the weather which affects the power grid with higher penetration of VER.
5.2 Methodology
In this section the methodology for implementing the WASE is discussed. The high level objection of
the WASE is to provide a foresight into the power system stability by using the steady state model.
The WASE methodology provided in Figure5.2 can be divided to the five separate stages:
1. Collect weather data
CHAPTER 5. WEATHER AIDED STATE ESTIMATION 35
Figure 5.2: Block diagram of proposed WASE methodology
2. Process weather information
3. Execute power generation/consumption function
4. Perform Power flow analysis
5. Process the results of the Power Flow Analysis
The function of each stage and how it eventually aids the operator’s situational awareness is elabo-
rated in the remainder of this section.
5.2.1 Collect Weather Data
The weather information which is an input to the system can be collected from several sources. The de-
velopments in the field of communication, weather forecasting and meteorological sciences has resulted
in vast amounts data which can be utilized by the WASE. The average time taken by the operator to react
to any event is 15min, thus a 15min look ahead time should be achieved with the WASE to benefit the op-
erators. Therefore, the forecast models are required to be short term forecasts of the order of 15 -30min
[53]. Also an important feature required in the forecasts, are ramp and variability forecasts [27] which
are identified as events that cause significant shift in the power generation of the VERs. The information
from the weather stations can also be combined with the historical data to understand the evolution of the
weather over a given period of time. Also, satellite imaging or Geographical Information Systems(GIS)
can be used to enhance the weather data collection techniques [51]. The performance of the WASE is
dependent on the availability and accuracy of the weather data, this is bound to improve with the further
CHAPTER 5. WEATHER AIDED STATE ESTIMATION 36
developments in communication and improvement in the accuracy of the forecast models.
Figure 5.3: Collection of weather data
5.2.2 Process Weather Information
The data collected from the several sources discussed in the previous section should be compiled to suit
the power system analysis. The data is used to build a time varying spatial map for a given time frame
of the weather variables Wk(x,y). The map provides the weather data W at time k for the geographical
locations given by coordinates (x,y). The power system buses should have coordinates which correspond
to their physical location and can be used to identify the weather variable at each bus. Therefore the
geographical mapping of the grid is essential prerequisite for the implementation of this scheme.
5.2.3 Execute Power Generation/Consumption Function
Once the time varying spatial map of the weather variable is obtained for a given period into the future,
it is used to forecast the power injection at the buses affected by the weather variables. The VER can
include wind farms with the power function directly proportional to the wind speed, solar PV farms
which have a power function directly proportional to the solar irradiance. Similarly, buildings which
represent the load buses can have power consumption functions which have a direct correlation to the
weather variables as well. Due to the heterogeneity of such building models such power functions do
not exist, but a future development of such models can also be incorporated to the WASE.

CHAPTER 5. WEATHER AIDED STATE ESTIMATION 37
Figure 5.4: The power function which can be adopted to generate the power injection profile
This step connects the weather data to the power system by generating the forecasted power genera-
tion profile. The output from the power generation function is used in the following step for power flow
analysis.
5.2.4 Power Flow Analysis
The power flow analysis is performed for the variation in the power injection forecasted corresponding
to the variability in the weather variables. The Equation 2.6 and 2.7 are solved to obtain the full list of
the system states.
For each forecasted value the power flow analysis is executed. The results of the power flow analysis
provides the values for the system states x(k), corresponding to each instant k into the future. The power
flow analysis performed using the steady state equations can also be replaced with dynamic frequency
modelling of the power grid.
5.2.5 Process the Results of the Power Flow Analysis
The power flow analysis provides more information than the state vector. The state vector can be used
to calculate the power flow between the buses using the Equations 2.8 and Equation 2.9.
The various results obtained from the power flow analysis are able to aid the three main responsibili-
ties of the operator provided in Section 5.1. he system states provide the voltage and phase angles which
are used for monitoring both voltage stability as well as frequency stability. The power generation and
the power consumption information provided by the power injection values along with the Area Control

CHAPTER 5. WEATHER AIDED STATE ESTIMATION 38
Error(ACE)[54] are calculated and used to ensure balancing of the load and generation. The thermal
limits are monitored with the help of the power flow values which are calculated. With the help of the
information obtained from this step, the operator is able have a better understanding of how the system
will behave in the future when subjected to the changes in the weather.
Figure 5.5: Processing of the powerflow results
The better awareness of the system parameters and their evolution over a time frame into the future
will be able to improve the reaction of the operators to weather events.
5.3 Modelling
The meteorological models distinguish between areas of constant weather variables with lines. Isobars
for wind speed specifically and similar approaches can be done for the other VERs. Therefore, it is
necessary to model the evolution of these lines of constant temperature, solar radiation, and wind speed
to develop the varying weather map. In this section the model of a wind speed map is explained using
the concept of a moving isobar.
Consider an arbitrary scalar field P which represents the air pressure. The ~W = ∇P is a vector field
that represents air speed/wind speed.
~W (x,y) =W x(x,y)i+W y(x,y) j (5.1)
The lines of equal wind speed are the same as lines of equal pressure isobars, which are perpendicular
to the motion of wind. The isobars are described by P(x,y)= c. Let the wind speed on one side of the
isobar be ~A1 and the wind speed on the other side of the isobar is ~A0.
The isobar can be represented as a parametric equation in u:
R(u) = Rx(u)i+Ry(u) j (5.2)
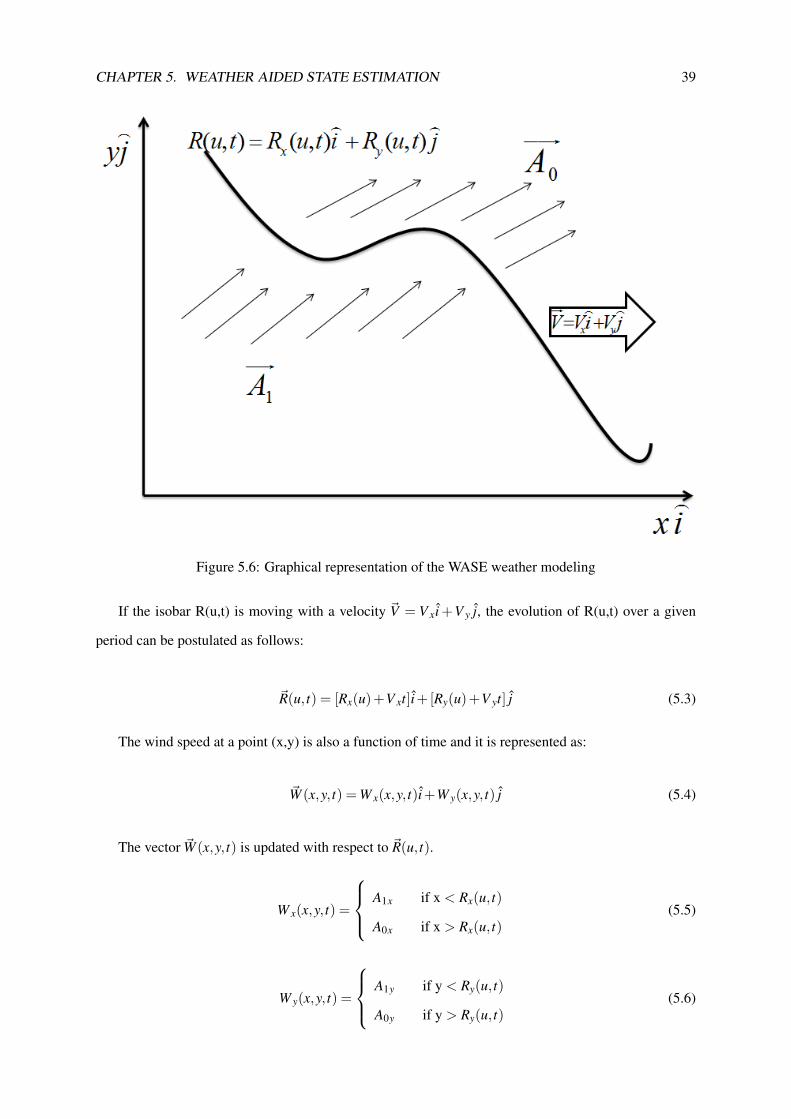
CHAPTER 5. WEATHER AIDED STATE ESTIMATION 39
Figure 5.6: Graphical representation of the WASE weather modeling
If the isobar R(u,t) is moving with a velocity ~V = V x i+V y j, the evolution of R(u,t) over a given
period can be postulated as follows:
~R(u, t) = [Rx(u)+V xt]i+[Ry(u)+V yt] j (5.3)
The wind speed at a point (x,y) is also a function of time and it is represented as:
~W (x,y, t) =W x(x,y, t)i+W y(x,y, t) j (5.4)
The vector ~W (x,y, t) is updated with respect to ~R(u, t).
W x(x,y, t) =
A1x if x < Rx(u, t)
A0x if x > Rx(u, t)(5.5)
W y(x,y, t) =
A1y if y < Ry(u, t)
A0y if y > Ry(u, t)(5.6)

CHAPTER 5. WEATHER AIDED STATE ESTIMATION 40
The energy from the wind speed ~W (x,y, t) which is harnessed by the turbine along the direction
s = sx i+ sy j is given by ~W e(t) = s. ~W (x,y, t) .
The IEEE 14 bus system [50] is used as the test case. In this chapter the VER adopted is a wind
generator with a power generation function given by Equation 5.7 and the simulation is performed within
a Matlab environment.
Pi =12×µAv3×CP (5.7)
Where CP is the coefficient of performance for the turbine which considers the efficiency and the
turbine coefficient together and in this example is given the value 0.59. The area of the turbine is set to
3848 m2 and µ which is the density of air is 1.2 kg/m3 .
5.4 Results
The Bus 2 in the IEEE 14 bus system is a generator bus and is substituted with the VER. The wind data
is forecasted and assumed to be collected from the sources which are mentioned in Section 5.2. In this
simulation a moving wind front along the horizontal direction is modelled.
The wind farm is provided with coordinates (xturbine ,yturbine ). The wind speed corresponding to the
point ~W e(xturbine ,yturbine,t)is used to calculate the Pi.
The steady state power flow analysis is performed by MATPOWER within the Matlab environment[49].
The change in the wind speed over the geographical area of the grid is reflected in the power injection at
the Bus 2. The predicted power injection profile results in a spike in the power injection and the power
flow analysis is performed for the time frame in the future.
The time frame of the predicted power generation profile is 2min. The predicted power generation
profile shown in Figure5.7is used as an input at Bus 2 of the IEEE 14 bus system.
The power flow analysis performed for the forecasted power generation and the results are high-
lighted to understand the behaviour of the system when subjected to changing wind speeds. In the
Figure 5.9 the maximum and minimum values of the voltage and phase angle for the time frame can be
observed. This allows the operator to maintain the voltage stability and frequency stability. Also the
generator parameters [50] can be extracted and provided to the operators as shown in Figure 5.8, which
can aid in taking decisions related to balancing.
The results of the power flow analysis provides more information that necessary to the operators.
The operators require concise information about the essential parameters to make clear and quick de-

CHAPTER 5. WEATHER AIDED STATE ESTIMATION 41
Figure 5.7: Forecasted power generation profile
Figure 5.8: Collection of generator parameters from the power flow analysis
cisions. The development of Graphical User Interface (GUI) for conveying the critical information to
the operators is a crucial part of the EMS [57][11]. A simple illustration of the necessary information is
provided in Figure 5.10.

CHAPTER 5. WEATHER AIDED STATE ESTIMATION 42
Figure 5.9: Collection of voltage and phase angle from the power flow analysis
Figure 5.10: List of essential parameters of critical buses and tie lines

CHAPTER 5. WEATHER AIDED STATE ESTIMATION 43
If the Pmax for the line between the buses 1 - 2 is calculated as 1.8p.u, from the Figure 5.10 it
can be observed that there is a violation of the thermal limit and the operator can take the necessary
action to prevent the same. Similar GUI along with visualization tools can be developed to exploit the
WASE and improve the operator’s understanding of the power grid when subjected to various weather
conditions[18].
5.5 Chapter Summary
The work in this chapter proposes a methodology to enhance the SE which is a key source of data
for decision making in the EMS. The proposed combination of weather data to enhance the SE is able
to improve the operator’s situational awareness in power systems with high VER penetration. The
modelling approach to represent time varying map of wind speed can be expanded to represent other
sources utilized by VERs. The results simulated a spike in the power injection and displayed the several
parameters which are obtained as part of the power flow analysis. The WASE supported by a strong GUI
which can relay the evolution of critical information in the future will be able to support the operator in
making clear and quick decisions when faced with sudden changes in the weather variables. The WASE
running in parallel with a regular SE will be able to improve the EMS and capture the weather related
changes in the power systems.

CHAPTER 6
Conclusion and Future Work
In this chapter the conclusions derived from the work in this thesis are presented. Also, the possibilities
of future work are outlined.
6.1 Conclusions
The work in this thesis has surveyed the existing literature to identify the challenges faced by the power
grids of today and which of those can be solved by enhancing the SE which forms a key part of the
EMS. The triggering criteria developed based on the WER along with the tracking update formulated by
F.Schweppe proved to be a solution to the problem posed by the VER penetration in large power systems.
The impact of the higher penetration of VER is a widely discussed topic in the surveys on future of the
grid and the work on WASE tries to outline an approach to the cater to the impacts of weather on power
grids. The thesis has attempted to fill in the gaps in literature to address the key problems of novelty,
complexity and weather events, in power grids with Variable Energy Resources.
6.1.1 Objectives Achieved
How can a Classical State Estimation (CSE) algorithm be enhanced to account for the novelty
introduced by VER?
SE Approach 1. The CSE is enhanced to an Event Triggered SE (ETSE) as shown in Chapter3, to
capture the novelty and execute the SE only when necessary.
44

CHAPTER 6. CONCLUSION AND FUTURE WORK 45
How can a CSE be enhanced to reduce computational load when addressing large complex net-
works?
SE Approach 2. The CSE is enhanced to include tracking: ETTSE as described in Chapter4 to reduce
the computational load when dealing with large complex networks and at the same time achieve real
time monitoring.
How can CSE be enhanced with new weather based information to improve the operators aware-
ness and reaction to weather events?
SE Approach 3. The WASE explained in Chapter 5 is placed in parallel to the CSE to enhance the
performance with forecasted data to improve operator’s awareness.
6.1.2 Novel Contributions
Trigger Criteria: The new ETSE algorithm proposed in Chapter 3 created a trigger criterion based on
the power output of the VER in the network which is a new approach to event triggering in SE. The
trigger criterion included the historical data of the power output and the used concepts of WER outlined
in Section 2.4.3, to identify the events such as ramps and surge in the power output. The testing of the
ETSE algorithm show that the ETSE compared to the CSE relative to the FSE show higher fidelity of
the state. The computation time of the new ETSE is higher than the CSE but is significantly lower than
the FSE.
Combination of Trigger and Tracking for VER: The work presented in Chapter 4 is to solve
the issue with the variability combined with the expanding size of the power grids. The problem of
computational complexity is addressed by combining tracking with the triggering mechanism in Chapter
3 resulting in the ETTSE. This new combination is tested and the results of the ETTSE show that the
approach is able to incorporate the variability introduced by the VER and meet the real time monitoring
demands of a dynamic power grid with reduced computational overheads.
Methodology for using Forecasted Weather Information in SE: The third challenge which is
identified in Chapter 1 is addressed by the methodology proposed in Chapter 5. The methodology
is illustrated with a simple example, to show how the situational awareness of the operators can be
improved to manage higher penetration of VER in the power grids. The work in Chapter 5 describes
how the combination of GUI and WASE can enable faster decision making when dealing with power
systems with higher penetration of VERs.

CHAPTER 6. CONCLUSION AND FUTURE WORK 46
6.2 Future Work
6.2.1 Future Academic Work
The recent changes in the power system have The research in the field of SE mainly provides the im-
provements in algorithms and aims to achieve improvements in computational time and expense. The
new era of computation and communication is able to provide the platform necessary to run complex al-
gorithms, collect time stamped data from remote locations and process large amounts of data. The future
work in the area of SE should include further work on the WASE which can combine the technology of
today with algorithms to produce better decision making tools.
The WASE can be refined to include a robust forecast model which uses the data from weather
stations to determine the evolution of the weather variables over a give time period. The inclusion of the
forecast model to the SE will be able to move the SE methodology into the realm of DSE.
6.2.2 Industrial Application
Also, the work in this thesis has produced an SE which falls into the category of static state estimators
at the same time achieved real time monitoring. The results were based on IEEE test cases and therefore
the application of the ETTSE to an existing power grid with VERs and analysis of its performance under
real conditions will be interesting to look into.

Bibliography
[1] Stuart A.Boyer. SCADA- Supervisory Control And Data Acquisition. Internationa Society of
Automation, U.S.A, 3rd edition, 2004. URL http://books.google.ae/books?id=
5q-qQAAACAAJ.
[2] A Agarwal, J Balance, B Bhargava, J Dyer, K Martin, and Mo Jianzhong. Real Time Dynamics
Monitoring System for use with SynchroPhasor technology in power systems. In Power and Energy
Society General Meeting, 2011 IEEE, pages 1–8, 2011. ISBN 1944-9925. doi: 10.1109/pes.2011.
6039688.
[3] Amit Aggarwal, Swathi Kunta, and Pramode K Verma. A proposed communications infras-
tructure for the smart grid. pages IEEE; IEEE PES – Power and Energy Society, Gaithersburg,
MD, United states. IEEE Computer Society. URL http://dx.doi.org/10.1109/ISGT.
2010.5434764.
[4] A J Allen, S Santoso, and W M Grady. Voltage phase angle variation in relation to wind power. In
Power and Energy Society General Meeting, 2010 IEEE, pages 1–7, 2010. ISBN 1944-9925. doi:
10.1109/pes.2010.5590001.
[5] Stefan Lundberg Andreas Petersson. Energy Eciency Comparison of Electrical Systems for Wind
Turbines. In Nordic Workshop on Power and Industrial Electronics, Stockholm, Sweden, 2002.
[6] Antonio J.Conejo Antonio Gome-Exposito Claudio Canizares. Electic Energy Systems. CRC Press,
Ontario, Canada, 2009.
47

BIBLIOGRAPHY 48
[7] T L Baldwin, L Mili, M B Boisen Jr., and R Adapa. Power system observability with minimal
phasor measurement placement. Power Systems, IEEE Transactions on, 8(2):707–715, 1993. doi:
10.1109/59.260810.
[8] F Bouhafs, M Mackay, and M Merabti. Links to the Future: Communication Requirements and
Challenges in the Smart Grid, 2012.
[9] N G Bretas and A S Bretas. Bad data analysis using the composed measurements errors for power
system state estimation. In Bulk Power System Dynamics and Control (iREP) - VIII (iREP), 2010
iREP Symposium, pages 1–7, Rio de Janeiro, 2010. ISBN VO -. doi: 10.1109/IREP.2010.5563279.
[10] M Brown Do Coutto Filho and J C S de Souza. Forecasting-Aided State Estimation;Part I:
Panorama. In Power Systems, IEEE Transactions on, volume 24, pages 1667–1677, 2009. ISBN
0885-8950 VO - 24. doi: 10.1109/TPWRS.2009.2030295.
[11] P Bullemer, A S M Joint R, D Consortium, D V Reising, C Burns, J Hajdukiewicz, and J Andrze-
jewski. Effective Operator Display Design: Asm Consortium Guideline. CreateSpace, 2008. ISBN
9781440431647. URL http://books.google.ae/books?id=N0jHQQAACAAJ.
[12] J Y Cai, Huang Zhenyu, J Hauer, and K Martin. Current Status and Experience of WAMS Imple-
mentation in North America. In Transmission and Distribution Conference and Exhibition: Asia
and Pacific, 2005 IEEE/PES, pages 1–7, 2005. doi: 10.1109/tdc.2005.1546889.
[13] E Castillo, A J Conejo, R E Pruneda, and C Solares. Observability analysis in state estimation:
a unified numerical approach. Power Systems, IEEE Transactions on, 21(2):877–886, 2006. doi:
10.1109/tpwrs.2006.873418.
[14] J.Gama C.Ferreira L.Matia, A.Botterund, J.Wang. A Survey on Wind Power Ramp Forecasting.
Technical report, Argonne National Laboratory, 2010. URL http://www.dis.anl.gov/
pubs/69166.pdf.
[15] M de Almeida, A Garcia, and E Asada. Regularized least squares power system state estimation.
In Power and Energy Society General Meeting, 2012 IEEE, page 1, 2012. ISBN 1944-9925 VO -.
doi: 10.1109/PESGM.2012.6345057.
[16] S El Safty, M M A Nasr, and M M Mansour. New technique for fault location in interconnected
networks using phasor measurement unit. In Power System Conference, 2008. MEPCON 2008.

BIBLIOGRAPHY 49
12th International Middle-East, pages 6–10, 2008. ISBN VO -. doi: 10.1109/MEPCON.2008.
4562381.
[17] D Elizondo, R M Gardner, and R Leon. Synchrophasor technology: The boom of investments and
information flow from North America to Latin America. In Power and Energy Society General
Meeting, 2012 IEEE, pages 1–6, 2012. ISBN 1944-9925 VO -. doi: 10.1109/PESGM.2012.
6345638.
[18] M R Endsley. Designing for Situation Awareness: An Approach to User-Centered Design, Second
Edition. Taylor & Francis, 2003. ISBN 9781420063585. URL http://books.google.ae/
books?id=eRPBkapAsggC.
[19] John G et.al Kassakian. The Future of the Electricity Grid: An Interdisciplinary MIT Study.
Technical report, Cambridge, MA, 2011. URL http://web.mit.edu/mitei/research/
studies/documents/electric-grid-2011/Electric_Grid_Full_Report.
pdf.
[20] European Wind Energy Association. LARGE SCALE INTEGRATION OF WIND
ENERGY IN THE EUROPEAN POWER SUPPLY: a nalysis, issues and recom-
mendations. Technical report, European Wind Energy Association,, 2005. URL
http://ec.europa.eu/energy/renewables/studies/doc/wind_energy/
2005_ewea_large_scale_integration.pdf.
[21] Xi Fang, Satyajayant Misra, Guoliang Xue, and Dejun Yang. Smart Grid- The New and Improved
Power Grid: A Survey. Communications Surveys & Tutorials, IEEE, 14(4):944–980, 2012. doi:
10.1109/SURV.2011.101911.00087.
[22] E E Fetzer and P M Anderson. Observability in the state estimation of power systems. Power
Apparatus and Systems, IEEE Transactions on, 94(6):1981–1988, 1975. doi: 10.1109/t-pas.1975.
32044.
[23] M.B.D.C. Filho, A M L da Silva, and D M Falcao. Bibliography on power system state estimation
(1968-1989). Power Systems, IEEE Transactions on, 5(3):950–961, 1990. doi: 10.1109/59.65925.
[24] Reshma Francy, Amro M. Farid, Ambrose Adegbege, and Kamal Youcef-Toumi. Event-Triggered
State Estimation for Variable Energy Resources Management. In IET APSCOM 2012, Hong Kong,
China, 2012. IET- APSCOM 2012.
http://web.mit.edu/mitei/research/studies/documents/electric-grid-2011/Electric_Grid_Full_Report.pdf
http://web.mit.edu/mitei/research/studies/documents/electric-grid-2011/Electric_Grid_Full_Report.pdf

BIBLIOGRAPHY 50
[25] Reshma Francy, Amro M. Farid, and Kamal Youcef-Toumi. An Event Triggered Tracking State Es-
timator for Power Systems with Integrated Wind Generation. In Powertech, 2013 IEEE Grenoble,
Grenoble, France, 2013.
[26] A Garcia, A Monticelli, and P Abreu. Fast Decoupled State Estimation and Bad Data Processing.
Power Apparatus and Systems, IEEE Transactions on, PAS-98(5):1645–1652, 1979. doi: 10.1109/
TPAS.1979.319482.
[27] Gregor Giebel, Richard Brownsword, George Kariniotakis, Michael Denhard, and Caroline
Draxl. The State-Of-The-Art in Short-Term Prediction of Wind Power: A Literature Overview.
ANEMOS.plus, 2nd edition, 2011.
[28] A Gomez-Exposito, A Abur, A de la Villa Jaen, and C Gomez-Quiles. A Multilevel State Esti-
mation Paradigm for Smart Grids. In Proceedings of the IEEE, volume 99, pages 952–976, 2011.
ISBN 0018-9219 VO - 99. doi: 10.1109/JPROC.2011.2107490.
[29] Antonio Gomez-Exposito, Antonio de la Villa Jaen, Catalina Gomez-Quiles, Patricia Rousseaux,
and Thierry Van Cutsem. A taxonomy of multi-area state estimation methods. Electric Power
Systems Research, 81(4):1060–1069, April 2011. ISSN 0378-7796. URL http://www.
sciencedirect.com/science/article/pii/S0378779610002841.
[30] V C Gungor, D Sahin, T Kocak, S Ergut, C Buccella, C Cecati, and G P Hancke. Smart Grid Tech-
nologies: Communication Technologies and Standards. Industrial Informatics, IEEE Transactions
on, 7(4):529–539, 2011. doi: 10.1109/TII.2011.2166794.
[31] H P Horisberger, J C Richard, and C Rossier. A fast decoupled static state-estimator for electric
power systems. Power Apparatus and Systems, IEEE Transactions on, 95(1):208–215, 1976. doi:
10.1109/T-PAS.1976.32093.
[32] Yi Hu and D Novosel. Challenges in Implementing a Large-Scale PMU System. In Power System
Technology, 2006. PowerCon 2006. International Conference on, pages 1–7, 2006. ISBN VO -.
doi: 10.1109/ICPST.2006.321829.
[33] IEC. Grid integration of large-capacity Renewable Energy sources and use of large-capacity
Electrical Energy Storage. Technical report, IEC, 2012. URL http://www.iec.ch/
whitepaper/pdf/iecWP-gridintegrationlargecapacity-LR-en.pdf.

BIBLIOGRAPHY 51
[34] ISO/RTO. Council Briefing Paper Integrating Variable Energy Resources into Organized
Markets. Technical report, ISO/RTO, 2011. URL http://www.isorto.org/atf/
cf/%7B5B4E85C6-7EAC-40A0-8DC3-003829518EBD%7D/IRC_VER-BRIEFING_
PAPER-AUGUST_2011.PDF.
[35] Gary L Johnson. Wind Energy Systems. Kansas State University, 2006. URL http://eece.
ksu.edu/˜gjohnson/Windbook.pdf.
[36] N Kashyap, S Werner, and Huang Yih-Fang. Event-triggered multi-area state estimation in power
systems. In Computational Advances in Multi-Sensor Adaptive Processing (CAMSAP), 2011 4th
IEEE International Workshop on, pages 133–136, San Juan, 2011. doi: 10.1109/camsap.2011.
6135905.
[37] F Kazempour and S Poshtkouhi. Power system state estimation: methods, Implementation and
evaluation. In Electrical & Computer Engineering (CCECE), 2012 25th IEEE Canadian Confer-
ence on, pages 1–4, 2012. ISBN 0840-7789 VO -. doi: 10.1109/CCECE.2012.6334858.
[38] Mladen Kezunovic and Anjan Bose. The Future EMS Design Requirements. In System Sciences
(HICSS), 2013 46th Hawaii International Conference on, pages 2354–2363, 2013. ISBN 1530-
1605 VO -. doi: 10.1109/HICSS.2013.520.
[39] Rajeev Kumar, M L Dewal, and Kalpana Saini. Utility of SCADA in Power Generation and
Distribution System. In IEEE, volume 6, pages 648–652, Deptt.of ICE dept., GCET, Greater
Noida, India, 2010. IEEE Computer Society. doi: 10.1109/ICCSIT.2010.5564689. URL http:
//dx.doi.org/10.1109/ICCSIT.2010.5564689.
[40] Debra Lew, Nick Piwko, Dick Miller, Gary Jordan, Kara Clark, and Lavelle Freeman. NREL:
How Do High Levels of Wind and Solar Impact the Grid? The Western Wind and Solar Integration
Study. Technical report, NREL, 2010. URL http://www.nrel.gov/docs/fy11osti/
50057.pdf.
[41] Lichun Li and Michael Lemmon. Performance and average sampling period of sub-optimal trig-
gering event in event triggered state estimation. In Decision and Control and European Control
Conference (CDC-ECC), 2011 50th IEEE Conference on, pages 1656–1661, 2011. ISBN 0743-
1546 VO -. doi: 10.1109/CDC.2011.6160650.

BIBLIOGRAPHY 52
[42] Huaiwei Liao. Power System Harmonic State Estimation and Observability Analysis via Sparsity
Maximization. Power Systems, IEEE Transactions on, 22(1):15–23, 2007. doi: 10.1109/TPWRS.
2006.887957.
[43] Jeu-Min Lin, Shyh-Jier Huang, and Kuang-Rong Shih. Application of sliding surface-enhanced
fuzzy control for dynamic state estimation of a power system. Power Systems, IEEE Transactions
on, 18(2):570–577, 2003. doi: 10.1109/TPWRS.2003.810894.
[44] Fan Lingling, R Kavasseri, Miao Zhixin Lee, and Zhu Chanxia. Modeling of DFIG-Based Wind
Farms for SSR Analysis. Power Delivery, IEEE Transactions on, 25(4):2073–2082, 2010. doi:
10.1109/tpwrd.2010.2050912.
[45] J K Mandal, A K Sinha, and L Roy. Incorporating nonlinearities of measurement function in power
system dynamic state estimation. In Generation, Transmission and Distribution, IEE Proceedings-,
volume 142, pages 289–296, 1995. ISBN 1350-2360 VO - 142. doi: 10.1049/ip-gtd:19951715.
[46] J W Marck and J Sijs. Relevant Sampling Applied to Event-Based State-Estimation. In Sensor
Technologies and Applications (SENSORCOMM), 2010 Fourth International Conference on, pages
618–624, 2010. ISBN VO -. doi: 10.1109/SENSORCOMM.2010.97.
[47] MathWorks. SimPowerSystems User’s Guide. The MathWorks, Inc, Natick, MA, 2012.
[48] A P S Meliopoulos, G J Cokkinides, O Wasynczuk, E Coyle, M Bell, C Hoffmann, C Nita-Rotaru,
T Downar, L Tsoukalas, and R Gao. PMU data characterization and application to stability moni-
toring, 2006.
[49] Federico Milano. Power System Analysis Toolbox Documentation for PSAT version 2.1.6, 2010.
URL http://www.uclm.es/area/gsee/web/Federico/psat.htm.
[50] Federico Milano. Power System Modelling and Scripting. Springer Berlin Heidelberg, 2010. ISBN
3642136680.
[51] Birgit Helga Editha Moiloa. Geographical Information Systems for Strategic Wind Energy
Site Selection. PhD thesis, 2009. URL http://www.unigis.nl/downloads/msc/
BirgitMoiloa.pdf.
[52] A Monticelli. Electric power system state estimation. Proceedings of the IEEE, 88(2):262–282,
2000. doi: 10.1109/5.824004.

BIBLIOGRAPHY 53
[53] A Moreno-Munoz, J de la Rosa, R Posadillo, and V Pallares. Short term forecasting of solar
radiation. In Industrial Electronics, 2008. ISIE 2008. IEEE International Symposium on, pages
1537–1541, 2008. doi: 10.1109/isie.2008.4676880.
[54] Aramazd Muzhikyan. A Holistic Assesment Method of Power System Imbalances in the Presence
of Variable Energy Resources. PhD thesis, Masdar Institute of Science and Technology, 2013.
[55] Ken-Ichi Nishiya, Hiroshi Takagi, Jun Hasegawa, and Toichiro Koike. Dynamic state estimation
for electric power systemsintroduction of a trend factor and detection of innovation processes. Elec-
trical Engineering in Japan, 96(5):79–87, 1976. ISSN 1520-6416. doi: 10.1002/eej.4390960511.
URL http://dx.doi.org/10.1002/eej.4390960511.
[56] R R Nucera and M L Gilles. Observability analysis: a new topological algorithm. Power Systems,
IEEE Transactions on, 6(2):466–475, 1991. doi: 10.1109/59.76688.
[57] Pas, B R Hollifield, D Oliver, I Nimmo, and E Habibi. The High Performance HMI Handbook: A
Comprehensive Guide to Designing, Implementing and Maintaining Effective HMIs for Industrial
Plant Operations. PAS, 2008. ISBN 9780977896912. URL http://books.google.ae/
books?id=ecyRPQAACAAJ.
[58] A G Phadke and J S Thorp. HISTORY AND APPLICATIONS OF PHASOR MEASUREMENTS.
In Power Systems Conference and Exposition, 2006. PSCE ’06. 2006 IEEE PES, pages 331–335,
2006. ISBN VO -. doi: 10.1109/PSCE.2006.296328.
[59] A G Phadke, J S Thorp, R F Nuqui, and M Zhou. Recent developments in state estimation with
phasor measurements. In Power Systems Conference and Exposition, 2009. PSCE ’09. IEEE/PES,
pages 1–7, 2009. ISBN VO -. doi: 10.1109/PSCE.2009.4839954.
[60] C W Potter, A Archambault, and K Westrick. Building a smarter smart grid through better re-
newable energy information. In Power Systems Conference and Exposition, 2009. PSCE ’09.
IEEE/PES, pages 1–5, 2009. ISBN VO -. doi: 10.1109/PSCE.2009.4840110.
[61] Lijun Qin, Qing Guo, Cuijuan Hao, and Huawei Jin. A new wide area measurement system model
based on common information model. In Electric Utility Deregulation and Restructuring and
Power Technologies (DRPT), 2011 4th International Conference on, pages 1061–1066, 2011. doi:
10.1109/drpt.2011.5994052.

BIBLIOGRAPHY 54
[62] F C Schweppe. Power System Static-State Estimation, Part III: Implementation. Power Apparatus
and Systems, IEEE Transactions on, PAS-89(1):130–135, 1970. doi: 10.1109/TPAS.1970.292680.
[63] F C Schweppe and R D Masiello. A Tracking Static State Estimator. Power Apparatus and Systems,
IEEE Transactions on, PAS-90(3):1025–1033, 1971. doi: 10.1109/TPAS.1971.292844.
[64] F C Schweppe and J Wildes. Power System Static-State Estimation, Part I: Exact Model. Power
Apparatus and Systems, IEEE Transactions on, PAS-89(1):120–125, 1970. doi: 10.1109/tpas.
1970.292678.
[65] C Selvam, K Srinivas, G S Ayyappan, and M Venkatachala Sarma. Advanced metering infrastruc-
ture for smart grid applications, 2012.
[66] N R Shivakumar and A Jain. A Review of Power System Dynamic State Estimation Techniques.
In Power System Technology and IEEE Power India Conference, 2008. POWERCON 2008. Joint
International Conference on, pages 1–6, 2008. doi: 10.1109/icpst.2008.4745312.
[67] A K Sinha and J K Mondal. Dynamic state estimator using ANN based bus load prediction. Power
Systems, IEEE Transactions on, 14(4):1219–1225, 1999. doi: 10.1109/59.801876.
[68] Zakaria Al Soufi. ADWEA Advanced Metering Infrastructure ( AMI ) - Current Roll Outs and
Future Implementations. In 2nd Annual Smart Grid and Smart Meter Summit: Gateway to a Smart
Future, number October, pages 1–32, Abu Dhabi, UAE, 2012.
[69] Junjie Tang, Junqi Liu, F Ponci, C Muscas, and S Sulis. Effects of PMU’s uncertainty on
voltage stability assessment in power systems. In Instrumentation and Measurement Tech-
nology Conference (I2MTC), 2011 IEEE, pages 1–5, 2011. ISBN 1091-5281 VO -. doi:
10.1109/IMTC.2011.5944290.
[70] J E Tate and T J Overbye. Line Outage Detection Using Phasor Angle Measurements. Power
Systems, IEEE Transactions on, 23(4):1644–1652, 2008. doi: 10.1109/TPWRS.2008.2004826.
[71] D Tholomier, H Kang, and B Cvorovic. Phasor measurement units: Functionality and applications.
In Power Systems Conference, 2009. PSC ’09., pages 1–12, Clemson, SC, 2009. doi: 10.1109/
psamp.2009.5262468.
[72] K Tomsovic, D E Bakken, V Venkatasubramanian, and A Bose. Designing the Next Generation of
Real-Time Control, Communication, and Computations for Large Power Systems, 2005.

BIBLIOGRAPHY 55
[73] Li Wei-guo, Li Jin, Gao Ao, and Yang Jin-hong. Review and Research Trends on State Estimation
of Electrical Power Systems. In Power and Energy Engineering Conference (APPEEC), 2011
Asia-Pacific, pages 1–4, 2011. ISBN 2157-4839. doi: 10.1109/appeec.2011.5749095.
[74] Western Electric Comany. Statistical quality control handbook. The Company, New York, 1958.
[75] X Yang and X P Zhang. Fast decoupled multi area state estimation with PMUs measurements. In
Innovative Smart Grid Technologies - Asia (ISGT Asia), 2012 IEEE, pages 1–7, 2012. ISBN VO
-. doi: 10.1109/ISGT-Asia.2012.6303269.
[76] Yuan Yue, Ju Ping, Li Qiang, Wang Yongzhi, Hu Hongbo, and H Sasaki. A real-time monitoring
method for power system steady state angle stability based on WAMS. In Power Engineering
Conference, 2005. IPEC 2005. The 7th International, pages 761–764 Vol. 2, 2005. doi: 10.1109/
ipec.2005.207010.
[77] A Zaballos, A Vallejo, and J M Selga. Heterogeneous communication architecture for the smart
grid. Network, IEEE, 25(5):30–37, 2011. doi: 10.1109/MNET.2011.6033033.
[78] A K Zadeh, K M Nor, and H Zeynal. Multi-thread security constraint economic dispatch with
exact loss formulation. In Power and Energy (PECon), 2010 IEEE International Conference on,
pages 864–869, Malaysia, 2010.
[79] Tongyan Zhai, Huawei Ruan, and E E Yaz. Performance evaluation of extended Kalman filter
based state estimation for first order nonlinear dynamic systems. In Decision and Control, 2003.
Proceedings. 42nd IEEE Conference on, volume 2, pages 1386–1391 Vol.2, 2003. ISBN 0191-
2216 VO - 2. doi: 10.1109/CDC.2003.1272803.
[80] M Zima-Bockarjova, M Zima, and G Andersson. Analysis of the State Estimation Performance
in Transient Conditions. Power Systems, IEEE Transactions on, 26(4):1866–1874, 2011. doi:
10.1109/TPWRS.2011.2124476.


![Powering & Watering Agriculture: Application of Energy ...amfarid.scripts.mit.edu/resources/Conferences/EWN-C15.pdf · of global changes and mega-trends [7]. Developing nations, in](https://static.fdocuments.in/doc/165x107/5f4c7717cc46cb741e1ad94a/powering-watering-agriculture-application-of-energy-of-global-changes.jpg)