
Enhanced lipid biosynthesis in human tumor-induced ...
13
1 Rabold K, et al. J Immunother Cancer 2020;8:e000638. doi:10.1136/jitc-2020-000638 Open access Enhanced lipid biosynthesis in human tumor-induced macrophages contributes to their protumoral characteristics Katrin Rabold , 1,2 Anna Aschenbrenner, 1,3 Christoph Thiele, 4 Collins K Boahen, 1 Alexander Schiltmans, 1 Johannes W A Smit, 5 Joachim L Schultze, 3 Mihai G Netea, 1,6 Gosse J Adema , 2 Romana T Netea-Maier 5 To cite: Rabold K, Aschenbrenner A, Thiele C, et al. Enhanced lipid biosynthesis in human tumor-induced macrophages contributes to their protumoral characteristics. Journal for ImmunoTherapy of Cancer 2020;8:e000638. doi:10.1136/jitc-2020-000638 ► Additional material is published online only. To view please visit the journal online (http://dx.doi.org/10.1136/jitc- 2020-000638). GJA and RTN-M contributed equally. Accepted 10 August 2020 For numbered affiliations see end of article. Correspondence to Katrin Rabold; [email protected] Original research © Author(s) (or their employer(s)) 2020. Re-use permitted under CC BY-NC. No commercial re-use. See rights and permissions. Published by BMJ. ABSTRACT Background Tumor-associated macrophages (TAMs) are key components of the tumor microenvironment (TME) in non-medullary thyroid carcinoma (TC) and neuroblastoma (NB), being associated with a poor prognosis for patients. However, little is known about how tumors steer the specific metabolic phenotype and function of TAMs. Methods In a human coculture model, transcriptome, metabolome and lipidome analysis were performed on TC-induced and NB-induced macrophages. The metabolic shift was correlated to functional readouts, such as cytokine production and reactive oxygen species (ROS) production, including pharmacological inhibition of metabolic pathways. Results Based on transcriptome and metabolome analysis, we observed a strong upregulation of lipid biosynthesis pathways in TAMs. Subsequently, lipidome analysis revealed that tumor-induced macrophages have an increased total lipid content and enriched levels of intracellular lipids, especially phosphoglycerides and sphingomyelins. Strikingly, this metabolic shift in lipid synthesis contributes to their protumoral functional characteristics: blocking key enzymes of lipid biosynthesis in the tumor-induced macrophages reversed the increased inflammatory cytokines and the capacity to produce ROS, two well-known protumoral factors in the TME. Conclusions Taken together, our data show that tumor cells can stimulate lipid biosynthesis in macrophages to induce protumoral cytokine and ROS responses and advocate lipid biosynthesis as a potential therapeutic target to reprogram the TME. BACKGROUND The tumor microenvironment (TME) is heterogeneous in terms of cell populations: in addition to tumor cells themselves, endo- thelial cells and fibroblasts, populations of immune inflammatory cells also play an important role in shaping the TME. It is well described that inflammation and immune evasion are two hallmarks of cancer, contrib- uting to tumor outgrowth and tumor progres- sion. 1–5 Tumor-associated macrophages (TAMs) are among the most abundant innate immune cells in the TME. They have an important mutual relationship with tumor cells, as tumor cells modulate the function of macrophages and thereby contribute to programming of TAMs, which in turn influ- ences the behavior of tumor cells. 6 In theory, macrophages have the ability to play an effec- tive role in tumor elimination. However, in established tumors, TAMs promote cancer cell survival, proliferation, metastasis, angio- genesis and immune suppression. 7 One key feature of macrophages is their plasticity, enabling them to adapt to changes in their environment by adjusting their cellular metabolism and transcriptional program. In the TME, infiltrating monocytes encounter signals from tumor cells, leading to metabolic programming and functional adaptations. 7–9 Thereby, tumor cells educate TAMs to gain a tumor supportive phenotype. Furthermore, a high density of TAMs in the TME is asso- ciated with poor prognosis in many types of cancer, supporting the protumoral functions of TAMs. 10–14 There is considerable interest in understanding the cellular pathways that underpin the protumor phenotype of TAMs. Subsequently, interfering with such pathways in TAMs may be a promising novel thera- peutic strategy. In the last decade, the field of immunome- tabolism has provided data on the metabolic profile of immune cells and on the mecha- nisms through which cellular metabolism shapes the immune cells’ activation state and function. 15 For example, in vitro classically activated M1 macrophages, use anaerobic glycolysis, protein and fatty acid (FA) synthesis metabolic pathways, 16 whereas alternatively activated M2 macrophages are mainly using oxidative phosphorylation (OXPHOS) for energy metabolism. 17 However, little is known about the programming and the specific metabolic phenotype of human macrophages in the context of cancer. In the present study, on December 1, 2021 by guest. Protected by copyright. http://jitc.bmj.com/ J Immunother Cancer: first published as 10.1136/jitc-2020-000638 on 17 September 2020. Downloaded from
Transcript of Enhanced lipid biosynthesis in human tumor-induced ...

1Rabold K, et al. J Immunother Cancer 2020;8:e000638. doi:10.1136/jitc-2020-000638
Open access
Enhanced lipid biosynthesis in human tumor- induced macrophages contributes to their protumoral characteristics
Katrin Rabold ,1,2 Anna Aschenbrenner,1,3 Christoph Thiele,4 Collins K Boahen,1 Alexander Schiltmans,1 Johannes W A Smit,5 Joachim L Schultze,3 Mihai G Netea,1,6 Gosse J Adema ,2 Romana T Netea- Maier5
To cite: Rabold K, Aschenbrenner A, Thiele C, et al. Enhanced lipid biosynthesis in human tumor- induced macrophages contributes to their protumoral characteristics. Journal for ImmunoTherapy of Cancer 2020;8:e000638. doi:10.1136/jitc-2020-000638
► Additional material is published online only. To view please visit the journal online (http:// dx. doi. org/ 10. 1136/ jitc- 2020- 000638).
GJA and RTN- M contributed equally.
Accepted 10 August 2020
For numbered affiliations see end of article.
Correspondence toKatrin Rabold; katrin. rabold@ radboudumc. nl
Original research
© Author(s) (or their employer(s)) 2020. Re- use permitted under CC BY- NC. No commercial re- use. See rights and permissions. Published by BMJ.
ABSTRACTBackground Tumor- associated macrophages (TAMs) are key components of the tumor microenvironment (TME) in non- medullary thyroid carcinoma (TC) and neuroblastoma (NB), being associated with a poor prognosis for patients. However, little is known about how tumors steer the specific metabolic phenotype and function of TAMs.Methods In a human coculture model, transcriptome, metabolome and lipidome analysis were performed on TC- induced and NB- induced macrophages. The metabolic shift was correlated to functional readouts, such as cytokine production and reactive oxygen species (ROS) production, including pharmacological inhibition of metabolic pathways.Results Based on transcriptome and metabolome analysis, we observed a strong upregulation of lipid biosynthesis pathways in TAMs. Subsequently, lipidome analysis revealed that tumor- induced macrophages have an increased total lipid content and enriched levels of intracellular lipids, especially phosphoglycerides and sphingomyelins. Strikingly, this metabolic shift in lipid synthesis contributes to their protumoral functional characteristics: blocking key enzymes of lipid biosynthesis in the tumor- induced macrophages reversed the increased inflammatory cytokines and the capacity to produce ROS, two well- known protumoral factors in the TME.Conclusions Taken together, our data show that tumor cells can stimulate lipid biosynthesis in macrophages to induce protumoral cytokine and ROS responses and advocate lipid biosynthesis as a potential therapeutic target to reprogram the TME.
BACKGROUNDThe tumor microenvironment (TME) is heterogeneous in terms of cell populations: in addition to tumor cells themselves, endo-thelial cells and fibroblasts, populations of immune inflammatory cells also play an important role in shaping the TME. It is well described that inflammation and immune evasion are two hallmarks of cancer, contrib-uting to tumor outgrowth and tumor progres-sion.1–5 Tumor- associated macrophages (TAMs) are among the most abundant innate immune cells in the TME. They have an
important mutual relationship with tumor cells, as tumor cells modulate the function of macrophages and thereby contribute to programming of TAMs, which in turn influ-ences the behavior of tumor cells.6 In theory, macrophages have the ability to play an effec-tive role in tumor elimination. However, in established tumors, TAMs promote cancer cell survival, proliferation, metastasis, angio-genesis and immune suppression.7
One key feature of macrophages is their plasticity, enabling them to adapt to changes in their environment by adjusting their cellular metabolism and transcriptional program. In the TME, infiltrating monocytes encounter signals from tumor cells, leading to metabolic programming and functional adaptations.7–9 Thereby, tumor cells educate TAMs to gain a tumor supportive phenotype. Furthermore, a high density of TAMs in the TME is asso-ciated with poor prognosis in many types of cancer, supporting the protumoral functions of TAMs.10–14 There is considerable interest in understanding the cellular pathways that underpin the protumor phenotype of TAMs. Subsequently, interfering with such pathways in TAMs may be a promising novel thera-peutic strategy.
In the last decade, the field of immunome-tabolism has provided data on the metabolic profile of immune cells and on the mecha-nisms through which cellular metabolism shapes the immune cells’ activation state and function.15 For example, in vitro classically activated M1 macrophages, use anaerobic glycolysis, protein and fatty acid (FA) synthesis metabolic pathways,16 whereas alternatively activated M2 macrophages are mainly using oxidative phosphorylation (OXPHOS) for energy metabolism.17 However, little is known about the programming and the specific metabolic phenotype of human macrophages in the context of cancer. In the present study,
on Decem
ber 1, 2021 by guest. Protected by copyright.
http://jitc.bmj.com
/J Im
munother C
ancer: first published as 10.1136/jitc-2020-000638 on 17 Septem
ber 2020. Dow
nloaded from
2 Rabold K, et al. J Immunother Cancer 2020;8:e000638. doi:10.1136/jitc-2020-000638
Open access
we aim to investigate the metabolic and functional charac-teristics of TAMs in the context of non- medullary thyroid carcinoma (TC) and neuroblastoma (NB). TC and NB are both known to be infiltrated by macrophages and this correlates with prognosis.11 12 14
In our earlier work using a discovery- based method-ology on transcriptome analysis of human TC- induced macrophages, we showed that metabolic programming is a key feature of these macrophages.18 The discov-ered changes in glycolysis and OXPHOS were validated with metabolic approaches.18 Next to the major energy source glucose, also the metabolism of lipids may play an important role in macrophage differentiation and polar-ization, as studies in murine macrophages suggest.19 20 Here, we show that human tumor- induced macrophages are also characterized by an increase in FA synthesis, which impacts important immunological functions. Furthermore, these findings are not specific for TC but also observed in NB- induced macrophages. Collectively, these novel discoveries on the metabolic program in TAMs may have potential for the identification of novel therapeutic approaches in malignancies.
METHODSIsolation of PBMCs and monocytesPeripheral blood mononuclear cells (PBMCs) were isolated from blood of healthy volunteers by density gradient centrifugation using Ficoll- plaque (GE Health-care, Diegem, Belgium). PBMCs were washed in cold phosphate buffered saline (PBS, Braun Melsungen, Germany) and resuspended in Roswell Park Memo-rial Institute (RPMI) 1640 Dutch modification culture medium (Life Technologies, Carlsbad, California, USA) supplemented with gentamycin 50 µg/mL, pyruvate 1 mM, glutamax 2 mM and counted using a Coulter particle counter (Beckman Coulter, Fullerton, California, USA). Monocytes were isolated within the PBMC fraction using Percoll as described previously.21
Coculture modelThe coculture experiments were performed using the TC cell lines TPC-1 (papillary, RET/PTC rearrange-ment) and FTC-133 (follicular, PTEN deficient) cell lines22 and the NB cell lines SK- N- AS and IMR-32 (MYC- amplification). The cancer cell lines and cocultures were cultured as described previously.18 A total of 1.0×10⁶ Percoll- enriched monocytes in 500 µL were added to the lower compartment of the trans- well system in coculture medium: RPMI (Life Technologies, Carlsbad, California, USA) supplemented with glucose 5 mM, pyruvate 1 mM, glutamine 2 mM, gentamicin 50 ug/mL and HEPES 10 mM (Life Technologies, Carlsbad, California, USA). After 1- hour adhesion in the 24- well plates, non- adherent cells comprising mainly lymphocytes were discarded, and the adherent monocytes were incubated with the tumor cells in the upper compartments. Medium alone or the same number of monocytes was used as controls.
In some experiments, the FASN inhibitor C75 (2 µM; Sigma- Aldrich, St. Louis, Missouri, USA), the CD36 inhib-itor Sulfo- N- succinimidyl oleate (25 µM; Sigma- Aldrich) or lactate receptor antagonist α-cyano-4- hydrocycinnamioic acid (1 mM; Sigma- Aldrich) were added to the medium.
After 24 hours of incubation, the cell culture inserts were discarded and the adherent monocytes were stimu-lated for 24 hours with RPMI or 10 ng/mL lipopolysaccha-ride (LPS) (E. coli strain O55:B5, Sigma- Aldrich). At the end of the incubation period, supernatant was collected and stored at −20°C until further analysis.
Transcriptome analysisRNA isolation, deep sequencing and analysis were performed as described by Arts et al.18 The detailed data have been deposited in the GEO database with accession number GSE76445.
RNA isolation, cDNA synthesis and RT-qPCRAfter coculture, RNA from monocytes/macrophages was extracted in 500 µL of TRIzol reagent (Invitrogen, Carlsbad, California, USA). RNA was reverse transcribed into complementary- DNA using oligo(dT) primers and MMLV reverse transcriptase. PCR was performed using 7300 PCR system (Applied Biosystems). The primer sequences are as follows: FASN AAGG ACCT GTCT AGGT TTGATGC (forward) and TGGC TTCA TAGG TGAC TTCCA (reverse), ACACA TCGC TTTG GGGG AAAT AAAGTG (forward) and GTGT GACC ATGA CAAC GAATCTA (reverse), FADS2 GGAT GGCT GCAA CATG ATTATGG (forward) and GCAG AGGC ACCC TTTA AGTGG (reverse), CD206 CTAC AAGG GATC GGGT TTATGGA (forward) and TTGG CATT GCCT AGTA GCGTA (reverse), CD163 TGAA GACT CTGG ATCT GCTGA (forward) and GAAC TGGT GACA AAAC AGGCA (reverse), MerTK GCCCCATCAGTAGCACCTTT (forward) and GCTC TTTG GAAA TCCC TGCAC (reverse). β2M was used as a reference gene, for which the primers were ATGAGTATGCCTGCCGTGTG (forward) and CCAA ATGC GGCA TCTT CAAAC (reverse). PCR conditions were as follows: 2 min at 50°C, followed by 40 cycles of PCT at 95°C for 15 s and 60°C for 1 min.
Flow cytometryCells were harvested by scraping in cold PBS, washed in PBS and incubated with the viability dye eFluor 780 (eBioscience, San Diego, California, USA) at room temperature for 20 min. After washing with PBS, blocking was performed with PBS containing 2% human serum (Sanquin, Nijmegen, The Netherlands) at 4°C for 10 min. Next, cells were washed with PBA (PBS containing 0.5% bovine serum albumin (Roche, Indianapolis, Indiana, USA) and 0.01% sodium azide) and incubated with the following directly conjugated monoclonal antibodies at 4°C for 20 min: CD163- APC (eBioscience), CD206- AF488 (eBioscience), CD86- PECy7 (Becton Dickinson, Franklin Lakes, New Jersey, USA) or MerTK- PECy7 (Biolegend, San Diego, California, USA), MHCII- BV421 (Becton
on Decem
ber 1, 2021 by guest. Protected by copyright.
http://jitc.bmj.com
/J Im
munother C
ancer: first published as 10.1136/jitc-2020-000638 on 17 Septem
ber 2020. Dow
nloaded from

3Rabold K, et al. J Immunother Cancer 2020;8:e000638. doi:10.1136/jitc-2020-000638
Open access
Dickinson). After washing in PBS twice, cells were resus-pended in PBA and measured on Cytoflex (Beckman Coulter) flow cytometer. Data were analyzed in Kaluza 2.1 (Beckman Coulter) where events were gated on single cells for further analysis.
MetabolomicsMetabolite extractionCells were washed with 75 mM ammonium carbonate (Sigma- Aldrich, St. Louis, Missouri, USA) pH7.4, quenched by snap freezing with liquid nitrogen and stored at −80°C. Metabolites were extracted with 500 µL extraction solution (70% ethanol, 70°C) for 3 min. Extraction was repeated one more time with 200 µL extraction solution, allowing for a high recovery rate to perform qualitative comparison between conditions. The extracts were collected in 1.5 mL Eppendorf tubes and centrifuged (4°C, 14 000 rpm, 10 min). Supernatants were stored at −80°C until analysis by mass spectrometry, as described by Fuhrer et al.23
Clustering analysisStatistical analyses were performed by programming language R, a free software environment for statistical computing and graphics.24 Principal component analysis (PCA) was applied to cluster metabolites data consisting of induced and naïve samples. The prcomp function was used to calculate principal components from the high dimensional metabolites data. Consequently, the first two principal components which explain the majority of vari-ations in the dataset were plotted to visualize potential clusters of samples.
Fold change analysisDifferential expression analysis was conducted to inves-tigate the associations between lipid metabolites and groups (Control versus Induced) using limma.25 limma is a powerful package implemented in R/Bioconductor and widely used for differential analysis. Generally, limma operates on a matrix consisting of expression profiles, that is, (lipid) metabolites concentrations in this study whereby the rows and columns consist of metabolites and samples respectively. limma fits a linear model to each row and employs empirical Bayes statistics to generate stable results. A contrast matrix to make comparisons between the Induced versus Control samples was formed after fitting a linear model. A combination of the fit and contrast matrix was used to compute fold changes to determine upregulated and downregulated metabolites. Benjamini- Hochberg correction was used to correct for multiple comparisons.
LipidomicsIsolated cells were washed with PBS and 150 mM ammo-nium acetate and rapidly pelleted. To the pellet, 500 µL of extraction mix (CHCl3/MeOH 1/5 containing internal standards: 210 pmol PE (31:1), 396 pmol PC (31:1), 98 pmol phosphatidylserine (31:1), 84 pmol phos-phatidylinositol (34:0), 56 pmol phosphatidic acid (PA)
(31:1), 51 pmol phosphatidylglycerol (28:0), 28 pmol cardiolipin (56:0), 39 pmol LPA (17:0), 35 pmol lysophos-phatidylcholine (LPC) (17:1), 38 pmol lysophosphatidy-lethanolamine (LPE) (17:0), 32 pmol Cer (17:0), 99 pmol sphingomyelins (SM) (17:0), 55 pmol GlcCer (12:0), 14 pmol GM3 (18:0- D3), 359 pmol TG (47:1), 111 pmol CE (17:1), 64 pmol DG (31:1), 103 pmol MG (17:1), 724 pmol Chol(d6), 45 pmol Car(15:0)) were added and the sample was sonicated for 2 min followed by centrifuga-tion at 20 000 g for 2 min. The supernatant was collected into a new tube and 200 µL chloroform and 800 µL 1% AcOH in water were added, the sample briefly shaken and spun for 2 min at 20 000 g. The upper aqueous phase was removed and the entire lower phase transferred into a new tube and evaporated in a speed vac (45°C, 10 min). Spray buffer (500 µL of 8/5/1 2- propanol/MeOH/water, 10 mM ammonium acetate) was added, the sample was sonicated for 5 min and infused at 10 µL/min into a Thermo Q Exactive Plus spectrometer equipped with the HESI II ion source for shotgun lipidomics. MS1 spectra (resolution 280 000) were recorded in 100 m/z windows from 250 to 1200 m/z (pos.) and 200–1700 m/z (neg.) followed by recording MS/MS spectra (res. 70000) by data independent acquisition in 1 m/z windows from 200 to 1200 (pos.) and 200–1700 (neg.) m/z. Raw files were converted to .mzml files and imported into and analyzed by LipidXplorer software using custom mfql files to iden-tify sample lipids and internal standards. For further data processing, absolute amounts were calculated using the internal standard intensities followed by calculation of mol% of the identified lipids.
Cytokine and lactate productionInterleukin-10 (IL-10) (Sanquin, Amsterdam, Nether-lands), IL-6 and tumor necrosis factor α (TNF-α) (R&D, the Netherlands) concentrations in the cell culture supernatant were measured by commercial ELISA kits according to the instruction of the manufacturer. Lactate was measured by a Lactate Fluorometric Assay Kit (Biovi-sion, California, USA).
Western blotTPC-1- induced macrophages were cultured as described above and Brefeldin A (1 µg/mL) was added 1 hour after LPS stimulation. After 4- hour LPS stimulation, cells were lysed. Total protein amounts were determined by BCA assay (Thermo Fisher Scientific, Massachusetts, USA). Samples were mixed and boiled at 95°C for 5 min with Laemmli buffer and Dithiothreitol. Equal amounts of proteins were loaded on precasted 4%–15% gels (Biorad, California, USA). The separated proteins were trans-ferred to a PVDF membrane (Merck Millipore, The Neth-erlands), which was blocked with 5% milk. Incubation overnight at 4°C with recombinant rabbit monoclonal anti- TNF alpha antibody (abcam, Cambridge, UK) and mouse monoclonal anti-β-actin antibody (Santa Cruz Biotechnology, Texas, USA) was used to determine the protein expression, which was visualized using secondary
on Decem
ber 1, 2021 by guest. Protected by copyright.
http://jitc.bmj.com
/J Im
munother C
ancer: first published as 10.1136/jitc-2020-000638 on 17 Septem
ber 2020. Dow
nloaded from

4 Rabold K, et al. J Immunother Cancer 2020;8:e000638. doi:10.1136/jitc-2020-000638
Open access
antibodies goat- anti- rabbit IRDye 680 and goat- anti- mouse IRDye 800, respectively.
ROS assayControl monocytes and tumor- induced macrophages were detached and a total of 100 000 cells were exposed to 50 ng/mL Phorbol 12- myristate 13- acetate (PMA) (Sigma- Aldrich) or 3 mg/mL of plasma- opsonized Zymosan A (Sigma- Aldrich). Reactive oxygen species (ROS) formation was detected by a chemiluminescence assay using 0.1 mM 5- amino-2,3- dihydro-1,4- phthalazinedione (luminol) (Sigma- Aldrich). The luminometer measured chemiluminescence in the integration mode at 37°C every 142 s for 1 hour after luminol had been added.
Cell viabilityCell viability was determined using a lactate dehydroge-nase cytotoxicity assay (CytoTox 96 Non- Radioactive Cyto-toxicity Assay, Promega, Minnesota, USA) according to the manufacturer’s instructions using fresh supernatants.
Statistical analysisAll analyses were performed in Graphpad Prism 5 (Cali-fornia, USA). Differences in gene expression levels and surface expression were analyzed using two- way ANOVA followed by Bonferroni’s multiple comparison test. Differences in cytokine production were analyzed using two- tailed paired t- test. Data are shown as means±SEM.
RESULTSTranscriptome analysis: FA synthesis is upregulated in tumor-induced macrophagesIn a previous study, we generated genome- wide transcrip-tome data by RNA- sequencing of TC- induced macro-phages, using the TPC-1 cell line in an indirect transwell coculture system for 24 hours. The transcriptome of control monocytes was compared with that of tumor- induced macrophages. Cells were cultured in serum- free medium with low glucose concentrations (5 mM) to avoid the effects of exogenous metabolites on intra-cellular metabolism. After 24 hours, both were stimu-lated with the toll- like receptor 4 (TLR4)- agonist LPS or medium as control for 4 or 24 hours (see experimental setup in figure 1A), simulating the release of endoge-nous TLR ligands from injured cells, such as dying tumor cells. As a first analysis of this dataset, we reported that mTOR- dependent aerobic glycolysis and inflammation- related pathways were enriched in the TC- induced macrophages.18
In the current study, we focus on the strong enrichment of the hallmark pathway ‘FA metabolism’, which was enriched at the 4- hour time point. Using reactome path-ways to compute enrichment, we found that the pathways ‘synthesis of very long chain FAs’ and ‘peroxisomal lipid metabolism’ were enriched at the 4- hour time point, and that the lipid- related pathways ‘sphingolipid metabo-lism’, ‘HDL- mediated lipid transport’ and ‘phospholipid
metabolism’ were enriched at the 24- hour time point (figure 1B). Interestingly, after stimulation with the TLR4- agonist LPS for 24 hours, we found even more lipid- related pathways to be enriched, mainly related to de novo biosynthesis of lipids or FAs (figure 1 and online supplemental table 1).
To validate the transcriptome data, qPCR was performed for the most significantly upregulated lipid- related genes. We confirm that key enzymes in FA biosyn-thesis (FASN and ACACA) and FA desaturation (FADS2) were upregulated in TC- induced (TPC-1 and FTC-133 cell line) macrophages. We also extended our study to NB- in-duced (SK- N- AS and IMR-32 cell line) macrophages, as NB is another tumor type known to be highly infiltrated by macrophages. Interestingly, two independent NB cell lines (SK- N- AS and IMR-32 cell line) also induced macro-phages to express higher levels of ACACA and higher levels of FADS2 after LPS stimulation (figure 1D). Stimu-lation with LPS affected the expression levels only mildly.
These results indicate that FA synthesis is upregulated in tumor- induced macrophages at the 4- hour and 24- hour time point. After 24- hour LPS stimulation, FA synthesis is the most apparent transcriptional characteristic of tumor- induced macrophages. This transcriptional signature is present in TC- induced macrophages and observed in NB- induced macrophages.
To further characterize the tumor- induced macro-phages, cell- surface expression of the macrophage polar-ization markers MHC- II and CD86 (M1- associated) as well as CD206, CD163 and MerTK (M2- associated) were measured by flow cytometry (figure 1E). Overall, expres-sion levels were low, with only 5%–40% of cells showing positivity, indicating a broad heterogeneity in the cell population at this quite early timepoint (48 hours). Cell viability was 80%–90% in all conditions, as determined by a viability dye (online supplemental figure 1). Inter-estingly, expression of the M1 markers MHC- II and CD86 was not affected by the presence of tumor cells, whereas a significant upregulation of the M2- associated markers CD206, CD163 and MerTK was observed in both TPC-1- induced and SK- N- AS- induced macrophages (figure 1E). These findings were validated by qPCR showing an increased expression of the M2- associated markers on the transcriptional level (online supplemental figure 2). This pattern was present in both the unstimulated and the LPS- stimulated condition, but was most prominent in the unstimulated condition.
Metabolome analysis: lipid metabolism is enhanced in tumor-induced macrophagesTo validate the changes in the lipid metabolism iden-tified at the level of the transcriptome, and to enable a comprehensive and complete analysis of the meta-bolic programming of tumor- induced macrophages, non- targeted mass- spectrometry- based metabolomics measurements, identifying 1121 metabolites, were performed on TPC-1- induced macrophages. Mono-cytes that were cocultured with monocytes in the upper
on Decem
ber 1, 2021 by guest. Protected by copyright.
http://jitc.bmj.com
/J Im
munother C
ancer: first published as 10.1136/jitc-2020-000638 on 17 Septem
ber 2020. Dow
nloaded from

5Rabold K, et al. J Immunother Cancer 2020;8:e000638. doi:10.1136/jitc-2020-000638
Open access
compartment of the transwells were used as a control. Following 24 hours of coculture, cells were stimulated with medium or LPS for 24 hours (see experimental setup in figure 2A). Using KEGG pathway analysis to compute enrichment, we found that several lipid- related pathways and the pathway ‘Glycolysis’ were among the most highly enriched pathways (figure 2B). Although the p values were low, due to a relatively limited sample size (n=3), these data confirmed an increase of mainly lipid- related metabolites. Principal component analysis (PCA) based on all metabolites did not reveal a clear separation of control monocytes from tumor- induced macrophages (figure 2C), whereas a
PCA based selectively on all lipid metabolites detected within the metabolomics dataset did reveal a clear sepa-ration (figure 2D). This lipid metabolite signature was most pronounced in the unstimulated (RPMI) condi-tion (figure 2E), with 99 lipids being significantly enriched, compared with LPS- restimulated cells, where changes in lipids did not reach significance (data not shown). Interestingly, the most highly upregulated lipids in TPC-1- induced macrophages were mainly phospholipids, such as phosphatidylcholines (PC) and phosphatidylethanolamines (PE) (figure 2E). A table of all identified significantly upregulated lipid metabolites is provided in online supplemental table 2. Altogether,
Figure 1 Transcriptome analysis of tumor- induced macrophages. (A) Experimental setup. (B) Volcano plots of NES and enrichment p values based on GSEA using Reactome pathway gene sets (MSigDB, Broad Institute). Data are shown for TPC-1- induced macrophages (4 hours and 24 hours). Dark (NES≥1; p≤0.05) and light (NES≥1; p>0.05, ≤0.1) red circles show gene sets positively enriched. Dark and light blue circles show gene sets depleted (NES≤−1). (C) Pathway enrichment analysis of TPC-1- induced macrophages after 24 hours LPS stimulation. Normalized enrichment score and p value are shown of the top 15 enriched pathways. Pathways related to FA metabolism are highlighted in red. (D) Tumor- induced macrophages were stimulated for 24 hours with LPS or medium control (RPMI), RNA was isolated and expression of key enzymes involved in FA synthesis, FASN and ACACA, and FA desaturation, FADS2, was determined. Data are means±SEM (n=2–9 donors, three independent experiments), Two- way ANOVA followed by Bonferroni’s multiple comparison test. (E) Surface expression of macrophage polarization markers. Cells were stained as described and the percentage of single viable cells expressing high levels of MHC- II, CD86, CD206, CD163, MerTK was determined. Data are means±SEM (n=3–6 donors, three independent experiments), Two- way ANOVA followed by Bonferroni’s multiple comparison test. ANOVA, analysis of variance; FA, fatty acid; LPS, lipopolysaccharide; NES, normalized enrichment scores.
on Decem
ber 1, 2021 by guest. Protected by copyright.
http://jitc.bmj.com
/J Im
munother C
ancer: first published as 10.1136/jitc-2020-000638 on 17 Septem
ber 2020. Dow
nloaded from

6 Rabold K, et al. J Immunother Cancer 2020;8:e000638. doi:10.1136/jitc-2020-000638
Open access
these data confirm that lipid metabolism is one of the key metabolic process affected in tumor- induced macrophages. Importantly, one should note that the metabolome analysis can only serve as an indication for a broader group of metabolites, after which further vali-dation is necessary.
Lipidome analysis: enrichment of phospholipids and sphingomyelins in tumor-induced macrophagesTo validate our combined transcriptome and metabo-lome findings and in order to be able to identify which specific lipid classes or species are specifically enriched in tumor- induced macrophages, we performed lipi-domics. A dedicated lipidome analysis with a higher coverage and specificity for lipid species was performed by mass spectrometry on TPC-1- induced macrophages and control monocytes (see experimental setup in
figure 2A). Lipidomics provides molecular lipid species concentrations of several lipid classes and complete FA composition of the lipid species. We found that TPC-1- induced macrophages had a higher total lipid content, both with and without LPS stimulation (p=0.0075 after LPS stimulation) compared with control monocytes (figure 3A). Analysis of the lipid classes showed that especially concentrations of the SM (unstimulated p=0.072) and the phospholipid class PE (unstimulated p=0.014, LPS- stimulated p=0.015) were increased, whereas PA (unstimulated p=0.008, LPS- stimulated p=0.015), the lysophospholipids LPE (unstimulated p=0.036, LPS- stimulated p=0.012) and LPC (unstimu-lated p=0.062, LPS- stimulated p=0.011) and ceramides (Cer) (unstimulated p=0.019, LPS- stimulated p=0.045) were decreased (figure 3B). Interestingly, analysis of
Figure 2 Metabolome analysis of TPC-1- induced macrophages. Metabolite changes in TPC-1- induced macrophages relative to control monocytes on 24 hours rest (RPMI) and 24 hours LPS stimulation (n=3 donors). (A) Experimental setup. (B) Analysis of enriched KEGG pathways in TPC-1 – induced macrophages versus control monocytes (NES). (C) PCA plot based on all metabolites or (D) lipid metabolites specifically. (E) Volcano plot of log2 fold change and –log10 adjusted p values based on lipids in TPC-1- induced macrophages after medium (RPMI) stimulation. Red circles (p<0.05) show lipids positively enriched. NES, normalized enrichment score.
on Decem
ber 1, 2021 by guest. Protected by copyright.
http://jitc.bmj.com
/J Im
munother C
ancer: first published as 10.1136/jitc-2020-000638 on 17 Septem
ber 2020. Dow
nloaded from

7Rabold K, et al. J Immunother Cancer 2020;8:e000638. doi:10.1136/jitc-2020-000638
Open access
the chain length and saturation revealed that lipids in TPC1- induced macrophages contained significantly shorter FA chains after LPS stimulation (p=0.016) and a trend to less double bonds and thus more saturated lipids in TPC-1- induced macrophages (figure 3C). Differentially expressed lipid species, based on a prin-cipal component analysis, as well as chain length and saturation per lipid class are accessible in online supple-mental figure 3. Similar findings were obtained in a second, independent experiment even with a lower cell number input (n=3) (data not shown).
Taken together, lipidome analysis confirmed upreg-ulation of FA synthesis at the transcriptional level in tumor- induced macrophages by revealing an increase in total lipid content, with glycerophospholipids and SM being the main contributors. In parallel, the building blocks for these lipid species, such as PA, lysophos-pholipids and ceramide, are decreased (figure 3D).
The observation that mainly phospholipid species are upregulated is in line with the metabolome analysis.
Lipid biosynthesis in tumor-induced macrophages contributes to their inflammatory phenotypeIn a following set of experiments, we set out to elucidate the functional relevance of the enhanced FA biosyn-thesis. Cellular metabolism of macrophages is known to be crucial for their inflammatory function, and many lipid species modulate inflammation.26 27 To assess the inflammatory function of tumor- induced macrophages, we measured cytokine production of macrophages after coculture with TC (TPC-1 and FTC-133) and NB (IMR-32 and SK- N- AS) cell lines. All these tumor cell lines induced higher production of TNF- alpha, IL-6 and IL-10 in macrophages compared with control monocytes after LPS stimulation (figure 4A). One of the inflammatory metabolites known to be released by
Figure 3 Lipidome analysis of TPC-1- induced macrophages. (A) Relative lipid content is higher in TPC-1- induced macrophages after 24 hours rest (RPMI) and 24- hour LPS stimulation (p=0.0075) (n=4 donors, two independent experiments). (B) Relative amount of lipid classes in TPC-1- induced and control monocytes after 24- hour rest (RPMI) and 24- hour LPS stimulation (n=4 donors, two independent experiments). (C) Chain length and saturation in TPC-1- induced macrophages and control monocytes after 24- hour rest (RPMI) or LPS stimulation (n=4 donors, two independent experiments). (D) Schematic representation of upregulated (red arrow) and downregulated (blue arrow) lipids in the lipid biosynthesis pathway. Car, carnitine; CE, cholesteryl ester; Cer, ceramide; CL, cardiolipin; DAG, diacylglyceride; HexCer, hexosyl ceramide; LPC, lysophosphatidylcholine; LPE, lysophosphatidylethanolamine; PA, phosphatidic acid; PC, phosphatidylcholine; PC- O, esterified phosphatidylcholine; PE, phosphatidylethanolamine; PE- O, esterified phosphatidylethanolamine; PG, phosphatidylglycerol; PI, phosphatidylinositol; PS, phosphatidylserine; SM, sphingomyelin; TAG, triacylglyceride.
on Decem
ber 1, 2021 by guest. Protected by copyright.
http://jitc.bmj.com
/J Im
munother C
ancer: first published as 10.1136/jitc-2020-000638 on 17 Septem
ber 2020. Dow
nloaded from

8 Rabold K, et al. J Immunother Cancer 2020;8:e000638. doi:10.1136/jitc-2020-000638
Open access
tumor cells is lactate, the end- product of glycolysis in the Warburg effect.8 This prompted us to investigate lactate concentrations in tumor- conditioned medium. TC cell lines as well as NB cell lines secrete lactate, although the NB cells secrete slightly lower amounts (figure 4B). In line with earlier findings by our group,18 blockade of the lactate receptor in the coculture setting signifi-cantly reduced cytokine response by tumor- induced macrophages, in TC- induced as well as NB- induced macrophages (figure 4A).
To investigate the role of lipid biosynthesis in the inflammatory function of TC- induced (TPC-1 cell line) macrophages, lipid biosynthesis was inhibited by the
well- characterized FASN inhibitor C75, and cytokine production was assessed. Inhibition of lipid biosyn-thesis significantly reduced extracellular cytokine levels of TNF- alpha, IL-6 and IL-10 in the coculture setting (figure 4C,D, upper panels). In order to exclude that these findings are due to the direct effect of the inhib-itor on the tumor cells and not on the macrophages, FA synthesis was inhibited in the monocytes or the tumor cells separately (see experimental setup in figure 4C, middle and lower panel, respectively). Conditioned medium from untreated tumor cells supplemented with the inhibitor also reduced cytokine responses in tumor- induced macrophages (figure 4D, middle panel). In
Figure 4 Cytokine responses of tumor- induced macrophages. (A) On 24- hour LPS stimulation, tumor- induced macrophages show higher extracellular levels of TNF- alpha, IL-6 and IL-10 (white bars). Inhibition of lactate receptor during the coculture reduces extracellular cytokine levels (black bars) (n=9 donors, three independent experiments, SEM, two- way ANOVA followed by Bonferroni’s post- test). (B) Lactate concentrations in 24 hours conditioned medium from thyroid carcinoma (TPC-1 and FTC-133) and neuroblastoma (SK- N- AS and IMR-32) cell lines (n=12 replicates, three independent experiments, SEM, one- way ANOVA followed by Bonferroni’s multiple comparison test). (C) Experimental setup to distinguish between the effect of pharmacological inhibitor in the coculture system on both tumor cells and monocytes (coculture), monocytes alone (conditioned medium) and tumor cells alone (inhibited tumor cell). (D) Treatment with fatty acid synthesis inhibitor (C75) during coculture and during culture in tumor conditioned medium treatment reduces cytokine responses on 24 hours LPS stimulation. Pretreatment of tumor cells with C75 does not affect cytokine responses in monocytes. Unstimulated cells did not produce detectable cytokine levels (data not shown). Data are means±SEM, n=8 donors, three independent experiments, two- tailed paired t- test. Dotted lines indicating lower detection limit. ANOVA, analysis of variance; LPS, lipopolysaccharide.
on Decem
ber 1, 2021 by guest. Protected by copyright.
http://jitc.bmj.com
/J Im
munother C
ancer: first published as 10.1136/jitc-2020-000638 on 17 Septem
ber 2020. Dow
nloaded from

9Rabold K, et al. J Immunother Cancer 2020;8:e000638. doi:10.1136/jitc-2020-000638
Open access
contrast, when the inhibitor was solely added to the tumor cells and was removed before adding monocytes in the lower compartment of the coculture (figure 4C, lower panel), no reduction in cytokine levels was observed (figure 4D, lower panel). These results show that inhibition of lipid biosynthesis in the macrophages, and not in the tumor cells, affects cytokine responses of tumor- induced macrophages. Interestingly, blockade of CD36- mediated FA uptake did not alter cytokine responses (online supplemental figure 4A). At the inhibitor concentrations tested, no cytotoxic effects or lysis of the monocytes was observed (online supple-mental figure 4B). Collectively, these results indicate that lipid biosynthesis in macrophages is critical for cytokine response to LPS stimulation.
Interestingly, at the transcriptional level, no obvious upregulation of cytokine production was seen in tumor- induced macrophages (after 4- hour LPS stimulation: TNF p=0.364, FC 1.149; IL6 p=0.033, FC −8.799; IL10 p=0.291, FC −1.121; after 24- hour LPS stimulation: TNF p=0.987, FC −1.116; IL6 p=0.991, FC −1.042; IL10 p=0.305, FC −1.328).18 We noted, however, that vesicle biogenesis was slightly upregulated in the tumor- induced macrophages (figure 1B). Furthermore, the identified enriched lipid species comprised mainly phospholipids that are main components of membranes. Together, these findings prompted us to investigate whether the enhanced lipid biosynthesis in tumor- induced macro-phages may cause higher extracellular cytokine levels via enhanced secretion of cytokines. Therefore, intra-cellular cytokine levels of TPC-1- induced macrophages and control monocytes were determined by Western blot on stimulation with LPS in the presence or absence of Brefeldin A to block cytokine secretion. Interest-ingly, intracellular TNF- alpha levels were higher in TPC-1- induced macrophages compared with control monocytes 4 hours after stimulation with LPS including blockade of secretion by Brefeldin A (figure 5A), showing that there is an increased cytokine production
in TPC-1- induced macrophages. In line with previous findings, extracellular cytokine levels were significantly higher in TPC-1- induced macrophages (figure 5B). On treatment with Brefeldin A, these differences in extracellular cytokine levels were no longer observed (figure 5B), showing that treatment with Brefeldin A successfully blocked cytokine secretion. In combination with the intracellular cytokine levels on Brefeldin A treatment, these data show that the higher extracellular cytokine levels in tumor- induced macrophages are most likely caused by (post)- transcriptional changes.
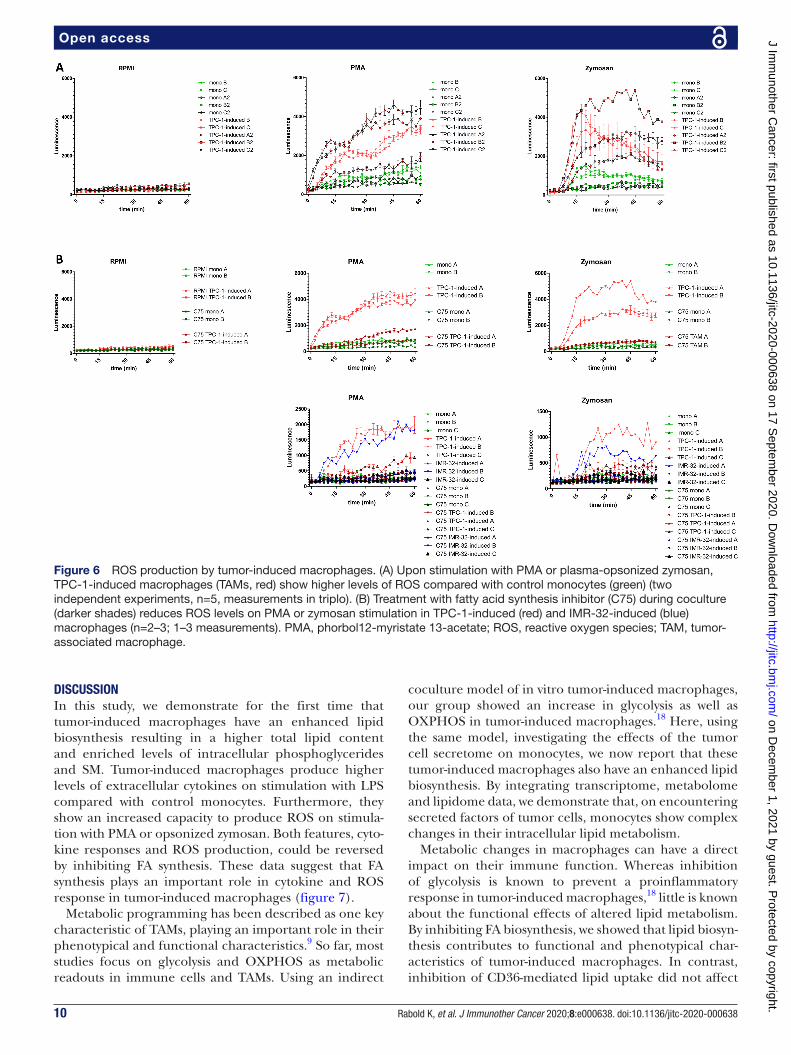
Lipid biosynthesis in tumor-induced macrophages is necessary for increased ROS production capacityNext to cytokines, other inflammatory mediators produced by macrophages are the ROS. ROS are consid-ered potent DNA- damaging agents, which are believed to be neoplasia- preceding events in thyroid cells and are also suggested to contribute to maintenance of genomic instability during the subsequent phases of tumorigen-esis.28 29 Furthermore, in NB, ROS are associated with a more aggressive tumor phenotype.30 Therefore, we inves-tigated whether ROS production was enhanced in tumor- induced macrophages. After coculture, tumor- induced macrophages and control monocytes were harvested to determine ROS production. To induce ROS produc-tion, cells were treated with the ROS- inducers PMA or opsonized zymosan during a 1- hour time period. On treatment with ROS- inducers, TPC-1- induced macro-phages showed significantly higher ROS levels compared with control monocytes, although we do observe donor variation, with some donors showing low levels of ROS (figure 6A). Interestingly, when lipid biosynthesis was inhibited during coculture, ROS levels in TPC-1- induced macrophages and IMR-32–induced macrophages were strongly reduced to the levels of control monocytes (figure 6B). These results indicate that lipid biosynthesis is critical for the capacity of tumor- induced macrophages to produce ROS.
Figure 5 Increased extracellular cytokine levels of TPC-1- induced macrophages are not caused by an enhanced cytokine secretion. Monocytes were cocultured with TPC-1 cells or monocytes for 24 hours in a transwell system. After removal of the transwell, (tumor- induced) macrophages were stimulated with LPS for 4 hours. On 1 hour with LPS, secretion was blocked with Brefeldin A. (A) Western blot analysis was performed to detect intracellular levels of TNF- alpha and β-actin as control. Quantification of TNF- alpha was performed relative to β-actin (right panel). (B) Extracellular TNF- alpha levels were determined by ELISA (n=2 donors). LPS, lipopolysaccharide; TNF- alpha, tumor necrosis factor alpha.
on Decem
ber 1, 2021 by guest. Protected by copyright.
http://jitc.bmj.com
/J Im
munother C
ancer: first published as 10.1136/jitc-2020-000638 on 17 Septem
ber 2020. Dow
nloaded from
10 Rabold K, et al. J Immunother Cancer 2020;8:e000638. doi:10.1136/jitc-2020-000638
Open access
DISCUSSIONIn this study, we demonstrate for the first time that tumor- induced macrophages have an enhanced lipid biosynthesis resulting in a higher total lipid content and enriched levels of intracellular phosphoglycerides and SM. Tumor- induced macrophages produce higher levels of extracellular cytokines on stimulation with LPS compared with control monocytes. Furthermore, they show an increased capacity to produce ROS on stimula-tion with PMA or opsonized zymosan. Both features, cyto-kine responses and ROS production, could be reversed by inhibiting FA synthesis. These data suggest that FA synthesis plays an important role in cytokine and ROS response in tumor- induced macrophages (figure 7).
Metabolic programming has been described as one key characteristic of TAMs, playing an important role in their phenotypical and functional characteristics.9 So far, most studies focus on glycolysis and OXPHOS as metabolic readouts in immune cells and TAMs. Using an indirect
coculture model of in vitro tumor- induced macrophages, our group showed an increase in glycolysis as well as OXPHOS in tumor- induced macrophages.18 Here, using the same model, investigating the effects of the tumor cell secretome on monocytes, we now report that these tumor- induced macrophages also have an enhanced lipid biosynthesis. By integrating transcriptome, metabolome and lipidome data, we demonstrate that, on encountering secreted factors of tumor cells, monocytes show complex changes in their intracellular lipid metabolism.
Metabolic changes in macrophages can have a direct impact on their immune function. Whereas inhibition of glycolysis is known to prevent a proinflammatory response in tumor- induced macrophages,18 little is known about the functional effects of altered lipid metabolism. By inhibiting FA biosynthesis, we showed that lipid biosyn-thesis contributes to functional and phenotypical char-acteristics of tumor- induced macrophages. In contrast, inhibition of CD36- mediated lipid uptake did not affect
Figure 6 ROS production by tumor- induced macrophages. (A) Upon stimulation with PMA or plasma- opsonized zymosan, TPC-1- induced macrophages (TAMs, red) show higher levels of ROS compared with control monocytes (green) (two independent experiments, n=5, measurements in triplo). (B) Treatment with fatty acid synthesis inhibitor (C75) during coculture (darker shades) reduces ROS levels on PMA or zymosan stimulation in TPC-1- induced (red) and IMR-32- induced (blue) macrophages (n=2–3; 1–3 measurements). PMA, phorbol12- myristate 13- acetate; ROS, reactive oxygen species; TAM, tumor- associated macrophage.
on Decem
ber 1, 2021 by guest. Protected by copyright.
http://jitc.bmj.com
/J Im
munother C
ancer: first published as 10.1136/jitc-2020-000638 on 17 Septem
ber 2020. Dow
nloaded from

11Rabold K, et al. J Immunother Cancer 2020;8:e000638. doi:10.1136/jitc-2020-000638
Open access
their functional characteristics, pointing toward the func-tional importance of de novo lipid biosynthesis. Of note, CD36- mediated lipid accumulation has previously been reported for myeloid derived suppressor cells.31 Tumor- induced macrophages exhibited increased extracellular levels of the proinflammatory cytokines TNF- alpha and IL-6 as well as IL-10 on stimulation of TLR4 with LPS. FA biosynthesis is crucial for the capacity to produce cyto-kines, as inhibition of FA biosynthesis strongly decreased extracellular cytokine levels.
In addition to the increased cytokine responses, tumor- induced macrophages showed a higher capacity to produce ROS on stimulation with PMA or opsonized zymosan compared with control monocytes. Elevated levels of ROS are common hallmarks of cancer progres-sion and resistance to treatment. Upregulated levels of ROS can lead to oxidative damage, such as DNA muta-tions, causing cancer initiation and progression.32 In macrophages, ROS is known to be implicated as a crucial component in M2 phenotype modulation in vitro and the occurrence of TAMs in vivo.33 34 Here, we show that tumor- induced macrophages have a higher capacity to produce ROS on stimulation, which is strongly inhibited
by interfering with FA synthesis. FA synthesis thus plays a crucial role in ROS production in tumor- induced macrophages.
An inflammatory phenotype of macrophages has been demonstrated to characterize TAMs in many tumors.35 Through the release of inflammatory mediators, such as ROS, TNF- alpha and IL-6, TAMs are believed to mediate DNA damage, oncogenic transformation, inflammation- induced carcinogenesis and tumor progression.35 36 Many of the inflammatory cytokines produced by TAMs directly influence recruitment of stromal cells, tumor cell invasion, survival and angiogenesis. Cancer- related inflammation driven by TAMs is recognized as one of the hallmarks of cancer.1 By expressing IL-10, TAMs contribute to suppression of adaptive immunity, such as cytotoxic T cell responses.37 TAMs are often consid-ered to have a M2- like phenotype. However, novel transcriptome- based insights revealed that the dichot-omous M1/M2 macrophage model is outdated by a more fluent spectrum of macrophage activation states.38 Our findings of tumor- induced macrophages having increased production of TNF- alpha and IL-6 (‘M1- like’) and showing increased expression of CD206 and CD163 M2- like cell surface markers at the same time, underline the phenotypical variation of macrophage polarization also observed in vivo.
Interestingly, we observed an enhanced lipid content in the tumor- induced macrophages, especially of glycer-ophospholipids and SM. As these lipids are key compo-nents of the lipid bilayer of cell membranes and can be involved in secretory pathways,39 we hypothesized that they may be involved in secretion of cytokines from tumor- induced macrophages. However, we showed that the extracellular cytokine levels on stimulation are probably not caused by secretion of cytokines but rather a higher cytokine production. Possibly, glycerophospholipids and SM might be involved in signal transduction rather than secretory pathways in stimulated tumor- induced macro-phages, as sphingolipid metabolism is known to alter the trafficking and likely subsequent signaling of TLR4 after stimulation.39
In line with our findings, others have shown that FASN inhibition reduces IL-1β, TNF- alpha, IL-6 and IL-10 levels in response to various TLR agonists in mouse bone marrow- derived macrophages at the transcriptional level. FASN is an important regulator of TLR signaling during macrophage activation, with the FASN metabolite aceto-acetyl- CoA linking FA biosynthesis to cholesterol biosyn-thesis and thereby affecting lipid raft formation and TLR4 signaling.40 These findings indicate that upregulation of FASN may explain the increase in cytokine responses on LPS stimulation in tumor- induced macrophages. FASN upregulation may increase lipid raft formation and thereby TLR signaling in response to the TLR4 agonist LPS, which leads to higher cytokine responses. Further studies are needed to confirm that lipid raft formation and consequently TLR signaling is enhanced in tumor- induced macrophages.
Figure 7 Schematic summary. Soluble tumor- derived signals change the metabolic and functional characteristics of macrophages by induction of glycolysis and fatty acid biosynthesis leading to an enrichment of phospholipids and sphingomyelins. These metabolic features contribute to cytokine and ROS responses in tumor- induced macrophages, which are associated with a protumoral phenotype. DAG, diacylglyceride; FA, fatty acid; PC, phosphatidylcholines; PE, phosphatidylethanolamines; PI, phosphatidylinositol; PS, phosphatidylserine; ROS, reactive oxygen species; SM, sphingomyelins.
on Decem
ber 1, 2021 by guest. Protected by copyright.
http://jitc.bmj.com
/J Im
munother C
ancer: first published as 10.1136/jitc-2020-000638 on 17 Septem
ber 2020. Dow
nloaded from
12 Rabold K, et al. J Immunother Cancer 2020;8:e000638. doi:10.1136/jitc-2020-000638
Open access
In addition to incorporation into membranes, macro-phages can secrete lipid molecules to surrounding media that can be taken up by other cells. Previous studies have shown that macrophages transfer labeled cholesterol, FAs and PC to lymphocytes in culture, inhibiting lymphocyte proliferation.41–43 Furthermore, it has been shown that labeled lipid loaded- macrophages injected into the blood stream in vivo transfer labeled cholesterol and arachidonic acid to tissues in rats.44 This property of macrophages to transfer lipids may, in the context of tumor- induced macrophages, contribute to their protumoral function by feeding tumor cells with lipids for membrane formation and proliferation, and future studies are warranted to assess this hypothesis.
Interestingly, Ecker et al showed that during differentia-tion of primary human monocytes by M- CSF, phospholipid biosynthesis is induced whereas cholesterol biosynthesis is impaired. Furthermore, they show that FA biosynthesis is required for phagocytic differentiation in 4- day macro-phage culture.45 As we observe an increased phospholipid biosynthesis in tumor- induced macrophages, one may speculate that tumor- derived factors may similarly induce macrophage differentiation by upregulating phospho-lipid biosynthesis.
Interestingly, macrophages shifting from OXPHOS to glycolysis can also show accumulation of tricarboxylic acid (TCA) cycle intermediates, including fumarate, malate and succinate. Citrate, for example, can be redi-rected for the production of FA biosynthesis and phos-pholipids46 and can also generate NADPH via malic enzyme and pyruvate, required for ROS and NO produc-tion.47 Furthermore, an increased mitochondrial oxida-tion of succinate was shown to drive mitochondrial ROS production.48 As we see a similar metabolic programming in tumor- induced macrophages, showing an increase in glycolysis as well as increased succinate levels, we might observe higher ROS levels due to increased mitochon-drial oxidation of succinate.
In conclusion, using two models of tumors associated with a high macrophage infiltration, namely TC and NB,11 12 14 we show that tumor- induced macrophages undergo complex changes in their cellular metabolism on encountering secreted factors from tumor cells. Lipid biosynthesis is an important metabolic feature of tumor- induced macrophages, being involved in several protu-moral functional characteristics, such as cytokine and ROS production (figure 7). These findings may have implications for the development of novel therapeutic strategies targeting macrophages by metabolic program-ming in malignancies.
Author affiliations1Department of Internal Medicine, Radboud University Medical Center, Nijmegen, The Netherlands2Radiotherapy & OncoImmunology Laboratory, Department of Radiation Oncology, Radboud Institute for Molecular Life Sciences, Nijmegen, The Netherlands3Department for Genomics & Immunoregulation, Life and Medical Sciences Institute (LIMES), Bonn, Germany
4Biochemistry and Cell Biology of Lipids, Life and Medical Sciences Institute (LIMES), Bonn, Germany5Department of Internal Medicine, Division of Endocrinology, Radboud University Medical Center, Nijmegen, The Netherlands6Department of Immunology and Metabolism, Life and Medical Sciences Institute (LIMES), Bonn, Germany
Contributors MGN, RTN- M and GA designed and directed the project. KR designed and performed the experiments and analyzed the data. CT performed the lipidomics measurements. CT, AA and KR analyzed the lipidomics data. CKB and AS contributed to the metabolomics analysis. KR took the lead in writing the manuscript. All authors provided critical feedback and helped shape the research, analysis and manuscript.
Funding GA received support from COST (EU), the STOPbraintumor foundation and the Dutch Cancer Society KWF (#11266). MGN was supported by an ERC Advanced grant (#833247) and a Spinoza Grant of the Netherlands Organization for Scientific Research. RTN- M was supported by a grant from the Dutch Cancer Society KWF (#10559).
Competing interests None declared.
Patient consent for publication Not required.
Provenance and peer review Not commissioned; externally peer reviewed.
Data availability statement All data relevant to the study are included in the article or uploaded as supplementary information.
Open access This is an open access article distributed in accordance with the Creative Commons Attribution Non Commercial (CC BY- NC 4.0) license, which permits others to distribute, remix, adapt, build upon this work non- commercially, and license their derivative works on different terms, provided the original work is properly cited, appropriate credit is given, any changes made indicated, and the use is non- commercial. See http:// creativecommons. org/ licenses/ by- nc/ 4. 0/.
ORCID iDsKatrin Rabold http:// orcid. org/ 0000- 0002- 4175- 3370Gosse J Adema http:// orcid. org/ 0000- 0002- 6750- 1665
REFERENCES 1 Hanahan D, Weinberg RA. Hallmarks of cancer: the next generation.
Cell 2011;144:646–74. 2 Qian B- Z, Pollard JW. Macrophage diversity enhances tumor
progression and metastasis. Cell 2010;141:39–51. 3 DeNardo DG, Andreu P, Coussens LM. Interactions between
lymphocytes and myeloid cells regulate pro- versus anti- tumor immunity. Cancer Metastasis Rev 2010;29:309–16.
4 Grivennikov SI, Greten FR, Karin M. Immunity, inflammation, and cancer. Cell 2010;140:883–99.
5 Colotta F, Allavena P, Sica A, et al. Cancer- Related inflammation, the seventh hallmark of cancer: links to genetic instability. Carcinogenesis 2009;30:1073–81.
6 Mantovani A, Allavena P, Sica A, et al. Cancer- Related inflammation. Nature 2008;454:436–44.
7 Noy R, Pollard JW. Tumor- Associated macrophages: from mechanisms to therapy. Immunity 2014;41:49–61.
8 Colegio OR, Chu N- Q, Szabo AL, et al. Functional polarization of tumour- associated macrophages by tumour- derived lactic acid. Nature 2014;513:559–63.
9 Rabold K, Netea MG, Adema GJ, et al. Cellular metabolism of tumor- associated macrophages - functional impact and consequences. FEBS Lett 2017;591:3022–41.
10 Zhang Q- wen, Liu L, Gong C- yang, et al. Prognostic significance of tumor- associated macrophages in solid tumor: a meta- analysis of the literature. PLoS One 2012;7:e50946.
11 Asgharzadeh S, Salo JA, Ji L, et al. Clinical significance of tumor- associated inflammatory cells in metastatic neuroblastoma. J Clin Oncol 2012;30:3525–32.
12 Caillou B, Talbot M, Weyemi U, et al. Tumor- Associated macrophages (TAMs) form an interconnected cellular supportive network in anaplastic thyroid carcinoma. PLoS One 2011;6:e22567.
13 Nonomura N, Takayama H, Nakayama M, et al. Infiltration of tumour- associated macrophages in prostate biopsy specimens is predictive of disease progression after hormonal therapy for prostate cancer. BJU Int 2011;107:1918–22.
on Decem
ber 1, 2021 by guest. Protected by copyright.
http://jitc.bmj.com
/J Im
munother C
ancer: first published as 10.1136/jitc-2020-000638 on 17 Septem
ber 2020. Dow
nloaded from
13Rabold K, et al. J Immunother Cancer 2020;8:e000638. doi:10.1136/jitc-2020-000638
Open access
14 Ryder M, Ghossein RA, Ricarte- Filho JCM, et al. Increased density of tumor- associated macrophages is associated with decreased survival in advanced thyroid cancer. Endocr Relat Cancer 2008;15:1069–74.
15 Makowski L, Chaib M, Rathmell JC. Immunometabolism: from basic mechanisms to translation. Immunol Rev 2020;295:5–14.
16 Tannahill GM, Curtis AM, Adamik J, et al. Succinate is an inflammatory signal that induces IL-1β through HIF-1α. Nature 2013;496:238–42.
17 Vats D, Mukundan L, Odegaard JI, et al. Oxidative metabolism and PGC- 1beta attenuate macrophage- mediated inflammation. Cell Metab 2006;4:13–24.
18 Arts RJW, Plantinga TS, Tuit S, et al. Transcriptional and metabolic reprogramming induce an inflammatory phenotype in non- medullary thyroid carcinoma- induced macrophages. Oncoimmunology 2016;5:e1229725.
19 Feingold KR, Shigenaga JK, Kazemi MR, et al. Mechanisms of triglyceride accumulation in activated macrophages. J Leukoc Biol 2012;92:829–39.
20 Park J, Lee SE, Hur J, et al. M- Csf from cancer cells induces fatty acid synthase and PPARβ/δ activation in tumor myeloid cells, leading to tumor progression. Cell Rep 2015;10:1614–25.
21 Bekkering S, Blok BA, Joosten LAB, et al. In vitro experimental model of trained innate immunity in human primary monocytes. Clin Vaccine Immunol 2016;23:926–33.
22 Schweppe RE, Klopper JP, Korch C, et al. Deoxyribonucleic acid profiling analysis of 40 human thyroid cancer cell lines reveals cross- contamination resulting in cell line redundancy and misidentification. J Clin Endocrinol Metab 2008;93:4331–41.
23 Fuhrer T, Heer D, Begemann B, et al. High- Throughput, accurate mass metabolome profiling of cellular extracts by flow injection- time- of- flight mass spectrometry. Anal Chem 2011;83:7074–80.
24 R: a language and environment for statistical computing. Vienna, Austria: R core team, 2014. Available: https://www. r- project. org/
25 Ritchie ME, Phipson B, Wu D, et al. limma powers differential expression analyses for RNA- sequencing and microarray studies. Nucleic Acids Res 2015;43:e47.
26 Pontis S, Ribeiro A, Sasso O, et al. Macrophage- Derived lipid agonists of PPAR-α as intrinsic controllers of inflammation. Crit Rev Biochem Mol Biol 2016;51:7–14.
27 Zhu L, Zhao Q, Yang T, et al. Cellular metabolism and macrophage functional polarization. Int Rev Immunol 2015;34:82–100.
28 Ameziane El Hassani R, Buffet C, Leboulleux S, et al. Oxidative stress in thyroid carcinomas: biological and clinical significance. Endocr Relat Cancer 2019;26:R131–43.
29 Emanuele S, D'Anneo A, Calvaruso G, et al. The double- edged sword profile of redox signaling: oxidative events as molecular switches in the balance between cell physiology and cancer. Chem Res Toxicol 2018;31:201–10.
30 Zhu Y, Paul P, Lee S, et al. Antioxidant inhibition of steady- state reactive oxygen species and cell growth in neuroblastoma. Surgery 2015;158:827–36.
31 Al- Khami AA, Zheng L, Del Valle L, et al. Exogenous lipid uptake induces metabolic and functional reprogramming of tumor- associated myeloid- derived suppressor cells. Oncoimmunology 2017;6:e1344804.
32 Kumari S, Badana AK, G MM, et al. Reactive oxygen species: a key constituent in cancer survival. Biomark Insights 2018;13:1177271918755391.
33 Zhang A, Qian Y, Ye Z, et al. Cancer- Associated fibroblasts promote M2 polarization of macrophages in pancreatic ductal adenocarcinoma. Cancer Med 2017;6:463–70.
34 Zhang Y, Choksi S, Chen K, et al. Ros play a critical role in the differentiation of alternatively activated macrophages and the occurrence of tumor- associated macrophages. Cell Res 2013;23:898–914.
35 Biswas SK, Allavena P, Mantovani A. Tumor- Associated macrophages: functional diversity, clinical significance, and open questions. Semin Immunopathol 2013;35:585–600.
36 Williams CB, Yeh ES, Soloff AC. Tumor- Associated macrophages: unwitting accomplices in breast cancer malignancy. NPJ Breast Cancer 2016;2. doi:10.1038/npjbcancer.2015.25. [Epub ahead of print: 20 Jan 2016].
37 Mantovani A, Marchesi F, Malesci A, et al. Tumour- Associated macrophages as treatment targets in oncology. Nat Rev Clin Oncol 2017;14:399–416.
38 Xue J, Schmidt SV, Sander J, et al. Transcriptome- Based network analysis reveals a spectrum model of human macrophage activation. Immunity 2014;40:274–88.
39 Köberlin MS, Snijder B, Heinz LX, et al. A conserved circular network of coregulated lipids modulates innate immune responses. Cell 2015;162:170–83.
40 Carroll RG, Zasłona Z, Galván- Peña S, et al. An unexpected link between fatty acid synthase and cholesterol synthesis in proinflammatory macrophage activation. J Biol Chem 2018;293:5509–21.
41 Nishiyama- Naruke A, Curi R. Phosphatidylcholine participates in the interaction between macrophages and lymphocytes. Am J Physiol Cell Physiol 2000;278:C554–60.
42 de Bittencourt Júnior PI, Curi R. Transfer of cholesterol from macrophages to lymphocytes in culture. Biochem Mol Biol Int 1998;44:347–62.
43 Peres CM. Homem de Bittencourt Junior PI, Costa M, Curi R, Williams JF. Evidence for the transfer in culture of [14C]-labelled fatty acids from macrophages to lymphocytes. Biochem Mol Biol Int 1997;43:1137–44.
44 Peres CM, Homem de Bittencourt PI, Mendonça JR, et al. Evidence that macrophages transfer arachidonic acid and cholesterol to tissues in vivo. Cell Biochem Funct 2003;21:317–23.
45 Ecker J, Liebisch G, Englmaier M, et al. Induction of fatty acid synthesis is a key requirement for phagocytic differentiation of human monocytes. Proc Natl Acad Sci U S A 2010;107:7817–22.
46 de Bittencourt Júnior PI, Yano MM, Hirata MH, et al. Evidence that prostaglandins modulate lipogenesis in cultured lymphocytes--a comparison with its effect on macrophages and tumour cells. Biochem Mol Biol Int 1994;33:463–75.
47 O'Neill LAJ, Pearce EJ. Immunometabolism governs dendritic cell and macrophage function. J Exp Med 2016;213:15–23.
48 Mills EL, Kelly B, Logan A, et al. Succinate dehydrogenase supports metabolic repurposing of mitochondria to drive inflammatory macrophages. Cell 2016;167:457–70.
on Decem
ber 1, 2021 by guest. Protected by copyright.
http://jitc.bmj.com
/J Im
munother C
ancer: first published as 10.1136/jitc-2020-000638 on 17 Septem
ber 2020. Dow
nloaded from


![Lipid Biosynthesis in Eukaryotic Cells - pub.epsilon.slu.sepub.epsilon.slu.se/1173/1/Avhandling_nr_078[1].2006_Tryckfil.pdf · Lipid Biosynthesis in Eukaryotic Cells Studies on Enzyme](https://static.fdocuments.in/doc/165x107/5cbc44c388c9937f418c630e/lipid-biosynthesis-in-eukaryotic-cells-pub-12006tryckfilpdf-lipid-biosynthesis.jpg)