EngrD 2190 – Lecture 20 - Cornell University
16
Concept: Process Analysis - Graphical Modeling Context: Thermodynamic Maps for Binary Mixtures - The Lever Rule and Tie Lines Defining Questions: What is the descriptive term for the border between the ‘all vapor’ and ‘liquid+vapor’ regions on a map for binary mixtures? What is the descriptive term for the border between the ‘all liquid’ and ‘liquid+vapor’ regions on a map for binary mixtures? Bring a Straightedge or Ruler to Lecture 21. EngrD 2190 – Lecture 20
Transcript of EngrD 2190 – Lecture 20 - Cornell University
Concept: Process Analysis - Graphical Modeling
Context: Thermodynamic Maps for Binary Mixtures -The Lever Rule and Tie Lines
Defining Questions: What is the descriptive term for the border between the ‘all vapor’and ‘liquid+vapor’ regions on a map for binary mixtures?
What is the descriptive term for the border between the ‘all liquid’and ‘liquid+vapor’ regions on a map for binary mixtures?
Bring a Straightedge or Ruler to Lecture 21.
EngrD 2190 – Lecture 20

New Homework Team AssignmentsFor New Teams: Last person listed is Team Coordinator for Homework 6.
Homework 5 due today at noon.Write team number and names of all contributing team memberson all solutions. Indicate this week’s Team Coordinator.
Homework 6 due Friday 10/22.4.5 and 4.9 graphical energy balances (Lecture 19)4.13 and 4.19 graphical analysis of flash drums (Lecture 20)
Download blank graphs and phase data from EngrD 2190 homepage:Textbook Textbook Graphs and Figures
Graphs for Chapter 4 Exercises.
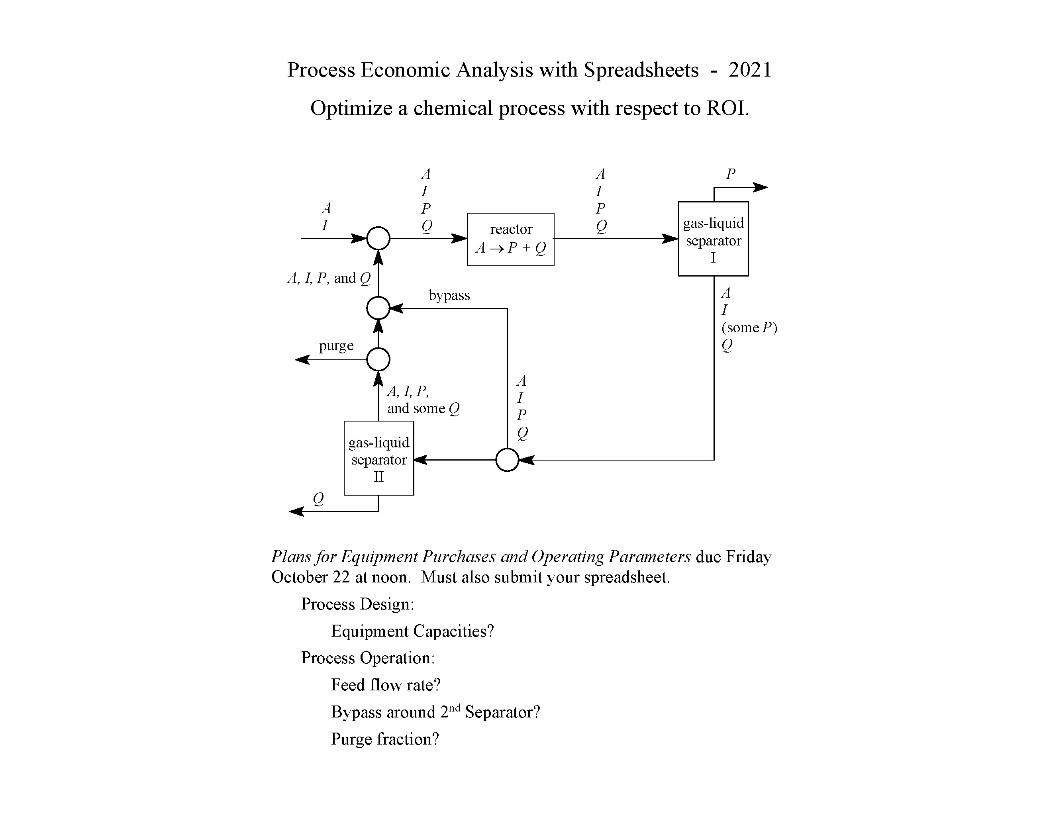
Process Economics Analysis with a Spreadsheet Optimize a chemical process with respect to ROI. Your Process Plan – equipment purchases and operating parameters –
is due Friday 10/22.You must also submit your spreadsheet.


One L+V Equilbrium Stage
liquid
vaporheaterT = ?
4
liquid
vapor
21
3
1.0 atm75°C
40. mol% benzene60. mol% toluene100. mol/min
A Flash Drum
56 mol% benzene
composition?
flow rate?
flow rate?

cylinder
floatingpiston
P = 1 atm
benzene T < 80°C 80°C 80°C 80°C T > 80°C
toluene T < 111°C 111°C 111°C 111°C T > 111°C
50% benzene50% toluene T < 92°C 92°C
L: 50% BV: 70% B 95.5°C
L: 38% BV: 62% B 98.5°C
L: 30% BV: 50% B T > 98.5°C
75% benzene25% toluene T < 85.5°C 85.5°C
L: 75% BV: 88% B 87.5°C
L: 66% BV: 84% B 91°C
L: 54% BV: 75% B T > 91°C
25% benzene75% toluene T < 100°C 100°C L: 25% B
V: 45% B103.5°C L: 17% B
V: 33% B105°C L: 11% B
V: 25% BT > 105°C

How to plot these Data? A Graph?
A Graph:
x
yy f(x)
Given x, the graph gives y.
Our data: given composition and temperature,what is the phase (liquid, vapor, or liquid+vapor)?
Two independent variables - composition and temperature.
We need a map.

Benzene+Toluene Mixtures at Equilibrium
70
80
90
100
110
120
0 0.1 0.2 0.3 0.4 0.5 0.6 0.7 0.8 0.9 1x benzene, y benzene
tem
pera
ture
(C)
P = 1 atm
mol fractionof benzene
in the liquid mol fractionof benzenein the vapor
pure benzenepure toluene
A Map
liquid vapor
a tie line:ties togethertwo phases
in equilibrium.

One L+V Equilbrium Stage
liquid
vaporheaterT = ?
4
liquid
vapor
21
3
1.0 atm75°C
40. mol% benzene60. mol% toluene100. mol/min
A Flash Drum
56 mol% benzene
composition?
flow rate?
flow rate?
70
80
90
100
110
120
0 0.1 0.2 0.3 0.4 0.5 0.6 0.7 0.8 0.9 1x benzene, y benzene
tem
pera
ture
(C)
P = 1 atm
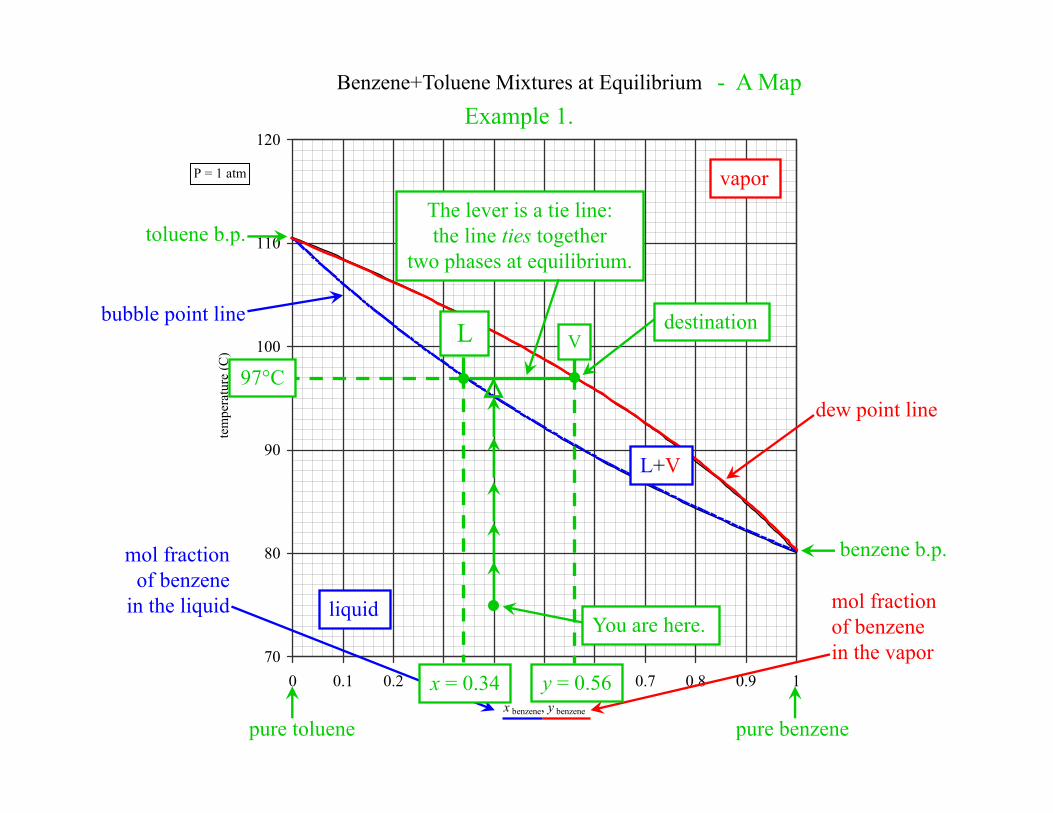
Benzene+Toluene Mixtures at Equilibrium - A Map
pure benzenepure toluene
benzene b.p.
toluene b.p.
vapor
dew point line
liquid
bubble point line
L+V
mol fractionof benzene
in the liquid mol fractionof benzenein the vapor
You are here.
destination
The lever is a tie line:the line ties together
two phases at equilibrium.
97°C
x = 0.34
L V
Example 1.
y = 0.56

Apply the Lever Rule to the Tie Line
0.400.34 0.56
L V
total lever: 0.56 0.34 0.22
lever arm to liquid: 0.40 0.34 0.06
liquid flow rate 100 0.06/0.22 27 mol/min. Okay?vapor

Vapor-Liquid Phase Map for Methanol + Water at 1 atm - Exercise 4.19
60
70
80
90
100
0 0.1 0.2 0.3 0.4 0.5 0.6 0.7 0.8 0.9 1x methanol, y methanol
tem
pera
ture
(°C
)

Vapor-Liquid Phase Map for Methanol + Water at 1 atm - Exercise 4.19
60
70
80
90
100
0 0.1 0.2 0.3 0.4 0.5 0.6 0.7 0.8 0.9 1x methanol, y methanol
tem
pera
ture
(°C
)
Do not ‘connect the dots.’
Sketch ‘best fit’lines or use
French curves.