
Engraved Line Depth Measuring Using a Laser Distance ... · Engraved Line Depth Measuring Using a...
16
Laser-Scan Engineering Ltd, 5 The Irwin Centre, Scotland Road, Dry Drayton, Cambridge, CB23 8AR, United Kingdom Telephone: +44 (0) 1954 213410 Fax: +44 (0) 1954 211437 www.laser-scan.com Engraved Line Depth Measuring Using a Laser Distance Measuring Tool and Laser-Scan’s Control/Analysis Software Page | 1 Engraved Line Depth Measuring Using a Laser Distance Measuring Tool and Laser-Scan’s Control/Analysis Software Author: Shaun Whitfield MSc, BSc (Hons), 21 January 2015 [email protected]
Transcript of Engraved Line Depth Measuring Using a Laser Distance ... · Engraved Line Depth Measuring Using a...
Laser-Scan Engineering Ltd, 5 Laser-Scan Engineering Ltd, 5 The Irwin Centre, Scotland Road, Dry Drayton, Cambridge, CB23 8AR, United Kingdom Telephone: +44 (0) 1954 213410 Fax: +44 (0) 1954 211437 www.laser-scan.com
Engraved Line Depth Measuring Using a Laser Distance Measuring Tool and Laser-Scan’s Control/Analysis Software
Page | 1
Engraved Line Depth Measuring Using a Laser Distance Measuring Tool and Laser-Scan’s
Control/Analysis Software
Author: Shaun Whitfield MSc, BSc (Hons), 21 January 2015 [email protected]

Engraved Line Depth Measuring Using a Laser Distance Measuring Tool and Laser-Scan’s Control/Analysis Software
Page | 2
Introduction This document sets out to explore some of the issues and constraints behind the design of a hardware and software solution for analysing the depth of engraved lines on a security document printing plate.
The Measuring Jig and Software are the 2 components in a system designed in-house by Laser-Scan Engineering Ltd (LSEL) to reliably, economically and with as little operator intervention as possible measure the depth of engraved lines. The design constraints for these solutions were: 1 Must be able to measure a trench depth with an accuracy of ±0.25µm 2 Be simple to operate in the users’ normal environment 3 The unit itself must be easy to calibrate 4 Must work from a normal P.C 5 Must be Price Competitive

Engraved Line Depth Measuring Using a Laser Distance Measuring Tool and Laser-Scan’s Control/Analysis Software
Page | 3
Contents
The Problem(s) 4 Laser-Scan Depth Measuring Jig 4 Laser-Scan Solution 4 The Actual Task of Measuring 5 Dissecting points of Interest of an Engraved Line 5 Explanation of the Analysis Process 8 Align the Trenches 10 Calibrating the Readings 12 Explanation of the Displayed Chart of the Final Analysis 12 Future Analysis Options 15 Analysing the Mounted Plate for Flatness 15
Measuring Line Width 16

Engraved Line Depth Measuring Using a Laser Distance Measuring Tool and Laser-Scan’s Control/Analysis Software
Page | 4
The Problem(s)
When Computer to Plate systems are used to make engraved plates it is important that the engraved lines that are produced are consistent in their depths to maintain repeatability of printed colours. Laser-Scan currently maintains many engraving machines and current experience with engraving lines onto a plate are that they can consistently engrave to a known depth and this depth can be demonstrated to be correct within strictly controlled tolerances. There is currently no known issue with the consistency or repeatability of the current engraving devices but the caveat here is that they must be maintained and calibrated and for quality control must be easy to check, in a timely manner with the minimum of operator training. The Solution What is needed is a measuring tool that can automatically measure a set of engraved lines representing the depths needed. The solution needs to be able to measure consistently with an accuracy of ±0.25µm and do this automatically with little operator intervention. Laser-Scan Depth Measuring Jig The measuring Jig developed by Laser-Scan is an in-house hardware/software solution using a commercial off the shelf (COT) laser measuring device with a quoted accuracy of 0.1µm. The measuring device is mounted on a platform with 2 motors giving an XY travel of approximately 10mm. This jig is controlled by software developed by Laser-Scan. The whole unit has been designed to measure the 11 trench test engraving with line depths ranging from 100µm to 5µm and at the time of writing this document the software is dedicated to this one task but it is envisioned that the software can be tailored to meet differing customer requirements.
Photo 1. Test Engraving of 11 Lines 100 µm to 5 µm

Engraved Line Depth Measuring Using a Laser Distance Measuring Tool and Laser-Scan’s Control/Analysis Software
Page | 5
The Actual Task of Measuring What the proposed solution has to do is to accurately detect an engraved line (hereafter referred to as a trench) and detect the top and bottom edges. The tops for the sake of this document are referred to as the Left and Right Shoulders and the bottoms the Left and Right Trenches. To acquaint the reader with the task at hand Screendump1 shows an example of a trench (40µm) from what is considered to be a good plate that has been properly cleaned using the 'Plate Bright'. The first item to note is that the trench shows a depth of 40.97µm and the author would like to point out that this scan was not measured using a fully calibrated system but for the purposes of this explanation will be considered accurate. This trench is the average of 10 trenches measured in approximately 20µm increments along the test engraving. No claims are made as to the accuracy of distance measured; this device will not measure the width of a trench and has not been designed to do so.
ScreenDump1 Scan showing a 40 trench measuring an average depth of 40.970µm
Dissecting Points of Interest of an Engraved Line In ScreenDump1 we see four measured points representing the detected edges of the trench. These points are found by calculating the slope between readings, a horizontal line will have a value of 0 and a vertical line will be ∞. Once the slope is calculated the task is to decide the best point along this line to mark the transition from horizontal to vertical and vertical to horizontal. This analyse turned out to be slightly harder than expected as each trench has different slope characteristics. The analysis functions have therefore been written to calculate these 'transition' points using pre-set slope values for each depth that is measured. The software is set up to analyse the 11 Trenches of the standard 100um to 5um test strip.

Engraved Line Depth Measuring Using a Laser Distance Measuring Tool and Laser-Scan’s Control/Analysis Software
Page | 6
The readings by the markers show that the left and right shoulders are -0.3 µm and -0.17 µm below zero and the left and right trenches were found at -36.55µm and -38.85µm. The left and right trench markers give the software the end points to calculate the average depth for the trench. The top 5% and the bottom 5% are discarded and the average of the values delineated by the blue line is used. This was found to give more consistent results removing the occasional ‘bad’ reading (due it is thought to the shape of the laser beam and in some cases contaminants in the trenches, this can be adjusted if further testing contradicts current findings). Looking at Screendump2 is becomes more apparent how shallow the slope is in comparison to the depth of the trench and the differences can be seen quite well when comparing the trenches in Screendump3 and Screendump4. Why the slope of the trenches becomes an issue can I think be seen most clearly when looking at the 5µm trench in screendump4. The differences in the engraved line (trench) characteristics means that the LSEL jig and software solution has been tailored to only analyse the 11 depths of the test patch. This is at the moment a limitation but work on the software has shown that with more development, the software could be made more 'intelligent'. Further analysis of the slope characteristics should make it possible to ‘guess’ the depth and use that guess to re-analyse the trench using slope characteristics programmed for the type of plate being analysed
Screendump2 Enlarged view of left side of our 40µm Trench

Engraved Line Depth Measuring Using a Laser Distance Measuring Tool and Laser-Scan’s Control/Analysis Software
Page | 7
Screendump3 Enlarged view of left side of the 100µm trench from the same run as the 40µm trench
Screendump4 Enlarged view of the 5µm trench from the same run as the 40µm trench

Engraved Line Depth Measuring Using a Laser Distance Measuring Tool and Laser-Scan’s Control/Analysis Software
Page | 8
Explanation of Analysis Process Screendump5 shows the initial scan as it is collected by the sensor. The data will now be cleaned and extraneous data removed in the 'Clean Scanned Data' phase. The first issue is that there is a discrepancy between the 'height' at the start of the scan and at the end. What we have at the start of the readings is a horizontal straight line sitting just below zero and a second horizontal straight line at the end of the readings sitting at about 14µm below zero. This 'slope' is due in part to manufacturing tolerances in the mount of the measuring device and the plate not being perfectly flat. This ‘issue’ was expected as the measuring jig is designed to just be positioned on the plate by eye without any ‘extra’ equipment such as clamps and it was decided that software would be used to 'straighten' the readings rather than relying on what would be very high mechanical tolerances in the manufacture of the 'jig' and laboratory type conditions for the whole measuring process.
Screendump5 Initial Captured Data for one Scan

Engraved Line Depth Measuring Using a Laser Distance Measuring Tool and Laser-Scan’s Control/Analysis Software
Page | 9
The process of 'flattening' involves determining which part of the collected data is relevant and for this the software 'looks' for the start of the first trench (left shoulder) and the finish of the last trench (right shoulder). For this, a scan has to be of reasonable quality and have 11 trenches and at the time of writing each successive trench must be shallower than the previous one. In screendump6 we see the same scan as in screendump5 but it has now been cleaned 'flattened' and extraneous data discarded. The start and end points have now been pegged to 0µm. Looking at Screendump6 it is apparent that the top of the scan exhibits shallow sinusoidal characteristics. This is due to the motor and is in the order of approximately 2µm peak to peak and will be taken out in the next phase after the 'shoulders' and 'trenches' are detected. Having identified each trench ‘left’ and ‘right’ shoulders any slope between these points is individually corrected and set to zero using the same techniques for flattening the complete scan.
Screendump6 Scan after initial software cleaning

Engraved Line Depth Measuring Using a Laser Distance Measuring Tool and Laser-Scan’s Control/Analysis Software
Page | 10
Align the Trenches To again ensure that mechanical tolerances of the motors and the jig are minimised in the scan data all of the scans now go through an alignment process to ensure that all of the trenches are aligned with each other prior to the 'average' of all readings being calculated. When displayed, the average readings of the scans is show in red. Small differences in the shapes of the tops (shoulders) mean that the tops of each trench can be found at slightly differing positions and also any mechanical positioning differences due to the motors, might shift the position of one scan with reference to another, not by large amounts it must be said (generally in the order of 1 to 5 counts). The aim here is to catch each small alignment issue and correct it before it can have an additive effect on the overall accuracy of measurements. The motors themselves have a 'Zero' position and after each scan the sensor head is driven back to this zero position prior to stepping along the engraving to carry out the next scan. The effect here is to keep the first shoulder reading very consistent, helped by the fact that the 100µm trench has the 'easiest' shoulder to detect. The alignment process is simple and does not change the shape or characteristics of the base of the trench. The first scan is taken as the reference and all further scans will be aligned to this one. The first left shoulder position of the 1st scan is compared to the same point on scan 2. Discrepancies where the point was found on the second scan earlier or later will be taken up in the space between trenches; extra points are added or subtracted. This process is repeated for all trenches and all scans of the 10 scan run. Looking at screendump7 and 8 the reader should be able to discern the left sides of the trenches in 8 are in better alignment than in 7. The analysis was run on 3 scans just to make viewing the chart easier. This has the overall effect of reducing the cumulative effects of mechanical errors. The left trench average depth has changed from -0.07873 to -0.07807 a difference of 0.66µm. For interest, a 3 scans and 10 scans analysis was run and some of the readings are shown in Table 1. What table 1 does show, is that when more scans are analysed averaging does what it always does and minimises the effects of 'rogue' readings. Average Depth for Trench
with Alignment On Average Depth for Trench with Alignment off
Difference
3 Scans 82.12µm 82.36µm 0.24µm
10 Scans 82.45µm 82.62µm 0.17µm
Table 1 Differences in average depths

Engraved Line Depth Measuring Using a Laser Distance Measuring Tool and Laser-Scan’s Control/Analysis Software
Page | 11
Screendump7 Enlarged view of 3 scans and the average without Trench Alignment
Screendump8 Enlarged view of 3 scans and average with Trench Alignment turned on

Engraved Line Depth Measuring Using a Laser Distance Measuring Tool and Laser-Scan’s Control/Analysis Software
Page | 12
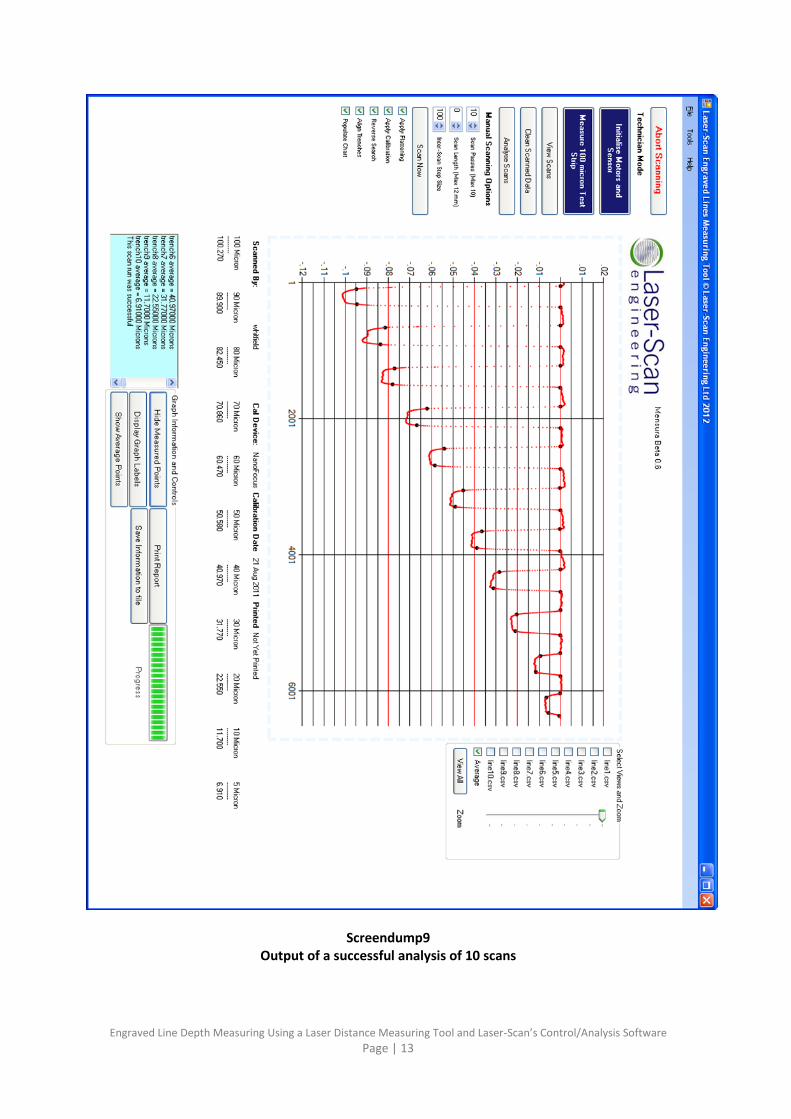
Calibrating the Readings The final part of the whole analysis is to apply a calibration value to each of the trenches based on measurements from a known good source. The figures from this are compared to the results from the Laser-Scan Jig with a null calibration file and the differences are applied using the calibration editor built into the software. Explanation of the Displayed Chart of the Final Analysis The output of this analysis is displayed as a chart and a table (Screendump9) showing the calculated depths for each trench. The chart shows the average of the 10 scans and the black markers show the final analysis of the shoulder and trench markers. One point of note is the position of the Left and right trench markers on the deepest trenches. At first look they appear to be misplaced to an alarming extent; further explanation will show what is happening. Screendump10 shows one of the trenches from screendump9. The second from the left was chosen mainly for what looks like a large step in the trench base. The enlarged view looks a lot better and this is entirely due to the scaling of the displayed chart. For this trench there will be about 40 readings between the left shoulder and the left trench markers (height) but the base of the trench has nearly 250 readings, causing a compression of the trench widths with respect to their depths.
Engraved Line Depth Measuring Using a Laser Distance Measuring Tool and Laser-Scan’s Control/Analysis Software
Page | 13
Screendump9 Output of a successful analysis of 10 scans

Engraved Line Depth Measuring Using a Laser Distance Measuring Tool and Laser-Scan’s Control/Analysis Software
Page | 14
Screendump10 Enlarged view of 90µm trench as shown on screendump9

Engraved Line Depth Measuring Using a Laser Distance Measuring Tool and Laser-Scan’s Control/Analysis Software
Page | 15
Future Analysis Options Analysing the Mounted Plate for Flatness Further investigation into the quality control process/issues is one of mounting the engraving plate ‘flat’ to the drum of the engraving machine. Presently this is tested for ‘flatness’ by the operators ‘tapping’ the plate to detect high spots. This is a mechanical process relying on testing only a limited amount of positions. High spots on the plate of course change the distance from the Laser Head to the plate surface affecting the depth of the engraving at that point. Laser-Scan have carried out limited tests using an in-house drum scanner in place of an engraving machine to investigate the feasibility of using the same measuring sensor employed on the ‘Jig’ and results show that we could automatically read the ‘whole drum surface’. By mounting the sensor onto the Laser Engraving head of the machine, the drum could be rotated slowly and the head moved across the surface as shown in Figure 1. There is more work to be carried out to investigate the slowest rotational speed for the drum and the speed of the head which would dictate the amount of points captured. With reference to Fig 1 the sensor would effectively scan a spiral and could, depending on the drum and head speeds, record the surface in the region of 1 cm intervals. The analysis of this scan would be relatively simple and Fig 2 shows a likely display of the analysed surface. The height here is depicted in 3 colours with green representing the plate surface that is within an as yet to be specified tolerance of ‘flatness’. Multiple colours would represent higher spots, in this case Yellow for perhaps an acceptable maximum then Red for out of tolerance. Of course more colours could be used to represent differing heights. The readings from the sensor could be saved into multiple formats if further, more detailed analysis were needed.
Figure 1. Scanning the Drum Surface.

Engraved Line Depth Measuring Using a Laser Distance Measuring Tool and Laser-Scan’s Control/Analysis Software
Page | 16
Figure 2. Theoretical Analysis of a Scan of the Plate Surface Measuring Line Width The Jig as it stands does not measure the width of an engraved line; this is due to the motors currently employed. The current motors do not have the required accuracy of absolute positioning. The motors were chosen for their small size and small incremental positioning of 0.05µm. Suitable motors are available at extra cost and are much larger requiring a different mechanical design for the Jig. Current development on measuring line width has shown great promise and would work automatically in the same manner as depth measurement. The work on identifying the ‘shoulders’ of each trench mean that most of the analytical work has been done. To measure line width, a slightly modified procedure would be needed to calculate the position of the motor when analysing the ‘shoulders’. Currently the laser sensor and motors work asynchronously. To measure width, the motor must be moved then a reading taken and the process repeated until a Shoulder is detected.