english, pdf (466 KB)
64
ISSN-0011-1643 CCA-2640 Review DDTs and PCBs in the Adriatic Sea Mladen Picer Center for Marine and Environmental Research, Ru|er Bo{kovi} Institute, Bijeni~ka 54, HR-10000 Zagreb, Croatia (E-mail: picer@rudjer.irb.hr) Received September 11, 1998; revised March 2, 1999; accepted April 12, 1999 A review and discussion of analytical developments in the determi- nation of DDTs and PCBs in sea environment are presented, in- cluding sample treatment, clean-up, identification and quantita- tive determination by gas-liquid chromatography. The fates of chlorinated hydrocarbons in the sea are discussed with regard to the pollutant-particle association with surfaces and their dynamics in a coastal marine environment. Hydrophobic associa- tion of pollutants with surfaces and then their biological incorpora- tion, aggregation and cycling are also discussed. The levels and trends of DDTs and PCBs in the Adriatic Sea air, rain, water, sediments, plankton, plants, shellfish, crabs, fishes, and other marine organisms, including seabirds and mammals, are re- viewed and compared with the levels of these pollutants in the Medi- terranean area. Comparison of data reported for DDTs and PCBs lev- els in different environmental compartments of the Mediterranean and the Adriatic Sea over the last two decades shows a substantial decline in these compounds. The author also presents discussion about the use of biomarkers for risk estimation of micropollutants in the Adriatic and the risk related to acceptable daily intake of chlo- rinated hydrocarbons by a critical population on the coast. Key words: Mediterranean Sea, Adriatic Sea, chlorinated hydrocar- bons, DDTs, PCBs, analysis, levels and trends, water, sediment, marine organisms, gas chromatography. INTRODUCTION The Adriatic Sea is an elongated basin (139 000 km 2 ) of the northern Mediterranean, extending for 800 km into the heartland of the European CROATICA CHEMICA ACTA CCACAA 73 (1) 123¿186 (2000)
Transcript of english, pdf (466 KB)
ISSN-0011-1643CCA-2640 Review
DDTs and PCBs in the Adriatic Sea
Mladen Picer
Center for Marine and Environmental Research, Ru|er Bo{kovi} Institute,Bijeni~ka 54, HR-10000 Zagreb, Croatia
(E-mail: [email protected])
Received September 11, 1998; revised March 2, 1999; accepted April 12, 1999
A review and discussion of analytical developments in the determi-nation of DDTs and PCBs in sea environment are presented, in-cluding sample treatment, clean-up, identification and quantita-tive determination by gas-liquid chromatography.The fates of chlorinated hydrocarbons in the sea are discussed withregard to the pollutant-particle association with surfaces and theirdynamics in a coastal marine environment. Hydrophobic associa-tion of pollutants with surfaces and then their biological incorpora-tion, aggregation and cycling are also discussed.The levels and trends of DDTs and PCBs in the Adriatic Sea air,rain, water, sediments, plankton, plants, shellfish, crabs, fishes, andother marine organisms, including seabirds and mammals, are re-viewed and compared with the levels of these pollutants in the Medi-terranean area. Comparison of data reported for DDTs and PCBs lev-els in different environmental compartments of the Mediterraneanand the Adriatic Sea over the last two decades shows a substantialdecline in these compounds. The author also presents discussionabout the use of biomarkers for risk estimation of micropollutants inthe Adriatic and the risk related to acceptable daily intake of chlo-rinated hydrocarbons by a critical population on the coast.
Key words: Mediterranean Sea, Adriatic Sea, chlorinated hydrocar-bons, DDTs, PCBs, analysis, levels and trends, water, sediment,marine organisms, gas chromatography.
INTRODUCTION
The Adriatic Sea is an elongated basin (139 000 km2) of the northernMediterranean, extending for 800 km into the heartland of the European
CROATICA CHEMICA ACTA CCACAA 73 (1) 123¿186 (2000)
continent. On its southern side the Adriatic Sea is connected to the Mediter-ranean Sea via the relatively narrow (70 km) Otranto strait, with a silldepth of about 800 m. Renewal of the Adriatic water has been estimated inthe range of 5 to 10 years,1,2 which is about ten times shorter than thewhole Mediterranean water renewal (70–100 years).3,4 Morphologically, theAdriatic Sea can be divided into three parts.5 The shallow northern part(max. depth 75 m) extends southwards in a line joining Ancona (Italy) withPag Island (Croatia). The central part, with the Jabuka Trench (max. depth270 m), is separated by the Palagru`a Sill (130 m) from the deepest south-ern part (max. depth 1270 m).
The shallow northern Adriatic receives considerable freshwater dis-charge (3000 m3 s–1) mainly from the Po River, one of the major rivers in theMediterranean area (about 50% of the total discharge).6 Many minor rivers,streams, and drainage canals flow into the sea from the northern and west-ern coasts, while underground karstic springs and a few karstic streams arescattered along the East Coast. A resident population of 15 million lives inthe Po River watershed, on seven million hectares of land, half of which isintensively cultivated. The industrial organic load (expressed in BOD5) inthis region accounts for 40 million inhabitant equivalents.7 In addition, sig-nificant quantities of wastewater are discharged directly into the sea fromthe coastal regions, which are densely populated and have well-developedindustrial and marine activities. Finally, tourist population increases sig-nificantly during the summer period, raising the basic organic load andvarious pollutants.
During the 1970s, there was increased emphasis on pollution researchin the Adriatic in response to increased anthropogenic loads due to the in-tensive development of agriculture, industry, marine traffic, port activitiesand tourism in the area. Residues of synthetic chlorinated pesticides and in-dustrial chlorinated hydrocarbons are widespread throughout the terres-trial and oceanic environments due to their resistance to degradation. Thetoxicological and other harmful effects of these compounds on ecosystemshave been well documented.8,9 Accumulation of chlorinated compound resi-dues, contributed via the atmosphere, may have occurred in the AdriaticSea, for which water renewal time is less than 10 years. Moreover, addi-tional quantities of these pollutants were added to the sea from various lo-cal sources (mainly sewage and industrial wastewater disposal, port activi-ties, agricultural drainage) located on the coast, including semi-enclosedembayments.10–13
The use and application of PCB technical mixtures have led to signifi-cant levels of the more common PCBs in almost every aspect of the environ-ment. Concern has increased over the years with regard to the ecotoxicologi-cal and human health implications of the environmental presence of
124 M. PICER
materials containing PCBs. The toxicities of PCBs differ for each congenerand range from highly toxic, which are potent inducers of enzymes (P-450)and glucuronyl transferases, to moderately toxic, which are more potent in-hibitors of dopamine and other neurotransmitters.14 PCBs have immuno-suppressive activity, are tumor promoters and interfere with calcium utili-zation (thus producing their well-known negative effect on eggshellformation in birds).15 Both the EPA and the International Agency for Re-search on Cancer (IARC) classify them as carcinogens. Because of their per-sistence, potential for bioaccumulation and biomagnification, monitoring ofPCBs is important for the conservation of the environment and biota.
Most measurements and data on chlorinated hydrocarbons in the Adri-atic were on the total DDTs (insecticide DDT and its analogues DDE andDDD) and PCBs, which belong to the group of the most persistent organicpollutants. Therefore, this review is focused on these pollutants.
GENERAL FACTS ON ORGANOHALOGEN COMPOUNDS ASCHEMICALS AND POLLUTANTS
Organohalogens are a group of organic compounds which are substi-tuted by halogens i.e. chlorine, bromine, fluorine or iodine. The list of or-ganohalogen compounds, which is believed to be of economical or pollutionalimportance, consists of more than one thousand substances. Approximately20% of these are pesticides while the rest are miscellaneous compoundsused, produced or by-produced by the industries. A large majority of envi-ronmental information available refers to chlorinated hydrocarbons and es-pecially to chlorinated pesticides.8,10
DDT is the abbreviation for dichlorodiphenyl trichloroethane but thecorrect chemical name for the p,p’-isomer is 2,2-bis(p-chlorophenyl)-1,1,1-trichloroethane. The technical product usually contains up to 30% of theo,p’-isomer and the material is used against a wide variety of agriculturaland forest pests and against insect pests including disease vectors such asmosquito and tsetse fly. In the environment DDT can be degraded by solarradiation or metabolized in organisms. Dehydrochlorination gives the me-tabolite DDE and dechlorination the metabolite DDD.
Polychlorinated biphenyls (PCBs) are a group of aromatic organochlo-rine industrial products similar in structure to chlorinated hydrocarbon in-secticides such as DDT. PCBs are produced commercially by chlorinatingbiphenyl with anhydrous chlorine. The mixture obtained is purified and,during this process, hydroxylated biphenyls and chlorinated dibenzofuranscan be formed. Commercially produced PCBs are mixtures of chlorinatedbiphenyl isomers and homologues. Impurities found in commercial PCBs
DDTs AND PCBs IN THE ADRIATIC SEA 125
can include polychlorinated naphthalenes (PCNs) and polychlorinated di-benzofurans (PCDFs).16
PCBs have the empirical formula C12H10Cln (n = 1–10). There are 209chlorobiphenyl congeners, which can be divided into nine isomeric groupsand decachlorobiphenyl. Although all 209 of the PCB congeners have beensynthetized, the reaction conditions in the commercial process tend to favorspecific substitution reactions leading to particular compositions of the chlo-rinated products. Today, some 20 congeners are thought to be absent fromall of the technical mixtures.17,18 The commercial products – Aroclor (USA),Chlorphen (Germany) and Kaneclor (Japan) – are complex mixtures con-taining 132 congeners, and each mixture consists of different, but overlap-ping, assemblages of PCBs. Because of their ubiquity, PCBs are common en-vironmental pollutants that are included in the priority pollutants listpublished by the US Enironmental Protection Agency (EPA) and by theEuropean Union.19
ANALYTICAL METHODS FOR DETERMINATION OF DDTs AND PCBsIN AQUATIC ENVIRONMENT
Analytical methods commonly used in analyses of chlorinated hydrocar-bons in aquatic environment are time consuming, labor-intensive and costlyin terms of expensive solvents and absorbents. This is because the investi-gated pollutants, which are mostly present at parts per billion (ppb) levelsin sediments and biota and parts per trillion (ppt) in water, have to be con-centrated and separated from the matrix (sample clean-up) so that they canbe identified and measured by gas chromatography.
The basic steps of chlorinated hydrocarbons residue analysis are:(i) sampling,(ii) extraction from the sample,(iii) clean up of residues from the sample,(iv) identification and quantitative determination.Many books and papers have been published on the methodology for the
analysis of various organic pollutants in aquatic environments. The most re-cently published reviews on the subject of the analysis of chlorinated hydro-carbons in water and food were published in the Journal of Chromatogra-phy.19,20
Sampling
Water sampling is difficult because there are usually low concentrationsof PCBs in waters due to the hydrophobic nature of these compounds. Con-
126 M. PICER

centrations in seawater in the low picogram per liter level have been re-ported for the most abundant PCB congeners. In seawater samples, the con-centration of chlorinated hydrocarbons is high in the surface layers. Theair-sea interface is a point of interest because sea slicks may significantlyaccumulate PCBs.21-23 There are specific microlayer samplers suitable forcollecting the upper water layer of 50–400 µm thickness. For this purpose,different samplers have been designed: the Blumer sampler, the DHI sam-pler and a high-volume water sampler prepared to pump water from a de-fined depth below the sea surface outside the wake of the survey vessel.24
Recovery measurements are one of the more difficult and ill-defined as-pects of trace organic analysis in environment samples. Experiments de-signed to obtain the efficiency of an analytical method often implicitly as-sume that this also includes the efficiency of extraction from the matrix.Differences in behavior between spiked chlorinated hydrocarbons and thosealready present in the water phase or other biotic or abiotic samples haveinduced some researchers to perform recovery measurements by comparingseveral extraction methods.25 In most of the methods the commodity isspiked with the chemical prior to extraction and the percentage recoveriesare tested. Such an approach may prove the validity of the clean-up methodbut it does not evaluate satisfactorily the effectiveness of the extraction pro-cedure. Attempts to distinguish the available and total pollutant levels haveinvolved the use of radiolabelled chemicals to determine the solvent extract-able material. For good results, each step requires studies on each sampletype, because procedures involving extraction, clean up, separation andquantification are different and specific for each substrate.25
Extraction
Water
The method used for extraction from water is partitioning into an or-ganic solvent to extract the pesticides. Besides the common methods, likeliquid-liquid partitioning, some procedures involve extraction of acidifiedwater with hexane. Solid-phase extraction and elution with an organic sol-vent and use of Sep pak cartridges packed with CN bonded porous silica aresome of the methods used.19,20,26
Sediments and Biological Samples
Organochlorine residues may be recovered from biological samples byexhaustive extraction with a variety of organic solvents, such as for example:hexane, ether, acetone, alcohol and their combinations. The methodologyvaries from simply standing (keeping) the commodity in a solvent overnight
DDTs AND PCBs IN THE ADRIATIC SEA 127

to a more exhaustive technique such as Soxhlet extraction. Sample materialwith a low-fat and wax content can be extracted directly, separated andanalyzed by gas chromatography. Extracts of many samples may containlarge amounts of fats and pigments, which will remain after the extract hasbeen evaporated. This will result in low sensitivity, poor response and mayeven damage the column packing.
In all the extractions, especially for the multi-residue type, use of highpurity reagents and solvents helped to minimize interference problems. Theimpurity levels of all solvents and reagents used did not exceed an accept-able blank when subjected to the complete procedure without the sample.27
Clean-up Extracts from Various Commodities
Clean up is an essential step for accurate determination of pesticideresidues, but many conventional methods are costly and time consuming.Clean-up techniques currently include liquid-liquid partitioning, open col-umn chromatography, thin-layer chromatography, steam distillation andlow temperature precipitation. Of the several new approaches successfullyused in modern methodology, use of small columns is the most notable.28,29
Commonly used methods for the clean-up of raw extracts of samples arechromatographic columns filled with an adsorbent such as florisil, alumina,silica gel, mixtures of alumina and silica gel, gel permeation on Bio-BeadsSX3.
Considering that several organochlorines are present together, a crudeseparation into groups may be effected using various types of column chro-matography. Treatment of extracts with sulfuric acid is another way ofclean-up. It is used especially for removing fats.
Determination by Gas-liquid Chromatography
Gas-liquid chromatography (GLC) is one of the most important analyti-cal techniques used in chlorinated hydrocarbon residue analysis. Two ad-vantages are its sensitive and specific detector system and its ability toseparate the mixture of analytes on the column. Until recently, GLC of pes-ticides was conducted using packed columns containing a variety of liquidphases and supports. An electron capture detector is equipped to determinelow amounts of residues from small samples of various substrates. As totalreliance should not be placed on the analytical data obtained from GLC forthe identification of a pesticide residue, it is necessary to compare it withother methods like GC-MS and GLC using alternate column packings.18,19
The capillary columns in gas chromatography have been applied to theanalysis of environmental samples for high resolution or separation of iso-
128 M. PICER

mers of many pollutants. These columns are wall coated with a thin film ofliquid phase which produces a large number of theoretical plates so thathigh resolution of analytes is possible. They provide an inert surface, pre-venting column decomposition or adsorption and low temperature program-ming to produce sharp fundamental peaks without excessive baseline de-sorption and retention times that are not too long.
The recent advance is the use of dual-column dual-detector gas chroma-tographic determination30 and two-dimensional capillary gas chromato-graphy with three detectors in parallel.31
Use of Internal Standards and Confirmation
Retention times are difficult to reproduce due to the inevitably slightchanges in experimental conditions; hence retention times are best expresedas values related to the retention time of a standard reference compound in-cluded in the same chromatogram. Aldrin and Mirex can be used as an in-ternal standard for organochlorines since they have intermediate retentiontimes and relative retention times. The internal standard is still used forminimizing error arising from other contaminants.32,33
Chemical derivatization serves as a method for the identification andconfirmation of pesticide residues. The recent trend is the use of GC-MS forthe multi-residue determination.33
Special Problem of the PCB Congener Determination
The PCB problem was recognized over 20 years ago, resulting in exten-sive reports and reviews on environmental contamination levels. However,only a small proportion of these studies discussed the distribution and oc-currence of individual PCBs as part of the analysis of environmental sam-ples.34–36 Although the approach to PCB determination has rapidly changedin recent years, it is still easy to understand the historical reasons for theinertia in measuring individual congeners. Total PCB levels are often re-quired for legislative monitoring programs and for the measurement of en-vironmental effects caused by the PCB formulations as such. Early analyti-cal techniques using packed column gas chromatography could onlymeasure »total PCB« content by summing up the few-seemingly, fully-resolved peaks, or by conversion of all PCBs into a single compound. Onlywith the development of high-resolution capillary gas chromatography withelectron capture detection and/or mass spectrometry has it become possibleto determine more accurately the presence of individual PCBs on a routinebasis.37–39
Although the determination of planar PCBs follows the same generalroute as for the other, more abundant PCBs, viz. extraction, clean-up and
DDTs AND PCBs IN THE ADRIATIC SEA 129

group separation prior to the final determination by GC with either ECD orMS with multiple ion detection, the presence of these compounds in the en-vironment at ultra-trace concentrations (1–10 pg g–1) requires significantrefining of the normal routine methods. Kannan et al.38 have determinedthe planar PCBs in several commercial Aroclor mixtures: they found260–6100 mg g–1 for PCB 77, 8.6–62 mg g–1 for PCB 126 and 0.05–0.51 mg g–1
for PCB 169. Seawater in the open ocean may contain as little as 0.03–1.0ng dm–3 of total PCBs, which would lead to as little as 0.001 pg dm–3 of pla-nar PCBs. This concentration is well below the detection limits and wouldrequire an initial sample size of 100 000 dm3 in order to approach these lim-its. The size of a sediment sample required for analysis is, of course, also de-pendent on the degree of contamination. Relatively clean open sea sedi-ments may have PCB levels in the range of 1–5 ng g–1. At this backgroundlevel of PCBs, it may be necessary to take a sample size of up to 10 kg forextraction in order to meet the detection limits for the planar PCBs. Thesample weight can be reduced substantially by using a micro reversed-phase LC column directly coupled to the capillary GC system through an in-terface consisting of an on-column injector and a retention gap. These sys-tems have been used successfully for the enrichment of PCBs and pesticidesfrom aqueous and sediment samples at the ppt level, since they allow one touse injection volumes of up to 1 ml. Sample pretreatment may be muchshorter when these systems are used, and the time of analysis can be re-duced to the time of the GC run.17
In several European countries, monitoring of selected congeners tookthe place of monitoring »total PCB« levels in environmental programs. InWest Germany and in the Netherlands, determination of individual conge-ners is statutorily regulated for the control of waste mineral oils. A set of sixor seven congeners is habitually used for monitoring.17,40
Intercalibration
Applicability of monitoring data depends on their quality measured interms of reliability, which depends on precision (reproducibility) and accu-racy (true values). The accuracy of the results is evaluated applying partici-pation in intercomparison runs with the samples of composition similar tothe environmental samples. To improve the reliability and accuracy of theobtained monitoring data, participating institutions have taken part instandardization and intercalibration exercises organized on national or in-ternational levels. Since 1973, the Monaco Laboratory of IAEA has organizedregular intercomparison exercises on a global and regional scale.41
In a report issued by IAEA MEL,42 the quality of the analytical data forthe MED POL programs over a 19-year period (1973–1993) was evaluated.
130 M. PICER

Of the institutions from which data on the DDTs and PCBs in the AdriaticSea have been published, six laboratories from Croatia, two from Sloveniaand four from Italy participated in the intercalibration exercises. In the pe-riod from 1976 to 1988, the laboratory of the Center for Marine Research,Zagreb, Ru|er Bo{kovi} Institute (CMR-Z) was the only Croatian laboratorythat regularly participated in the intercalibration exercises for trace organo-chlorine compounds during all nine intercomparison runs.
Based on the frequency of participation and the quality of the data re-ported, the IAEA has issued a list of selected laboratories around the Medi-
DDTs AND PCBs IN THE ADRIATIC SEA 131
Figure 1. Development of data quality for Aroclor 1254 content in samples of marinewater (XAD-2 extract) organisms and sediment in selected MED POL laboratories(modified from Mee et al.).42 SD represents standard deviation based on the resultsof the world-wide intercomparison exercise. Shaded area indicates data within thecontrol limits. Data of Center for Marine Research, Ru|er Bo{kovi} Institute, Za-greb, Croatia (CMR-Z).

terranean for trace organochlorine compound analysis.42 Of the 56 laboratoriesfrom 14 Mediterranean countries that participated in the intercalibrationruns to determine chlorinated hydrocarbons in marine samples, six were se-lected for their excellent analytical performance. Among them, only theCenter for Marine Research, Zagreb (CMR-Z) and the Institute of MarineBiology, Venice, Italy, published most data on chlorinated hydrocarbons inthe Adriatic Sea.
For the purpose of this overview, the data on Aroclor 1254 in the marinewater (XAD-2 extract), biota and sediment samples are presented in Figure 1(Fig. 18 from the publication by Mee et al., 1993).42 As seen from Figure 1,only data from three of the six »reference« laboratories have never exceededthe control limits.
SOURCES AND FATE OF DDTs AND PCBs IN THE MARINEENVIRONMENT
Sources
There are no sales or production statistics on chlorinated pesticides andPCBs for the Mediterranean countries. Within the framework of the MEDPOL X of the MED POL Phase I Program, consumption figures on the totalchlorinated pesticides and DDTs were collected for the 1973–1976 period, aspresented in Table I.43
Inputs into the Sea
Atmosphere
The discovery of DDTs and other chlorinated hydrocarbons in manyparts of the world oceans far from apparent direct input, shows that themechanisms of global dispersion of some of these pollutants had to be by amore rapid mode than it was possible by oceanic turbulence and currentsystems. The trans-Atlantic atmospheric transport of DDT by the NortheastTrade Wind System was first deduced from observations of Risebrough etal.44 Comparison of atmospheric and riverine input rates of organohalogencompounds to the World Ocean made by GESAMP45 shows that pollution ofthe marine environment by these substances through the atmosphere ismore important than that through river discharges.
In the Mediterranean Sea, atmospheric polychlorinated biphenyls weremonitored over a two-year period at a coastal sampling station in Monacoand from ships.46 Levels of PCBs in the near ocean atmosphere in Monacoare in a range from 0.03 to 0.96 ng m–3, in the western Mediterranean basin
132 M. PICER

DDTs AND PCBs IN THE ADRIATIC SEA 133
TA
BL
EI
Pes
tici
de
con
sum
pti
onby
agri
cult
ure
inth
eM
edit
erra
nea
nw
ater
shed
(mod
ifie
dfr
omU
NE
P/F
AO
/WH
O/I
AE
A,
1990
)43
Kin
dof
pes
tici
de
Con
sum
pti
on(a
ctiv
ein
gred
ien
t/
tp
erye
ar)
Est
imat
edar
eatr
eate
d10
3k
m2
Cyp
rus
(197
6)E
gyp
t(1
975/
76)
Gre
ece
(197
3)Is
rael
(197
4)It
alya
(197
5)L
eban
on(1
973)
Lib
ya(1
974)
Sp
ain
b
(197
6)S
yria
b
(197
6)T
un
isia
(197
3/74
)T
urk
ey(1
976)
TO
TA
L
Org
anoc
hlo
rin
eco
mp
oun
ds
14.9
743.
385
.513
2.3
2972
.435
.35.
832
3.2
65.8
39.0
1266
.856
84.3
216.
8
DD
Tan
dre
late
dco
mp
oun
ds
11.2
169.
3–
10.3
866.
4–
–12
.736
.7–
864.
119
70.7
29.1
aE
xcep
tP
iem
onte
,V
alle
d'A
osta
,L
omba
rdia
,T
ren
tin
o,A
lto
Ad
ige
and
Um
bria
nre
gion
s.
bM
edit
erra
nea
nw
ater
shed
only
.

from 0.05 to 0.30, in the Tyrrhenian Sea 0.1, in the Ligurian Sea 0.3, and inthe Adriatic Sea from 0.04 to 0.10 ng m–3.
Airborne particulate matter was continuously sampled from the atmos-phere of the residential town area of Ljubljana and trapped on a filter. ThePCB level in the particulate matter in the atmosphere was 1.3 ng m–3 andthe total DDT concentration was 0.86 ng m–3. Since gaseous forms of chlo-rinated hydrocarbons were not effectively trapped, true atmospheric levelscould have been considerably higher than those actually reported.47
The levels of PCBs and chlorinated pesticides were measured in somesamples of rainwater collected during 1979/80 in Rijeka, Croatia,48 and inthe south of France, Menton.49 Levels of pollutants are in line with those re-ported in the world literature for other areas.
Single PCB congeners, DDT and its metabolites were determined inrainwater from different areas of Northern Italy in recent years. Differenceswere observed both in terms of PCB profiles and of PCB and DDT levels.Pollution levels were not ascribable to long distance transport alone. Bothin the case of DDT compounds and in the case of PCB congeners, local inputinto the environment can be supposed.50
Other Discharges
Beside atmospheric deposition, halogenated hydrocarbons reach the ma-rine environment through agricultural run-off, rivers and discharge of in-dustrial and municipal wastes. Measurements of organochlorines in theparticulate and dissolved phases of the River Ebro water in northeasternSpain, sampled at the mouth in four periods between 1982–1983, are com-bined with data on daily flows to produce estimates of the inputs of thesecompounds into the northwestern Mediterranean from this source. Rela-tively high levels of p,p'-DDT among the DDT compounds indicated recentuse or mobilization of DDT. These estimates of river inputs of these con-taminants are substantially lower than those used or derived in several re-cent reviews of contamination problems in the Mediterranean; they supportthe conclusions of other studies that the principal dispersal pathway of theorganochlorines is the atmosphere. The UNEP review51 of pollutants fromland-based sources in the Mediterranean estimated that the load of persis-tent organochlorine compounds carried by surface run-off directly orthrough rivers into the Mediterranean Sea is about 90 t per year. Earlier es-timates by MEDPOL X in 1976–1977 of the total load of chlorinated bio-cides, excluding PCBs, entering the Mediterranean from land-based sourceswere in the order of 50–200 t per year. Relatively few measurements of or-ganochlorines in river waters, however, were used in developing these esti-mates. The Ebro accounts for about 6% of the fresh water entering theMediterranean from rivers; if the organochlorine levels reported for the
134 M. PICER

Ebro are typical of the majority of Mediterranean rivers, the total input oforganochlorines from rivers would be somewhat less than 2 t. The estimatederived by UNEP51,52 for the persistent organochlorines carried by surfacerun-off directly or through rivers52 was 90 t per year.
Figure 2 shows the amounts (in mg s–1) of chlorinated pesticides thatwere carried by the River Po43 in January, April and July 1973. Galassi etal. investigated polychlorinated biphenyls (PCBs) and chlorinated pesticides
DDTs AND PCBs IN THE ADRIATIC SEA 135
Figure 2. Downstream transport of chlorinated hydrocarbons in the River Po (modi-fied from UNEP/FAO/WHO/IAEA).43

in several organisms and in the sediment sampled in the final stretch of theRiver Po.54
The Tagliamento River drains a land surface of 2 580 km2, of which2 293 km2 extends on mountains, and flows into the northern Adriatic Sea.Cultured land (vineyards, orchards and arable land) represents only 29% ofthe watershed. The total load of chlorinated hydrocarbons delivered by theTagliamento River, estimated on the basis of their mean concentrations
136 M. PICER
TABLE II
Average, minimum and maximum concentrations of chlorinated hydrocarbons inwastewaters and sewage sludge
Location and year Compounds Concentration / �g dm–3
average min. max.
Refs.
Great Britain, sewage effluents DDT 36 NDa 130 58
Great Britain, sewage effluents DDT 131 (21)b ND 800 59
Canada, Southern Ontario, rawsewage (5 cities)
PCBs 2.0 (8) 0.6 4.4 60
Canada, Hamilton (raw sewage)
Canada, Hamilton (sewage sludge)c
PCBsDDT
PCBsDDT
10.8 (38) 1.536000
4010000
27.3130000
5000500000
61
Los Angeles County tertiarytreatment system, 1978, effluents
DDTs ND 62
Tokyo treatment plants (4 plants) PCBs ND 63
Ispra standard sewage sludge PCBs 2600 (4) 1150 4900 64
Aluminium smelt wastewater fromsedimentation basin
Decachloro-biphenyl
54 65
Cortiu, France (Urbansewage-outlet point, 1984)
PCBs 0.057 66
Adriatic, Rijeka town wastewaters,1986
PCBsDDTs
0.008 (12)0.069 (12)
NDND
0.0270.223
11
a ND, not detected (under sensitivity limit).
b Number of samples in brackets.
c Values presented as the mass fraction (w x 109) of compound(s) in sewage sludge.

and a mean flow of 62 m3 s–1, was: 3.3 kg a–1 for HCH, 1.8 kg a–1 for DDT,10.2 kg a–1 for PCBs.55,56,57
Although many baseline studies were conducted in the Adriatic andMediterranean ecosystems, only a few data on chlorinated hydrocarbon con-centrations in wastewater entering the Adriatic and even other Mediterra-nean areas were found in the available literature. Table II shows some dataon concentrations of chlorinated insecticides and PCBs in various wastewa-ters the world. As seen, the presented ranges of concentrations are ex-tremely high: from »non detected« (varying and depending on the analyticalmethodology) to the values reaching 130 000 �g dm–3 for DDTs and from NDto 4900 �g dm–3 for PCBs.
The presence of some chlorinated hydrocarbon pesticides at concentra-tions ranging from 0.19 (BHC) to 0.95 (p,p'-DDE) µg dm–3 in slaughterwastewater was observed in Alexandria.53 Samples of wastewaters werecollected between 1976 and 1987 at several stations located in the RijekaBay, Croatia. Concentrations of chlorinated insecticides and polychlorinatedbiphenyls in a range from < 0.2 to 657.2 ng dm–3 for DDTs and from < 0.3 to9115.5 ng dm–3 for PCBs were found.11
The Fate of Chlorinated Hydrocarbons in the Sea
Despite the difficulties associated with the analysis of organochlorinecompounds, especially at the low concentrations normally found in marinesamples, there is now little doubt that the chlorinated hydrocarbons such asDDT, dieldrin and PCBs, are major long-term contaminants of the total en-vironment and small traces can be found in almost all compartments of theworld ecosystem.67 An attempt to summarize the cycling of pesticidesthrough the environment is made in Figure 3, which illustrates the move-ments of residues through the various compartments of the environment.
Pollutant-particle Association with Surfaces and Dynamics in the CoastalMarine Environment
A wide variety of substances, including chlorinated hydrocarbons, be-come associated with »particles« in the coastal marine environment. Thisassociation may result from:
(i) precipitation or hydrophobic interactions with the particle surface,
(ii) co-precipitation with hydrous oxides or iron and manganese either ascoatings, or as flocs of the precipitate,
(iii) incorporation into mineral lattices, organisms or faecal material, or
(iv) flocculation of colloidal organic and inorganic matter during riverand sewage mixing.68
DDTs AND PCBs IN THE ADRIATIC SEA 137

138 M. PICER
Fig
ure
3.M
ovem
ent
ofp
esti
cid
esbe
twee
nen
viro
nm
enta
lco
mp
artm
ents
(mod
ifie
dfr
omE
dw
ard
s).67

Hydrophobic Association with Surfaces
The distribution coefficient for a specific pollutant may vary in de-pendance on the chemical form and concentration of that pollutant. Bopp69
showed that the lower-chlorinated biphenyls (di- and trichlorobiphenyls)have a lower distribution coefficient (< 104) relative to the higher-chlorinatedbiphenyls (penta- and hexachlorobiphenyls), which have a Kd value of theorder of 10–5.
The equilibrated distribution of DDTs between its liquid and solidphases in the Adriatic seawater medium was investigated by means of theradiotracer seawater technique.70,71 These various investigations examinedthe influence of DDT concentration on its adsorption on several model solidphases and the marine sediments. Desorption experiments indicated thatthe adsorption process is reversible. Desorption was higher from quartzthan from limestone, and was significantly lower from marine sediments.Examination of the equilibrium distribution of DDT between sea water andthe examined surfaces suggested that DDT existed as a colloidal dispersionin the investigated systems. Investigations of the fate of DDT and its me-tabolited DDE and DDD as well as dieldrin and Aroclor 1254 (PCB) inlaboratory-grown phytoplankton cultures have been described by Picer etal.,72 and tend to confirm this suggestion.
In order to evaluate the effects of municipal waste-waters on communi-ties, one of two experimental basins in the lagoon of Strunjan (North Adri-atic, Piran) was treated with 300 dm3 of primary settled sewage daily, whilethe other was kept clean as control.73 The resulting accumulation of organo-chlorine compounds in sediments of the polluted basin were found to behigher than in the clean one. The sum of the DDT and DDT derivatives wasapproximately three times higher in the polluted basin than the values ob-tained in the clean basin. The same applied to PCBs. Similar trends werealso found in mussels and holothuria, but this was not the case of crabs,which are both predators and scavengers.
Biological Incorporation, Aggregation and Cycling
Biological incorporation, aggregation and incorporation into biogenicparticles, coupled with subsequent organism migration, food chain transfer,or faecal pellet deposition, provides a rapid and ecologically importanttransport system in the marine environment. Pollutant associations withorganisms are a result of direct uptake from ingestion of sediment particles,organic-pollutant complexes or contaminated food or passive sorption as wa-ter passes over gills, mucous layers, tests, or other exposed surfaces.74 Therate of vertical mixing in the ocean is too slow to account for the quantities
DDTs AND PCBs IN THE ADRIATIC SEA 139

of polychlorinated biphenyls found in Mediterranean abyssal sediments ifone assumes that they penetrate into the deep ocean only in the dissolvedstate.73 An alternative explanation is that PCBs are carried to the sedi-ments by rapidly sinking particles.
Setting particles collected in semi-permanent particle interceptor devices(PITS) at a 100 m depth in a water column of 250 m, 2 km off the Monacocoast in the north western Mediterranean, were analyzed for petroleum andchlorinated hydrocarbons.75 PCB fluxes calculated from sediment and set-tling particles averaged 2 to 4 ng cm–2 a–1 with good agreement between dif-ferent data sets. Burns et al.75 estimated residence times based on theirmeasurements of PIT material at 100 m and on fluxes calculated from sedi-ment data. The authors believe that their estimates for PCB fluxes based onsettling particles are fairly accurate since they are supported by agreementwith fluxes into sediments. Thus, the residence time of PCBs in the upperwater column should lie in the range of 2 to 4 years.
The residence times of DDTs and PCBs in the Rijeka Bay, Croatia, werecalculated using six mathematical relationships.76 As seen from Table III,the residence times for DDTs range from 1.3 years (calculated using the as-sumptions of Tanabe and Tatsukawa) to 11.5 years (calculated from thesediment data provided in the Burns and Villeneuve relationship and con-centrations integrated over 60 m of the water column). For PCBs, residencetimes range from 1.2 to 9.3 year.
Six species of marine organisms, collected seasonally from the Italiancoast of the northern Adriatic Sea over a four-year period (1976–1979), wereanalyzed for their chlorinated hydrocarbon content.79,80 Results indicatethat there is an almost uniform distribution of these compounds along theItalian coast of the Adriatic, with the notable exception of the interior of la-goons and areas near the mouths of the Adigo and Po rivers. Levels aresimilar to or lower than those in related species from other industrial andurban areas of the Mediterranean and other parts of the world, though theNorthern Adriatic is often considered a heavily stressed basin. On the basisof the data presented, it seems that the amounts of organochlorine com-pounds accumulated by the analyzed species were related to their lipid(EOM) content and their trophic level. The arrangement of species accord-ing to the tissue level of chlorinated hydrocarbons (Nephrops < Carcinus >Mytilus < Mullus = Engraulis < Thunnus) only in part reflects their lipidcontent. The ability of mussels to accumulate some lipophilic pollutants, pe-troleum hydrocarbons and chlorinated hydrocarbons, is highly influenced bytheir lipid content but the relationship is very complex owing to the differ-ent mechanism of accumulation and ultilization of lipid reserve in differentseasons. Levels of investigated pollutants for anchovies were comparable to
140 M. PICER

DDTs AND PCBs IN THE ADRIATIC SEA 141
TABLE III
Estimated residence times, RT, of chlorinated hydrocarbon residuesin the top 60 m of the Rijeka Bay water column and the complete Bay
(modified from Picer, N., 1990)76
Calculation method Range of residence times, RT / years
DDTs PCBs
a) 1.3 to 3.7 1.2 to 2.7
b) 6.7 to 11.5 6.7 to 9.3
c1) 1.1 to 1.7 2.2 to 2.3
c2) 1.0 to 2.1 1.2 to 2.1
d1) 3.8 to 5.1 4.4. to 6.4
d2) 3.6 to 4.8 2.3 to 6.0
a) Calculated using the assumptions of Tanabe and Tatsukawa,77
RT =m
c v60
2 32. � �ss Cprod
where m60 is the mass of chlorinated hydrocarbons present in the water column 1 m2 by 60 mdepth, css is the average concentration of chlorinated hydrocarbons on suspended matter inthe surface waters and vCprod is the rate of primary production of carbon at the surface.
b) Calculated from sediment data given in Burns and Villeneuve78 and concentrations integratedover 60 m of the water column:
RT =m60
FC
where FC is the flux of pollutants into sediment per m2 and year.
c) Calculated on the basis of relationship:
RT =mC
C
(Aquat.)F (Bay)
where mC(Aquat.) is the mass of pollutants in Aquatorium and FC(Bay) is the flux of pol-lutants in the total Rijeka Bay. The mass of pollutants in Aquatorium could be calculated intwo ways: c1) from the pollutant mass fraction of fish in the Bay and c2) from that of sestone.
d) Calculated on the basis of relationship:
RT =mC
C
(Aquat.)I (Bay)
where mC(Aquat.) is the mass of pollutants in Aquatorium and IC(Bay) is the inflow of pol-lutants into the Rijeka Bay. The mass of pollutants in Aquatorium could be also calculated intwo ways: d1) from the pollutant mass fraction of fish in the Bay and d2) from that of sestone.

those found in mullet, though the lipid contents of the two species were verydifferent. Tuna, the biggest predatory fish of the Adriatic, contained thehighest concentrations of DDT and PCB while having a lipid contentcomparable to or lower than mullet. Evidently, the food, the habitat and thephysiology of various organisms strongly influence their accumulationcapacity.79,80
In the natural environment, highly similar PCBs congener patterns areusually found within each compartment. Between the compartments, how-ever, the patterns often differ significantly, depending on the physico-chemical properties of the individual PCBs, the biokinetic routes (uptake,elimination and metabolism) and the degradation and decomposition kine-tics. Two major structural factors determine the environmental fate of PCBs,viz. the degree of chlorination and the position of the chlorine substitutes.These factors, together with species characteristics, particularly the differ-ences in basal levels of certain isozymes of cytochrome P-450, from speciesto species also govern the biotransformation of PCBs. Major components oftechnical PCB mixtures e.g., PCBs 28, 110, 118, 138, 153 and 180, will al-most always be found as major constituents of the total PCB content in abi-otic samples. In biota, however, due to the metabolic breakdown, signifi-cantly different, but specific congener patterns can be observed for eachspecies. Planar PCBs are highly accumulative in lower organisms. As to theselective accumulation of the planar PCBs and the mono-ortho congeners inhigher animals, contradictory results have been reported.17 In contrast tothe relatively rapid uptake and release of many other PCB isomers bygreen-lipped mussels (Perna viridis Linnaeus), the non-ortho chlorine sub-stituted coplanar PCB congeners exhibited slow uptake and clearance.81
Examination of chemical transfer from sediments to aquatic organismsindicated large differences in the behavior between PCBs and PCDD/Fs. Bi-ota/sediment accumulation factors for trout averaged 102 among 61 CB iso-mers, while factors for two 2,3,7,8-substituted PCDD/Fs were below 3 andmost were well below 1. Non-2,3,7,8-substituted congeners are also majorcontributors to Sigma PCDD/F levels in the sediment and biota.82
Spatial variability shows an enrichment of organochlorine compounds(OCs) in a thermohaline front located midway between the Iberian Penin-sula and the Balearic Islands. Vertical profiles of OCs in the suspendedmatter (SPM) show, for the first time, a surface enrichment pattern exhibit-ing concentration maximum in phyto- and zooplankton zones and decliningOC concentrations with depth, except for the nearby sewage disposal sitesoffshore from Barcelona. Residence times of the SPM were estimated atevery depositional area ranging from 1.46 to 8.05 years for PCBs and from0.46 to 1.32 years for DDTs. The PCB budget in the seawater of the westernMediterranean was computed. The DDT budget was estimated to be ca. 179
142 M. PICER

and 717 kg in the particulate and dissolved phases, respectively. Finally, theinput of PCBs through the Gibraltar and the output through Sicilian Straitsamounted for 1.5 and 1.3 t per year, respectively. Concurrently, the corre-sponding input and output for PCBs were 92 and 82 kg per year through Gi-braltar and Sicilian Straits, respectively.102
LEVELS AND TRENDS
Statistical investigation of chlorinated hydrocarbon levels in many bioticand abiotic samples from the Adriatic Sea shows that standardized coeffi-cients of the kurtosis and skewness are much higher than 2, which meansthat these data may depart significantly from a normal distribution. Conse-quently, medians and geometric means should be more appropriate meas-ures of the central tendency of the investigated pollutant data than arith-metic means (averages). However, averages were used in this paper whenAdriatic data were compared with data from other marine regions, because,unfortunately, they were the most common statistical parameter reported inthe literature.83 Due to non-normal distributions of the elaborated data, itwas necessary to use logarithmic values. These values approximated well anormal distribution, which is a prerequisite for the use of parametric statis-tics.84 Thus, the annual means of the natural logarithmic values and theirstandard errors were compared to study levels and changes of the chlorinatedhydrocarbon concentrations or mass fractions within or among the variousinvestigated areas when single data were available.
Water
The concentrations of DDT total and PCBs found by various authors indifferent seawater samples (film, particulate matter, dissolved phase, andnon defined »seawater« samples) collected from various sites in the Mediter-ranean Sea are summarized in Table IV. Map of the Mediterranean area ispresented in Figure 4.
Risebrough et al.100 reported significantly lower concentrations of PCBsin French coastal waters than Elder.85 They concluded, on the basis of massbalance calculations that PCBs values in seawater in excess of 1 ng dm–3 inboth the Atlantic and the Pacific appear to be too high since pentachloro-biphenyls, the dominant PCB present in seawater extracts, had not beenproduced in sufficient amounts to account for the estimated burden in sea-water.
Persistant chlorinated hydrocarbons were analyzed over a two-year pe-riod (1977–78) in about 50 water samples collected from the Rijeka Baycoastal waters.11,93 Most of the results lie below the analytical sensitivity of
DDTs AND PCBs IN THE ADRIATIC SEA 143

144 M. PICER
TABLE IV
Concentrations of chlorinated hydrocarbons in surface film (S.F.), seawater (S.W.),seawater-dissolved phase (S.W.D.P.), and particulate matter (P.M.) from the
Mediterranean Sea
Areaa Matrix Pollutant Concentration / ng dm–3
average min. max.
Refs.
II S.F. PCBs 21.6 –3.2 58.3 75, 78
II S.W. PCBs 8.5 NDb 38 74, 75, 78,85–88
II S.W.D.P. PCBs 0.3 – – 75
II P.M. PCBs 0.7 – – 75
III S.W. PCBs 21.1 0.2 19 74, 89
IV S.W. DDTsPCBs
12.42.3
9.00.2
15.711.6
74, 89, 90
IV S.W. PCBs 210 50 548 91
VI S.W. PCBs 1.8 1.7 1.9 89
VII S.W. PCBs 0.9 0.2 1.7 74, 89
VIII S.W. DDTsPCBs
0.91.5
0.40.2
1.52.8
74, 92
X S.W. PCBs 0.4 0.1 0.8 89
Adriatic S.F. DDTsPCBs
1.951
ND0.9
25.5597
11, 93
Adriatic S.W. DDTsPCBs
5.14.1
NDND
9517
11, 93, 94,95–99
Adriatic P.M. DDTsPCBs
0.63.3
ND0.7
2.49.1
94–98
Adriatic S.W.D.P. DDTsPCBs
0.52.0
––
––
94–98
a See Figure 4.
b ND, non detected (under detection limit); –, no available data.

the method used (for DDTs 0.05 ng dm–3 and for PCBs 0.1 ng dm–3 ). Only afew samples show traces of chlorinated hydrocarbons. The concentrations ofPCBs for all the investigated areas in the Mediterranean Sea and theRijeka Bay are in a similar range except in the Ligurian Sea. Althoughthere are fewer data for DDTs, the levels are also comparable, except for theLigurian Sea where the DDTs concentration is significantly higher than inthe Rijeka Bay samples.
Slicks are often seen on coastal and open seawater and have been re-ported to concentrate organic and inorganic pollutants, and marine leptopel.Larsson et al. have estimated the amount of lipids in surface samples tovary between 0.3 and 20 mg m–2.101 Concentration factors are calculated onthe basis of water and lipid weight. For coastal waters, it has been assumedthat the amount of lipids is 20 mg m–2 and 5 mg m–2 for open waters. Thereare no significant differences in concentration factors for the chlorinated hy-drocarbons in the open water samples. However, in more polluted coastalwater samples, PCBs are more concentrated in the surface film than areDDTs and dieldrin. It could be concluded that although PCBs and DDTs aresorbed preferentially to suspended matter and are more concentrated insurface films than in lower water masses in the water environment, thereare some differences between them. It seems that PCB distribution incoastal zones is slightly higher due to sedimentation and evaporation fromthe surface film than that of DDTs in the Rijeka Bay Aquatorium, as it waspreviously described for the western Mediterranean.66
DDTs AND PCBs IN THE ADRIATIC SEA 145
Figure 4. Map of the Mediterranean area (modified from UNEP/FAO/WHO/IAEA).43
Individual PCB congeners (IUPAC Nos. 28, 52, 44, 70, 101, 118, 153,138, 187, 128, 180, and 170), hexachlorocyclohexanes (HCHs) and dichloro-diphenylethanes (DDTs) were determined in 15 samples of suspended par-ticulate matter (SPIM) > 0.7 �m collected in the Catalan Sea and the Gulf ofLions.102 Furthermore, 6 vertical profiles were sampled at the Ebro andRhone River mouths, Sicilian and Gibraltar Straits, offshore Barcelona andin the open sea. Finally, 6 dissolved phase samples from the Catalan Seawere taken and analyzed. The highest PCB and DDT concentrations weredetected offshore Valencia (26 and 2.8 pg dm–3, respectively). Other sourcesof pollution were identified at the Ebro transect. Individual chlorobiphenyl(CBs) and p,p'-DDE were determined in solution and suspension in surfacetransects of the open Mediterranean Sea in 1987.103 Large volumes of seawater (1400–1700 dm3) were analyzed. Concentrations of CBs were low insolution.
Sediments
Bottom sediments are often the best available medium for long termmonitoring of many contaminants in aquatic recipients. Sediment monitor-ing is carried out by measuring the level of the contaminant in surface sedi-ment samples, often in the upper 0.5–1 cm. This is done at time interval inorder to assess the present level of pollution and to detect changes in theflux of that contaminant.104
Comparison of the mass fraction of chlorinated hydrocarbons in sedimentsamples obtained from various areas of the Mediterranean Sea and of themass fraction of these pollutants in sediments collected from the Adriatic ispresented in Table V. Comparing the averages of DDT mass fractions in sedi-ments of the whole Adriatic with the averages of levels in the other Mediter-ranean areas, it can be seen that in six areas of the Mediterranean Sea (II,III, VI, VIII, IX and X) these levels are higher. For PCBs, the mass fractionsare higher in five areas of the Mediterranean Sea (I, II, IV, VI and VIII) incomparison with the sediment samples collected from the Adriatic Sea.
Figure 5 and Figure 6 present the levels and the trends of DDTs andPCBs as a natural logarithm of the means and their standard error of massfraction in sediment samples (dry weight basis) collected from different in-vestigated areas of the eastern Adriatic coastal waters in the period1976–1990. Sediment samples collected between 1983 and 1990 from the Is-trian coastal area, Zadar, Dubrovnik and Montenegrin coastal areas41 wereinvestigated within the Yugoslav Monitoring Programme, Phase 2. Espe-cially interesting are the extremely high levels of PCBs and DDTs and theirdramatic decrease in the Dubrovnik area. This is obviously a result of ana-lytical difficulties at the beginning of monitoring the chlorinated hydrocar-
146 M. PICER

bons in samples from the Dubrovnik area. Statistically significant differ-ences were obtained by the one-way analysis of variance of total DDT andPCB mass fractions, depending upon the collection period for chlorinatedhydrocarbon mass fraction in sediment samples collected from the Adriaticsea eastern coastal waters during the 1976–1990 period and analyzed byCMR Zagreb.118
DDTs AND PCBs IN THE ADRIATIC SEA 147
TABLE V
Mass fractions (w) of chlorinated hydrocarbons in sediments (dry weight) fromthe Mediterranean Sea
Areaa Pollutant wdw � 109
average min. max.
References
I DDTsPCBs
2.734.6
0.40.3
11.0323
74, 105
II DDTsPCBs
8.285.5
0.40.2
20015850
75, 78, 86–88, 105–111
III DDTsPCBs
11.07.4
1.20.1
40.014.0
74, 105
IV DDTsPCB
4.3102
0.20.6
27.03200
74, 91, 105, 112, 113
VI DDTsPCBs
10.338.1
0.10.8
35.5347
89, 105, 112
VII DDTsPCBs
0.20.8
0.10.1
0.41.1
105
VIII DDTsPCBs
128155
0.30.6
1893775
89, 105, 114
IX DDTsPCBs
12.01.5
0.4NDb
29.03.0
89, 105, 115, 116
X DDTsPCBs
3902.2
1.00.6
7805.1
89, 105
The AdriaticSea
DDTsPCBs
6.824.1
NDND
47.8332
11, 75, 93, 95, 98,105,117–120
The AdriaticSea, 1997 c
DDTsPCBs
3.7181
0.26.0
35.02203
121
a See Figure 4.
b ND, not detected (under sensitivity limit).
c Samples collected during 1997 from the coastal waters of the city of Zadar, Krka estuary nearBilice, Vransko Lake near Biograd, and the Dubrova~ka River near Komolac.

Although mass fraction data of DDTs and PCBs in sediment samplescollected from the open waters of Northern Adriatic have statistically sig-nificant differences, levels neither for DDTs nor for PCBs show any statisti-cally significant yearly trend (Figure 7). Comparison of the natural loga-rithm of the means and their standard error of chlorinated hydrocarbonmass fraction, organic matter and silt content in sediments from the North
148 M. PICER
Figure 5. The levels and the trends of DDTs as a natural logarithm of the means andtheir standard error of mass fraction in sediment samples (dry weight basis) col-lected from different investigated areas of the eastern Adriatic coastal waters in theperiod 1976–1990 (modified from UNEP).41

and Middle Adriatic collected in three areas (west, middle and east) showsthat, for both groups of chlorinated hydrocarbon pollutants, the highestlevels of pollutants were found in the western part of the Northern Adri-atic.41
DDTs AND PCBs IN THE ADRIATIC SEA 149
Figure 6. The levels and the trends of PCBs as a natural logarithm of the means andtheir standard error of mass fraction in sediment samples (dry weight basis) col-lected from different investigated areas of the eastern Adriatic coastal waters in theperiod 1976–1990 (modified from UNEP).41

The investigation of organic pollutants in the marine environment of theMontenegro Coast of South Adriatic (1989) shows that chlorinated hydro-carbons in sediments were generally very low and not always present.122
Time trend of PCB levels in surface sediments from a hypertrophic,macroalgae populated area of the lagoon of Venice was investigated by Pa-voni et al.123 The lagoon of Venice is a shallow transitional environment of549 km2 with an average depth of 1 m. Water exchange ((1.6–5.2) � 108 m3 d–1)occurs with the Adriatic Sea through three entrance channels. (Figure 8).The levels of polychlorinated biphenyls have been determinated over a pe-riod of 1 year in surface sediments sampled monthly and semi-monthly inthe lagoon of Venice. In the lagoon of Venice, PCB contamination has spreadmainly from the surroudings of the industrial district of Porto Marghera. APCB source related to the inflow of fresh waters to the lagoon was also identi-fied by Raccanelli et al.124 The levels of PCBs in the surface sediments sam-pled before the growth period of algae in 1985 (13 ppb, dry wt., 10 March)
150 M. PICER
Figure 7. Natural logarithm of the means and their standard error of chlorinated hy-drocarbon mass fraction, organic matter and silt (4–63 �m) content in sediment fromthe northern and central Adriatic for three areas: west, w; middle, m; and east, e(modified from UNEP).41

DDTs AND PCBs IN THE ADRIATIC SEA 151
Figure 8. The sampling sites in the Venice Lagoon and North Adriatic Sea. Site 1,reference Platform Site; site 2, Lio Grande; site 3, Crevan; site 4, Torcello; site 5,Salute; site 6, Porto Marghera (modified from Pavoni et al.).123
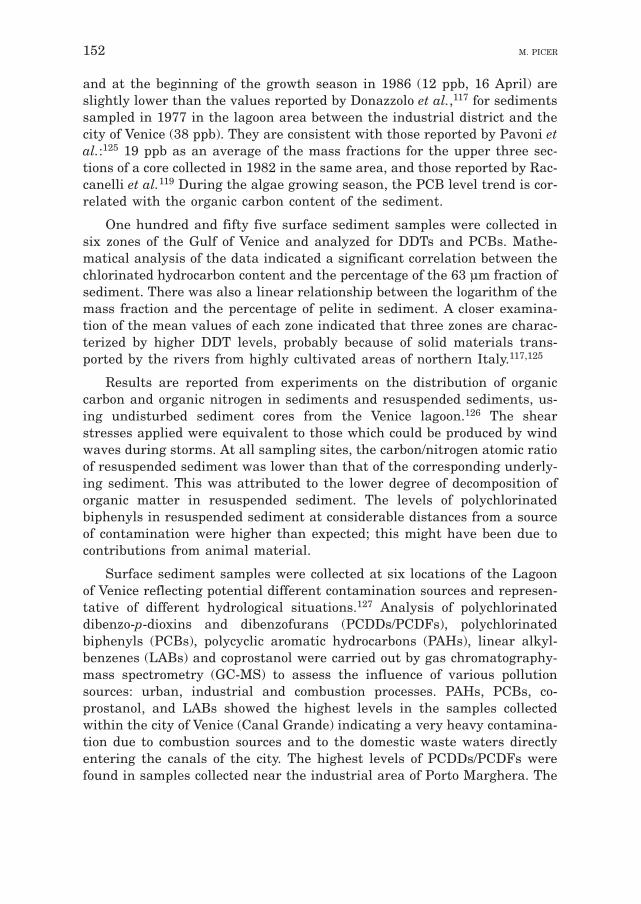
and at the beginning of the growth season in 1986 (12 ppb, 16 April) areslightly lower than the values reported by Donazzolo et al.,117 for sedimentssampled in 1977 in the lagoon area between the industrial district and thecity of Venice (38 ppb). They are consistent with those reported by Pavoni etal.:125 19 ppb as an average of the mass fractions for the upper three sec-tions of a core collected in 1982 in the same area, and those reported by Rac-canelli et al.119 During the algae growing season, the PCB level trend is cor-related with the organic carbon content of the sediment.
One hundred and fifty five surface sediment samples were collected insix zones of the Gulf of Venice and analyzed for DDTs and PCBs. Mathe-matical analysis of the data indicated a significant correlation between thechlorinated hydrocarbon content and the percentage of the 63 µm fraction ofsediment. There was also a linear relationship between the logarithm of themass fraction and the percentage of pelite in sediment. A closer examina-tion of the mean values of each zone indicated that three zones are charac-terized by higher DDT levels, probably because of solid materials trans-ported by the rivers from highly cultivated areas of northern Italy.117,125
Results are reported from experiments on the distribution of organiccarbon and organic nitrogen in sediments and resuspended sediments, us-ing undisturbed sediment cores from the Venice lagoon.126 The shearstresses applied were equivalent to those which could be produced by windwaves during storms. At all sampling sites, the carbon/nitrogen atomic ratioof resuspended sediment was lower than that of the corresponding underly-ing sediment. This was attributed to the lower degree of decomposition oforganic matter in resuspended sediment. The levels of polychlorinatedbiphenyls in resuspended sediment at considerable distances from a sourceof contamination were higher than expected; this might have been due tocontributions from animal material.
Surface sediment samples were collected at six locations of the Lagoonof Venice reflecting potential different contamination sources and represen-tative of different hydrological situations.127 Analysis of polychlorinateddibenzo-p-dioxins and dibenzofurans (PCDDs/PCDFs), polychlorinatedbiphenyls (PCBs), polycyclic aromatic hydrocarbons (PAHs), linear alkyl-benzenes (LABs) and coprostanol were carried out by gas chromatography-mass spectrometry (GC-MS) to assess the influence of various pollutionsources: urban, industrial and combustion processes. PAHs, PCBs, co-prostanol, and LABs showed the highest levels in the samples collectedwithin the city of Venice (Canal Grande) indicating a very heavy contamina-tion due to combustion sources and to the domestic waste waters directlyentering the canals of the city. The highest levels of PCDDs/PCDFs werefound in samples collected near the industrial area of Porto Marghera. The
152 M. PICER

investigation on the PCDDs/PCDFs homologue profiles suggested the pres-ence of two different sources for these pollutants, one due to combustionprocesses and the other due to the chemical contamination.
A total of 30 NW Mediterranean surficial sediment samples collected inthe prodeltas of the Rhone and Ebro Rivers, continental shelf, slope, anddeep basin were analyzed for 12 individual polychlorinated biphenyl (PCB)congeners, chlorinated diphenylethane pesticides (2,4'- and 4,4'-DDT andtheir metabolites), and hexachlorobenzene.129 The spatial distribution of thePCB congeners and their levels illustrate the relative contribution to thepollution burden in the NW Mediterranean basin of river inputs, urbansewage disposal, and atmospheric deposition, the latter particularly rele-vant in the deep basin. Estimates of annual fluxes of these compounds inthe NW Mediterranean sediments were from 0.5 to 1580 µg m–2 for PCBs(in Clophen A60 equivalents), and from 0.3 to 2060 µg m–2 for DDTs (DDT +DDE + DDD). These results account for an accumulation rate in the wholearea of 2705 kg per year for PCBs and 2030 kg per year for DDTs. However,the major accumulation of organochlorinated compounds was found to occurin the prodelta areas with an apparent decrease in the Rhone area duringthe last 15 years, but not in the Ebro, probably reflecting the earlier ban-ning of the use of these compounds in that region.
Plankton and Plants
In Table VI, chlorinated hydrocarbons in plankton and plants from theMediterranean Sea are compared to the same organisms sampled in theAdriatic. Cattani et al.,133 reported levels of DDTs and PCBs found in zoo-plankton samples collected from two stations in the Italian coastal waters ofthe northern Adriatic. The levels of PCBs, which were consistently higherthan pesticides, show seasonal variations which seem to be correlated withthe biomass of Cladocera which are more abundant during summer. The re-sults suggest that levels of chlorinated compounds in zooplankton of thenorthern Adriatic were generally lower than the levels previously reportedfor this same area.136 However, a comparison between the data of mass frac-tions of pesticides in planktonic organisms is not straightforward since theresults can be affected by e.g. the determination, such as taxonomic compo-sition of samples and the size of planktonic organisms.
Chlorinated hydrocarbons94 (BHC, DDT and metabolites, and PCBs)were determined in sea water, in particulate suspended matter and in netzooplankton samples collected from the area facing the Po River delta duringAugust 1979 and September 1980. As expected, chlorinated hydrocarbonvalues in the area under consideration are higher than those reported fornet zooplankton and waters of the eastern coast of the Adriatic and the open
DDTs AND PCBs IN THE ADRIATIC SEA 153

Mediterranean sea. A considerable fraction of chlorinated hydrocarbons isassociated with the suspended matter; moreover, this amount increases (to-tal BHC < total DDT < total PCB) with the decrease of their solubility insea water. Levels of total DDT and total PCB in the particulate matter andin the net zooplankton are similar in terms of dry weight mass fractions,with application factors of 104. On a per volume basis, the absolute quanti-ties of chlorinated hydrocarbons in zooplankton represent only a few per-cent of these in the particulate mater, due to the different abundance of thetwo components.94
154 M. PICER
TABLE VI
Mass fractions of chlorinated hydrocarbons in plankton and plants from theMediterranean Sea (w � 109, fresh weight)
Plankton
Areaa Pollutants w � 109
average min. max.
Refs.
II DDTsPCBs
1.355
NDb
5.02.2180
130, 131
IV DDTsPCBs
6.316.7
0.82
1366
132
VI DDTsPCBs
3.44.7
0.30.6
61.19.6
132
Adriatic DDTsPCBs
4.948.2
NDND
59453
76, 93, 94, 96,133
Plants
Areaa Organisms Pollutants w � 109
average min. max.
Refs.
II Plants(2 species)
DDTsPCBs
3.320.8
NDND
25.628.8
134
VI Plants(12 species)
DDTsPCBs
0.911.7
0.12.7
3.939.4
135
Adriatic Plants(2 species)
DDTsPCBs
1.64.3
–––
–––
95
a See Figure 4.
b ND, non detected (under sensitivity limit); –, no available data.

Heavy metals and chlorinated hydrocarbons in the plankton of theNorth and Middle Adriatic Sea were investigated by Campesan et al. Thepaper reports the results of the analyses of Hg, Cd, Cu, Zn, total DDT, totalHCH and total PCB in net plankton collected from the North and MiddleAdriatic during ASCOP 0/1, 2 and 3 cruises. The risk of contamination ofsamples during collection as well as the spatial distribution of these pollut-ants are discussed; then the levels in the Adriatic are compared with thosereported for other areas of the Mediterranean Sea.137,138
Picer et al.76,93 found that the levels of chlorinated hydrocarbons inplankton samples collected from the Rijeka Bay varied considerably. Fre-quently, levels at the same station differed by nearly one order of magni-tude. In the light of these variations, it is not surprising that it was not pos-sible to detect any influence of local pollution sources in the Rijeka Baywhen analyzing plankton samples collected from the »open« waters of theRijeka Bay.
Mass fractions of PCBs, HCHs and DDTs residues in seaweed of theEast Coast of Sicily were investigated during 1977/78 by Amico et al.135 Theresidues were determined in thalli of 12 species of marine algae. Differentseaweed tends to retain variable amounts of water, so residue levels ex-pressed in terms of dry weight are very important. The highest mass frac-tions found were in samples from an area (Priolo) intensively polluted bynearby industrial activity. The ratio DDTs/PCBs was consistently lower inalgae than in animals from the same area, whereas the opposite applied tothe ratio DDTtotal/DDE, while peak patterns of PCBs obtained from sea-weed were not comparable in proportion with those from animals, and werecharacterized by higher intensity peaks of shorter retention time. The ob-served differences might be explained by assuming that the metabolicbreakdown of DDT and PCB is a much slower process in seaweed than inanimals. However, it cannot be excluded that a differential intake of con-taminants contributes to these differences.
Macroalgae are reported to accumulate both heavy metals and organiccontaminants, such as polychlorinated biphenyls. Some nitrophile species,such as Ulva rigida, have populated large areas of the Venice lagoon, oftenaccounting for > 90% of species for most of the growing season.123 The PCBcontents of Macroalgae were determined in both fresh and old fronds. Fivesamples of young fronds sampled at the surface and five more samplestaken near the bottom were analyzed. The PCB mass fraction in young al-gae was (27 � 12) � 109 dry wt. and those in old algae (121 � 4) � 109 dry wt.PCBs levels in older and decomposing algae were therefore � 4.5 timeshigher than in new fronds.123
DDTs AND PCBs IN THE ADRIATIC SEA 155

Shellfish and Crabs
Many organic pollutants occur in marine waters at concentrations of ngdm–3 or less. Methods for the direct analysis of such concentrations in sea-water are being developed but the time and expense of handling the largevolumes of seawater required prohibit routine use of water analyses inmany monitoring programs. Thereafter, several species have been suggestedas possible sentinel organisms based on their ability to take up and elimi-nate a particular set of compounds. Bivalves have proved to be promisingcandidates since they actively concentrate several classes of pollutants andare attached to filterfeeders.139 Since the late 1960s, scientists have beenusing bivalve filter-feeding mollusks to monitor selected chemical contami-nants in coastal marine waters and an extensive »mussel watch« literaturehas developed from that work.140
A bimonthly survey was carried out to measure existing levels of somechlorinated hydrocarbons in mussels of Laguna Veneta. The distribution ofchlorinated pesticides was quite uniform; significant differences in the dis-tribution of PCBs were observed for samples collected inside the Laguna, in-dicating the presence of local inputs.141 The overall data, tested by the re-gression analysis, showed no significant correlation between the residuelevels and fat content, while positive correlations were found during sum-mer. This finding suggests that variation in the mussels lipid cycle may beresponsible for some variations in the residue levels during the optimalgrowing conditions and active reproductive period, when the ingestion offood and spawning are relevant factors, affecting the accumulation and re-moval of lipid and lipophilic pollutants. During winter, the relationshipsfail, indicating probably a more complex mechanism for accumulation of pol-lutants and lipids; in fact, the uptake of pollutants from food may be low orcomparable with other routes, such as the uptake directly from water andby ingestion of inorganic particulate matter. Furthermore, the build-up oflipid reserves in the eggs may be due to the conversion of prestored glycogenrather than to the assimilation of food.
A comparison of the mass fraction of chlorinated hydrocarbons in musselsamples obtained from various areas of the Mediterranean Sea and of themass fraction of these pollutants in mussels collected from the Adriatic41 ispresented in Table VII. When comparing the most recent data on these lev-els obtained for each area with the data obtained during the Yugoslav Moni-toring Program, Phase 2, it can be noticed that for the levels recorded DDTsand PCBs during the Yugoslav Monitoring Program are much lower.41 Also,as regards the mussel data obtained from the analysis of samples collectedfrom the Adriatic Sea in the period between 1976 and 1980, the Yugoslavmonitoring data are lower for DDTs about 50% and even more (about four
156 M. PICER

times) for PCBs. Figure 9 and Figure 10 present the levels and the trends ofDDTs and PCBs as a natural logarithm of the means and their standard er-ror of mass fraction in mussels (wet weight basis) collected from differentinvestigated areas of the eastern Adriatic coastal waters in the 1976–1990period.41
DDTs AND PCBs IN THE ADRIATIC SEA 157
TABLE VII
Mass fractions of chlorinated hydrocarbons in mussels from the MediterraneanSea (w � 109, fresh weight)
Areaa Period ofinvestig.
DDTs PCBs Refs.
w � 109
average range
w � 109
average range
II 1970/74 150.2 (92)b 10.0–900.0 395.4 (105) 33.1–2073 100, 111,141, 142
II 1976/79 25.9 (15) 1.5–46.0 126.1 (15) 10.9–233.0 88, 106,144–146
II 1979/82 20.5 (34) 4.6–55.4 92.7 (17) 9.1–327.3 85, 148
IV 1978/81 34.7 9.0–57.3 96.4 20.0–172.7 146, 149
VI 1977/78 33.1 (4) 9.0–35.6 78.0 (4) 42.0–100.9 135, 146
VIII 1975/79 23.9 (96) – 383.4 (96) – 150
Adriatic 1973 34363 (7) – – – 136
Adriatic 1973/74 98.7 (67) NDc–506.9 153.9 (67) ND–390.1 76, 83, 146,151, 152
Adriatic 1976/80 12.9 (140) ND–301.1 82.5 (77) ND–1586 76, 83, 146,151, 152
Adriatic 1983/90 8.7 (108) ND–41.0 21.2 (107) ND–68.0 41, 76, 83
The AdriaticSea
1997d 7.5 (15) 1.5–45.0 356 (15) 12.5–1510 121
a See Figure 4.
b Number of samples in brackets.
c ND, not detected (under sensitivity limit).
d Samples collected during 1997 from the coastal waters of the city of Zadar, Krka estuary nearBilice, Vransko Lake near Biograd, and the Dubrova~ka River near Komolac.

Although several major north Italian rivers discharge into the NorthAdriatic, mussel samples from Istrian coastal waters did not have signifi-cantly higher levels of DDTs and PCBs that did other waters. Chlorinatedhydrocarbon levels often differ dramatically in samples collected at stations
158 M. PICER
Figure 9. The levels and trends of DDTs as a natural logarithm of the means andtheir standard error of mass fraction in mussel samples (wet weight basis) collectedfrom different investigated areas of the eastern Adriatic coastal waters in the period1974–1990 (modified from UNEP).41

which are close together, possibly because the first station water had beencontaminated with waste waters and that of the second station had not.Evidently, urban wastewaters even from relatively small settlements con-tribute significantly to the local contamination of Adriatic waters with chlo-
DDTs AND PCBs IN THE ADRIATIC SEA 159
Figure 10. The levels and trends of PCBs as a natural logarithm of the means andtheir standard error of mass fraction in mussel samples (wet weight basis) collectedfrom different investigated areas from eastern Adriatic coastal waters in the period1974–1990 (modified from UNEP).41

rinated hydrocarbons.152 Levels of PCBs were significantly higher thatthose of the DDT group in the samples of mussels collected in the vicinity ofthe industrial pollution sources of the Rijeka Bay. In the samples collectedaway from industrial sources of pollution, levels of DDTs were higher thanPCB levels. The level of contamination by persistent chlorinated pesticidesin mussels throughout the coastal zone of Rijeka Bay appears to be thesame. This was somewhat unexpected because it is well known that urbanwastewaters are relatively rich in persistent chlorinated insecticides. A pos-sible explanation could be the recent higher use of DDT and its analoguesfor pest control in agriculture and forestry, because the coastal zone is atypical karstic region and consequently, once applied, pesticides are likely todrain into the Rijeka Bay very quickly.76,83
In the marine environment of the Montenegro coast of the South Adri-atic, the contents of DDTs and PCBs are as follows: DDE, 8.2 to 14.4; DDD,0.3–0.7; DDT, 2.8–3.6; PCB, 0.01 ppb.122 The presence of chlorinated hydro-carbons was established in the shellfish tissues of striped venus (Chameleagallina) in Neretva Estuary. Levels of DDT (dry weight) were up to 10ppb. The values recorded for DDD were exceptionally high: 1050 ppb (dryweight).153
The bioaccumulation potential of three highly toxic coplanar PCB iso-mers (3,3',4,4'-tetrachlorobiphenyl, T4CB; 3,3',4,4',5-pentachlorobiphenyl,P5CB; and 3,3',4,4',5,5'-hexachlorobiphenyl, H6CB) was investigated usinggreen lipped-mussels (Perna viridis Linnaeus) as a bioindicator, in a trans-plantation experiment at two locations in marine waters. In contrast to therelatively rapid uptake and release of many other PCB isomers, the non-or-tho chlorine substituted coplanar PCB congeners exhibited slow uptake andclearance. The kinetic parameters of coplanar PCBs based on lipid weight-related data, and the degree of bioaccumulation based on the proportion ofcoplanar PCBs in total PCBs in mussels, clearly indicate that coplanar PCBsare highly bioaccumulative in lower organisms. On the assumption thatmussels are unlikely to be particularly unusual with respect to their bioac-cumulation of coplanar PCBs, it appears most likely that these highly toxicand persistent PCB congeners are concentrated in all aquatic organisms,and may reach higher consumers (including humans) in quantities of toxico-logical concern.37
Investigation of the uptake and depuration of planar PCB congeners bythe American Oyster (Crassostrea virginica) shows that two of the mosttoxic planar PCB congeners (77 and 126) were bioconcentrated by trans-planted oysters during a 7-week exposure period. Congener 77 attained anequilibrium concentration in a shorter period of time than congener 126.When contaminated oysters were transplanted back into the clean marine
160 M. PICER

area, they significantly depurated both planar PCB congener. However, theestimated depuration half-lives were significantly longer than those corre-sponding to different PCBs within the same homolog groups. Because oftheir potential toxicity, this persistency of highly toxic planar congeners isof significant importance in environmental studies. These congeners can beconsiderably bioconcentrated, and retained, by bivalves and constitute a po-tential health hazard for higher consumers, including human beings.154
A comparison of the levels of chlorinated hydrocarbons in crustaceansamples obtained from various areas of the Mediterranean Sea and in sam-ples collected from the Adriatic43 is presented in Table VIII. As seen, thehighest PCB levels were observed in the Adriatic and the highest DDT lev-els in crustaceans off the Eastern Mediterranean coast of Turkey.
Carcinus mediterraneus and Nephrops norvegicus were collected season-ally from the Italian coast of the northern Adriatic Sea (off Porto Garibaldiand Cesenatico) over a four-year period (1976–1979) and were analyzed fortheir chlorinated hydrocarbon content. The overall data on chlorinated hy-drocarbons show that PCB residues predominate in all species at all sta-tions regardless of the season.151
DDTs AND PCBs IN THE ADRIATIC SEA 161
TABLE VIII
Mass fractions of chlorinated hydrocarbons in crustaceans from theMediterranean Sea (w � 109, fresh weight)
Areaa Organisms DDTs PCBs Refs.
w � 109
average range
w � 109
average range
II Two species 6.5 1.2–13.0 71 21–203 88, 144–147
IV NephropsNorvegicus
3.3 0.2–16 9 2.9–23.3–
135, 146,149
VI NephropsNorvegicus
1.2 0.9–1.6 4.9 5.4 135
IX Parapaneuskerathurus
78.9 8.9–161 NDb 15
Adriatic Six species 8.8 ND–30.2 110 ND–796 95, 146, 151,155, 156
a See Figure 4.
b ND, not detected (under sensitivity limit).

Fishes
Data on levels of DDT and its derivatives, and PCBs found by variousauthors in fishes collected from the Mediterranean Sea are summarized inTable IX.
Residues of lindane, dieldrin, DDT and its metabolites and PCBs foundin fish captured in the Po Delta during 1972 were reported by Viviani etal.161 In Gobius paganellus chlorinated hydrocarbons were always less than1 ppm (fresh weight) whereas higher levels (up to 4 ppm) of DDT and itsmetabolites, and 12 ppm of PCB were found in the liver. The authorsclaimed that no particular accumulation of the investigated chlorinated hy-drocarbons occurs in fish in the Po Delta.161
Viviani et al. investigated the presence of residues of DDT, its metabo-lites and PCBs in muscles and Crisetig et al. in ripe female gonads of theNorth Adriatic Sardina pilcardus, Engraulis encrasicolus and Clupea sprat-tus. The values of the residues found in the gonads during corresponding pe-riods of »gonadic activity« were rather low, even if considered all together(0.558 ppm in sardine, 0.184 in anchovies and 0.278 in sprats, and werewell below the levels found to cause a deleterious effect on trout reproduc-tion: 4 to 74 ppm).160,162
Fossato and Craboledda investigated the distribution of chlorinated hy-drocarbons in fish from the Italian coast of the northern Adriatic Sea. Thesequence of species according to tissue level of chlorinated hydrocarbons(Nephrops, Carcinus, Mytilus, Mullus, Engraulis, and Thunnus) only partlyreflects their lipid content. Levels in anchovies were comparable to thosefound in mullet, although the lipid contents of the two species were very dif-ferent. Tuna, the biggest predatory fish of the Adriatic, contained the high-est levels of DDT and PCB while having a lipid content comparable to orlower than mullet.151 Of the several species studied, Engraulis encrasicolussampled off Porto Garibaldi and Cesenatico is only one for which compari-son over a long period can be made for the area under consideration. Thedata in Table X show that chlorinated hydrocarbon levels in anchovy sam-pled during the period from November 1976 to June 1979 were significantlylower than those observed in the same species between 1968 and 1972.54
The level of chlorinated hydrocarbons was determined in several fishspecies (Gobius sp., Mullus barbatus, Diplodus annularis, Oblada me-lanura, and Merluccius merluccius) collected from three areas in the east-ern coastal waters of the middle and north Adriatic Sea. Average wet-weight mass fractions of DDTs and PCBs in fish sampled from the three ar-eas were: Istrian coast, 124 and 144 ppb; Rijeka Bay 37 and 82 ppb; Lo{injIsland, 166 and 157 ppb, respectively. Dieldrin levels were in the low ppb
162 M. PICER

DDTs AND PCBs IN THE ADRIATIC SEA 163
TA
BL
EIX
Mas
sfr
acti
ons
ofch
lori
nat
edh
ydro
carb
ons
inth
eM
edit
erra
nea
nfi
sh(w
�10
9 ,fr
esh
wei
ght)
Are
aaF
ish
spec
ies
DD
Ts
PC
Bs
Ref
eren
ces
w�
109
aver
age
ran
ge
w�
109
aver
age
ran
ge
IIM
ull
us
barb
atu
s68
.63.
0–13
3.2
556.
770
.3–1
618.
288
,14
4,14
5,14
6
En
gra
uli
sen
cra
sico
lus
27.4
11.0
–48.
216
7.1
22.5
–330
.014
4,14
5,14
6,14
7
5va
riou
ssp
ecie
s23
41–
2048
1756
39–1
1356
88,
108,
143–
147
IVM
ull
us
barb
atu
s53
.112
.0–8
6.1
144.
215
.5–3
73.1
135,
146,
148
En
gra
uli
sen
cra
sico
lus
37.3
11.1
–73.
413
25.6
19.8
–232
.313
5,14
6,14
9
Th
ynn
us
thyn
nu
s37
.022
.5–5
1.3
40.0
35.5
–44.
513
5
VI
Mu
llu
sba
rba
tus
19.0
4–38
2722
–224
135,
146
En
gra
uli
sen
cra
sico
lus
3611
.3–8
2.8
599–
177
Th
ynn
us
thyn
nu
s37
–40
–13
5
VII
IM
ull
us
barb
atu
s76
4–40
043
214
–161
315
0,15
7,15
8
Th
ynn
us
thyn
nu
s12
39–
2613
–15
0
Mer
lucc
ius
mer
lucc
ius
43–
510
–
IXM
ull
us
barb
atu
s17
511
–379
1.4
ND
b –2
115,
116
Up
eneu
sm
olu
ccen
sis
7427
–84
2–
XM
ull
us
barb
atu
s29
3–83
60N
D–2
8415
9
Var
iou
sfi
shes
(3)
25N
D–1
0612
0N
D–8
00
Ad
riat
icM
ull
us
barb
atu
s31
.2N
D–1
64.2
89.1
ND
–188
.476
,14
6,15
0,15
1,15
5
En
gra
uli
sen
cra
sico
lus
52.9
3.8–
102.
515
5.6
10.1
–240
.776
,13
6,14
6,14
7,15
0,15
1,15
5,16
0–16
2
Var
iou
sfi
shes
(27
spec
ies)
149
ND
–569
209
ND
–265
076
,13
6,14
6,14
7,15
0,15
1,15
5,16
0–16
3
Th
eA
dria
tic
Sea
,19
97c
Var
iou
sbe
nth
ican
dep
iben
thic
fish
es(7
spec
ies)
5.4
0.6–
36.0
631
36–4
004
121
aS
eeF
igu
re4;
bN
D,
not
det
ecte
d(u
nd
erse
nsi
tivi
tyli
mit
);cS
amp
les
coll
ecte
dd
uri
ng
1997
from
the
coas
tal
wat
ers
ofth
eci
tyof
Zad
ar,
Krk
aes
tuar
yn
ear
Bil
ice,
Vra
nsk
oL
ake
nea
rB
iogr
ad,
and
the
Du
brov
a~k
aR
iver
nea
rK
omol
ac.

range. Statistical analysis of the data showed that the only levels that dif-fered significantly per areas were those of DDTs in samples from the RijekaBay versus those from the Lo{inj area and in samples from the Istrian coastversus those from the Rijeka area. The differences in PCB mass fractionswere not significant.152 Revelante and Gilmartin163 studied the distributionof chlorinated pesticides and PCBs in the muscle, digestive tract, liver andgonads of several pelagic (6 species) and benthic (11 species) fish from thenorthern Adriatic Sea. The distribution of some chlorinated pesticides andPCBs was also investigated by Dujmov et al.121 in fishes of the Middle Adri-atic and by Kljaji} et al.165 and Vili~i} et al.156 in fishes of the South Adri-atic. Chlorinated hydrocarbons in fish (Mullus barbatus) in the marine envi-ronment of the Montenegro coast in South Adriatic varied – DDE: 0.01 to4.95, DDD from 0.01 to 0.84; DDT from 4.17 to 15.14 and PCBs from 0.01 to297.3 ppb.122
Polychlorinated biphenyls and organochlorinated pesticides were ex-tracted from samples of eel muscle (Anguilla anguilla L.) caught in the PoDelta and determined by fused silica capillary gas chromatography/massspectrometry.166 The main compounds identified were polychlorinatedbiphenyls, HCB, p,p'-DDT and its metabolites, p,p'-DDE and p,p'-DDD.PCB and DDT levels were higher in eels captured in spring than in thosefished in autumn and were correlated with fat values in muscle tissue.Mean PCB levels were 265±9 and 211±6.9 �g kg–1 wet weight, and those ofDDT compounds 18.45±12.7 and 15.76±10.6 �g kg–1 wet weight, respec-tively. They were also higher than those determined in other species of fishcaptured in the same body of water, although the data indicate that there isprobably no real health risk from irregular consumption of eel containingthese xenobiotic levels.
164 M. PICER
TABLE X
Temporal comparison of chlorinated hydrocarbon levels (w � 109, wet weight; means� SD) in Engraulis encrasicolus sampled off Porto Garibaldi and Cesenatico
Sampling period na www � 109, means � SD
DDTs PCBs
Refs.
Nov. 1967 – Sept. 1968 257 � 102 164
Jan. 1970 – Nov. 1970 6 280 � 116 547 � 280 160
Nov. 1972 1 80 370 161
Nov. 1976 – June 1979 16 65 � 37 155 � 43 151
an, number of samples.

Taking into account the location of destroyed Zadar and Dubrovnik Elec-trical Transformer Stations that were encompassed by warfare in1991/1995, there is some speculation regarding the potential hazard fromorganohalogenated toxicants to the sea around the Zadar and Dubrovnik ar-eas. In 1997 benthic and epibenthic fish samples were collected and ana-lyzed from Zadar and Dubrovnik areas at six stations. The levels of pollut-ants in the fish samples ranged from < 0.5 to 353 ppb (before the war) andfrom < 0.1 to 35.8 ppb (after the war) for DDTs, from < 0.5 to 311 ppb (beforethe war) and from < 74 to 4004 ppb (after the war) for PCBs wet weight.Figure 11 presents a scatter plot of the logarithmic values of the DDTs andPCBs levels in the fish samples collected from the coastal waters of the Zadarand Dubrovnik areas in comparison with the collection year. In the figure,linear regression line and two pairs of dotted lines representing the 95%confidence and prediction limits are estimated. As seen, a significant nega-tive yearly trend for DDTs levels is obtained. In the case of PCBs, a signifi-cant positive yearly trend is obtained.
The bioaccumulation of organochlorinated contaminants (DDTs, PCBsand HCB) in three representative fish species from the Ebro Delta (westernMediterranean) was studied.167 The species, red mullet (Mullus barbatus),sea mullet (Mugil cephalus) and sea bass (Dicentrarchus labrax), were se-lected for their characteristic habitats and feeding behaviours to investigatetheir potential as bioindicators in pollution monitoring studies. Higher lev-els of PCBs and DDTs were generally found in red mullet and could be re-lated to the higher lipid content of this species. Red mullet and sea bass ex-hibited a similar distribution pattern of these pollutants, whereas DDTsand HCB (hexaclorobenzene) were relatively more abundant in sea mullet,probably as a result of a direct uptake from the water lagoons from wherethe latter were collected and where these pollutants were in higher levels. Adecrease in levels with size (age) was generally observed in red mullet andsea bass, though less clearly in sea mullet. This decrease was more pro-nounced for DDTs, probably owing to metabolic transformations. However,when data were normalized to lipid content, evidence for a positive uptakeby sea mullet was obtained, probably relating to the higher growth rate ofthis species. These results indicate that the accumulation of organochlorinecompounds in coastal fish from the same area depends on the lipid content,habitat, dietary intake, growth rate and the metabolism of each species. Al-though these fish can be used for pollution monitoring, the subsequent vari-ability of pollutant body burdens that are influenced by these factor, pre-cludes the extrapolation of data from one species to another.
Mass fractions of PCBs, DDTs, HCHs, HCB, aldrin, dieldrin, chlordanes,heptachlor, and heptachlor epoxide were determined in cod-liver oil samples
DDTs AND PCBs IN THE ADRIATIC SEA 165
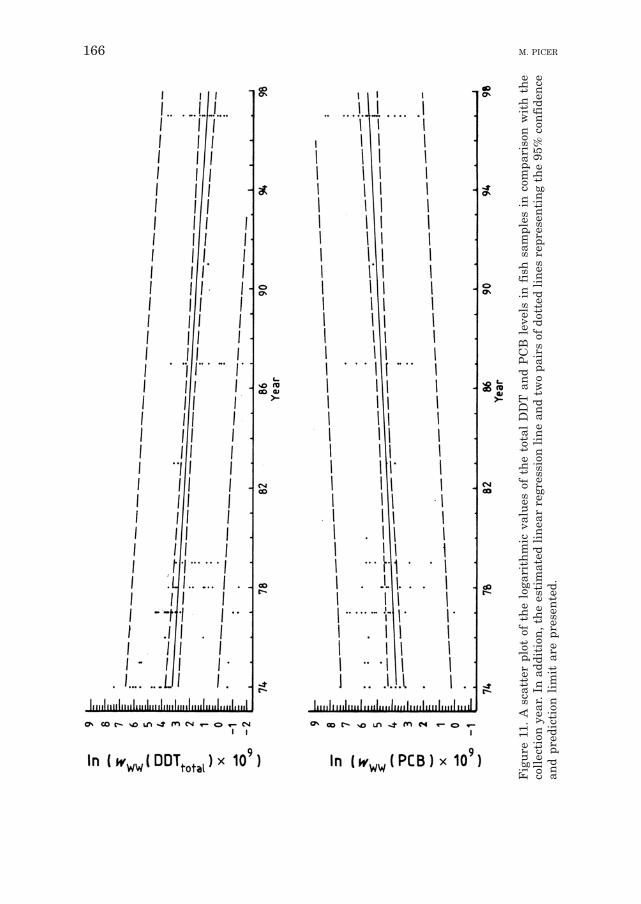
166 M. PICER
Fig
ure
11.
Asc
atte
rp
lot
ofth
elo
gari
thm
icva
lues
ofth
eto
tal
DD
Tan
dP
CB
leve
lsin
fish
sam
ple
sin
com
par
ison
wit
hth
eco
llec
tion
year
.In
add
itio
n,t
he
esti
mat
edli
nea
rre
gres
sion
lin
ean
dtw
op
airs
ofd
otte
dli
nes
rep
rese
nti
ng
the
95%
con
fid
ence
and
pre
dic
tion
lim
itar
ep
rese
nte
d.
collected from the southern part of the Baltic proper during 1971–1989 forthe purpose of understanding the long-term changes in residue levels andthe present status of contamination.168 There has been a rapid decline inDDT levels from 1974 until the present. PCBs, HCB, aldrin, and dieldrintended to decrease at a very slow rate while HCHs showed a steady state intheir time trends.
The levels of organochlorines in tropical fish were lower than those infish of the temperate regions.169 This is different from the patterns observedfor air and water in which higher levels occur in tropical latitudes comparedto mid-latitudes.
Birds and Other Organisms
Residues of lindane, dieldrin, p,p'-DDD and PCB found in birds capturedin the Po River delta during 1972 were reported by Viviani et al.161 Thesea-gull (Larus ridibundus) showed the highest levels of DDT and its me-tabolites (4 ppm in the muscle and liver) whereas the common tern (Sternahirundo) had the highest level of PCB (7.9 ppm in the breast muscle and 8.6in the liver). By comparison with the literature data the authors consideredbirds in the Po delta were not particularly contaminated by the organochlo-rine compounds investigated.
Eggs of the following species from the Adriatic were analyzed over theperiod 1980/81: little egret, night heron, stilt, coot, avocet, black-headedgull, herring gull, slenderbilled gull, gull-billed tern, common tern and littletern from three areas along the Italian shore.170 Authors found low levels ofmost of the analyzed chlorinated hydrocarbons compared with other marineareas of the world. However, the levels of PCB in the eggs of all species butavocet, stilt and coot, were quite high in all sampling areas suggesting awidespread polychlorinated biphenyl contamination.
Fassola et al. report on organochlorine pesticide and PCBs levels in eggsof the little egret, Egretta garzetta, and the black-crowned night-heron, Nycti-corax nycticorax, collected in 1993–1994 from heronries near Pavia, north-ern Italy.171 Organochlorine pesticide and PCB residues were lower thanthose commonly associated with mortality and reduced reproductive suc-cess. As population levels of the species studied are not declining, these con-taminants appear to have no significant adverse effect on reproduction inthe heronries studied. DDE levels have decreased markedly in heron eggssince 1978.
Relevante and Gilmartin163 investigated the distribution of chlorinatedhydrocarbons in several samples of Sepia officinalis and Loligo vulgaris.Levels of DDT total ranged from 1 to 58 ppb wet weight but PCBs were
DDTs AND PCBs IN THE ADRIATIC SEA 167

found lower. For an evaluation of the extent of pollution in the Rijeka Bay,Croatia, by chlorinated hydrocarbons an investigation of their levels in sedi-ments and the most abundant benthic organisms (Asteroidea and Holo-thuroidea species) was carried out.173 Samples were collected at several sta-tions in October 1981. The levels of DDTs and PCBs in Asteroidea specieswere from 0.5 to 46.0 ppb for DDTs and from 2.5 to 435 ppb for PCBs (wetweight). For the PCBs in Holothuroidea species, the values ranged from 4.4to 37.2 ppb and for DDTs from 0.9 to 48.5 ppb. The relatively low bioaccu-mulation of PCBs and DDTs from sediments in the Rijeka Bay by the Aster-oidea and Holothuroidea species is reassuring because of the problem ofdredging and ocean dumping of sediments polluted with persistent chlorin-ated hydrocarbons. There is scarce or almost no information, however, onthe extent to which the species will contribute to chlorinated insecticidesand PCB accumulation in their predators.
Mammals
PCB levels and total lipid content were determined in the blubber andliver of striped dolphins affected by the 1990 morbillivirus epizootic in theMediterranean Sea,173 and in the blubber of striped dolphins from the samearea sampled with a biopsy dart in 1987–1989 and 1991. PCB levels werefound to be significantly higher in the individuals that succumbed to theepizootic than in the 'healthy' population sampled before or after the event.Although recent mobilization of lipid reserves was found to have occurred insome of the diseased dolphins, this had little effect on their PCB blubberlevels and cannot explain the observed difference from the healthy individu-als. Three hypotheses are put forward to explain the apparent link betweenhigh PCB levels and mortality caused by the epizootic: (i) depressed immu-nocompetence caused by PCBs leading to an increase in individual suscepti-bility to the morbillivirus infection, (ii) mobilization of fat reserves leadingto increased PCB levels in blood which, in turn, may produce a liver lesioncapable of increasing the individual's susceptibility to the morbillivirus in-fection, and (iii) previous existence of an unspecific hepatic lesion producingimpairment of the liver function which, in turn, could lead to an increaseboth in tissue PCB levels and in individual susceptibility to the morbillivi-rus infection.
Levels of chlorinated pesticides and polychlorinated biphenyls (PCB)have been determined in tissues and organs of Stenella coeruleoalba dol-phins beached along the Adriatic and Ionian coasts of Apulia – Southern It-aly.174 The results obtained confirm that in Mediterranean dolphins the ac-cumulation of contaminants is higher than in similar species living in theAtlantic. Therefore, cetaceans can be considered ''organisms indicating pol-
168 M. PICER

lution''. Accumulation is influenced by factors such as diet, age and sex. Re-production plays a fundamental role in the elimination of toxic compoundsin females. No correlation between contamination and death has beenfound; however, it is clear that pollutants at sub-lethal doses have neuro-toxic effects, increase stress and alter immune defenses, leaving the organ-ism at a greater risk from disease.
Levels of HCB, DDTs and PCBs in the tissues and organs of cetaceans(Stenella coeruleoalba, Tursiops truncatus, Balaenoptera physalus, Stenobredanensis, Grampus griseus and Globicephala melaena) stranded alongthe Italian coasts in the period 1987–1993 are reported.175 The values arecompared between species and between specimens of the same species (Fig-ure 12). Chlorinated hydrocarbon levels were found to increase in relationto the quantity and type of lipids in each tissue and organ. Differences inaccumulation encountered in the different species are principally due to dif-ferent feeding habitats. Remarkable differences found between males andfemales of each species confirm that during gestation and lactation, femalesundergo disintoxication by passing much of their total burden of CHs totheir young.
DDTs AND PCBs IN THE ADRIATIC SEA 169
Figure 12. Stenella coeruleoalba. Levels of organochlorines in brain, blubber, muscleand liver in relation to age. (A) Showing sex (0: sex unknown, 1: male, 2: female) andcause of death (circle: dolphins dying because of accidents). (B) Showing locality ofstranding (T: Thyrrhenian Sea, A: Adriatic Sea, I: Ionian Sea.) (modified from Mar-sili et al.).175

Bottlenose and Risso's dolphins found dead along the Italian coast in1992 were analyzed for the presence of PCB isomers and DDT. High levelsof PCBs (90–1400 �g g–1, wet weight) were detected in the blubber ofstranded carcasses.176 The levels were higher than those found in animalsshowing reproductive failure and physiological impairment following pro-longed PCB exposure, suggesting that the contamination by PCBs as wellas DDT may be a major causative factor for the large-scale deaths of dol-phins in the Mediterranean Sea. The 2,3,7,8-TCDD toxic equivalents esti-mated for bottlenose and Risso's dolphins were 18.8 and 20.0 ng g–1, respec-tively, with a major contribution from mono-ortho PCBs. The mono-orthocongeners of IUPAC No. 105, 118 and 156 accounted for most of the toxicityexerted by PCBs in these dead dolphins. An increase in the proportion ofnon-ortho coplanar PCB congener of IUPAC No. 169 to No. 126 with an in-crease in the total PCB concentration in the blubber suggested a strong in-duction of drug metabolizing enzymes. It is possible to use CB-169/CB-126concentration ratio to indicate whether there has been a strong activation ofcytochrome P-450 enzyme system in severely exposed/contaminated dolphinpopulations.
BIOMARKERS
It is extremely difficult to quantify the risks associated with xenobiotics,since the single and combined biological effects of most of them are still un-known. The complexity of the problem will increase in the future becausethe anthropogenic organic compounds introduced into the environment areever more numerous. Therefore, the optimal approach to the problem of therisk assessment of xenobiotics is measurement of early biological effects in-duced as a response to the micropollutants pool in the water environment.Biomarkers of contaminant exposure and effect are defined as early changesat the molecular and cellular level of biological organization induced bychemical pollutants. They have obvious utility in rapid environmentalscreening for problem sites. This permits detailed studies of chemical, bio-logical and ecological effects to be targeted effectively. However, it has be-come increasingly clear that any definitive assessment of environmentalrisks must be correlated with the origin and the concentration of the xenobi-otics present. To this end, analytical protocols must be designed for the iso-lation and identification of such compounds, as well as for the application ofbiomarker assays to environmental samples.177,178
The use of cytochrome P4501A (CYP1A) and other measurements as bio-markers was investigated in the liver of goby (Z. ophiocephalus) and the di-gestive gland of mussel (M. galloprovincialis) from several sites in the Ven-ice lagoon as part of the UNESCO-MURST Venice Lagoon Ecosystem
170 M. PICER

Project.179 Most tissue contaminants (PAHs, PCBs, DDTs) and biochemicalmeasurements varied seasonally. Elevated 7-ethoxyresorufin O-deethylaseactivity and CYP1A-protein levels in goby were correlated with high tissuecontaminant levels at the industrial Porto Marghera site. On occasions, ac-tivities of the antioxidant enzymes catalase and putative DT-diaphorase (re-sorufin reductase activity) in male but not female goby were also higher atPorto Marghera than at other sites, but no differences were seen in superox-ide dismutase (SOD) activity. A range of measurements (SOD, catalase,NADPH-cytochrome c reductase and glutathione S-transferase activities,P-450 and '418-peak' contents) in mussel showed little difference betweensites. However, indications were obtained of elevated levels of CYP1A1-likemRNA, CYP1A-like protein and the metabolism of benzo�a�pyrene to freemetabolites in mussels from the Venice lagoon compared to a site in the Adri-atic Sea. The studies demonstrate the usefulness of CYP1A as a biomarkerfor organic pollution in fish and indicate some potential for its application inmollusks.
Mussels, Mytilus galloprovincialis, were sampled at three times of theyear, from various sites within the Venice Lagoon and a reference Platformsite in the north Adriatic.179, 180 The immune response of the mussels wasassessed using a range of assays, which included total and differential cellcounts, phagocytosis, degradative enzyme levels and release of reactiveoxygen metabolites. Chlorinated hydrocarbons, including lindane, DDT andPCBs, together with trace metal levels were measured in digestive glandtissues from the mussels. The measurements of immune response and thecontaminant levels showed seasonal fluctuations. However, the results diddemonstrate significant differences in a number of immunocompetence as-says which in some instances showed some correlation with the levels ofcontaminants measured in the tissues. In particular, total and differentialcell counts, phagocytosis and release of reactive oxygen metabolites showeda degree of correlation with contaminant burdens though other factors wereclearly involved. The results confirm the requirement for using a range ofassays for monitoring pollution effects.
Fish belonging to three species of cyprinids, that is, barbel (Barbus ple-bejus), chub (Leuciscus cephalus), and Italian nase (Chondrostoma soetta),were collected from two sites of the River Po, located upstream and down-stream from the confluence of one of its middle-reach polluted tributaries,the River Lambro.181 The two groups of individuals caught for each specieswere analyzed and compared for several microsomal and cytosolic biochemi-cal markers. The enzymatic activities assayed in fish liver included ethoxy-resorufin O-deethylase (EROD), aminopyrine N-demethylase (APDM), uridinediphosphate glucuronyl transferase (UDPGT), glutathione S-transferase(GST), glutathione reductase, and glutathione peroxidase. In addition, the
DDTs AND PCBs IN THE ADRIATIC SEA 171

contents of reduced glutathione and nonprotein thiols were measured. De-spite some differences among species, all microsomal activities (EROD,APDM, and UDPGT) were found to be significantly induced in fish livingdownstream the River Lambro. With the exception of a higher GST enzymeactivity of barbel from the downstream reach, no significant modificationwas evident in any of the tested cytosolic biomarkers. In general, the altera-tions observed in feral fish are consistent with the results found in previousstudies conducted with rainbow trout (Oncorhynchus mykiss) under bothlaboratory and field conditions in the same middle reach of the River Po. Allof the data indicate that the downstream tract of the main river is exposedto the load of pollutants transported by the River Lambro, including knowninducers such as polychlorinated biphenyls and polycyclic aromatic hydro-carbons.
RISK RELATED TO ACCEPTABLE DAILY INTAKES OFCHLORINATED HYDROCARBONS INTO MAN
Acceptable daily intake (ADI) denotes the dose, expressed on a bodyweight basis, of a substance which can be accepted over a lifetime withoutappreciable health risk. The starting point is usually the no observed ad-verse effect level (NOAEL) estimated in 90-day animal studies and extrapo-lated to man with some margin of safety.182 The animal experimental car-cinogenicity data are sufficient for DDTs and PCBs. It is widely acceptedthat in the absence of adequate data on humans, it is biologically plausibleand prudent to regard agents for which there is sufficient evidence of car-cinogenicity in experimental animals as if they presented carcinogenic riskto humans.183 There is a very wide gap between ADI values set by FAO/WHOand the daily intake which assures that the life-time risk attributable to acarcinogenic organochlorine does not exceed the acceptable level. According
172 M. PICER
TABLE XI
Daily intake associated with 10–5 life risk and levels of organochlorines whichpresent the same acceptable risk at three different fish consumption levels
(modified from UNEP/FAO/WHO/IAEA, 1990)43
Daily intake resultingin 10–5 risk / �g d–1
Levels (w � 109) in seafood with 10–5 risk
One meal weekly Three meals weekly One meal daily
DDTs 0.083 4.2 1.4 0.55
PCBs 0.158 8 2.6 1.0

to WHO,184 the risk is acceptable if not more than one in every 100 000people (10–5 risk) develop cancer as a result of life-time exposure to a can-cerogen. The choice of 10–5 as an acceptable or reference risk level has beenbased on an arbitrary or default, assumption.
Table XI shows daily intakes associated with 10–5 life-time risk. The ta-ble also shows the maximum organohalogen levels, which, if there were noother sources of exposure (from the atmosphere, dust, other foodtuffs), couldkeep intake at the acceptable risk level for low, medium and high fish con-sumption.
Table XII shows risk associated with the cosumption of fish in the low,medium and high contamination categories. Though these numbers arealarming, they must be considered in perspective. First of all, evidence ofcarcinogenicity in animals is not a proof of carcinogenicity in man, butbased on animal experiments it is prudent to regard PCBs and DDTs as po-tential human carcinogens. In the case of PCB, this view is supported bylimited evidence of human carcinogenicity.184
Polychlorobiphenyls have been determined in samples of milk andbutter from areas of Italy reflecting different environmental pollution, inone sample of a local Italian diet, and in samples of agricultural soil.185
PCBs were determined as single congeners and their contamination wasrepresented as a pattern including a maximum of 48 different congeners,containing from three to seven chlorine atoms.
The migration of PCBs from a waste dump into the karstic groundwaterand source water of the Kupa River in Slovenia has been established. An in-vestigation of the levels of chlorinated hydrocarbons in tap water and waterand fish samples collected from 1985 to 1988 from the Kupa River in the re-gion of Petrinja and Sisak (about 200 km downstream from the primary
DDTs AND PCBs IN THE ADRIATIC SEA 173
TABLE XII
Consection between organochlorine contamination in seafood and life-time cancerrisk (modified from UNEP/FAO/WHO/IAEA, 1990)41
Levels (w � 109) Cancer risk
One meal weekly Three meals weekly One meal daily
DDTs8
50150
1.9 � 10–5
1.2 � 10–4
3.6 � 10–4
5.8 � 10–5
3.6 � 10–5
1.1 � 10–3
1.4 � 10–4
9.0 � 10–5
2.7 � 10–3
PCBs25
150450
3.2 � 10–5
1.9 � 10–4
5.7 � 10–4
9.5 � 10–5
5.6 � 10–4
1.7 � 10–3
2.4 � 10–4
1.4 � 10–3
4.3 � 10–3

contaminated area) was performed. Daily PCB and DDT intake was studiedamong sports fishermen and their families who consume fish from the KupaRiver in significant quantities. The same calculations were performed forsports fishermen and their families in the Zadar area. In Figure 13, the
174 M. PICER
Figure 13. Daily intake of PCBs by sport fishermen and their family members in theZadar area, according to age. Upper figure: fish consumption of the total investi-gated area of Zadar. Lower figure: fish consumption of the Marina Station only.

daily intake of PCBs by sports fishermen and their family members in theZadar area, is presented according to age. Upper figure – fish consumptionfrom the total investigated area of Zadar. Lower figure – fish consumptionfrom the Marina Station. As seen, there are many persons (especially thoseassumed to consume fish caught from the Marina Station) who ingest morethan the acceptable daily PCB intake, ADI, (1 µg kg–1 d–1).121
Studies of workers exposed to high doses of PCBs over long periods oftime have not demonstrated an increased cancer risk.186 In fact, the onlyhealth effects that could be attributed to PCBs were skin and eye irritation.Recent studies of the possible effects of prenatal exposure to PCBs on neuro-development in infants and children have been criticized for methodologicaldeficiencies. There is no conclusive evidence that PCB levels in the generalpopulation are causing intellectual deterioration in children exposed inutero. Some investigators have also suggested that PCBs and other chemi-cals in the environment can interfere with the body's endocrine system,leading to infertility, certain types of cancer and other hormone-related dis-orders. Evidence for estrogenic effects of environmental PCBs remains weakand circumstantial.186
CONCLUDING REMARKS CONCERNING THE LEVELSOF ORGANOCHLORINE COMPOUNDS IN THE ADRIATIC
AND THE MEDITERRANEAN
The analytical uncertainty of chlorinated hydrocarbons in marine sam-ples makes the evaluation of and comparison between the data of differentauthors very difficult. Intercalibration exercises show a large dispersion ofresults. The different areas of the Mediterranean have been surveyed veryunevenly. Some data were obtained from only one or two sites (air, rain,waste waters) in the entire Mediterranean. Even for some biota samples(for instance mussels and Mullus barbatus) for which there are plenty ofdata, the scatter of sampling between regions in the Mediterranean Sea isvery uneven. With the exception of Israel and Turkey, very few data areavailable from the southern and eastern coasts of the Mediterranean.
As a measure of the »quality« of all available data and also to see howrepresentative these data are for the investigated area, Table XIII gives theDDT total and PCB level ratios for water, sediment, mussels and stripedmullet from the Mediterranean Sea per regions. Average levels were calcu-lated using data for the period from 1970 to 1984 (but mainly from 1976/1979period) obtained by all the various research groups that have published data.There are very large differences for many »level factors«. For instance, only300 for DDT total between sediment/water in area IV and 142 000 for areaVIII. Similarly, large differences are obtained by comparing level factors for
DDTs AND PCBs IN THE ADRIATIC SEA 175

176 M. PICER
TA
BL
EX
III
DD
Tan
dP
CB
leve
lsra
tios
betw
een
vari
ous
mat
rice
sfr
omth
eM
edit
erra
nea
nS
ea(m
odif
ied
from
UN
EP
/FA
O/W
HO
/IA
EA
,19
90)43
Are
aaS
edim
entb
/wat
erM
uss
elsc
/wat
erF
ish
c/w
ater
Mu
ssel
sc/s
edim
entb
Fis
hc
/sed
imen
tbF
ish
c/m
uss
elsc
DD
Ts
PC
Bs
DD
Ts
PC
Bs
DD
Ts
PC
Bs
DD
Ts
PC
Bs
DD
Ts
PC
Bs
DD
Ts
PC
Bs
IIN
Ad
17.8
�10
3N
A14
.4�
103
NA
1.6
�10
36.
62.
112
.27.
91.
93.
8
III
NA
0.4
�10
3N
AN
AN
AN
AN
AN
AN
AN
AN
AN
A
IV0.
3�
103
44.3
�10
32.
8�
103
41.7
�10
34.
3�
103
62.6
�10
38.
10.
912
.314
.01.
51.
5
VI
NA
21.2
�10
3N
A43
.3�
103
NA
15.0
�10
33.
22.
01.
80.
70.
60.
3
VII
NA
0.9
�10
3N
AN
AN
AN
AN
AN
AN
AN
AN
AN
A
VII
I14
2.2
�10
310
.3�
103
26.7
�10
325
5.3
�10
384
.4�
103
28.8
�10
30.
22.
50.
62.
83.
21.
1
IXN
AN
AN
AN
AN
AN
AN
AN
A10
.20,
9N
AN
A
XN
A5.
5�
103
NA
NA
NA
15.0
�10
3N
AN
A10
,727
.3N
AN
A
Ad
riat
ic1.
3�
103
21.7
�10
37.
6�
103
28.8
�10
36.
1�
103
21.7
�10
34.
94.
63.
70.
80.
70.
9
a See
Fig
ure
4.
b Sed
imen
t:d
ryw
eigh
t.
c Mu
ssel
s,fi
sh(M
ull
us
barb
atu
s):
wet
wei
ght.
dN
A,
not
app
lica
ble.

DDTs AND PCBs IN THE ADRIATIC SEA 177
TA
BL
EX
IV
»Pol
luti
onor
der
«of
the
Med
iter
ran
ean
Sea
area
sw
ith
DD
Ts
and
PC
Bs
calc
ula
ted
onth
eba
sis
ofp
ubl
ish
edav
erag
ele
vels
ofth
ese
pol
luta
nts
inw
ater
,se
dim
ent,
mu
ssel
san
dfi
shes
a(m
odif
ied
from
UN
EP
/FA
O/W
HO
/IA
EA
,19
90)43
DD
Ts
Poi
nts
bP
CB
sP
oin
tsD
DT
s+
PC
Bs
Poi
nts
Ord
erA
reac
No.
ofm
atri
ces
Ord
erA
rea
No.
ofm
atri
ces
Ord
erA
rea
No.
ofm
atri
ces
1.V
III
514
.81.
II5
22.6
1.II
935
.5
2.IX
212
.42.
VII
I5
20.2
2.V
III
1035
.0
3.II
412
.93.
IV6
19.2
3.IV
1229
.7
4.A
dri
atic
511
.04.
Ad
riat
ic5
16.4
4.A
dri
atic
1027
.4
5.IV
610
.55.
VI
612
.65.
VI
1121
.5
6.V
I5
8.9
6.II
I2
11.1
6.II
I3
18.1
7.II
I1
7.0
7.X
36.
27.
IX4
16.2
8.X
23.
68.
VII
22.
88.
X5
9.8
9.V
II1
1.0
9.IX
22.
89.
VII
33.
8
a Mu
llu
sba
rba
tus,
En
gra
uli
sen
cra
sico
lus
and
Th
ynn
us
thyn
nu
s.
b Cal
cula
tion
of»p
oin
ts«
isd
escr
ibed
inte
xt.
c See
Fig
ure
4.

mussel/water: 2800 for DDTs in region IV but 255 000 for region VIII, etc.,etc. These differences are probably not only a consequence of analyticalproblems but also of a very large scatter in the levels of the investigated pol-lutants from region to region and, especially for sediments and mussels,also within a region. There are also differences between level ratios forfish/sediment and mussel/fish but they are not so large as for other com-partments.
In order to obtain some measure of the quantitative relationship be-tween investigated regions, a »pollution order« was calculated for the follow-ing matrices: water, sediment, mussels and fishes Mullus barbatus, Engrau-lis encrasicolus and Thunnus thynnus (Table XIV). Because even for theserelatively »popular« matrices there is considerable scatter among the data,the number of »points« was divided by the number of regional data. For in-stance, DDT total in water was measured in three regions. As seen from thepresented results, the highest value of averages is in region IV. Points werecalculated 3*3/9 = 1. The second one is region V (The Adriatic Sea) and itwas obtained: 2*3/9 = 0.7 etc. For instance mussels were analyzed in five re-gions and the highest averages were obtained for DDT in region II, hencethe mean points are 5*5/9 = 2.8. All the calculations were made in this wayand the results are presented with the »order« of pollution levels separatelyfor DDTs and together with PCBs as summed in Table XIV. It has to bestressed that for areas marked 1 to 5 the reliability is probably relativelygood because similar numbers of data are available for each matrix.
Comparing the averages of DDT levels in sediments, mussels and threefish species (Mullus barbatus, Engraulis encrasicolus and Thynnus thyn-nus) of the whole Adriatic with the averages of the levels of these pollutantsin the other areas in the Mediterranean, it can be concluded that in threeareas of the Mediterranean Sea (Ionian and Aegean sea, Northeast Mediter-ranean and Balearic sea) levels are higher and in 5 areas (Ligurian sea,Thyrrhenian sea, Southwest Mediterranean, Southeast Mediterranean, andSouth-central Mediterranean) DDT levels are lower. Levels of PCBs in thesesamples are higher in three areas of the Mediterranean region (Balearicsea, Ionian and Eagan sea, Ligurian sea) in comparison with the Adriaticand in five areas (Thyrrhenian sea, Southwest Mediterranean, SoutheastMediterranean, South-central Mediterranean and Northeast Mediterra-nean) levels of PCBs are lower.
Acknowledgements. – The author expresses his gratitude to the Ministry ofScience and Technology of the Republic of Croatia and the Croatian-ItalianCommission for the Investigation and Protection of the Adriatic Sea for financialsupport. This work has been carried out as part of the joint FAO (GFCM/UNEP)Coordinated Project on Pollution in the Mediterranean, Pollution Monitoring andResearch Programs and the Croatian-Italian Commision for the Investigation andProtection of the Adriatic Sea.
178 M. PICER

ABBREVATIONS
2,3,7,8-TCDD = tetrachlorodibenzodioxineASCOP = Adriatic Sea Cooperation ProgrammeBHC = benzenehexachlorideBOD5 = biological oxygen demand in 5 daysCBs = chlorinted benzenesECE = European Commission for EnvironmentEPA = US Enironmental Protection AgencyFAO = Food and Agriculture OrganizationGESAMP = Group of Experts on Environmental PollutionHCB = hexachlorobenzeneHCH = hexachlorocyclohexaneIAEA = International Atomic Energy AgencyIAEA MEL = Monaco Laboratory of IAEAIARC = International Agency for Research on CancerLABs = linear alkylbenzenesMED POL = Mediterranean Action Plan: Pollution Monitoring and Research
ProgrammemRNA = messenger ribonucleic acidPAHs = polycyclic aromatic hydrocarbonsPCDD/Fs = polychlorinated dibenzodioxines and polychlorinted dibenzo-
furanesPCDDs = polychlorinated dibenzodioxinesPCDFs = polychlorinated dibenzofuranesPCNs = polychlorinted naphthalenesUNEP = United Nations Environment ProgrammeUNESCO = United Nations Educational, Scientific and Cultural Organiza-
tionWHO = World Health Organization
REFERENCES
1. M. Zore-Armanda and T. Pucher-Petkovi}, Acta Adriat. 18 (1976) 17–27.2. F. Mosetti, Boll. Oceanol. Teor. Appl. 1 (1983) 143–163.3. H. Lacombe and C. Richet, The Regime of the Strait of Gibraltar, in: Hydrodynam-
ics of Enclosed Sea, Elsevier Oceanogr. Ser. 34, 1982, pp. 13–74.4. M. Ovchinikov, Okeanologya 23 (1983) 960–962.5. M. Buljan and M. Zore-Armanda, Mar. Biol. A. Rev. 14 (1976) 11–98.6. S. C. Galaverni, Distribuzione costiera delle acque dolci continentali nel mare
Adriatico (fino alla trasversale Tremiti-Curzola), Rapporto Tecnico No. 44. CNR,Laboratorio per lo Studio della Dinamica delle Grandi Masse, Venezia, 1972.
DDTs AND PCBs IN THE ADRIATIC SEA 179

7. Indagine sulla qualita delle acque del fiume Po, CNR, Istituto di Ricerca sulle Ac-que, Roma, Quademi, 32, 1977, pp. 821–827.
8. J. W. Moore and S. Ramamoorthy, Organic Chemicals in Natural Waters, Sprin-ger-Verlag, New York, 1984.
9. S. Tanabe, N. Kaunan, A. Subramanian, S. Watanabe, and R. Tatsukawa, Envi-ron. Pollut. 47 (1987) 147–163.
10. M. Picer, N. Picer, and B. Nazansky, Pomorski zbornik 16 (1978) 451–505 (inCroatian).
11. N. Picer and M. Picer, Water Res. 26 (1992) 899–909.12. V. U. Fossato, Arch. Oceanogr. Limnol. 17 (1971) 105–123.13. R. K. Pipe, J. A. Coles, M. E. Thomas, V. U. Fossato, and A. L. Pulsford, Aquatic
Toxicol. 32 (1995) 59–73.14. R. J. Fielder and D. Martin, in: B. Ballantyne, T. Marrs, and P. Turner (Eds.),
General and Applied Toxicology, McMillan, London, 1994, Ch. 51, pp. 1133–1147.15. J. H. Dean, J. B. Cornacoff, G. J. Rosenthal, and M. I. Luster, in: A. W. Hayes and
D. A. B. T. Fats (Eds.), Principles and Methods of Toxicology, Raven Press, NewYork, 1994, Ch. 30, pp. 1065–1097.
16. H. Geyer, D. Freitag, and F. Korte, Ecotoxicol. Environ. Saf. 8 (1984) 129–151.17. P. de Voogt, D. E. Wells, L. Reutergardh, and U. A. Th. Brinkman, Int. J. Environ.
Anal. Chem. 40 (1990) 1–46.18. J. Faller, H. Hühnerfuss, W. König, and P. Ludwig, Mar. Pollut. Bull. 22 (1991)
82–85.19. G. Font, J. Manes, J. C. Molto, and Y. Pico, J. Chromatogr. 733 (1996) 49–471.20. I. Mukherjee and M. Gopal, J. Chromatogr. 754 (1996) 33–42.21. W. D. Garett, Limnol. Oceanogr. 10 (1965) 602–605.22. D. R. Green, J. K. Stull, and T. C. Heesen, Mar. Pollut. Bull 17 (1986) 324–329.23. A. T. Bidleman and C. S. Giam, in: J. S. Waids (Ed.), PCBs and the Environment,
CRC Press, Boca Raton, FL, 1986.24. T. C. Sauer and J. G. S. Durrel, Mar. Chem. 27 (1989) 235–247.25. J. I. Gomez-Belinchon, J. O. Grimalt, and J. Albaiges, Environ. Sci. Technol. 22
(1988) 677–682.26. N. Picer and M. Picer, J. Chromatogr. 193 (1980) 357–369.27. G. E. Miladis, Bull. Environ. Contam. Toxicol. 52 (1994) 24–31.28. M. Picer and M. Ahel, J. Chromatogr. 150 (1978) 119–127.29. S. V. Smit, Limnol. Oceanogr. 29 (1984) 1149–1160.30. G. S. Durell and T. C. Sauer, Anal. Chem. 62 (1990) 1867–1874.31. H. J. Stan and S. Heel, Fresenius' Z. Anal. Chem. 339 (1991) 34–39.32. M. Picer and N. Picer, Ocean Sci. Eng. 8 (1983) 63–69.33. K. Booij and C. van der Berg, Bull. Environ. Contam. Toxicol. 53 (1994) 71–79.34. K. Ballschmiter and M. Zell, Fresenius' Z. Anal. Chem. 302 (1980) 20–31.35. J. C. Duinker and M. T. J. Hillebrand, Environ. Sci. Technol. 17 (1983) 449–456.36. J. C. Duinker, D. E. Schulz, and G. Petrick, Anal. Chem. 60 (1988) 478–482.37. N. Kannan, S. Tanabe, R. Tatsukawa, and D. J. H. Phillips, Environ. Pollut. 55
(1989) 65–76.38. N. Kannan, S. Tanabe, T. Wakimoto, and R. Tatsukawa, J. Assoc. Off. Anal.
Chem. 70 (1987) 451–454.39. D. Prats, F. Ruiz, and D. Zarzo, Mar. Pollut. Bull. 24 (1992) 441–446.40. B. Krock, W. Vetter, and B. Luckas, Chemosphere 35 (1997) 1519–1530.
180 M. PICER

41. UNEP, Monitoring Programme of the Eastern Adriatic Coastal Area, Report for1983–1991, MAP Technical Report Series No. 86, Athens, 1994.
42. L. D. Mee, M. Horvat, and J. P. Villeneuve, Data Quality Review for MED POL:Nineteen Years of Progress, IAEA MEL, Monaco, 1993.
43. UNEP/FAO/WHO/IAEA, Assessment of the State of Pollution of the Mediter-ranean Sea by Organohalogen Compounds, MAP Technical Reports Series No. 39,UNEP, Athens, 1990.
44. R. M. Risebrough, R. J. Hugget, J. J. Griffin, and E. D. Goldberg, Science 159
(1968) 1235–1242.45. GESAMP, The Atmospheric Input of Trade Species to the World Ocean. Rep. Stud.
GESAMP, Paris, 1989.46. J. P. Villeneuve, Journ. Etud. Pollut. CIESM 7 (1985) 489–493.47. J. Jan, S. Malner{i}, and I. L. @upan~i}, Arh. Hig. Rada Toksikol. 29 (1978)
133–138.48. N. Picer, Rapp. P.-V. Reun. Com. Int. Explor. Sci. Merr. Mediterr. 30 (2) (1986) 112.49. J. P. Villeneuve and C. Cattini, Chemosphere 15 (1986) 115–120.50. S. Galassi, E. Gosso, and G. Tartari, Chemosphere 27 (1993) 2287–2293.51. UNEP/ECE/UNEDO/FAO/UNESCO/WHO/IAEA, Pollutants from Land-based
Sources in the Mediterranean, UNEP Regional Seas Reports and Studies, No. 32,Paris, 1984.
52. J. F. C. Montanes, R. W. Risebrough, B. W. De Lappe, M. G. Marino, and J. Albai-ges, Mar. Pollut. Bull. 21 (1990) 518–523.
53. M. Picer, Journ. Etud. Pollut. CIESM 6 (1983) 445–448.54. S. Galassi, L. Guzzella, M. Mingazzini, L. Vigano, S. Capri, and S. Sora, Water
Res. 26 (1992) 19–27.55. V. U. Fossato, G. Perin, A. Carniel, L. Craboledda, and F. Dolci, Rapp. P.-V. Reun.
Com. Int. Explor. Sci. Merr. Mediterr. 30 (2) (1986) 111.56. V. U. Fossato, G. Perin, A. Carniel, L. Craboledda, and F. Dolci, Rapp. P.-V. Reun.
Com. Int. Explor. Sci. Merr. Mediterr. 30 (2) (1986) 111.57. V. U. Fossato, G. Perin, A. Carniel, L. Craboledda, and F. Dolci, Arch. Oceanogr.
Limnol. 21 (1987) 59–66.58. A. V. Holden, and K. Marsden, J. Proc. Inst. Sewage Purif. 4 (1966) 295–264.59. G. F. Lowden, C. L. Souders, and R. W. Edwards, Water Treat. Exam. 18 (1969)
275–284.60. J. Lowrence and H. M. Tosine, Bull. Environ. Contam. Toxicol. 17 (1977) 49–56.61. J. E. Portman, Evaluation of the Impact on the Aquatic Environment of Hexachlo-
rocyclohexane (HCH Isomers), Hexachlorobenzene (HCB), DDT + DDE + DDD,Heptachlor (+ Heptachlor Epoxide) and Chlordane, prepared for the Commissionof the European Communities, Environment and Consumer Protection Service,1979.
62. R. Baird, M. Selna, J. Haskins, and D. Chappelle, Water Res. 13 (1979) 493–502.63. K. Terada, J. Water Pollut. Control Fed. 52 (1980) 961–995.64. J. Tarradellas, H. Muntau, and H. Beck, Abundance and Analysis of PCBs in
Sewage Sludges, in: R. Leschber, J. Taradellas and P. L. Hermite (Eds.), Poly-chlorinated Biphenyls (PCB), Determination in Sewage Sludge and Related Sam-ples, Results of an Interlaboratory Comparison, CEC, Concerted action »Treat-ment and use of organic sludge and liquid agricultural wastes (COST 681), 1985.
65. J. Vogelgesang, Z. Wasser Abwasser Forsch. 19 (1986) 140–144.66. M. Marchand, J. C. Caprais, and P. Pignet, Mar. Environ. Res. 25 (1988) 131–159.
DDTs AND PCBs IN THE ADRIATIC SEA 181

67. C. A. Edwards, Persistent Pesticides in the Environment, 2nd ed., CRC Press,Cleveland, 1975.
68. C. R. Olsen, N. H. Cutshall, and I. L. Larsen, Mar. Chem. 11 (1982) 501–533.69. R. F. Bopp, Ph.D. Thesis, Columbia University, New York, 1979.70. N. Picer, M. Picer, and P. Strohal, Water Air Soil Pollut. 8 (1976) 429–440.71. M. Picer, N. Picer, and P. Strohal, Sci. Total Environ. 8 (1977) 159–164.72. M. Picer, N. Picer, F. Kr{ini}, and V. Sipos, Bull. Environ. Contam. Toxicol. 21
(1979) 743–748.73. J. Salihoglu, J. Faganeli, and J. Stirn, Rev. Int. Oceanogr. Med. 58 (1980) 3–9.74. D. L. Elder, J. P. Villeneuve, P. Parsi, and G. R. Harvey, Polychlorinated Biphenyls
in Seawater, Sediment and Over-ocean Air of the Mediterranean, in: Activities ofthe International Laboratory of Marine Radioactivity, Report IAEA, Monaco,1976, pp. 136–174.
75. K. A. Burns, J. P. Villeneuve, and S. W. Fowler, Estuar. Coast. Shelf Sci. 20 (1985)313–330.
76. N. Picer, Ph.D. Thesis, Ru|er Bo{kovi} Institute, Zagreb, 1989 (in Croatian).77. S. Tanabe and R. Tatsukawa, J. Oceanogr. Soc. Jpn. 39 (1983) 53–62.78. K. A. Burns and J. P. Villeneuve, Geochim. Cosmochim. Acta 47 (1983) 995–1006.79. V. U. Fossato and L. Craboleda, Journ. Etud. Pollut. CIESM 5 (1981) 169–174.80. C. Nasci, and V. U. Fossato, Studio sulla fisiologia dei mitili e sulla loro capacita
di accumulare idrocarburi e idrocarburi clorurati, Atti della Societa Toscana diScienze Naturali, Memories, ser. B, no. 86, 1979, suppl., pp. 216–218.
81. N. Kannan, S. Tanabe, R. Tatsukawa, and D. J. H. Phillips, Environ. Pollut. 55
(1989) 65–76.82. A. J. Niimi, Sci. Total Environ. 192 (1996) 123–150.83. M. Picer and N. Picer, Water Res. 29 (1995) 2707–2719.84. D. J. H. Phillips and P. S. Rainbow, Mar. Ecol. Prog. Ser. 49 (1988) 83–93.85. D. L. Elder, Mar. Pollut. Bull. 7 (1976) 63–64.86. D. Chabert and N. Vicente, Journ. Etud. Pollut. CIESM 5 (1981) 323–334.87. M. Marchand, J. C. Caprais, and P. Pignet, Hydrocarbures et hydrocarbures halo-
gens dans les eaux marines citieres de la Mediterranee occidentale (France), »In-tersite 2« (Septembre 1984) IFREMER, Centre de Brest, DERO/EL, Mai 1985.
88. J. L. Monod and A. Arnoux, Journ. Etud. Pollut. CIESM 4 (1979) 147–148.89. J .P. Villeneuve, D. L. Elder, and R. Fukai, Journ. Etud. Pollut. CIESM 5 (1981)
251–256.90. V. Leoni, G. Puccetti, R. J. Colombo, and A. M. Davidio, J. Chromatogr. 125 (1976)
399–407.91. G. Pucceti and V. Leoni, Mar. Pollut. Bull. 11 (1980) 22–25.92. K. Fytianos, G. Vasilikiotis, and L. Weil, Bull. Environ. Contam. Toxicol. 34
(1985) 390–395.93. M. Picer, N. Picer, and B. Nazansky, Thalassia Jugosl. 17 (1981) 225–236.94. V. U. Fossato, C. Nasci, and L. Craboledda, Idrocarburi clorurati nell'acqua, nel
materiale sospeso e nello zooplancton dell'area antistante it Delta del Po, Estrattodagli Atti del Convegno delle Unita Operative Afferenti ai Sottoprogetti RisorseBiologische e Inguinamento Marino, Roma, 10–11 Novembre 1981, Arti GraficheE. Cossidente and F. Ili, Roma, 1982, pp. 829–841.
95. V. U. Fossato, Journ. Etud. Pollut. CIESM 6 (1983) 465–468.96. V. U. Fossato and F. Dolci, Rapp. P.-V. Reun. Com. Int. Explor. Sci. Merr. Mediterr.
29 (1984) 97–98.
182 M. PICER

97. V. U. Fossato, G. Perin, A. Carniel, L. Craboledda, and F. Dolci, Rapp. P.-V. Reun.Com. Int. Explor. Sci. Merr. Mediterr. 30(2) (1986) 111.
98. V. U. Fossato, C. Nasci, and L. Craboledda, Bollettino Oceanol. Teor. Appl. NS
(1989) 217–223.99. N. Picer and M. Picer, Journ. Etud. Pollut. CIESM 4 (1979) 133–136.
100. R. W. Risebrough, B. W. De Lappe, and T. T. Schmidt, Mar. Pollut. Bull. 7 (1976)225–228.
101. K. Larsson, G. Odham, and A. Sodergren, Mar. Chem. 2 (1974) 49–57.102. J. Dachs, J. M. Bayona, and J. Albaiges, Mar. Chem. 57 (1997) 313–324.103. D. E. Schulzbull, G. Petrick, H. Johannsen, and J. C. Duinker, Croat. Chem. Acta
70 (1997) 309–321.104. B. Larsen and A. Jensen, Mar. Pollut. Bull. 20 (1989) 556–560.105. J. Y. Cousteau, Journ. Etud. Pollut. CIESM 4 (1979) 21–31.106. A. Arnoux, D. Bellan-Santini, J. L. Monod, and J. Tatossian, Journ. Etud. Pollut.
CIESM 5 (1981) 423–432.107. E. A. Arnoux, J. L. Monod, J. Tatossian, A. Blanc, and F. Oppetit, Journ. Etud.
Pollut. CIESM 5 (1981) 447–457.108. A. Arnoux, A. Blanc, A. Jurajuria, J. L. Monod, and J. Tatassian, Journ. Etud.
Pollut. CIESM 5 (1981) 459–470.109. A. Arnoux, J. Tatossian, J. L. Monod, and A. Blanc, Journ. Etud. Pollut. CIESM.
5 (1981) 471–482.110. J. Badia and J. A. Garcia, Journ. Etud. Pollut. CIESM 4 (1979) 75–81.111. M. Marchand, D. Vas, and E. K. Duursma, Mar. Pollut. Bull. 7 (1976) 65–69.112. V. Amico, R. Chillemi, G. Impellizzeri, G. Oriente, M. Piatelli, S. Sciuto, and T.
Tringali, Sci. Total Environ. 24 (1982) 91–99.113. F. Baldi, R. Bargagli, S. Focardi and C. Fossi, Mar. Pollut. Bull. 14 (1983)
108–111.114. R. N. Dexter and S. P. Pavlou, Mar. Pollut. Bull. 4 (1973) 188–190.115. Z. Balkas, I. Salihoglu, G. Tuncel, S. Tugrul, and G. Ramelow, Journ. Etud.
Pollut. CIESM 4 (1979) 159–163.116. O. Bastyrk, M. Dogan, I. Salihoglu, and T. I. Balkas, Mar. Pollut. Bull. 11 (1980)
191–195.117. R. Donazzolo, A. A. Orio, L. M. Vitturi, and B. Pavoni, Environ. Technol. Lett. 4
(1982) 451–462.118. M. Picer and N. Picer, Environ. Contam. Toxicol. 47 (1991) 864–873.119. M. Picer and N. Picer, Water Air Soil Pollut. 68 (1993) 435–447.120. M. Picer, Rapp. P.-V. Reun. Com. Int. Explor. Sci. Merr. Mediterr. 31 (1988) 150.121. M. Picer, Analysis of the PCBs in the Aquatic Sediment and Biota of the Zadar,
Vransko Lake, [ibenik and Dubrovnik Coastal Waters, Regarding Oil Spill Pollu-tion from Transformers Struck by Rockets during the Recent War, Project Report,Ru|er Bo{kovi} Institute, Center for Marine Research, Zagreb, 1998 (in Croa-tian).
122. J. Dujmov, P. Su~evi}, and D. Ba`uli}, Rapp. P.-V. Reun. Com. Int. Explor. Sci.Merr. Mediterr. 32 (1990) 121.
123. B. Pavoni, C. Calvo, A. Sfriso, and A. A. Orio, Sci. Total Environ. 91 (1990) 13–21.124. S. Raccanelli, B. Pavoni, A. Marcomini, and A. A. Orio, Sci. Total Environ. 79
(1989) 111–123.125. B. Pavoni, A. Sfriso, and A. Marcomini, Mar. Chem. 21 (1987) 25–35.
DDTs AND PCBs IN THE ADRIATIC SEA 183

126. E. S. Van Vleet, V. U. Fossato, M. R. Sherwin, H. B. Lovet, and F. Dolci, Adv. Org.Geochem. 13 (1988) 757–763.
127. C. Calvo, M. Grasso, and G. Gardenghil, Mar. Pollut. Bull. 22 (1991) 543–547.128. E. Fattore, E. Benfenati, G. Mariani, E. Cools, G. Vezzoli, and R. Fanelli, Water
Air Soil Pollut. 99 (1997) 237–244.129. I. Tolosa, J. M. Bayona, and J. Albaiges, Environ. Sci. Technol. 29 (1995)
2519–2527.130. D. L. Elder and S. W. Fowler, Science 197 (1977) 459–461.131. S. W. Fowler and D. L. Elder, Bull. Environ. Contam. Toxicol. 19 (1978) 244–248.132. S. W. Fowler and D. L. Elder, Mar. Environ. Res. 4 (1980) 87–96.133. O. Cattani, M. G. Corni, G. Crisetig, and G. P. Serrazanetti, Journ. Etud. Pollut.
CIESM 5 (1981) 353–359.134. C. Alzieu, V. Thiband, and P. Michel, Resultats des travaux de I'ISTPM en matiese
de surveillance des micropollutants dans le matiere vivante, Institut Scientifiqueet Technique des Peches Maritimes, I.P.M. 3 Pollutions, 22 janvier 1979.
135. V. Amico, G. Impellizzeri, G. Oriente, M. Piatelli, S. Sciuto, and C. Tringali, Mar.Pollut. Bull. 10 (1979) 282–284.
136. J. Stirn, A. Avcin, J. Cencelj, M. Dorer, S. Gomiscek, S. Kveder, A. Malej, D.Meischner, I. Nozina, J. Paul, and P. Tusnik, Rev. Int. Oceanogr. Med. 35/36
(1974)21–78.137. G. Campesan, V. U. Fossato, and G. Stocco, 1989, unpublished data.138. G. Campesan, V. U. Fossato, and G. Stocco, Bollettino Oceanol. Teor. Appl. NS
(1989) 225–232.139. K. A. Burns and J. L. Smith, Estuar. Coast. Shelf Sci. 13 (1981) 433–443.140. B. W. Tripp, J. W. Farrington, E. D. Goldberg, and J. Sericano, Mar. Pollut. Bull.
24 (1992) 371–373.141. C. Nasci and V. U. Fossato, Environ. Technol. Letts. 3 (1982) 273–280.142. B.W. de Lappe, R. W. Risebrough, J. T. Mendola, G. W. Bowes, and J. L. Monod,
Journ. Etud. Pollut. CIESM 2 (1973) 43–45.143. J. M. F. Soler, Journ. Etud. Pollut. CIESM 2 (1973) 55–57.144. V. Contardi, R. Capelli, T. Pellacani, and G. Zanicchi, Mar. Pollut. Bull. 10 (1979)
307–311.145. V. Contardi, G. Zanicchi, D. Mazzone, and B. M. Cosma, Journ. Etud. Pollut.
CIESM 5 (1981) 335–340.146. A. Bolognari, R. Ferro, V. U. Fossato, M. Piatelli, A. Renzoni, and R. Viviani,
Journ. Etud. Pollut. CIESM 4 (1979) 667- 669.147. R. Ferro, Capelli, and V. Contardi, Relazione sull 'ativita svolta nel monitoraggio
dei metalli pesanti e degli idrocarburi clorurati in organismi del mar Ligure,Convegno scientifico nazionale P.F. oceanografia e fondi marini, Roma, 5–7Marzo, 1979, pp. 855–862.
148. A. Ballester, J. Sanchez-Pardo, J. A. Garcia-Requeiro, X. Modamio, and A. Julia,Thalassia Jugosl. 18 (1982) 393–409.
149. S. Focardi, S. E. Bacci, C. Leonzio, and G. Crisetig, Thalassia Jugosl. 20 (1984)37–43.
150. S. D. Kilikidis, J. E. Psomas, A. P. Kamarianos, and A. G. Panetsos, Journ. Etud.Pollut. CIESM 5 (1981) 301–306.
151. V. U. Fossato and L. Craboleda, Journ. Etud. Pollut. CIESM 5 (1981) 169–174.152. M. Picer, N. Picer, and M. Ahel, Pestic. Monit. J. 12 (1978) 102–112.
184 M. PICER

153. C. Froglia, E. Arneri, J. Dujmov, S. Juki}, P. Su~evi}, and M. Tonkovi}, Rapp. P.-V.Reun. Com. Int. Explor. Sci. Merr. Mediterr. 33 (1992) 173.
154. J. L. Sericano, T. L. Wade, A. M. El-Husseini, and J. M. Brooks, Mar. Pollut. Bull.24 (1992) 537–543.
155. J. Dujmov, T. Vu~eti}, M. Picer, and N. Picer, Journ. Etud. Pollut. CIESM 4 (1979)137–142.
156. D. Vili~i}, N. Picer, M. Picer, and B. Nazansky, Journ. Etud. Pollut. CIESM 4
(1979) 143–146.157. J. Satsmadjis and G. P. Gabrielides, Mar. Pollut. Bull. 10 (1979) 109–111.158. Taliadouri, F. Voutsinou, and J. Satsmadjis, Mar. Pollut. Bull. 13 (1982) 266–269.159. R. Ravid, J. B. Voser, and H. Horning, Mar. Pollut. Bull. 16 (1985) 35–38.160. R. Viviani, G. Crisetig, V. Petruzzi, and P. Cortesi, Residui di pesticidi clorurati e
di bifenili policlorurati nei clupeiformi Adriatici, Atti del 5o colloquiointernazionale di oceanografia medica, Messina, 1973, pp. 607–621.
161. R. Viviani, G. Crisetig, P. Cortesi, and E. Corpene, Rev. Int. Oceanogr. Med. 35/36
(1974) 70–89.162. G. Crisetig, P. Cortesi, and E. Carpene, La Nova Veterinaria 49 (1973) 144–149.163. N. Revelante and M. Gilmartin, Invest. Pesq. 39 (1975) 491–507.164. R. Viviani, A. R. Borgatti, D. Cancellieri, G. Crisetig, and P. Cortesi, Atti della
Societa Italiana di Scienze Veterinarie, 23 (1969) 299–303.165. R. Kljaji}, R. I. Elezovi}, V. Vojnovi}, S. Vitorovi}, and ^. Gojni}, Proceedings of
the Symposium: State, Protection and Development of Man Environment,Belgrade, 1976, pp. 125–134 (in Serbian).
166. G. Bressa, E. Sisti, and F. Cima, Mar. Chem. 58 (1997) 261–266.167. D. Pastor, J. Boix, V. Fernandez, and J. Albaiges, Mar. Pollut. Bull. 32 (1996)
257–262.168. K. Kannan, J. Falandysz, N. Yamashita, S. Tanabe, and R. Tatsukawa, Mar.
Pollut. Bull. 24 (1992) 358–363.169. K. Kannan, S. Tanabe, and R. Tatsukawa, Environ. Sci. Technol. 29 (1995) 2673–
2683.170. A. Renzoni, S. Focardi, C. Leonzio, C. Fossi, and A. M. Demartis, Thalassia
Jugosl. 18 (1982) 245–252.171. M. Fasola, P. A. Movalli, and C. Gandini, Arch. Environ. Contam. Toxicol. 34
(1998) 87–93.172. N. Picer and M. Picer, Sci. Total Environ. 57 (1986) 39–47.173. A. Aguilar and A. Borrell, Sci. Total. Environ. 154 (1994) 237–247.174. N. Cardellicchio, Bull. Environ. Contam. Toxicol. 55 (1995) 682–688.175. L. Marsili, C. Casini, L. Marini, A. Regoli, and S. Focardi, Mar. Ecol. Prog. Ser.
151 (1997) 273–282.176. S. Corsolini, S. Focardi, K. Kannan, S. Tanabe, A. Borrell, and R. Tatsukawa,
Mar. Environ. Res. 40 (1995) 33–53.177. B. Kurelec, M. Proti}, M. Rijavec, S. Britvi}, W. E. G. Mueller, and R. K. Zahn,
Induction of Benzo�a�pyrene Monooxygenase in Fish after i.p. Application of WaterHexane Extract – a Prescreen Tool for Detection of Xenobiotics, EPA–600/9–82–013,U.S. EPA. Gulf Breeze, Florida, 1982, pp. 124–136.
178. S. Britvi} and B. Kurelec, Comp. Biochem. Physiol. 85C (1986) 111–114.179. D. R. Livingstone, P. Lemaire, A. Matthews, L. D. Peters, C. Porte, P. J.
Fitzpatrick, L. Forlin, C. Nasci, V.U. Fossato, N. Wootton, and P. Goldfarb, Mar.Environ. Res. 39 (1995) 235–240.
DDTs AND PCBs IN THE ADRIATIC SEA 185

180. R. K. Pipe, J. A. Coles, M. E. Thomas, V. U. Fossato, and A. L. Pulsford, AquaticToxicol. 32 (1995) 59–73.
181. L. Vigano, A. Arillo, F. Melodia, P. Arlati, and C. Monti, Environ. Toxicol. Chem.17 (1998) 404–411.
182. WHO, Principles for the Safety Assessment of Food Additives and Contaminantsin Food, Environmental health criteria-70, WHO, Geneva, 1987.
183. IARC, Overall Evaluations of Carcinogenicity, an updating of IARC monographs,Volumes 1–42. Supplement 7, WHO/IARC, Geneva, 1987.
184. WHO, Potentially Toxic Microorganic Substances in Drinking Water, EUR/ICP/CWS 013, Geneva, 1987.
185. L. T. Baldassarri, A. B. Didomenico, A. R. Fulgenzi, N. Iacovella, and C. Larocca,Microchem. J. 51 (1995) 191–197.
186. I. R. Danse, R. J. Jaeger, R. Kava, M. Kroger, W. M. London, F. C. Lu, R. P. Mai-ckel, J. J. Mcketta, G. W. Newell, S. Shindell, F. J. Stare, and E. M. Whelan, Eco-toxicol. Environ. Saf. 38 (1997) 71–84.
SA TA
PCB i DDT adrans r
Mladen Picer
Dan je pregled razvoja analize DDT i PCB u moru, uklju~uju}i obradbu uzoraka,~i{}enje, identifikaciju i kvantitativno odre|ivanje plinskom kromatografijom. Autorje, s naglaskom na probleme vezane uz morske ekosustave, detaljnije raspravljao opouzdanosti objavljenih podataka o razinama istra`ivanih zaga|ivala u Jadranu.
Sudbina kloriranih ugljikovodika u morskom ekosustavu diskutirana je s obzi-rom na vezanje ovih spojeva na ~estice i dinamiku u ekosustavu obalnog mora. Na-dalje je diskutirano hidrofobno vezivanje zaga|ivala s povr{inama te njihova ugrad-nja, agregacija i kru`enje u morskom ekosustavu. Prikazane su razine koncentracijeDDT i PCB u zraku, ki{nici, vodi, sedimentima, planktonu, {koljka{ima, rakovima idrugim morskim organizmima, uklju~uju}i morske ptice i sisavce Jadrana, te u us-poredbi s razinama tih spojeva u Mediteranu. Uglavnom se vide tendencije smanje-nja (osobito DDT), ali i nadalje postoje odre|eni lokalni izvori zaga|ivanja tim spoje-vima. Autor je prikazao neke radove o kori{tenju biomarkera kao pogodnih biolo{kihindikatora za ocjenu rizika od kloriranih spojeva, kao i drugih organskih mikroza-ga|ivala u Jadranu. Opisana su istra`ivanja rizika unosa PCB i DDT iz mora u kri-ti~ne grupe stanovni{tva konzumacijom plodova mora zaga|enih tim spojevima.
186 M. PICER