English Language Proficiency Indicator - The … does “Progress” mean Lessons from NCLB: -...
26
English Language Proficiency Indicator Delia Pompa & Brenda Calderon
Transcript of English Language Proficiency Indicator - The … does “Progress” mean Lessons from NCLB: -...
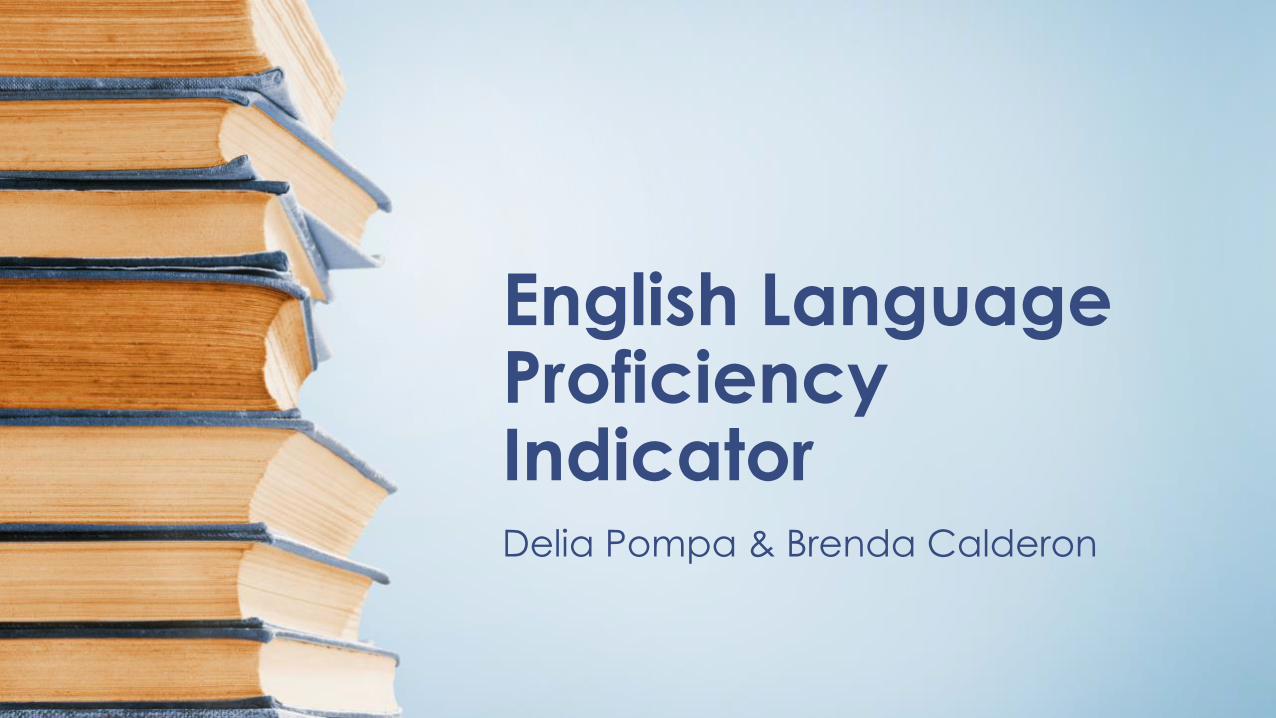
English Language Proficiency Indicator Delia Pompa & Brenda Calderon
Agenda
• Facts about ELs
• EL definitions
• Requirements under ESSA
• How are ELs identified and reclassified?
• Examples
• Considerations for indicator
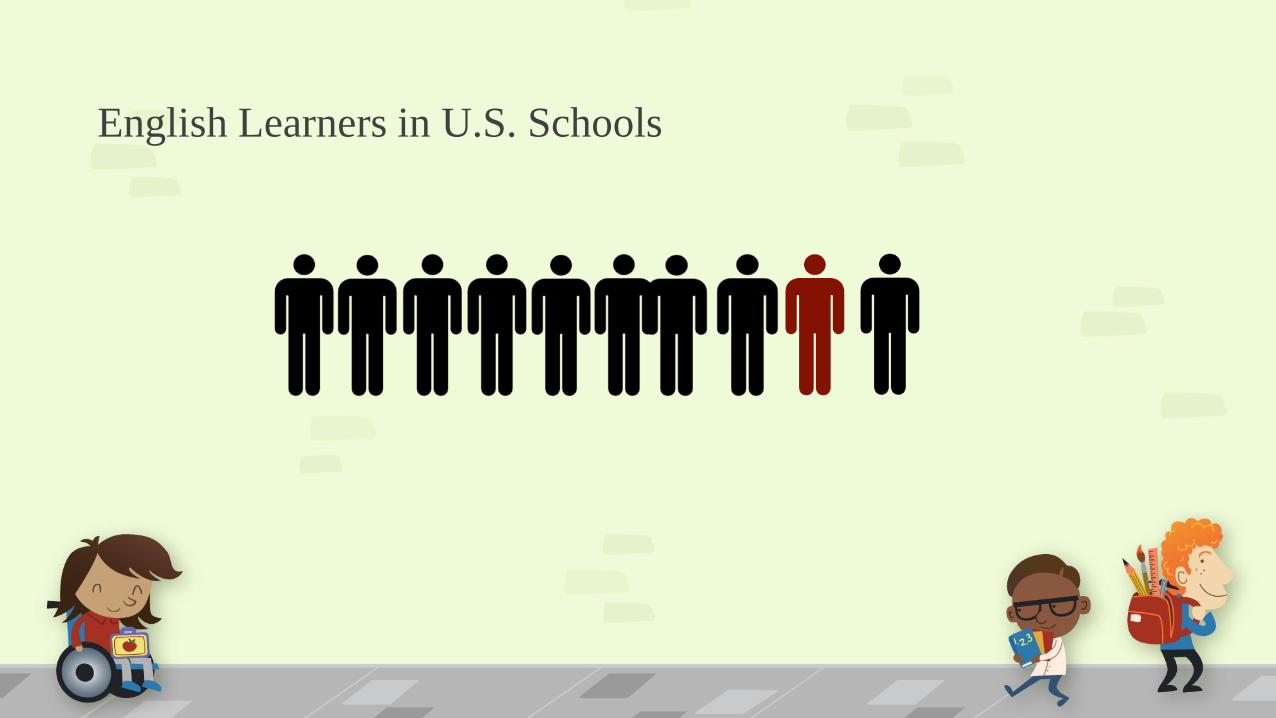
English Learners in U.S. Schools
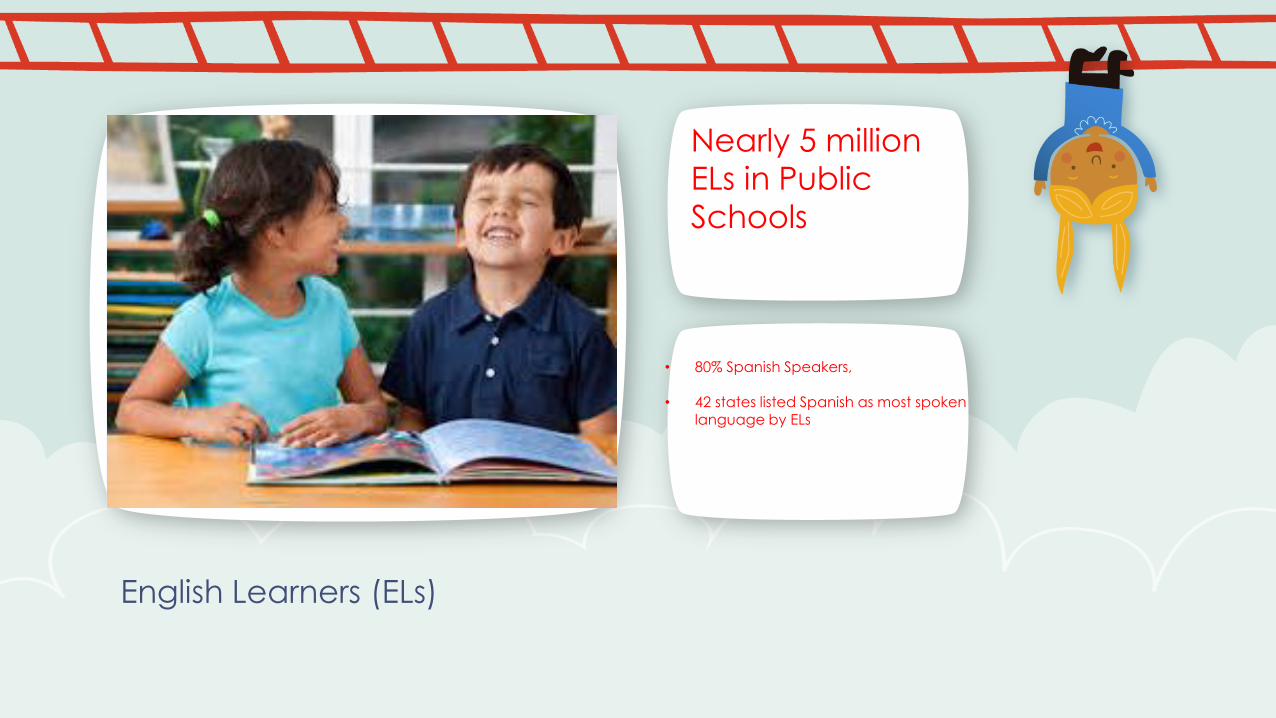
English Learners (ELs)
Nearly 5 million ELs in Public
Schools
• 80% Spanish Speakers,
• 42 states listed Spanish as most spoken language by ELs
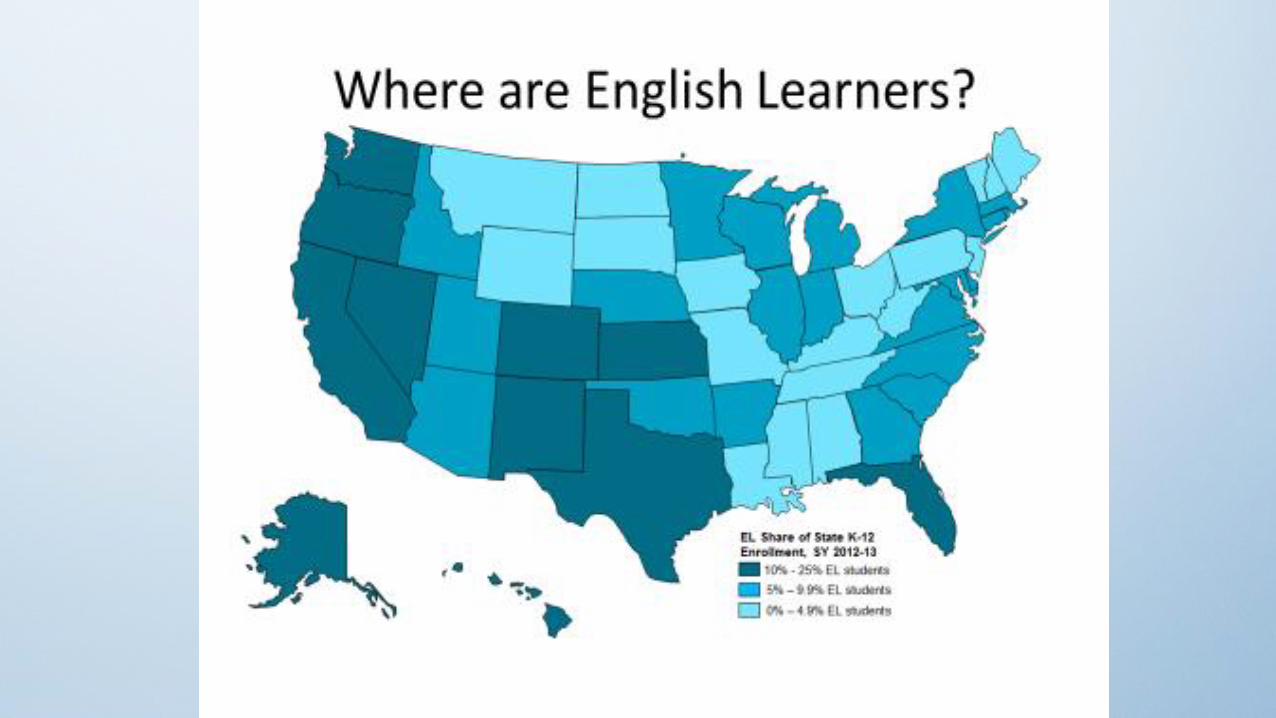
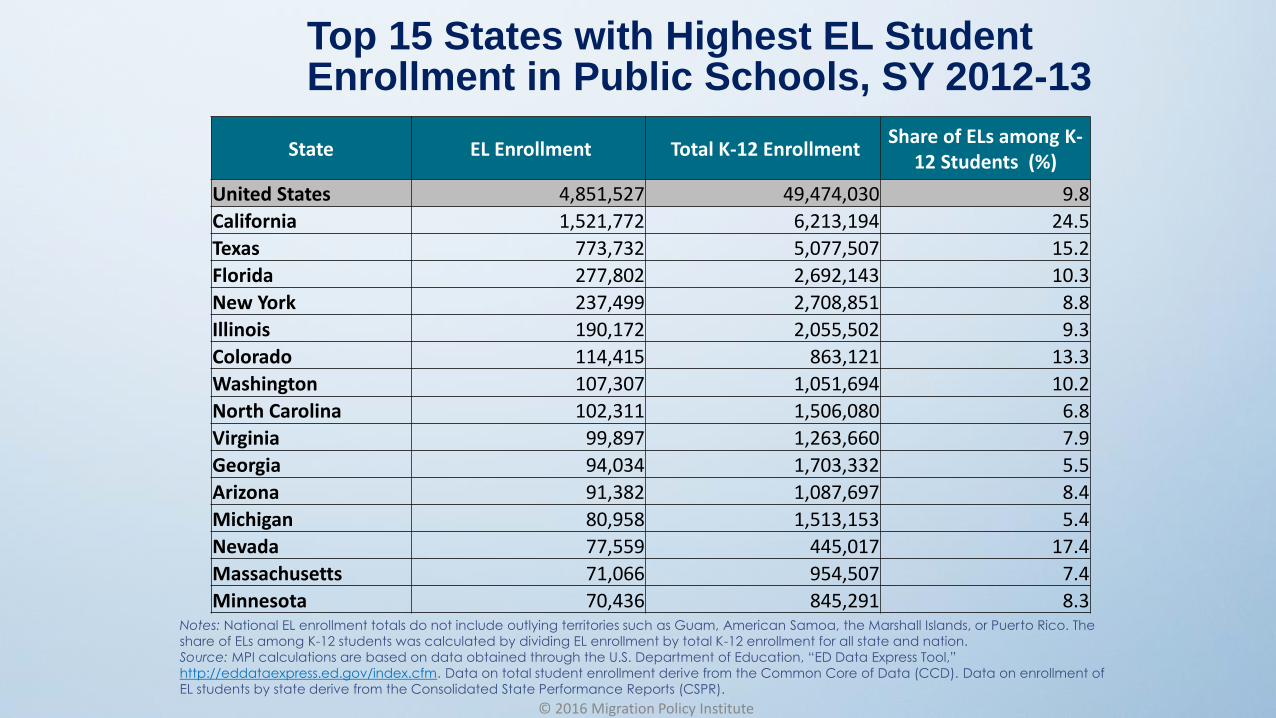
Top 15 States with Highest EL Student Enrollment in Public Schools, SY 2012-13
© 2016 Migration Policy Institute
State EL Enrollment Total K-12 Enrollment Share of ELs among K-
12 Students (%)
United States 4,851,527 49,474,030 9.8
California 1,521,772 6,213,194 24.5
Texas 773,732 5,077,507 15.2
Florida 277,802 2,692,143 10.3
New York 237,499 2,708,851 8.8
Illinois 190,172 2,055,502 9.3
Colorado 114,415 863,121 13.3
Washington 107,307 1,051,694 10.2
North Carolina 102,311 1,506,080 6.8
Virginia 99,897 1,263,660 7.9
Georgia 94,034 1,703,332 5.5
Arizona 91,382 1,087,697 8.4
Michigan 80,958 1,513,153 5.4
Nevada 77,559 445,017 17.4
Massachusetts 71,066 954,507 7.4
Minnesota 70,436 845,291 8.3Notes: National EL enrollment totals do not include outlying territories such as Guam, American Samoa, the Marshall Islands, or Puerto Rico. The
share of ELs among K-12 students was calculated by dividing EL enrollment by total K-12 enrollment for all state and nation.
Source: MPI calculations are based on data obtained through the U.S. Department of Education, “ED Data Express Tool,”
http://eddataexpress.ed.gov/index.cfm. Data on total student enrollment derive from the Common Core of Data (CCD). Data on enrollment of
EL students by state derive from the Consolidated State Performance Reports (CSPR).
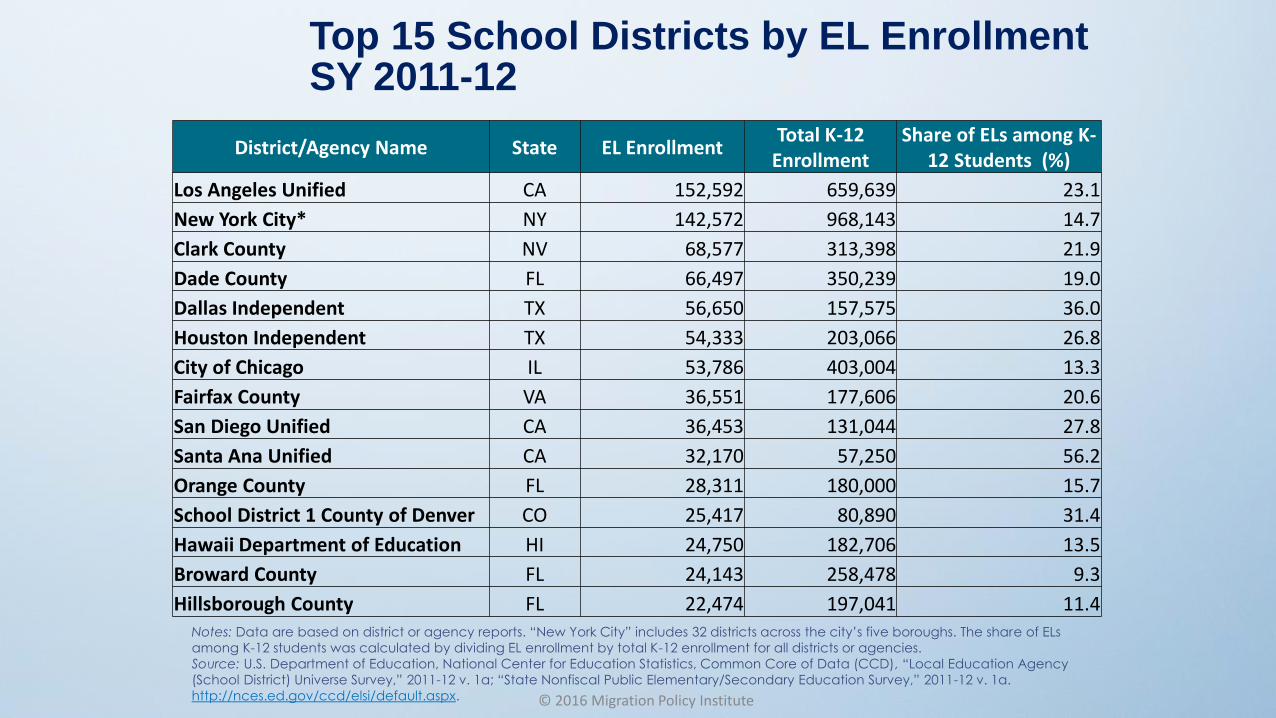
Top 15 School Districts by EL EnrollmentSY 2011-12
© 2016 Migration Policy Institute
Notes: Data are based on district or agency reports. “New York City” includes 32 districts across the city’s five boroughs. The share of ELs
among K-12 students was calculated by dividing EL enrollment by total K-12 enrollment for all districts or agencies.
Source: U.S. Department of Education, National Center for Education Statistics, Common Core of Data (CCD), “Local Education Agency
(School District) Universe Survey,” 2011-12 v. 1a; “State Nonfiscal Public Elementary/Secondary Education Survey,” 2011-12 v. 1a.
http://nces.ed.gov/ccd/elsi/default.aspx.
District/Agency Name State EL EnrollmentTotal K-12
Enrollment Share of ELs among K-
12 Students (%)
Los Angeles Unified CA 152,592 659,639 23.1
New York City* NY 142,572 968,143 14.7
Clark County NV 68,577 313,398 21.9
Dade County FL 66,497 350,239 19.0
Dallas Independent TX 56,650 157,575 36.0
Houston Independent TX 54,333 203,066 26.8
City of Chicago IL 53,786 403,004 13.3
Fairfax County VA 36,551 177,606 20.6
San Diego Unified CA 36,453 131,044 27.8
Santa Ana Unified CA 32,170 57,250 56.2
Orange County FL 28,311 180,000 15.7
School District 1 County of Denver CO 25,417 80,890 31.4
Hawaii Department of Education HI 24,750 182,706 13.5
Broward County FL 24,143 258,478 9.3
Hillsborough County FL 22,474 197,041 11.4
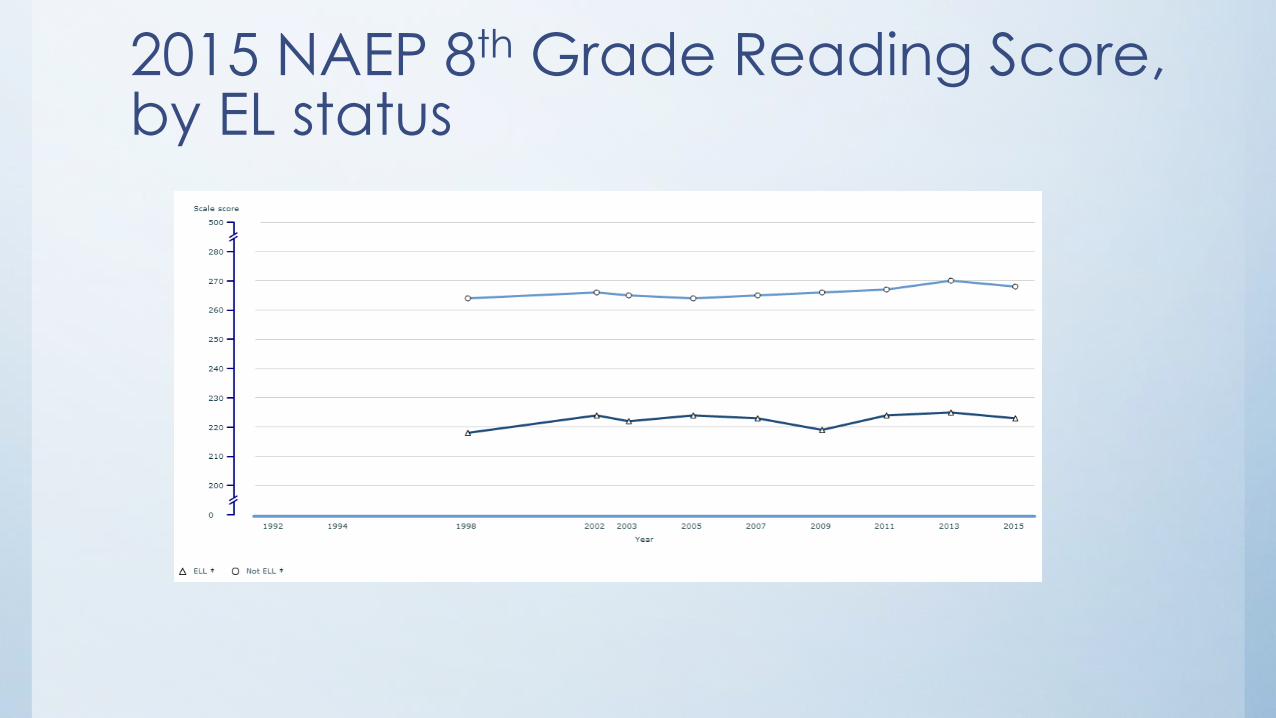
2015 NAEP 8th Grade Reading Score, by EL status
EL Terminology
• English Learner
• English language proficiency
• English language proficiency assessment
• Long term English learners
• Newcomers
• Students with interrupted formal education (SIFE or SLIFE)
• Reclassification
Tools for Identifying and Reclassifying ELs
• Home Language Surveys
• EL Classification- Screener/ Placement test (can be an ELP test or another test)
• Annual English proficiency assessments
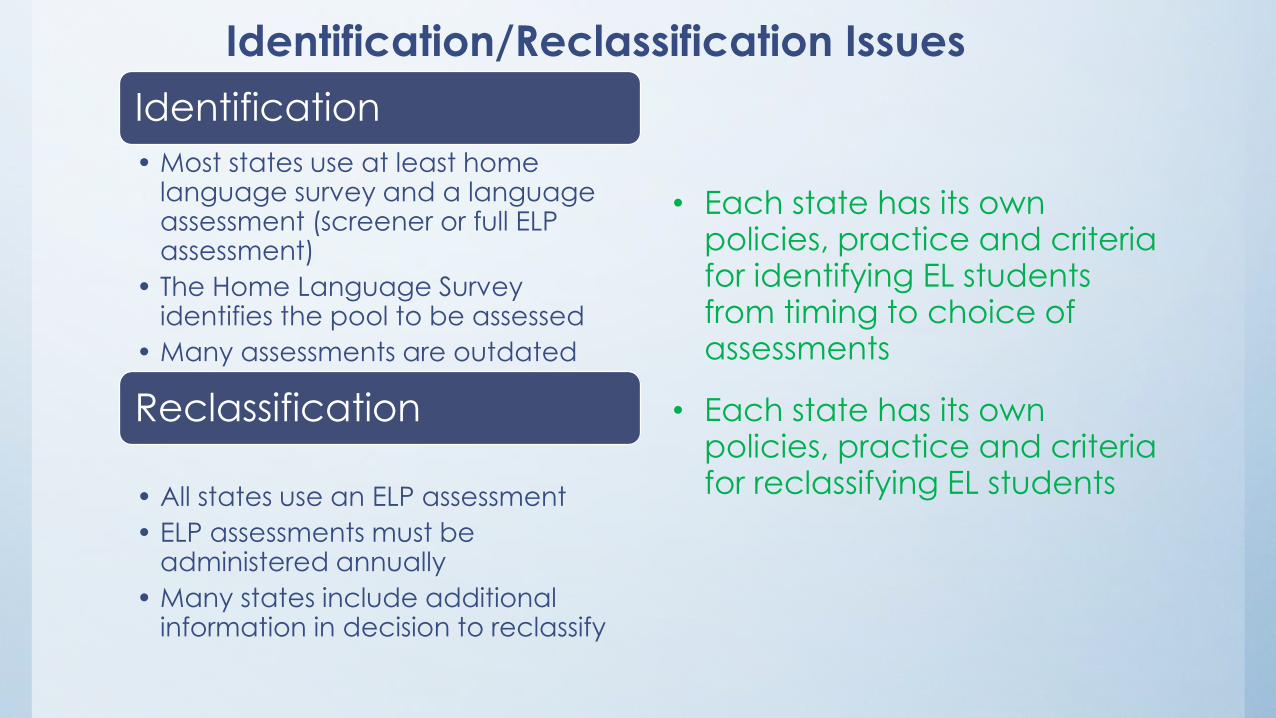
Identification/Reclassification Issues
Identification
• Most states use at least home language survey and a language assessment (screener or full ELP assessment)
• The Home Language Survey identifies the pool to be assessed
• Many assessments are outdated
Reclassification
• All states use an ELP assessment
• ELP assessments must be administered annually
• Many states include additional information in decision to reclassify
• Each state has its own policies, practice and criteria for identifying EL students from timing to choice of assessments
• Each state has its own policies, practice and criteria for reclassifying EL students
EL Accountability Requirements in ESSA
• States must set goals for increases in the percentage of students making progress in achieving EL proficiency defined by the state and measured by the ELP exam, within a state determined timeline
• Former ELs may be included in EL subgroup up to four years after they exit
• States have three options for including EL newcomers in accountability system
Reporting Requirements
• The number and percentage of ELs meeting standards including 4 years after no longer receiving Title III services, disaggregated by ELs with a disability
• The number and percentage of ELs that have not reached proficiency within 5 years
ELP Indicator
• (iv) … progress in achieving English Language Proficiency, as defined by the state and measured by the [ELP exam], within a state determined timeline for all English learners.
*Does not need to be measured annually or be disaggregated*
*Must be in the indicators that “weigh more heavily”
What does “Progress” mean
Lessons from NCLB:
- Moving one level on ELP assessment
- Proficiency in 1 or more domain: reading, writing, listening or speaking
- Differentiated targets: students years in program, grade level or previous proficiency level
- “consecutive cross sections” progress one years class to the next on ELP
- Below proficient to proficient level
*Depending on what states use, targets will be easier/ harder to miss
English proficiency inclusion in state accountability systems
• 35 states use WIDA assessment; 10 states use ELPA 21assessment
• Other states, including California, Florida, New York and Texas, use
other ELP assessments
• Proportion of ELs in states range from 24.5% in California to .08 in
West Virginia
• Current English proficiency assessments are not aligned to most
updated standards (implementation issue)
States must have standardized EL entry/exit procedures
• How will “procedures” be interpreted? Does standardization apply
to cut scores? Selection of assessment instruments?
• Approximately 15 states allow districts to choose which screeners
and assessments they will use (including Texas and California)
• Many states allow for parent or teacher input
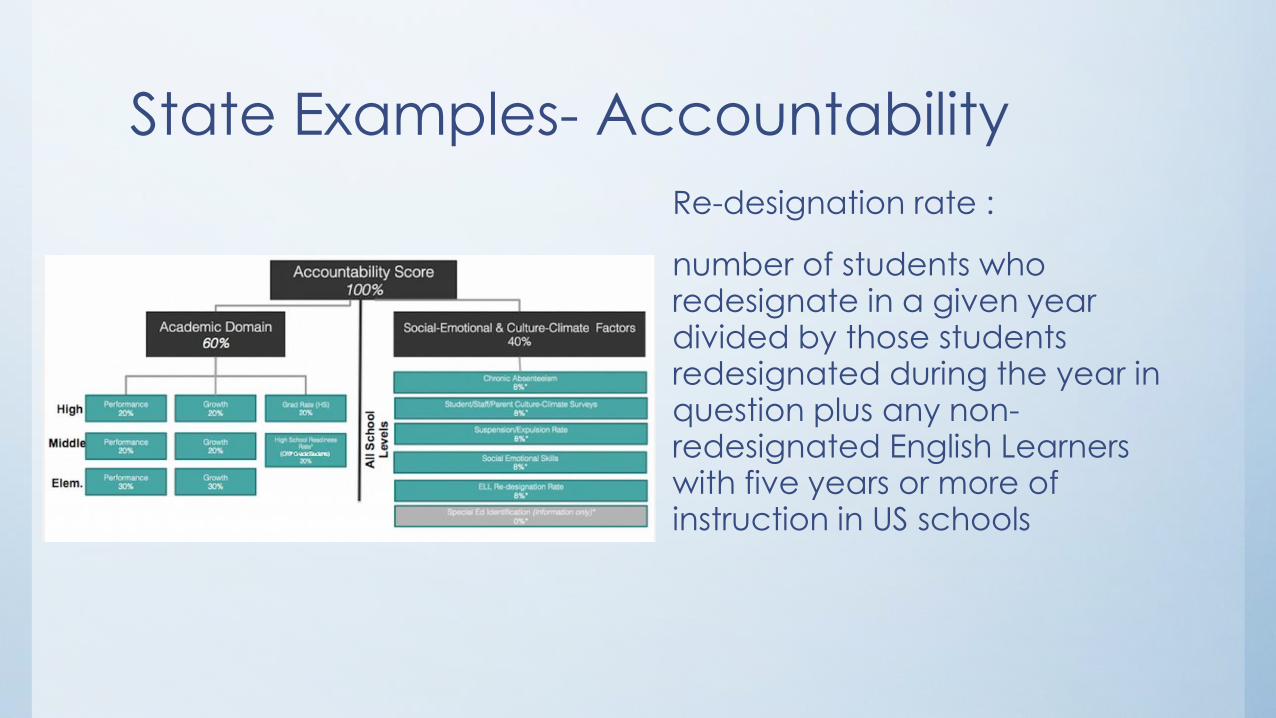
State Examples- Accountability
Re-designation rate :
number of students who redesignate in a given year divided by those students redesignated during the year in question plus any non-redesignated English Learners with five years or more of instruction in US schools
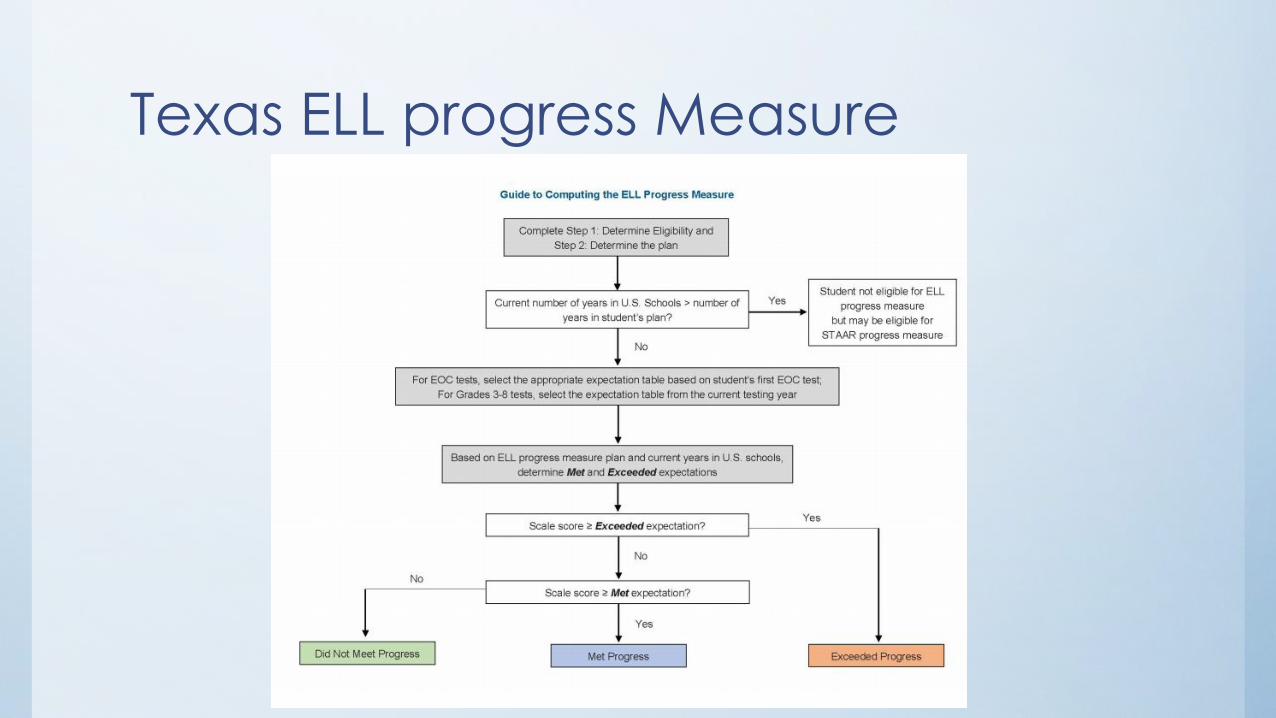
Texas ELL progress Measure
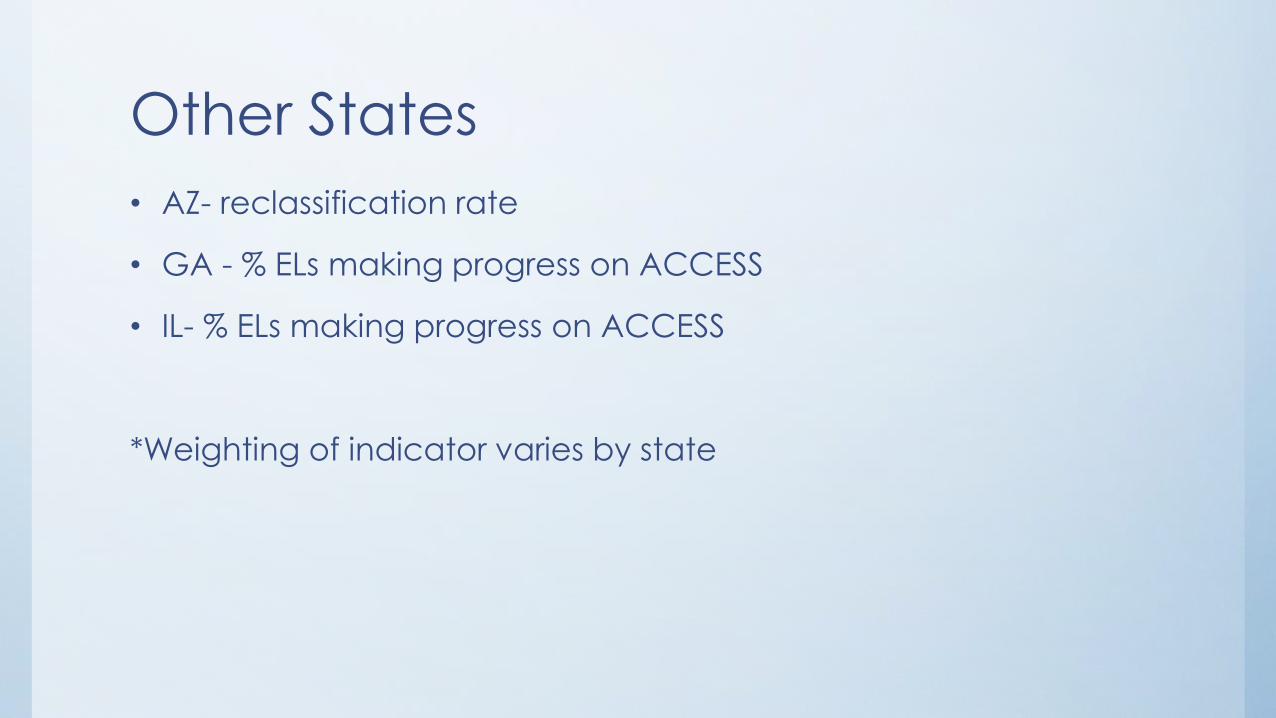
Other States
• AZ- reclassification rate
• GA - % ELs making progress on ACCESS
• IL- % ELs making progress on ACCESS
*Weighting of indicator varies by state
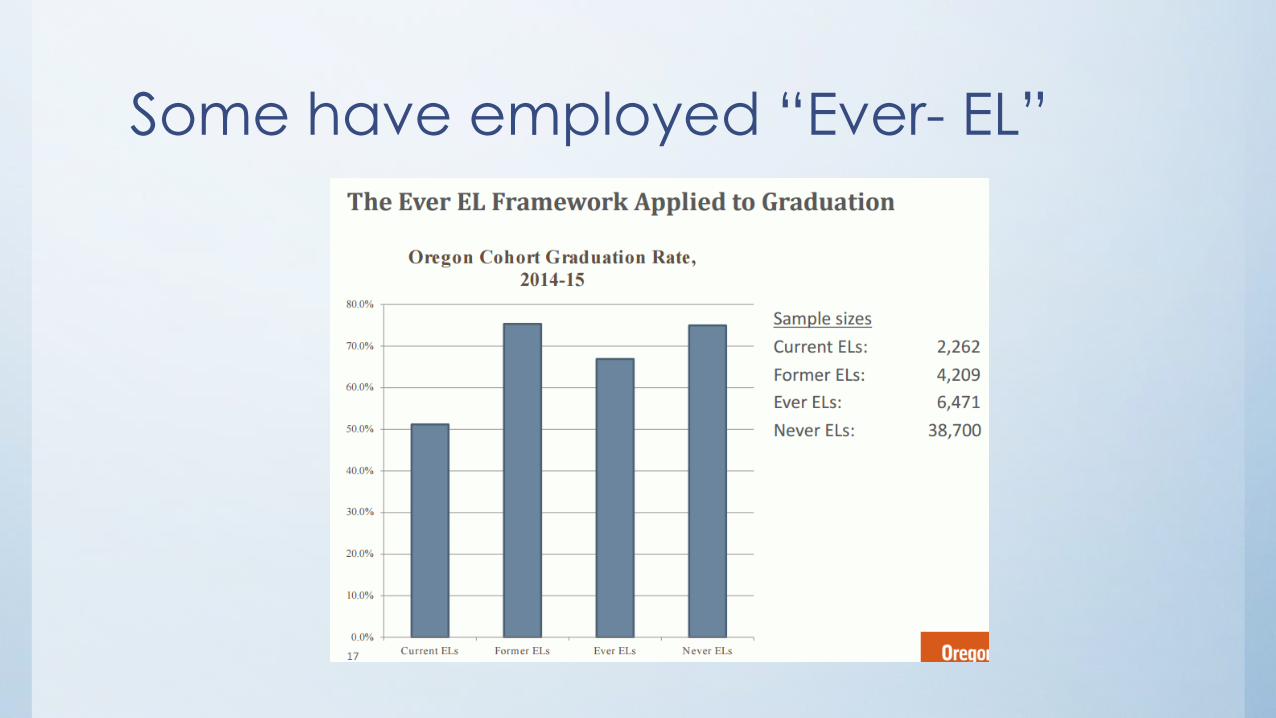
Some have employed “Ever- EL”
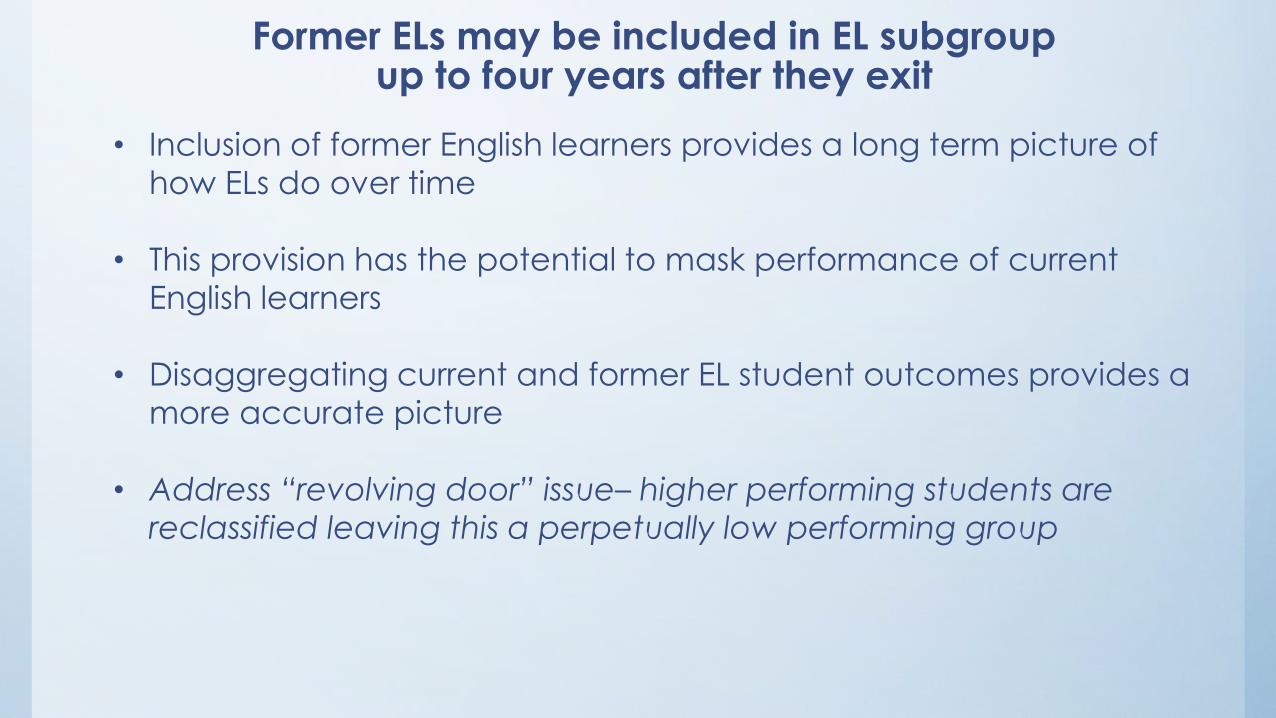
Former ELs may be included in EL subgroup up to four years after they exit
• Inclusion of former English learners provides a long term picture of
how ELs do over time
• This provision has the potential to mask performance of current
English learners
• Disaggregating current and former EL student outcomes provides a
more accurate picture
• Address “revolving door” issue– higher performing students are
reclassified leaving this a perpetually low performing group
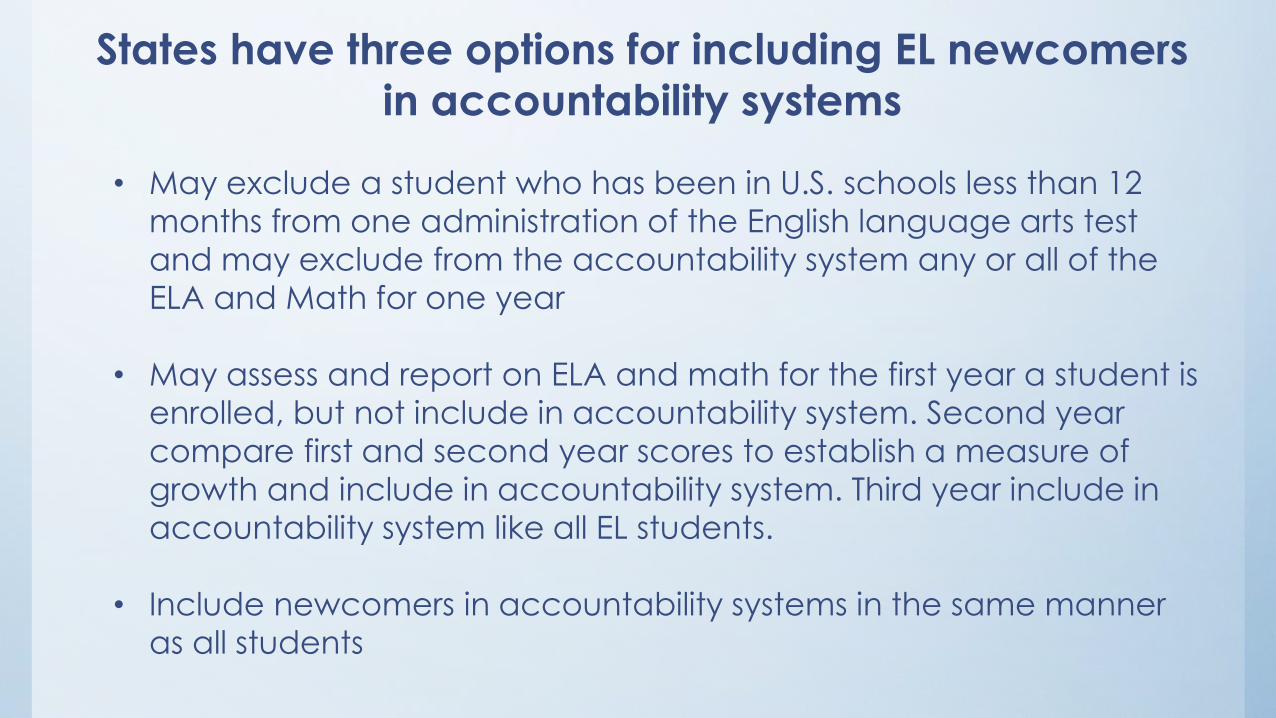
• May exclude a student who has been in U.S. schools less than 12
months from one administration of the English language arts test
and may exclude from the accountability system any or all of the
ELA and Math for one year
• May assess and report on ELA and math for the first year a student is
enrolled, but not include in accountability system. Second year
compare first and second year scores to establish a measure of
growth and include in accountability system. Third year include in
accountability system like all EL students.
• Include newcomers in accountability systems in the same manner
as all students
States have three options for including EL newcomers
in accountability systems
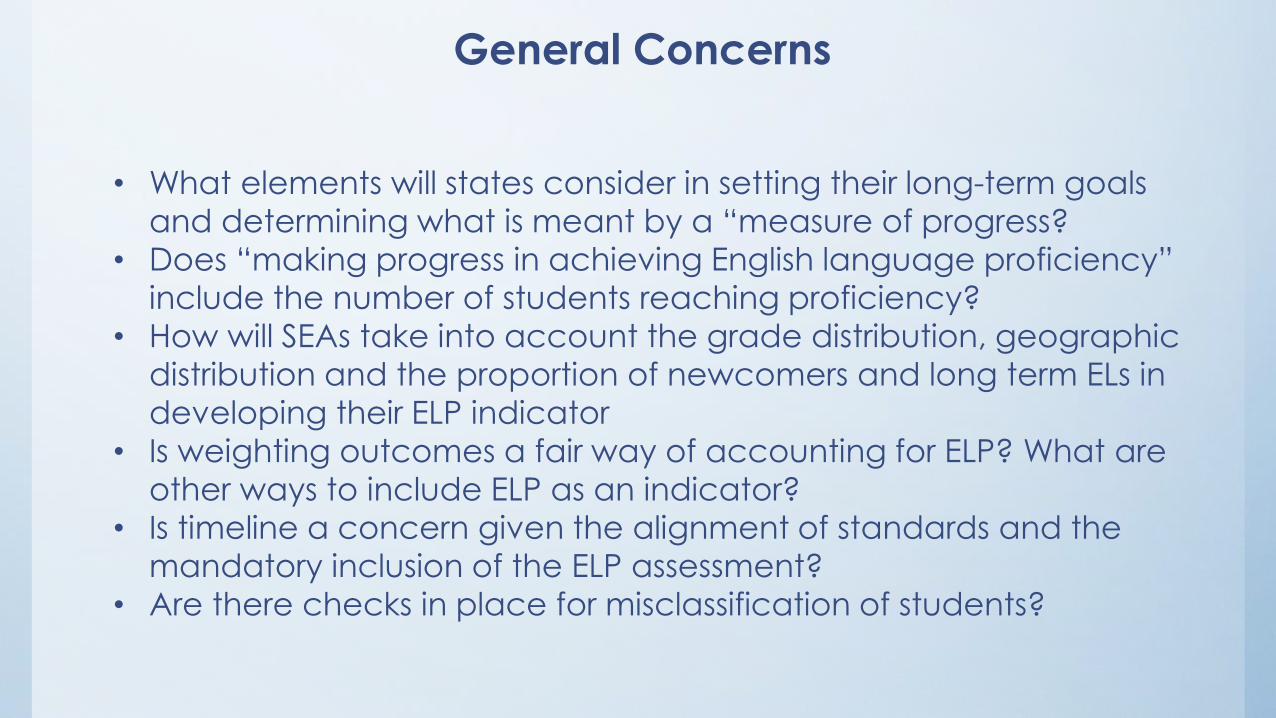
• What elements will states consider in setting their long-term goals
and determining what is meant by a “measure of progress?
• Does “making progress in achieving English language proficiency”
include the number of students reaching proficiency?
• How will SEAs take into account the grade distribution, geographic
distribution and the proportion of newcomers and long term ELs in
developing their ELP indicator
• Is weighting outcomes a fair way of accounting for ELP? What are
other ways to include ELP as an indicator?
• Is timeline a concern given the alignment of standards and the
mandatory inclusion of the ELP assessment?
• Are there checks in place for misclassification of students?
General Concerns
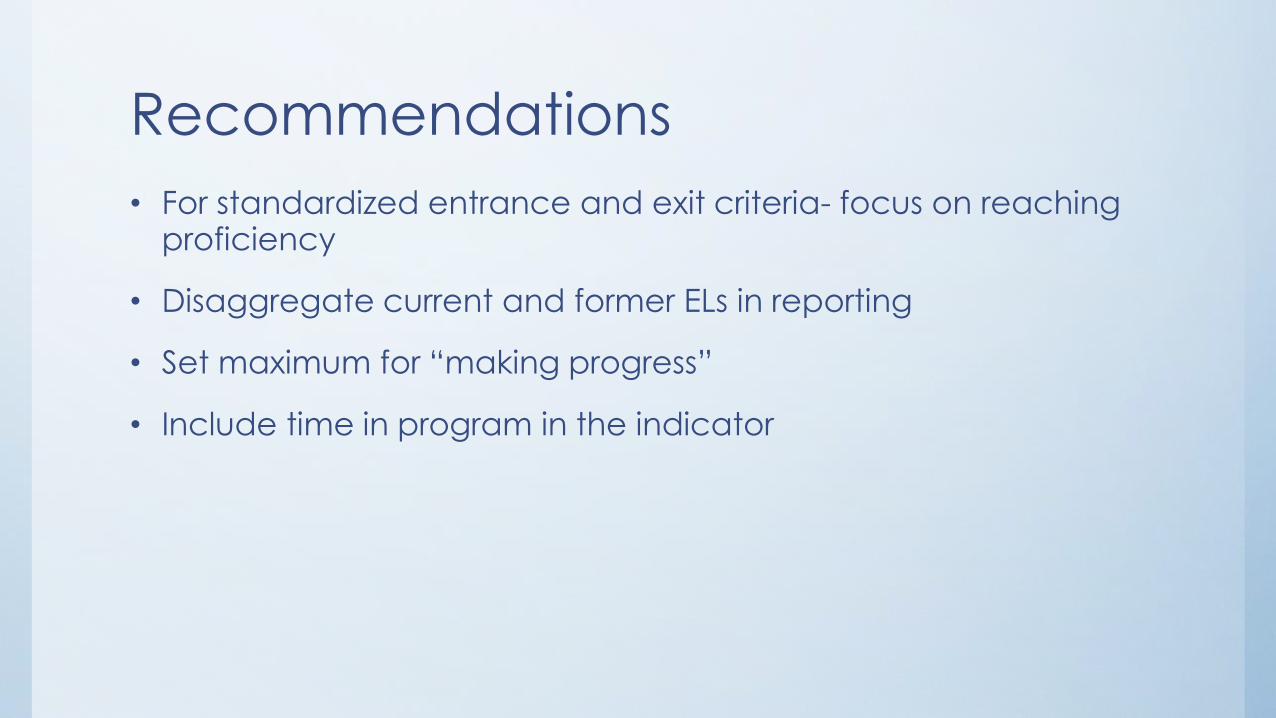
Recommendations
• For standardized entrance and exit criteria- focus on reaching proficiency
• Disaggregate current and former ELs in reporting
• Set maximum for “making progress”
• Include time in program in the indicator

Questions?