English as an Additional Language, proficiency in English ... · English as an Additional Language,...
54
English as an Additional Language, proficiency in English and pupils’ educational achievement: An analysis of Local Authority data UNIVERSITY OF OXFORD DEPARTMENT OF EDUCATION OCTOBER 2018 AUTHORS Professor Steve Strand Annina Hessel
Transcript of English as an Additional Language, proficiency in English ... · English as an Additional Language,...
English as an Additional Language, proficiency in English and pupils’ educational achievement: An analysis of Local Authority data
UNIVERSITY OF OXFORD DEPARTMENT OF EDUCATION
OCTOBER 2018
AUTHORS
Professor Steve Strand Annina Hessel
ENGLISH AS AN ADDITIONAL LANGUAGE, PROFICIENCY IN ENGLISH AND PUPILS’ EDUCATIONAL ACHIEVEMENT: AN ANALYSIS OF LOCAL AUTHORITY DATA
2
CopyrightAll rights reserved. No part of this publication may be reproduced in any form (including photocopying or storing it in any medium by electronic means and whether or not transiently or incidentally to some other use of this publication) without the written permission of the copyright owner. Applications for the copyright owner’s written permission to reproduce any part of this publication should be addressed to the publisher.
Copyright © University of Oxford, Unbound Philanthropy, and The Bell Educational Trust Limited (operating as The Bell Foundation)
The Bell Educational Trust Limited is a charitable company limited by guarantee number 1048465, established on 5 April 1972, and a charity registered with the Charity Commission number 311585
The Bell Foundation Hillscross Red Cross Lane Cambridge CB2 0QU
www.bell-foundation.org.uk
3
Research Team
Steve Strand is Professor of Education at the Oxford University Department of Education.
Steve Strand has been Professor of Education at the University of Oxford since January 2013. Previously he was Professor of Education at the University of Warwick (2005-2012). Prior to that, Steve was Senior Assessment Consultant at GL Assessments, the UK’s leading educational test and assessment publisher (1998-2005) and Head of Research and Evaluation at both Wandsworth and Croydon Local Education Authorities (1988-1998). In these roles he has been responsible for pioneering work on ‘value added’ analyses of school performance. Steve has particular skills in statistical modelling and analysis of large-scale longitudinal datasets including the Longitudinal Study of Young People in England (LSYPE) and the National Pupil Database (NPD). He leads the Quantitative Methods (QM) hub at the Oxford University Department of Education. He is the author of over 100 peer-reviewed journal articles, book chapters and research reports. For further details see: http://www.education.ox.ac.uk/about-us/directory/professor-steve-strand/
Annina Hessel is a Doctoral Researcher at the Oxford University Department of Education and a Research Scientist at the University of Göttingen, Germany.
Annina Hessel has been a Doctoral Researcher in the Oxford University Departments of Education and Experimental Psychology since October 2015. She has recently started a postdoctoral position as a Research Scientist in the Department of Educational Psychology at the University of Göttingen. Annina holds an MSc in Applied Linguistics and Second Language Acquisition from Oxford University and a MEd in English and French from the University of Mainz, Germany. Her research spans educational and psycholinguistic topics in childrens’ reading comprehension and vocabulary acquisition, with a specialism in the language acquisition of English as an Additional Language learners. Annina has expertise in psycholinguistic methods, in particular reading eye tracking with children. In her teaching and outreach, Annina strives to link educational research and practice, and her classes span psychology and applied linguistics, as well as teacher education and continuing professional development. Twitter: @AnninaHessel
ENGLISH AS AN ADDITIONAL LANGUAGE, PROFICIENCY IN ENGLISH AND PUPILS’ EDUCATIONAL ACHIEVEMENT: AN ANALYSIS OF LOCAL AUTHORITY DATA
4
About The Bell Foundation
The Bell Foundation is a charity which aims to overcome exclusion through language education by working with partners on innovation, research, training and practical interventions. Through generating and applying evidence, we aim to change practice, policy and systems for children, adults and communities in the UK disadvantaged through language.
The Foundation works in two key areas:
• The EAL Programme aims to improve the educational outcomes of children with English as an Additional Language in the UK to benefit the individual child and society as a whole. The Foundation works in partnership with a range of organisations across the education system to provide training and resources in order to build capacity, develop and evaluate models of good practice, and provide thought leadership.
• The Criminal Justice Programme seeks to break down the language barrier to accessing justice and rehabilitation for individuals in contact with the criminal justice system for whom English is an additional language. In 2017 the Foundation developed a long-term strategy for its work in the sector, with a focus on both victims and offenders of crime. The Foundation works through interventions in research, policy, practice and service support.
About Unbound Philanthropy
Unbound Philanthropy is an independent private grant-making foundation that works to ensure that migrants and refugees are treated with respect and engage with their new communities. We support pragmatic, innovative and responsive approaches to immigration and immigrant integration in the United States and United Kingdom.
5
ContentsResearch Team 3
Executive Summary 7
Introduction 12
Methodology 13
Data requested 13
The sample 14
Missing data 16
Description of the Proficiency in English Scale 17
Reasons for missing proficiency in English data 18
Variation between Local Authorities 19
Results 20
Do groups of EAL pupils differ in their English proficiency? 20
Year groups 20
Gender and disadvantage 21
Is EAL pupils’ proficiency in English linked to their educational attainment? 22
Early Years Foundation Stage Profile (EYFSP) (age 5) 22
KS1 achievement (age 7) 24
KS2 achievement (age 11) 26
KS4 achievement and progress (age 16) 29
Conclusion regarding proficiency in English and achievement 32
How much of the variation in EAL pupils’ attainment can be explained by proficiency in English? 33
ENGLISH AS AN ADDITIONAL LANGUAGE, PROFICIENCY IN ENGLISH AND PUPILS’ EDUCATIONAL ACHIEVEMENT: AN ANALYSIS OF LOCAL AUTHORITY DATA
6
Summary and discussion 35
Do groups of EAL pupils differ in their proficiency in English? 35
Is EAL pupils’ proficiency in English linked to their educational attainment? 36
How much of EAL pupils’ attainment can proficiency in English explain? 36
Conclusions 37
References 39
Appendix 1: DfE Proficiency in English Scale 40
Appendix 2: Proficiency in English LA Data Project – Information Pack 41
Appendix 3: Variable description 45
Appendix 4: Missing data treatment 47
Appendix 5: Proficiency in English distribution by Local Authority and year group 48
Appendix 6: EAL gaps based on the full national dataset: Revisiting Strand et al. (2015) using 2017 data 49
7
Executive Summary
Background
This report presents an analysis of data from a new variable in the English School Census, recording the Proficiency in English (PIE) of pupils with English as an Additional Language (EAL). In the January 2017 census, schools were asked to rate all their EAL pupils on their proficiency in English on a five-point scale (A-E) from New to English (A) through to Fluent (E) (see Appendix 1). This scale was introduced following the recognition that the simple binary definition of EAL in the School Census masks huge variability in pupils’ educational achievement, variability that can largely be explained through differences in pupils’ proficiency in English (Strand & Demie, 2005; Strand, Malmberg, & Hall, 2015). The new Proficiency in English Scale promises to be a valuable tool to understand variability in EAL pupils’ educational achievement and to plan targeted support.
Despite these potential promises, the only analysis reported by the Department for Education (DfE) has been a single line, reporting the number of pupils at stage A-E based on the total number of pupils aged 5-16 in January 2017 (DfE, 2017a). We requested the national data from the DfE so we could undertake a proper analysis, but the request was refused as we were told the DfE has chosen to exclude proficiency in English from the National Pupil Database (NPD). No researchers are therefore able to fill the void left by the lack of any published DfE analysis. There are therefore many unanswered questions, including:
1. What factors are associated with the proficiency in English of EAL pupils? How does proficiency in English vary by pupils’ age or in relation to other demographic factors such as gender or entitlement to Free School Meals (FSM)?
2. Is EAL pupils’ proficiency in English linked to their educational attainment at age 5, 7, 11 and 16? Is the relationship consistent at different ages? How does the performance of EAL pupils Competent (Stage D) or Fluent (Stage E) in English compare to that of monolingual English speakers?
3. How much of the variation between EAL pupils’ attainment can be explained by their proficiency in English? Is there evidence of discriminant validity, i.e. stronger correlations between proficiency in English and reading achievement compared to mathematics achievement?
ENGLISH AS AN ADDITIONAL LANGUAGE, PROFICIENCY IN ENGLISH AND PUPILS’ EDUCATIONAL ACHIEVEMENT: AN ANALYSIS OF LOCAL AUTHORITY DATA
8
The Dataset
Since the DfE has excluded the Proficiency in English Scale from the NPD, we were not able, despite requests, to access the national data to answer the above questions. As an alternative, we established a data-sharing project with a number of Local Authorities in England who agreed to share fully anonymised pupil level results so we could address the above questions.
Our dataset consists of the results of 140,000 pupils, from 1,569 schools across six Local Authorities (LAs). These represented a good spread including one inner London borough, two outer London boroughs, a large southern shire county, a substantial West Midlands conurbation, and a large northern city. The sample has a slightly higher proportion of EAL pupils than the national average (25% vs. 19%), because we wanted to include some LAs with high proportions of EAL pupils. It was representative of the country in terms of ethnicity, entitlement to FSM, gender, and in relation to educational achievement at all ages (5, 7, 11 and 16 years).
The LAs provided the proficiency in English data on all their Reception, Y2, Y6 and Y11 pupils so we could match proficiency in English and achievement in national tests and examinations at age 5, 7, 11 and 16 years respectively. LAs also supplied the data for all their pupils, including those whose first language was English, so we could compare the results for EAL pupils who were Competent or Fluent in English with their monolingual English peers.
Results
Proficiency in English and pupil characteristics
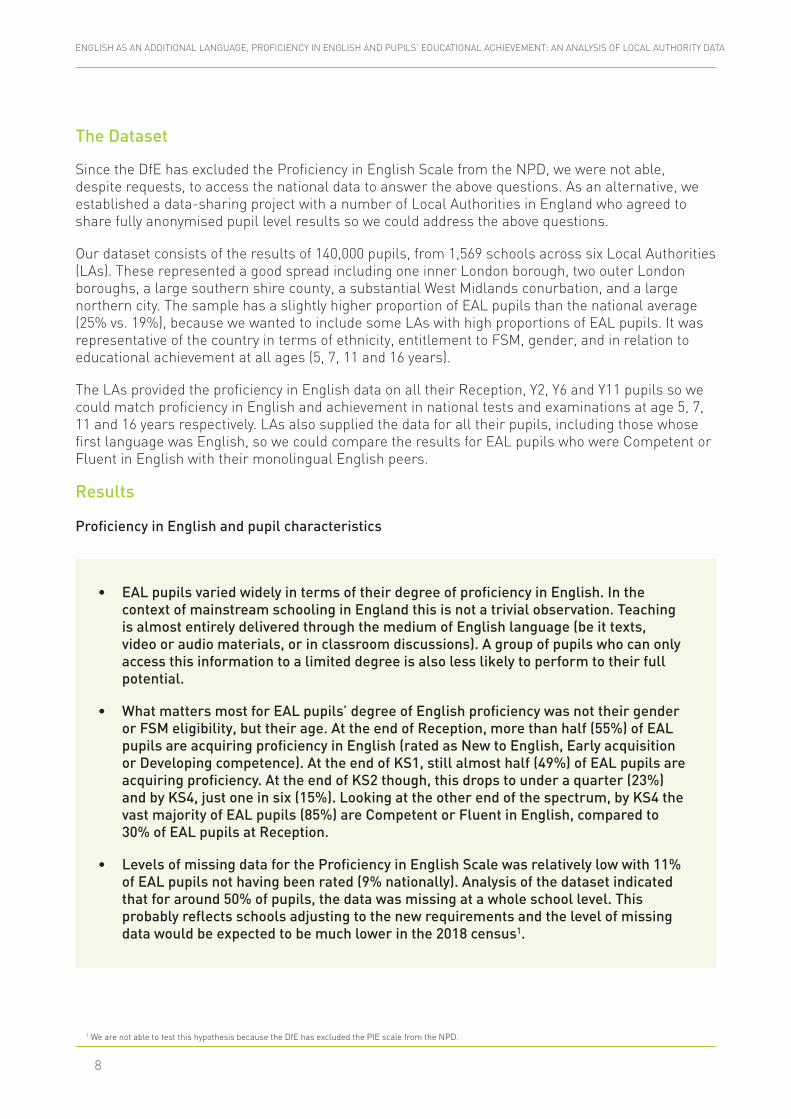
• EAL pupils varied widely in terms of their degree of proficiency in English. In the context of mainstream schooling in England this is not a trivial observation. Teaching is almost entirely delivered through the medium of English language (be it texts, video or audio materials, or in classroom discussions). A group of pupils who can only access this information to a limited degree is also less likely to perform to their full potential.
• What matters most for EAL pupils’ degree of English proficiency was not their gender or FSM eligibility, but their age. At the end of Reception, more than half (55%) of EAL pupils are acquiring proficiency in English (rated as New to English, Early acquisition or Developing competence). At the end of KS1, still almost half (49%) of EAL pupils are acquiring proficiency. At the end of KS2 though, this drops to under a quarter (23%) and by KS4, just one in six (15%). Looking at the other end of the spectrum, by KS4 the vast majority of EAL pupils (85%) are Competent or Fluent in English, compared to 30% of EAL pupils at Reception.
• Levels of missing data for the Proficiency in English Scale was relatively low with 11% of EAL pupils not having been rated (9% nationally). Analysis of the dataset indicated that for around 50% of pupils, the data was missing at a whole school level. This probably reflects schools adjusting to the new requirements and the level of missing data would be expected to be much lower in the 2018 census1.
1 We are not able to test this hypothesis because the DfE has excluded the PIE scale from the NPD.
9
Proficiency in English and educational attainment
Across all ages 5-16 and all subjects, three points came out very strongly:
• EAL pupils with different levels of proficiency in English vary greatly in their achievement.
• Pupils’ attainment increases with greater English proficiency, indicating a strong link between proficiency in English and educational achievement.
• While EAL pupils who are New to English or at the Early acquisition stage score below the national average, those who are Developing competence are very close to the national average and those who are Competent or Fluent score significantly above the national average. Indeed the latter two groups of EAL pupils score significantly higher than monolingual English speakers.
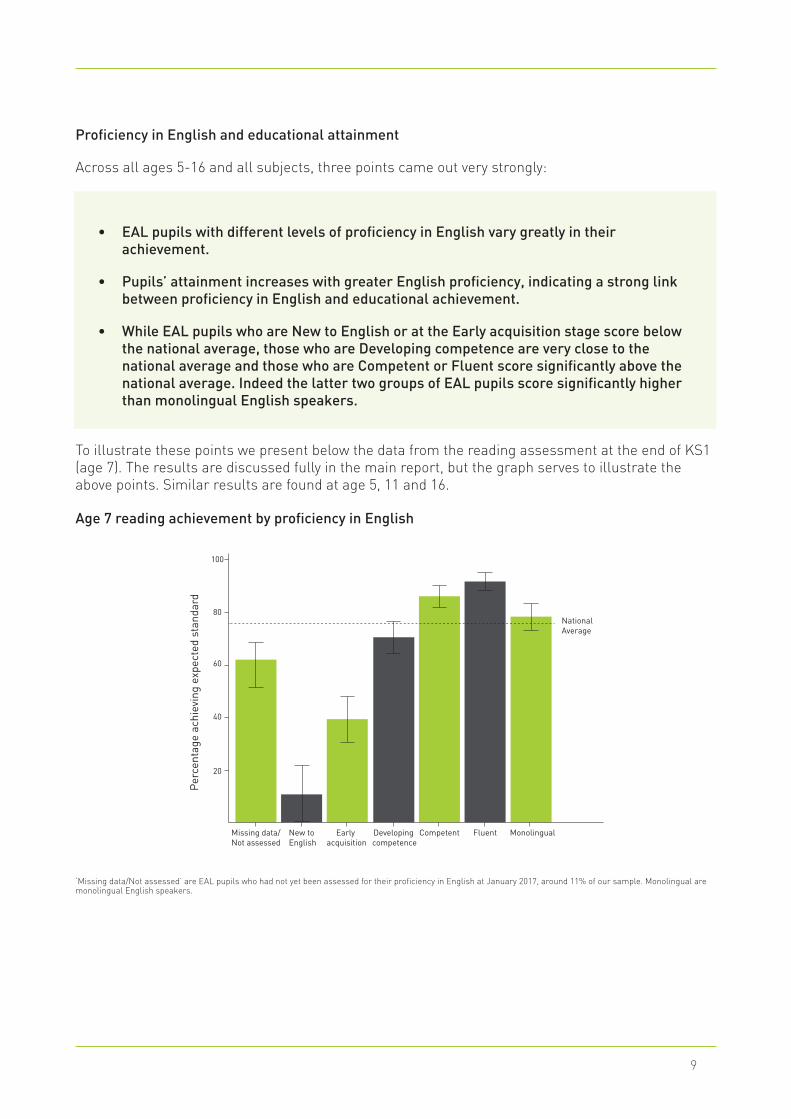
To illustrate these points we present below the data from the reading assessment at the end of KS1 (age 7). The results are discussed fully in the main report, but the graph serves to illustrate the above points. Similar results are found at age 5, 11 and 16.
Age 7 reading achievement by proficiency in English
Missing data/Not assessed
20
40
60
80
100
New to English
Per
cent
age
achi
evin
g ex
pect
ed s
tand
ard
Early acquisition
Developing competence
Competent Fluent Monolingual
National Average
‘Missing data/Not assessed’ are EAL pupils who had not yet been assessed for their proficiency in English at January 2017, around 11% of our sample. Monolingual are monolingual English speakers.
ENGLISH AS AN ADDITIONAL LANGUAGE, PROFICIENCY IN ENGLISH AND PUPILS’ EDUCATIONAL ACHIEVEMENT: AN ANALYSIS OF LOCAL AUTHORITY DATA
10
Proficiency in English allows us to explain up to 22% of the variability in EAL pupils’ achievement, compared to a typical 3%-4% explained by other pupil characteristics. This underlines how important proficiency in English is in understanding the achievement of EAL pupils, explaining between four to six times as much variation in achievement as gender, FSM and ethnicity combined. As expected, the relationship between proficiency in English and achievement was particularly strong in language-heavy subjects (such as reading and English) compared to mathematics. This further indicates a level of discriminant validity for the Proficiency in English Scale.
Conclusions
EAL itself is a poor indicator of pupils’ likely level of educational achievement – proficiency in English is central to understanding achievement and levels of need among pupils with EAL
EAL researchers and practitioners have for a long time discussed the imprecision of the binary EAL measure in the School Census that masks huge differences in English language skills (Strand & Demie, 2005; Demie & Strand, 2006; Strand et al., 2015; Hutchinson, 2018). The EAL definition groups together a diverse and heterogeneous group of pupils (e.g. those who are recent arrivals to the country with little or no English and those who have an additional language as part of their cultural heritage but are also fully Fluent in English) all in a single group, irrespective of their actual language skills. In an English-medium education system, a pupil’s likelihood to succeed will be strongly influenced by their mastery of the language of instruction. Our results demonstrate conclusively that EAL is a poor indicator of pupils’ likely level of educational achievement. The results confirm that the Proficiency in English Scale is a vital indicator of EAL pupil’s language proficiency and the best predictor of their educational attainment.
English language support is most needed in the early years and KS1, but there is a need for support at all ages
The low levels of fluency in English in the early years suggest that language support is most warranted in Reception and KS1. Early support would be particularly beneficial since the earlier the pupil gains fluency in the language of instruction, the earlier they can access the curriculum. In later years, support may be needed for fewer pupils, but is still warranted, particularly for pupils who are new to the country. If the aspiration of the school system is to provide full access to the (English language) curriculum to all pupils, language support would still be needed for one in six EAL pupils at KS4, where 15% were judged less than Competent in regard to their proficiency.
Bilingualism can have positive associations with achievement
It is important to recognise that being bilingual is not a barrier to learning. It is possible to succeed in the English school system while reaping the benefits of growing up with more than one language. Indeed, we see that pupils with EAL who are rated as Competent or Fluent in English typically have significantly higher educational achievement than their monolingual peers. What can be a barrier to learning is low proficiency in the language of instruction. Pupils need to be supported adequately so that all children can acquire the proficiency in English they need to develop to their full potential.
11
The Proficiency in English Scale should be retained in the School Census and the data should be available in the National Pupil Database (NPD)
It was very welcome that following the publication of the report by Strand et al. (2015), the Government recognised the need for the assessment of learners with EAL and responded by introducing the Proficiency in English Scale in 2016. This brought England into line with best practice in Wales and Scotland both of which have been collecting data on pupils’ proficiency in English for many years. However, the DfE has recently announced it will no longer require schools to complete the Proficiency in English Scale from January 2019. This is a retrograde step and potentially a damaging one. We strongly urge the DfE to consult with schools and reconsider this decision. The data that has been collected should also be released in the National Pupil Database (NPD), so that further research can be conducted.
The DfE should provide schools with guidance on best practice
The DfE should provide guidance on best practice in EAL assessment to schools, to LAs, and to Multi-Academy Trusts which draws on what has been learnt from the introduction of the scale. It would be valuable if this included reference to the EAL Assessment Framework developed by The Bell Foundation (2017) and considered issues around expertise, training and moderation. We urge schools to continue to record the proficiency in English of their EAL pupils and to use the data to identify need and target support.
ENGLISH AS AN ADDITIONAL LANGUAGE, PROFICIENCY IN ENGLISH AND PUPILS’ EDUCATIONAL ACHIEVEMENT: AN ANALYSIS OF LOCAL AUTHORITY DATA
12
Introduction
This report presents an analysis of a new data item in the English School Census recording the Proficiency in English (PIE) of pupils with English as an Additional Language (EAL). In January 2017, schools were asked to rate all their EAL pupils on their proficiency in English on a five-point scale (A to E) from New to English (A) to Fluent (E). The scale is included as Appendix 1. The scale was introduced following recognition by the government that the binary EAL measure in the census masks huge variability in achievement, variability that can largely be explained through differences in pupils’ proficiency in English (Demie & Strand, 2006; Strand & Demie, 2005; Strand, Malmberg, & Hall, 2015). The Proficiency in English Scale promises to be a valuable tool to understand variability in EAL pupils’ educational achievement and to plan targeted support.
Despite these potential promises, the only analysis reported by the Department for Education (DfE) has been a single line, reporting the number of pupils at each stage A-E based on the total number of pupils aged 5-16 (Department for Education, 2017a). We requested the national data from the DfE but the request was refused as we were told the DfE has chosen to exclude proficiency in English from the National Pupil Database (NPD). The following key questions therefore currently remain unanswered:
• What is the distribution of EAL pupils across the five proficiency in English stages? Does this change between the age of 5 and 16 years, e.g. are older pupils more likely to be Fluent in English?
• Is EAL pupils’ proficiency in English linked to their educational attainment? Is the relationship consistent at different ages? Do any achievement gaps narrow for older pupils?
• How does the performance of EAL pupils who are Competent (Stage D) or Fluent (Stage E) in English compare to that of monolingual English speakers?
• Do we see evidence of discriminant validity, e.g. stronger correlations between proficiency in English and reading achievement than with mathematics achievement?
• How much of the variation between EAL pupils’ in their attainment can be explained by their proficiency in English? How does this compare to other pupil background factors?
To answer these questions, we collaborated with six Local Authorities (LAs) in England to establish a fully anonymised pupil level dataset. The following section describes the process of data acquisition and processing, the dataset created, and descriptive statistics on the Proficiency in English Scale. This will establish the basis for following analyses of proficiency in English and achievement at each key stage.
13
Methodology
Data requested
The data was collected by contacting Local Authorities (LAs) through research meetings and personal contacts of the first author. We asked LAs for anonymised individual pupil level data including year group, gender, ethnicity, whether English was an Additional Language (EAL), the specific additional language if English was not the main language, current entitlement to a Free School Meal (FSM), whether the pupil had ever been entitled to a FSM at any time in the last six years (EVER6), and their Proficiency in English (PIE).
In order to investigate the link between proficiency in English and pupil attainment at key milestones, we asked for the above data for pupils who had completed Early Years Foundation Stage Profile and end of KS1, KS2 and KS4 national assessments in 2017, i.e. all Reception, Y2, Y6 and Y11 pupils respectively.
To enable comparisons between EAL pupils rated Competent or Fluent in English and monolingual English pupils, we asked for data on the achievement of all pupils in the relevant LAs, not just those with EAL.
Appendix 2 gives a copy of the Project Information Pack sent to participating LAs. Every LA also signed an Information Sharing Agreement (ISA) that detailed secure ways to share and handle the data for all parties involved. We requested the following pupil achievement measures (see Appendix 2 for further detail):
End of Reception (age 5)
• Early Years Foundation Stage Profile (EYFSP) total point score.
• Whether the pupil achieved the threshold for a Good Level of Development (GLD).
End of Key Stage 1 (age 7)
• KS1 teacher assessed levels for reading and for mathematics (below, at, or above expectation).
End of Key Stage 2 (age 11)
• KS2 scaled scores in the national reading and mathematics tests (80-120).
• KS2 progress scores in reading and mathematics (progress age 7-11 centred on 0 which indicates the average/typical progress).
ENGLISH AS AN ADDITIONAL LANGUAGE, PROFICIENCY IN ENGLISH AND PUPILS’ EDUCATIONAL ACHIEVEMENT: AN ANALYSIS OF LOCAL AUTHORITY DATA
14
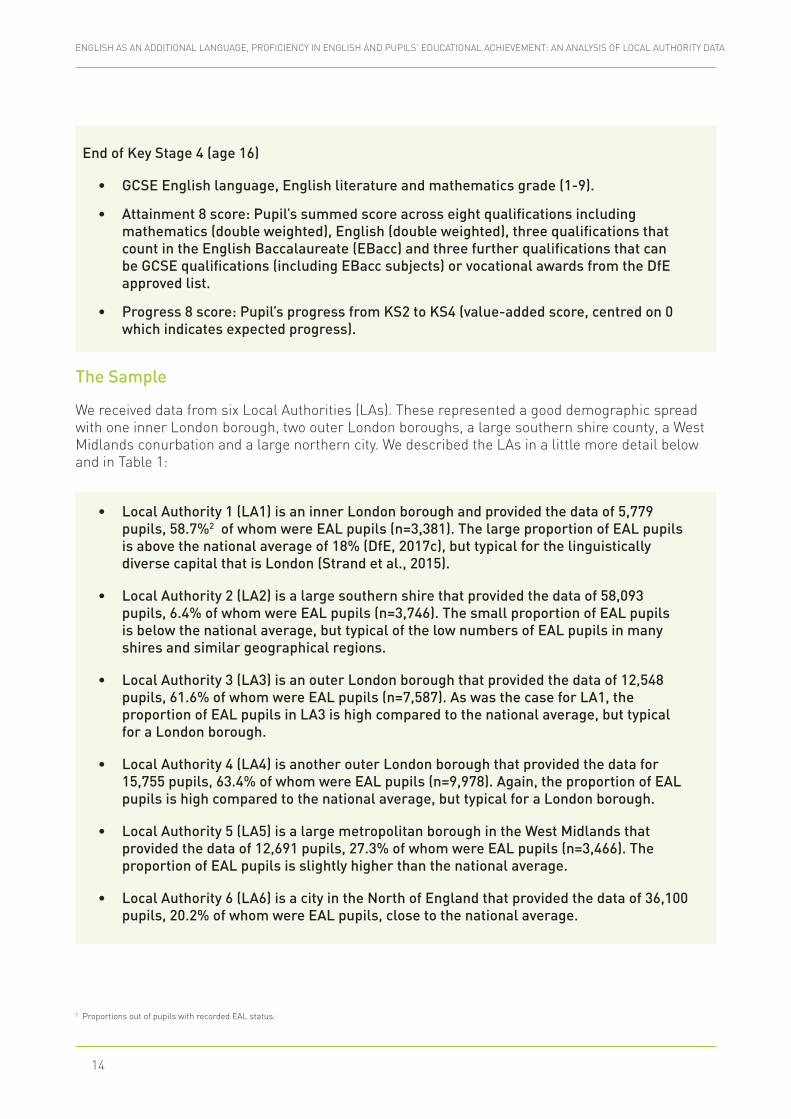
End of Key Stage 4 (age 16)
• GCSE English language, English literature and mathematics grade (1-9).
• Attainment 8 score: Pupil’s summed score across eight qualifications including mathematics (double weighted), English (double weighted), three qualifications that count in the English Baccalaureate (EBacc) and three further qualifications that can be GCSE qualifications (including EBacc subjects) or vocational awards from the DfE approved list.
• Progress 8 score: Pupil’s progress from KS2 to KS4 (value-added score, centred on 0 which indicates expected progress).
The Sample
We received data from six Local Authorities (LAs). These represented a good demographic spread with one inner London borough, two outer London boroughs, a large southern shire county, a West Midlands conurbation and a large northern city. We described the LAs in a little more detail below and in Table 1:
• Local Authority 1 (LA1) is an inner London borough and provided the data of 5,779 pupils, 58.7%2 of whom were EAL pupils (n=3,381). The large proportion of EAL pupils is above the national average of 18% (DfE, 2017c), but typical for the linguistically diverse capital that is London (Strand et al., 2015).
• Local Authority 2 (LA2) is a large southern shire that provided the data of 58,093 pupils, 6.4% of whom were EAL pupils (n=3,746). The small proportion of EAL pupils is below the national average, but typical of the low numbers of EAL pupils in many shires and similar geographical regions.
• Local Authority 3 (LA3) is an outer London borough that provided the data of 12,548 pupils, 61.6% of whom were EAL pupils (n=7,587). As was the case for LA1, the proportion of EAL pupils in LA3 is high compared to the national average, but typical for a London borough.
• Local Authority 4 (LA4) is another outer London borough that provided the data for 15,755 pupils, 63.4% of whom were EAL pupils (n=9,978). Again, the proportion of EAL pupils is high compared to the national average, but typical for a London borough.
• Local Authority 5 (LA5) is a large metropolitan borough in the West Midlands that provided the data of 12,691 pupils, 27.3% of whom were EAL pupils (n=3,466). The proportion of EAL pupils is slightly higher than the national average.
• Local Authority 6 (LA6) is a city in the North of England that provided the data of 36,100 pupils, 20.2% of whom were EAL pupils, close to the national average.
2 Proportions out of pupils with recorded EAL status.
15
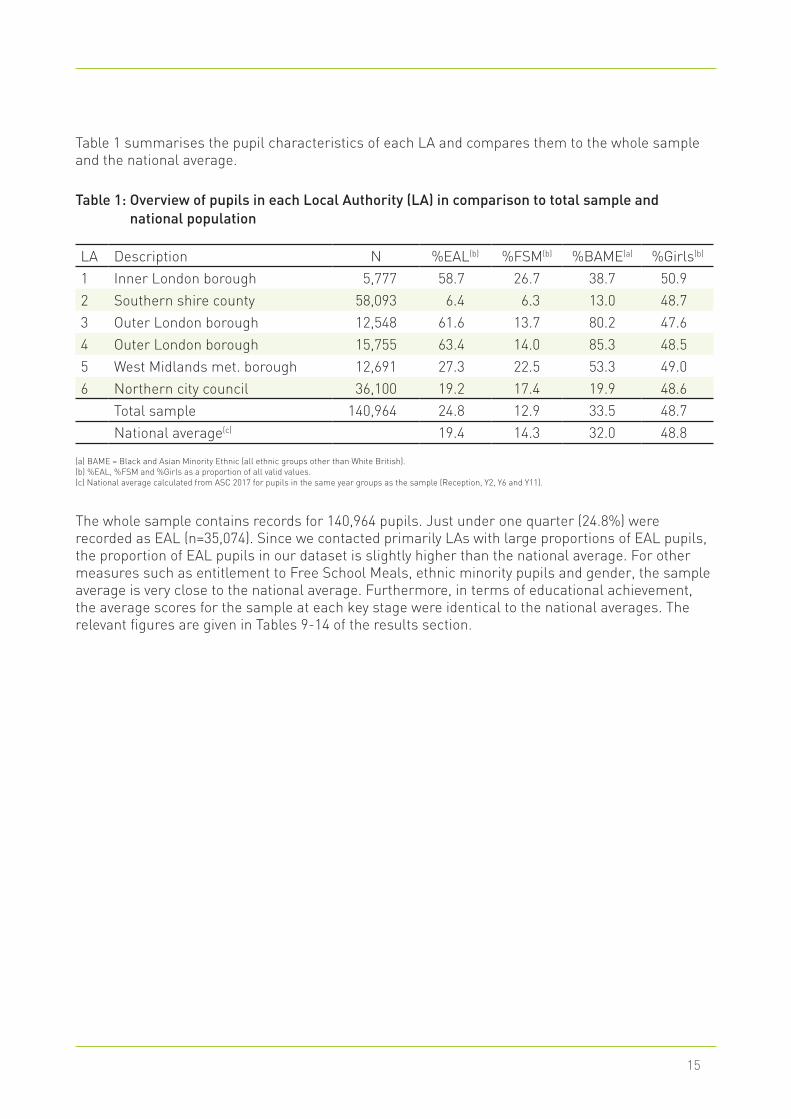
Table 1 summarises the pupil characteristics of each LA and compares them to the whole sample and the national average.
The whole sample contains records for 140,964 pupils. Just under one quarter (24.8%) were recorded as EAL (n=35,074). Since we contacted primarily LAs with large proportions of EAL pupils, the proportion of EAL pupils in our dataset is slightly higher than the national average. For other measures such as entitlement to Free School Meals, ethnic minority pupils and gender, the sample average is very close to the national average. Furthermore, in terms of educational achievement, the average scores for the sample at each key stage were identical to the national averages. The relevant figures are given in Tables 9-14 of the results section.
Table 1: Overview of pupils in each Local Authority (LA) in comparison to total sample and national population
LA Description N %EAL(b) %FSM(b) %BAME(a) %Girls(b)
1 Inner London borough 5,777 58.7 26.7 38.7 50.92 Southern shire county 58,093 6.4 6.3 13.0 48.73 Outer London borough 12,548 61.6 13.7 80.2 47.64 Outer London borough 15,755 63.4 14.0 85.3 48.55 West Midlands met. borough 12,691 27.3 22.5 53.3 49.06 Northern city council 36,100 19.2 17.4 19.9 48.6
Total sample 140,964 24.8 12.9 33.5 48.7National average(c) 19.4 14.3 32.0 48.8
(a) BAME = Black and Asian Minority Ethnic (all ethnic groups other than White British). (b) %EAL, %FSM and %Girls as a proportion of all valid values. (c) National average calculated from ASC 2017 for pupils in the same year groups as the sample (Reception, Y2, Y6 and Y11).
ENGLISH AS AN ADDITIONAL LANGUAGE, PROFICIENCY IN ENGLISH AND PUPILS’ EDUCATIONAL ACHIEVEMENT: AN ANALYSIS OF LOCAL AUTHORITY DATA
16
Missing data
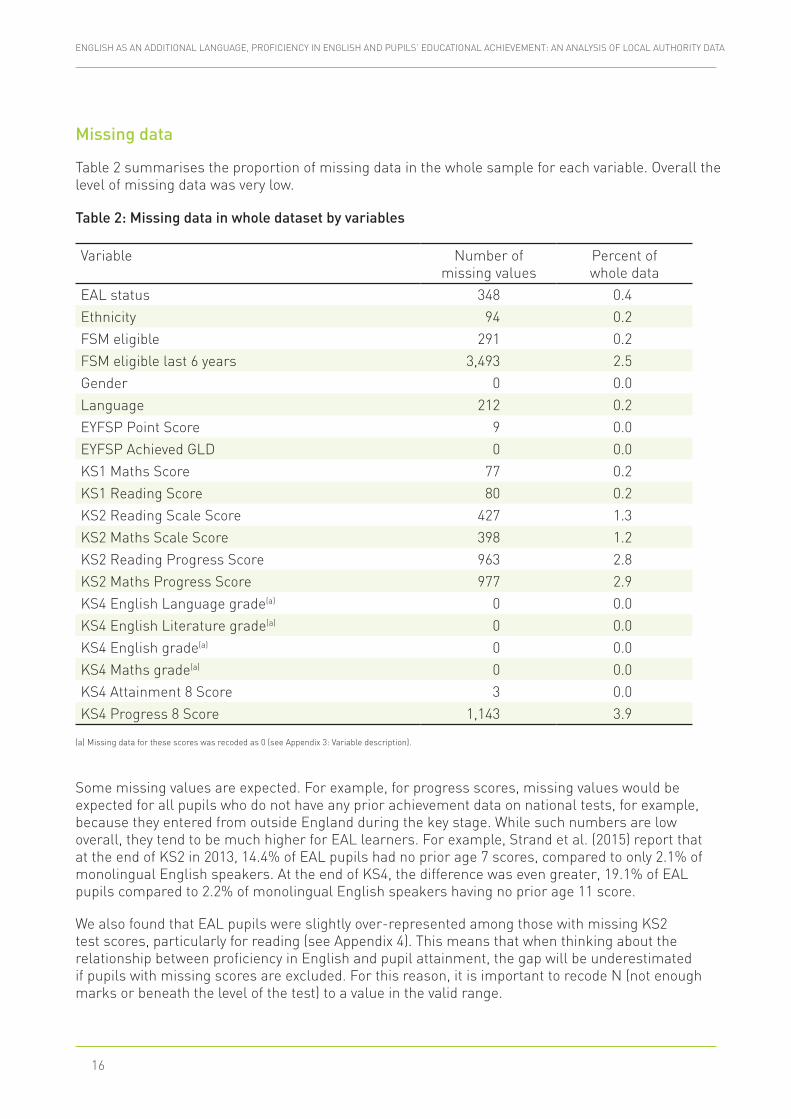
Table 2 summarises the proportion of missing data in the whole sample for each variable. Overall the level of missing data was very low.
Some missing values are expected. For example, for progress scores, missing values would be expected for all pupils who do not have any prior achievement data on national tests, for example, because they entered from outside England during the key stage. While such numbers are low overall, they tend to be much higher for EAL learners. For example, Strand et al. (2015) report that at the end of KS2 in 2013, 14.4% of EAL pupils had no prior age 7 scores, compared to only 2.1% of monolingual English speakers. At the end of KS4, the difference was even greater, 19.1% of EAL pupils compared to 2.2% of monolingual English speakers having no prior age 11 score.
We also found that EAL pupils were slightly over-represented among those with missing KS2 test scores, particularly for reading (see Appendix 4). This means that when thinking about the relationship between proficiency in English and pupil attainment, the gap will be underestimated if pupils with missing scores are excluded. For this reason, it is important to recode N (not enough marks or beneath the level of the test) to a value in the valid range.
Table 2: Missing data in whole dataset by variables
Variable Number of missing values
Percent of whole data
EAL status 348 0.4Ethnicity 94 0.2FSM eligible 291 0.2FSM eligible last 6 years 3,493 2.5Gender 0 0.0Language 212 0.2EYFSP Point Score 9 0.0EYFSP Achieved GLD 0 0.0KS1 Maths Score 77 0.2KS1 Reading Score 80 0.2KS2 Reading Scale Score 427 1.3KS2 Maths Scale Score 398 1.2KS2 Reading Progress Score 963 2.8KS2 Maths Progress Score 977 2.9KS4 English Language grade(a) 0 0.0KS4 English Literature grade(a) 0 0.0KS4 English grade(a) 0 0.0KS4 Maths grade(a) 0 0.0KS4 Attainment 8 Score 3 0.0KS4 Progress 8 Score 1,143 3.9
(a) Missing data for these scores was recoded as 0 (see Appendix 3: Variable description).
17
Missing values were generally defined as missing and excluded case-wise from analyses. Exceptions were:
• For KS2 scaled scores in reading and mathematics, we distinguished between missing scores from pupils who were absent from the test (who we coded as missing), and pupils who scored below the level of the test (who we gave a score of 79, just below the lowest score in the valid range 80-120).
• For KS4, we gave all pupils who received an ‘Ungraded’ result in GCSE or who did not sit the relevant GCSE a 0, a score that again is just below the valid grades (which are 1-9).
Having described the data acquisition process and the obtained datasets, we will now move on to describe the key variable, namely the Proficiency in English Scale.
Description of the Proficiency in English Scale
A copy of the Proficiency in English Scale is included as Appendix 1. This gives the full statements about English language skills that teachers refer to in making a ‘best fit’ judgement as to the proficiency in English of each EAL pupil.
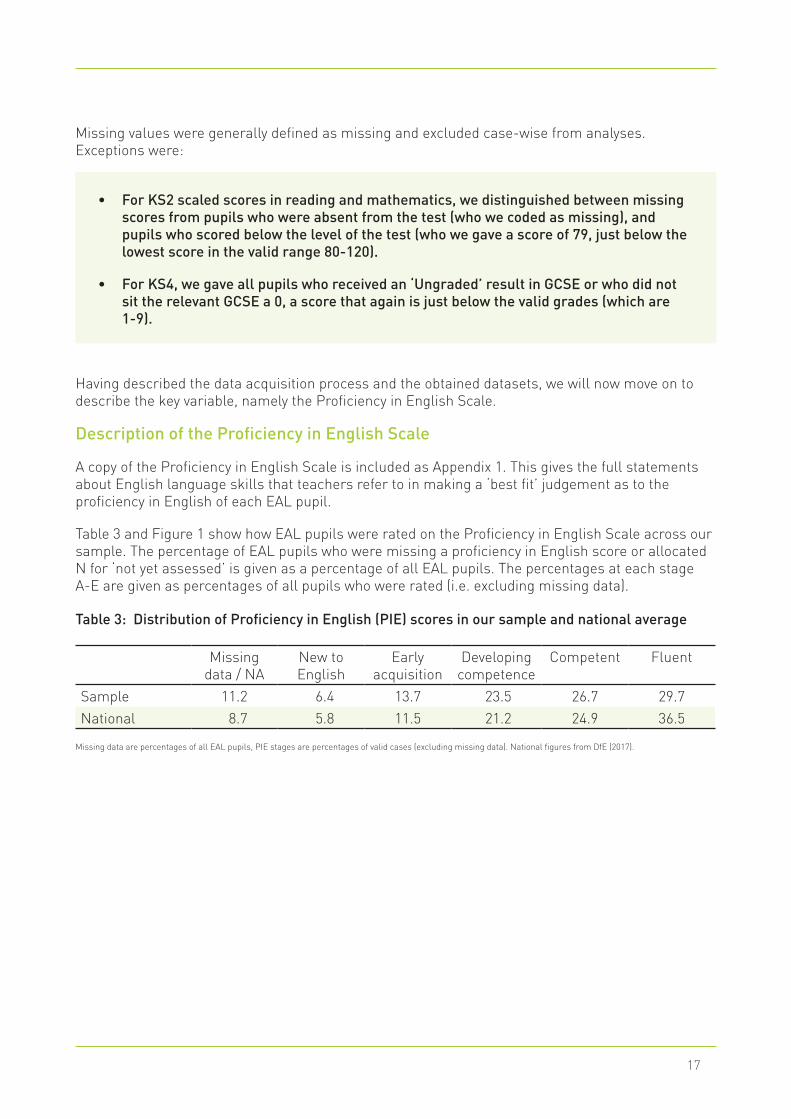
Table 3 and Figure 1 show how EAL pupils were rated on the Proficiency in English Scale across our sample. The percentage of EAL pupils who were missing a proficiency in English score or allocated N for ‘not yet assessed’ is given as a percentage of all EAL pupils. The percentages at each stage A-E are given as percentages of all pupils who were rated (i.e. excluding missing data).
Table 3: Distribution of Proficiency in English (PIE) scores in our sample and national average
Missing data / NA
New to English
Early acquisition
Developing competence
Competent Fluent
Sample 11.2 6.4 13.7 23.5 26.7 29.7National 8.7 5.8 11.5 21.2 24.9 36.5
Missing data are percentages of all EAL pupils, PIE stages are percentages of valid cases (excluding missing data). National figures from DfE (2017).
ENGLISH AS AN ADDITIONAL LANGUAGE, PROFICIENCY IN ENGLISH AND PUPILS’ EDUCATIONAL ACHIEVEMENT: AN ANALYSIS OF LOCAL AUTHORITY DATA
18
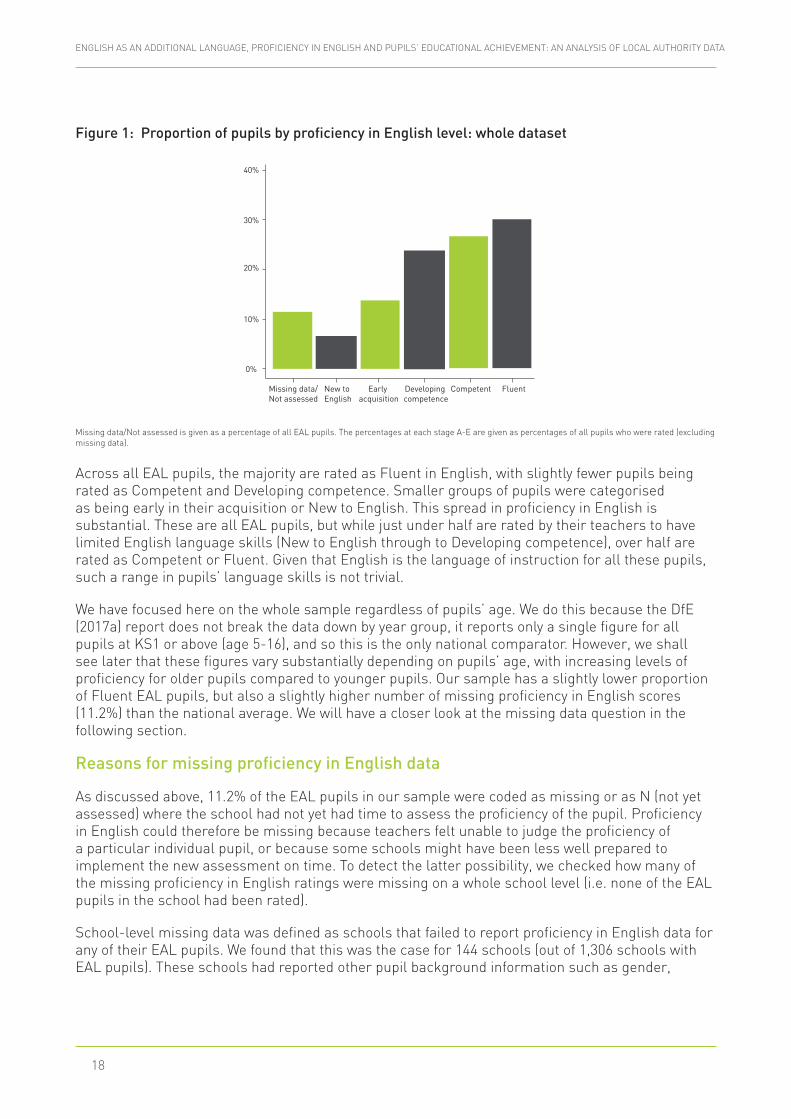
Figure 1: Proportion of pupils by proficiency in English level: whole dataset
Missing data/Not assessed
10%
0%
20%
30%
40%
New to English
Early acquisition
Developing competence
Competent Fluent
Missing data/Not assessed is given as a percentage of all EAL pupils. The percentages at each stage A-E are given as percentages of all pupils who were rated (excluding missing data).
Across all EAL pupils, the majority are rated as Fluent in English, with slightly fewer pupils being rated as Competent and Developing competence. Smaller groups of pupils were categorised as being early in their acquisition or New to English. This spread in proficiency in English is substantial. These are all EAL pupils, but while just under half are rated by their teachers to have limited English language skills (New to English through to Developing competence), over half are rated as Competent or Fluent. Given that English is the language of instruction for all these pupils, such a range in pupils’ language skills is not trivial.
We have focused here on the whole sample regardless of pupils’ age. We do this because the DfE (2017a) report does not break the data down by year group, it reports only a single figure for all pupils at KS1 or above (age 5-16), and so this is the only national comparator. However, we shall see later that these figures vary substantially depending on pupils’ age, with increasing levels of proficiency for older pupils compared to younger pupils. Our sample has a slightly lower proportion of Fluent EAL pupils, but also a slightly higher number of missing proficiency in English scores (11.2%) than the national average. We will have a closer look at the missing data question in the following section.
Reasons for missing proficiency in English data
As discussed above, 11.2% of the EAL pupils in our sample were coded as missing or as N (not yet assessed) where the school had not yet had time to assess the proficiency of the pupil. Proficiency in English could therefore be missing because teachers felt unable to judge the proficiency of a particular individual pupil, or because some schools might have been less well prepared to implement the new assessment on time. To detect the latter possibility, we checked how many of the missing proficiency in English ratings were missing on a whole school level (i.e. none of the EAL pupils in the school had been rated).
School-level missing data was defined as schools that failed to report proficiency in English data for any of their EAL pupils. We found that this was the case for 144 schools (out of 1,306 schools with EAL pupils). These schools had reported other pupil background information such as gender,
19
Socio-Economic Status (SES), and ethnicity, as well as pupil grades, but no proficiency in English score for their EAL pupils. Of these schools, 80 were primary schools, 61 were secondary schools, and three had both primary and secondary pupils. In total, 2,361 EAL pupils in our sample were missing a proficiency in English score because their school had not reported it. This amounts to more than half of the missing proficiency in English data.
We conclude that a large proportion of the missing proficiency ratings reflect whole school issues around implementation in January 2017. We would expect the number of missing cases in the January 2018 census to be much lower as schools adjust to the new requirements. However, we do not have the data to answer this as the DfE has chosen to exclude proficiency in English from the NPD.
Variation between Local Authorities
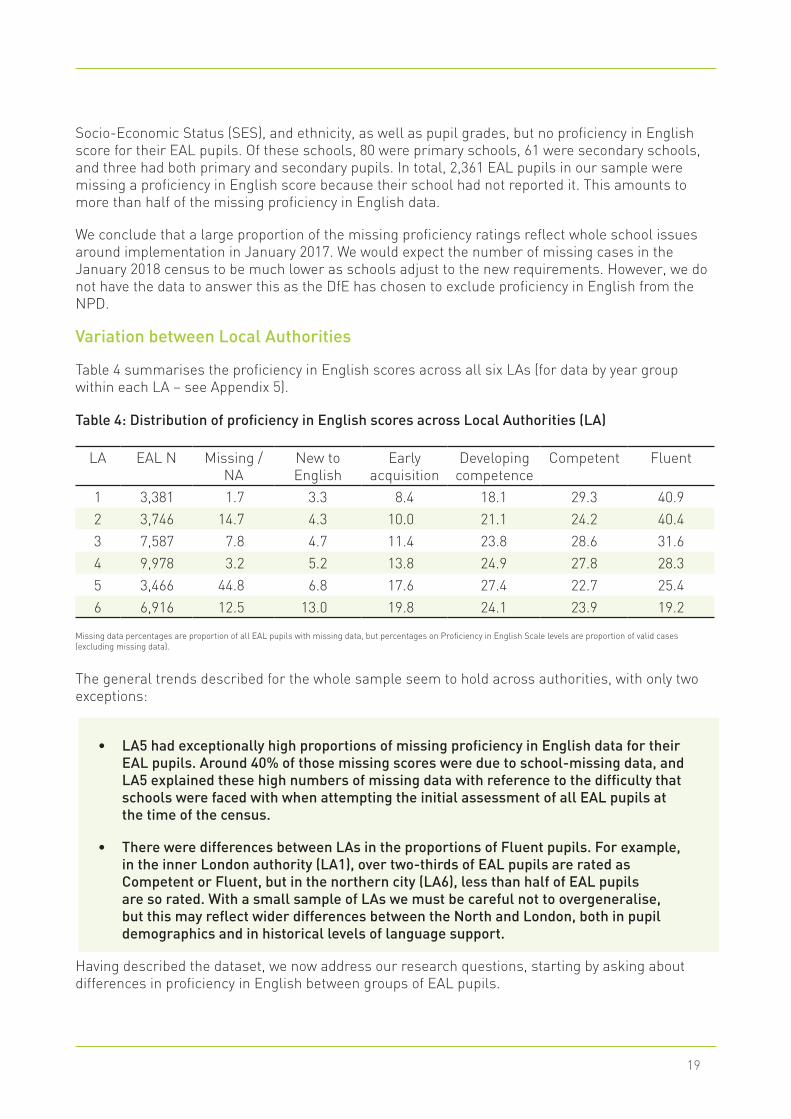
Table 4 summarises the proficiency in English scores across all six LAs (for data by year group within each LA – see Appendix 5).
The general trends described for the whole sample seem to hold across authorities, with only two exceptions:
• LA5 had exceptionally high proportions of missing proficiency in English data for their EAL pupils. Around 40% of those missing scores were due to school-missing data, and LA5 explained these high numbers of missing data with reference to the difficulty that schools were faced with when attempting the initial assessment of all EAL pupils at the time of the census.
• There were differences between LAs in the proportions of Fluent pupils. For example, in the inner London authority (LA1), over two-thirds of EAL pupils are rated as Competent or Fluent, but in the northern city (LA6), less than half of EAL pupils are so rated. With a small sample of LAs we must be careful not to overgeneralise, but this may reflect wider differences between the North and London, both in pupil demographics and in historical levels of language support.
Having described the dataset, we now address our research questions, starting by asking about differences in proficiency in English between groups of EAL pupils.
Table 4: Distribution of proficiency in English scores across Local Authorities (LA)
LA EAL N Missing / NA
New to English
Early acquisition
Developing competence
Competent Fluent
1 3,381 1.7 3.3 8.4 18.1 29.3 40.92 3,746 14.7 4.3 10.0 21.1 24.2 40.43 7,587 7.8 4.7 11.4 23.8 28.6 31.64 9,978 3.2 5.2 13.8 24.9 27.8 28.35 3,466 44.8 6.8 17.6 27.4 22.7 25.46 6,916 12.5 13.0 19.8 24.1 23.9 19.2
Missing data percentages are proportion of all EAL pupils with missing data, but percentages on Proficiency in English Scale levels are proportion of valid cases (excluding missing data).
ENGLISH AS AN ADDITIONAL LANGUAGE, PROFICIENCY IN ENGLISH AND PUPILS’ EDUCATIONAL ACHIEVEMENT: AN ANALYSIS OF LOCAL AUTHORITY DATA
20
Results
Do groups of EAL pupils differ in their English proficiency?
To explore the differences in proficiency in English between groups of pupils, we compared EAL learners’ PIE ratings across year groups, between boys and girls, and by eligibility for FSM.
Year groups
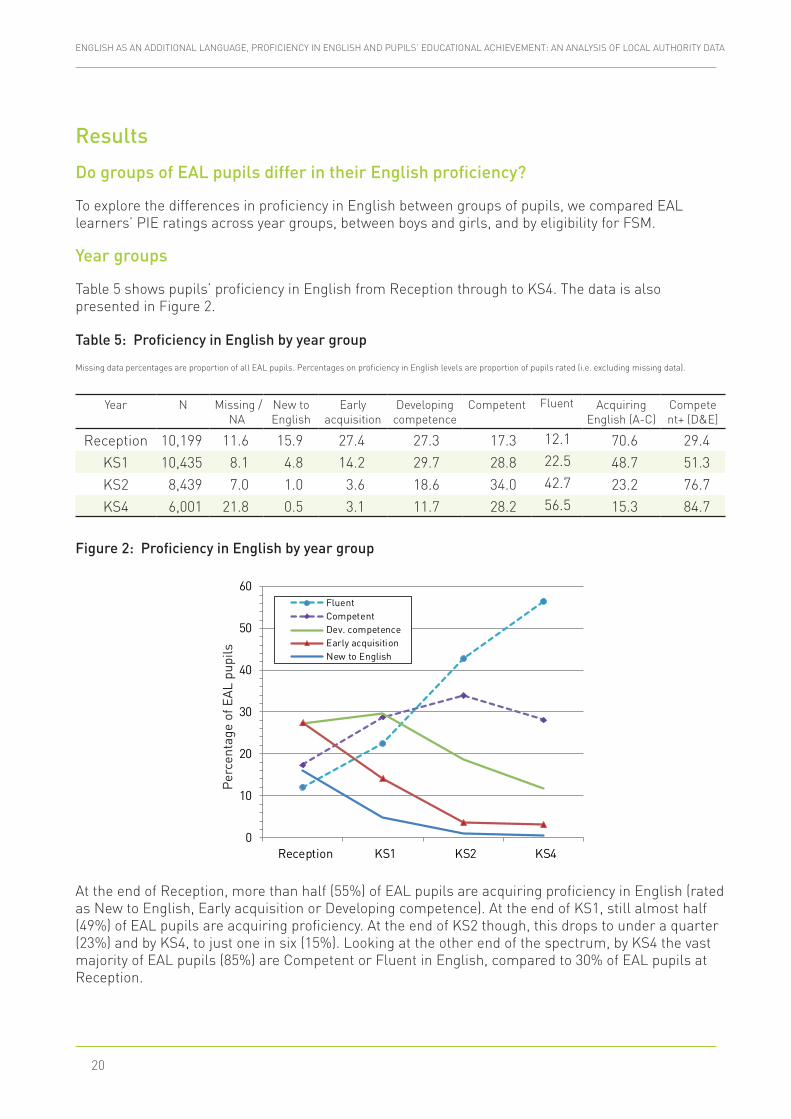
Table 5 shows pupils’ proficiency in English from Reception through to KS4. The data is also presented in Figure 2.
Table 5: Proficiency in English by year group
Missing data percentages are proportion of all EAL pupils. Percentages on proficiency in English levels are proportion of pupils rated (i.e. excluding missing data).
Figure 2: Proficiency in English by year group
0
10
20
30
40
50
60
Reception KS1 KS2 KS4
Per
cent
age
of E
AL
pupi
ls
FluentCompetentDev. competenceEarly acquisitionNew to English
At the end of Reception, more than half (55%) of EAL pupils are acquiring proficiency in English (rated as New to English, Early acquisition or Developing competence). At the end of KS1, still almost half (49%) of EAL pupils are acquiring proficiency. At the end of KS2 though, this drops to under a quarter (23%) and by KS4, to just one in six (15%). Looking at the other end of the spectrum, by KS4 the vast majority of EAL pupils (85%) are Competent or Fluent in English, compared to 30% of EAL pupils at Reception.
Year N Missing / NA
New to English
Early acquisition
Developing competence
Competent Fluent Acquiring English (A-C)
Compete nt+ (D&E]
Reception 10,199 11.6 15.9 27.4 27.3 17.3 12.1 70.6 29.4KS1 10,435 8.1 4.8 14.2 29.7 28.8 22.5 48.7 51.3KS2 8,439 7.0 1.0 3.6 18.6 34.0 42.7 23.2 76.7KS4 6,001 21.8 0.5 3.1 11.7 28.2 56.5 15.3 84.7
21
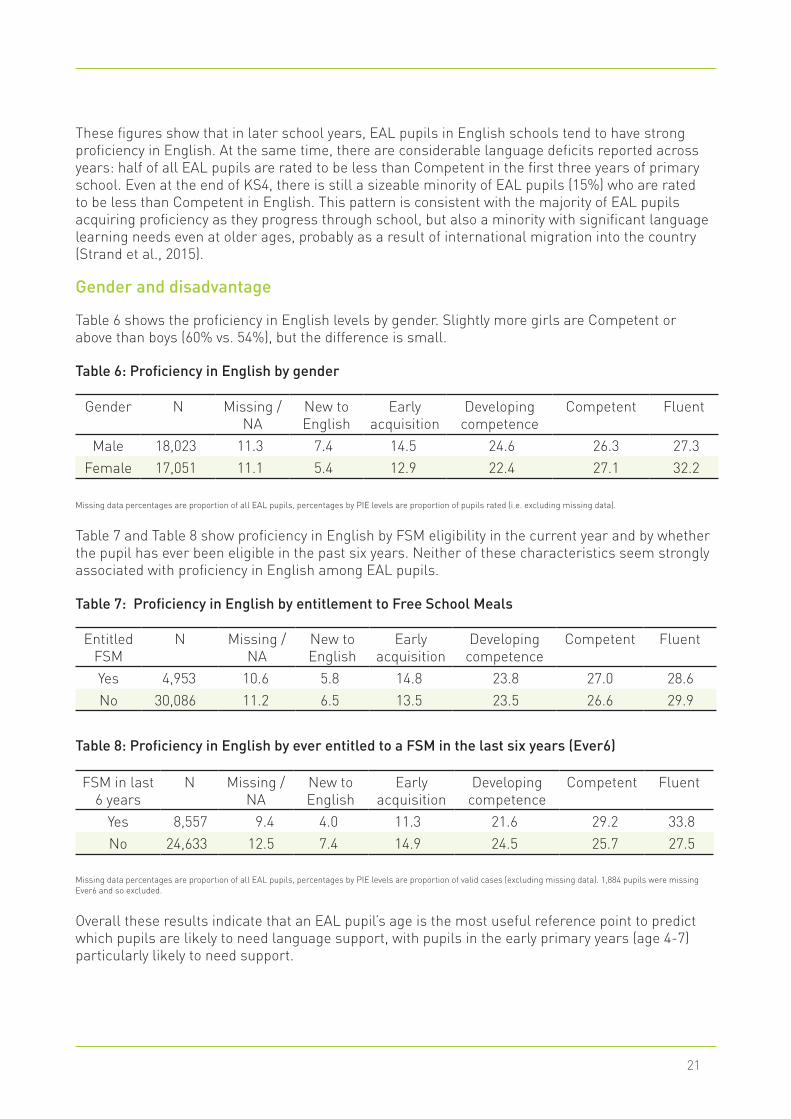
These figures show that in later school years, EAL pupils in English schools tend to have strong proficiency in English. At the same time, there are considerable language deficits reported across years: half of all EAL pupils are rated to be less than Competent in the first three years of primary school. Even at the end of KS4, there is still a sizeable minority of EAL pupils (15%) who are rated to be less than Competent in English. This pattern is consistent with the majority of EAL pupils acquiring proficiency as they progress through school, but also a minority with significant language learning needs even at older ages, probably as a result of international migration into the country (Strand et al., 2015).
Gender and disadvantage
Table 6 shows the proficiency in English levels by gender. Slightly more girls are Competent or above than boys (60% vs. 54%), but the difference is small.
Table 6: Proficiency in English by gender
Missing data percentages are proportion of all EAL pupils, percentages by PIE levels are proportion of pupils rated (i.e. excluding missing data).
Table 7 and Table 8 show proficiency in English by FSM eligibility in the current year and by whether the pupil has ever been eligible in the past six years. Neither of these characteristics seem strongly associated with proficiency in English among EAL pupils.
Table 7: Proficiency in English by entitlement to Free School Meals
Table 8: Proficiency in English by ever entitled to a FSM in the last six years (Ever6)
Missing data percentages are proportion of all EAL pupils, percentages by PIE levels are proportion of valid cases (excluding missing data). 1,884 pupils were missing Ever6 and so excluded.
Overall these results indicate that an EAL pupil’s age is the most useful reference point to predict which pupils are likely to need language support, with pupils in the early primary years (age 4-7) particularly likely to need support.
Gender N Missing / NA
New to English
Early acquisition
Developing competence
Competent Fluent
Male 18,023 11.3 7.4 14.5 24.6 26.3 27.3Female 17,051 11.1 5.4 12.9 22.4 27.1 32.2
Entitled FSM
N Missing / NA
New to English
Early acquisition
Developing competence
Competent Fluent
Yes 4,953 10.6 5.8 14.8 23.8 27.0 28.6No 30,086 11.2 6.5 13.5 23.5 26.6 29.9
FSM in last 6 years
N Missing / NA
New to English
Early acquisition
Developing competence
Competent Fluent
Yes 8,557 9.4 4.0 11.3 21.6 29.2 33.8No 24,633 12.5 7.4 14.9 24.5 25.7 27.5
ENGLISH AS AN ADDITIONAL LANGUAGE, PROFICIENCY IN ENGLISH AND PUPILS’ EDUCATIONAL ACHIEVEMENT: AN ANALYSIS OF LOCAL AUTHORITY DATA
22
Is EAL pupils’ proficiency in English linked to their educational attainment?
Early Years Foundation Stage Profile (EYFSP) age 5
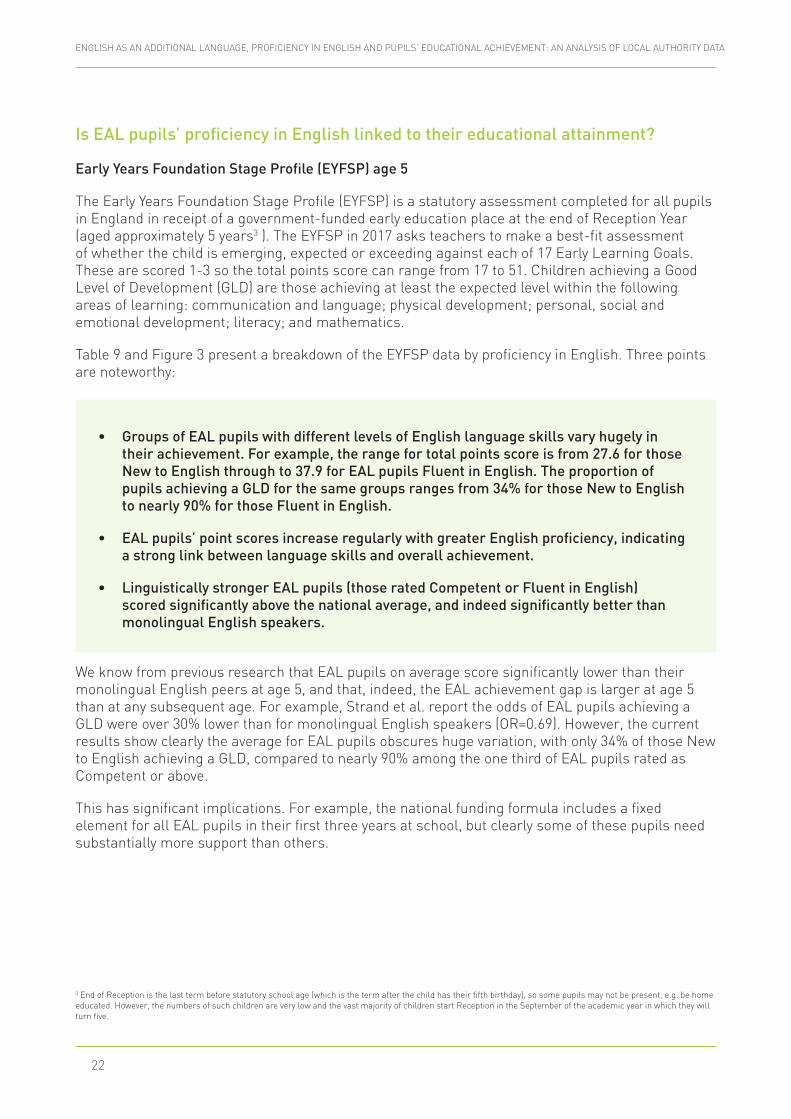
The Early Years Foundation Stage Profile (EYFSP) is a statutory assessment completed for all pupils in England in receipt of a government-funded early education place at the end of Reception Year (aged approximately 5 years3 ). The EYFSP in 2017 asks teachers to make a best-fit assessment of whether the child is emerging, expected or exceeding against each of 17 Early Learning Goals. These are scored 1-3 so the total points score can range from 17 to 51. Children achieving a Good Level of Development (GLD) are those achieving at least the expected level within the following areas of learning: communication and language; physical development; personal, social and emotional development; literacy; and mathematics.
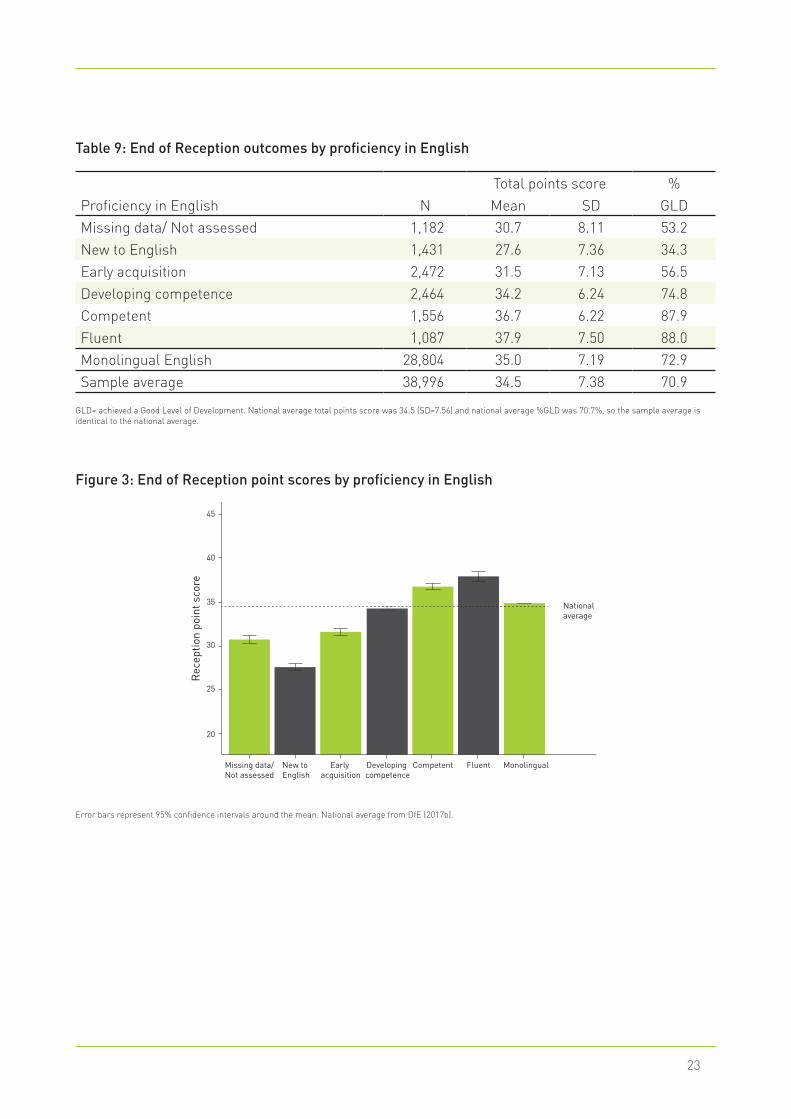
Table 9 and Figure 3 present a breakdown of the EYFSP data by proficiency in English. Three points are noteworthy:
• Groups of EAL pupils with different levels of English language skills vary hugely in their achievement. For example, the range for total points score is from 27.6 for those New to English through to 37.9 for EAL pupils Fluent in English. The proportion of pupils achieving a GLD for the same groups ranges from 34% for those New to English to nearly 90% for those Fluent in English.
• EAL pupils’ point scores increase regularly with greater English proficiency, indicating a strong link between language skills and overall achievement.
• Linguistically stronger EAL pupils (those rated Competent or Fluent in English) scored significantly above the national average, and indeed significantly better than monolingual English speakers.
We know from previous research that EAL pupils on average score significantly lower than their monolingual English peers at age 5, and that, indeed, the EAL achievement gap is larger at age 5 than at any subsequent age. For example, Strand et al. report the odds of EAL pupils achieving a GLD were over 30% lower than for monolingual English speakers (OR=0.69). However, the current results show clearly the average for EAL pupils obscures huge variation, with only 34% of those New to English achieving a GLD, compared to nearly 90% among the one third of EAL pupils rated as Competent or above.
This has significant implications. For example, the national funding formula includes a fixed element for all EAL pupils in their first three years at school, but clearly some of these pupils need substantially more support than others.
3 End of Reception is the last term before statutory school age (which is the term after the child has their fifth birthday), so some pupils may not be present, e.g. be home educated. However, the numbers of such children are very low and the vast majority of children start Reception in the September of the academic year in which they will turn five.
23
Table 9: End of Reception outcomes by proficiency in English
Figure 3: End of Reception point scores by proficiency in English
Missing data/Not assessed
20
25
30
35
40
45
New to English
Rec
eptio
n po
int s
core
Early acquisition
Developing competence
Competent Fluent Monolingual
National average
Error bars represent 95% confidence intervals around the mean. National average from DfE (2017b).
Total points score % Proficiency in English N Mean SD GLDMissing data/ Not assessed 1,182 30.7 8.11 53.2New to English 1,431 27.6 7.36 34.3Early acquisition 2,472 31.5 7.13 56.5Developing competence 2,464 34.2 6.24 74.8Competent 1,556 36.7 6.22 87.9Fluent 1,087 37.9 7.50 88.0Monolingual English 28,804 35.0 7.19 72.9Sample average 38,996 34.5 7.38 70.9
GLD= achieved a Good Level of Development. National average total points score was 34.5 (SD=7.56) and national average %GLD was 70.7%, so the sample average is identical to the national average.
ENGLISH AS AN ADDITIONAL LANGUAGE, PROFICIENCY IN ENGLISH AND PUPILS’ EDUCATIONAL ACHIEVEMENT: AN ANALYSIS OF LOCAL AUTHORITY DATA
24
KS1 achievement (age 7)
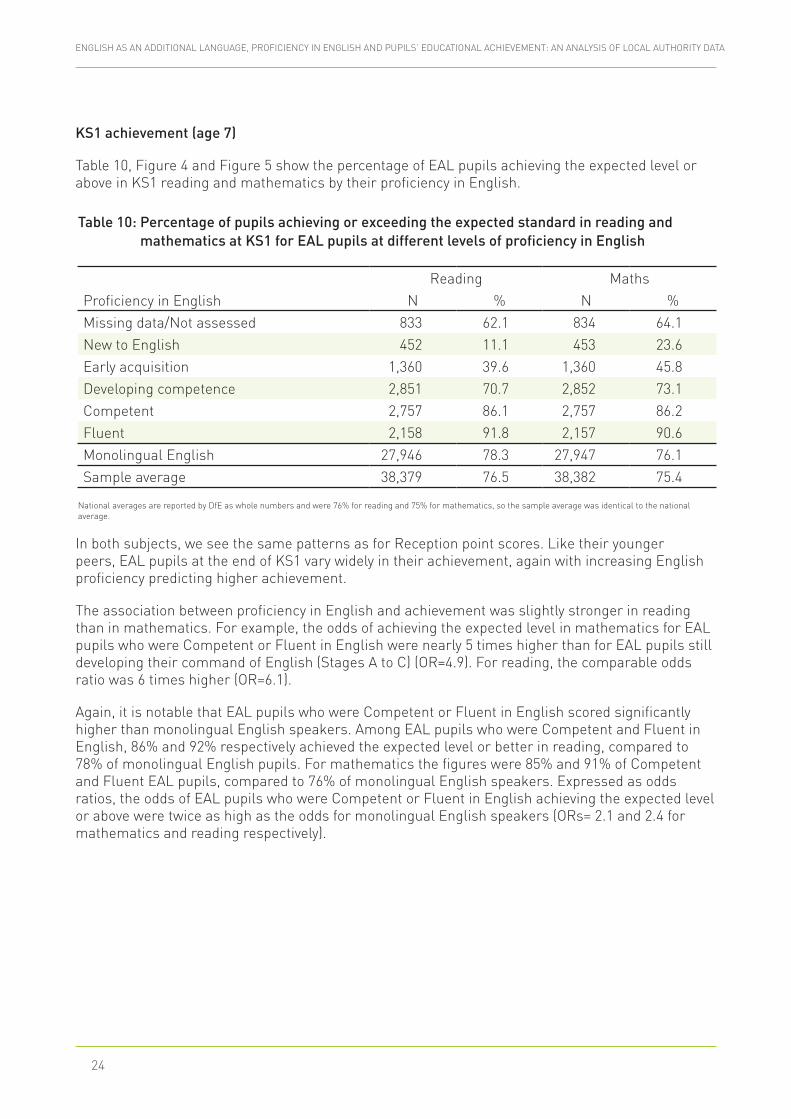
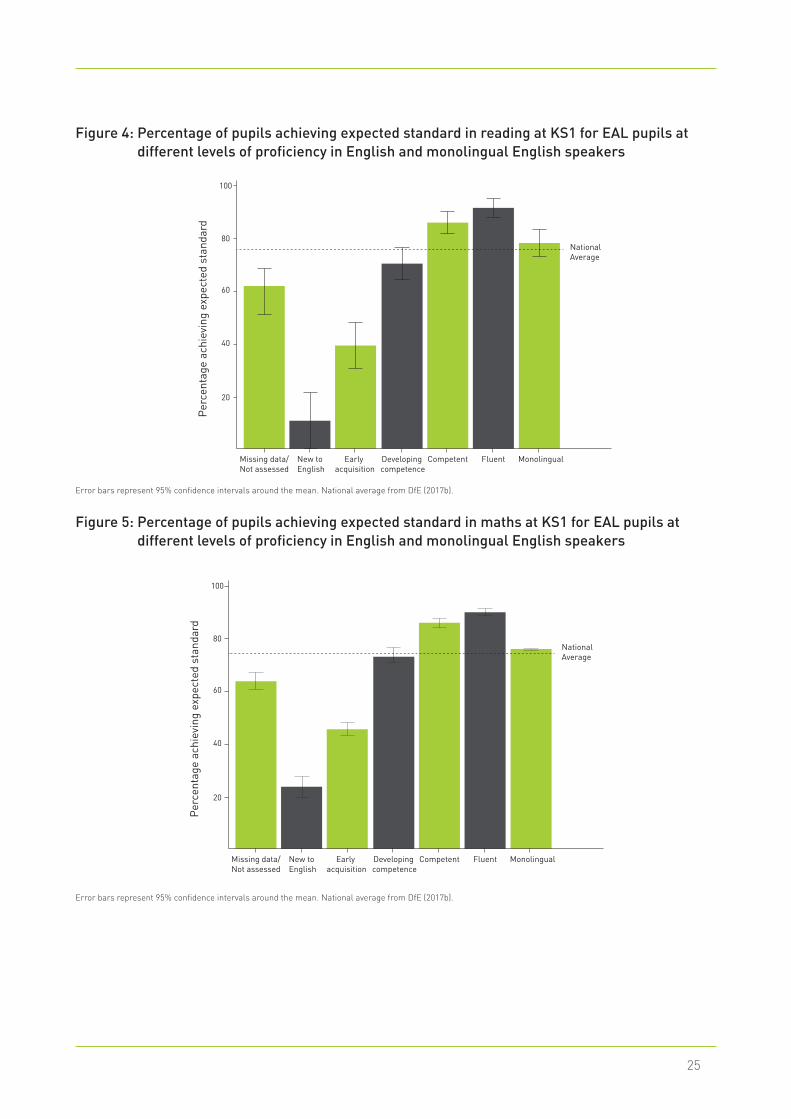
Table 10, Figure 4 and Figure 5 show the percentage of EAL pupils achieving the expected level or above in KS1 reading and mathematics by their proficiency in English.
In both subjects, we see the same patterns as for Reception point scores. Like their younger peers, EAL pupils at the end of KS1 vary widely in their achievement, again with increasing English proficiency predicting higher achievement.
The association between proficiency in English and achievement was slightly stronger in reading than in mathematics. For example, the odds of achieving the expected level in mathematics for EAL pupils who were Competent or Fluent in English were nearly 5 times higher than for EAL pupils still developing their command of English (Stages A to C) (OR=4.9). For reading, the comparable odds ratio was 6 times higher (OR=6.1).
Again, it is notable that EAL pupils who were Competent or Fluent in English scored significantly higher than monolingual English speakers. Among EAL pupils who were Competent and Fluent in English, 86% and 92% respectively achieved the expected level or better in reading, compared to 78% of monolingual English pupils. For mathematics the figures were 85% and 91% of Competent and Fluent EAL pupils, compared to 76% of monolingual English speakers. Expressed as odds ratios, the odds of EAL pupils who were Competent or Fluent in English achieving the expected level or above were twice as high as the odds for monolingual English speakers (ORs= 2.1 and 2.4 for mathematics and reading respectively).
Table 10: Percentage of pupils achieving or exceeding the expected standard in reading and mathematics at KS1 for EAL pupils at different levels of proficiency in English
Reading MathsProficiency in English N % N %Missing data/Not assessed 833 62.1 834 64.1New to English 452 11.1 453 23.6Early acquisition 1,360 39.6 1,360 45.8Developing competence 2,851 70.7 2,852 73.1Competent 2,757 86.1 2,757 86.2Fluent 2,158 91.8 2,157 90.6Monolingual English 27,946 78.3 27,947 76.1Sample average 38,379 76.5 38,382 75.4
National averages are reported by DfE as whole numbers and were 76% for reading and 75% for mathematics, so the sample average was identical to the national average.
25
Figure 4: Percentage of pupils achieving expected standard in reading at KS1 for EAL pupils at different levels of proficiency in English and monolingual English speakers
Missing data/Not assessed
20
40
60
80
100
New to English
Per
cent
age
achi
evin
g ex
pect
ed s
tand
ard
Early acquisition
Developing competence
Competent Fluent Monolingual
National Average
Error bars represent 95% confidence intervals around the mean. National average from DfE (2017b).
Figure 5: Percentage of pupils achieving expected standard in maths at KS1 for EAL pupils at different levels of proficiency in English and monolingual English speakers
Missing data/Not assessed
20
40
60
80
100
New to English
Per
cent
age
achi
evin
g ex
pect
ed s
tand
ard
Early acquisition
Developing competence
Competent Fluent Monolingual
National Average
Error bars represent 95% confidence intervals around the mean. National average from DfE (2017b).
ENGLISH AS AN ADDITIONAL LANGUAGE, PROFICIENCY IN ENGLISH AND PUPILS’ EDUCATIONAL ACHIEVEMENT: AN ANALYSIS OF LOCAL AUTHORITY DATA
26
KS2 achievement (age 11)
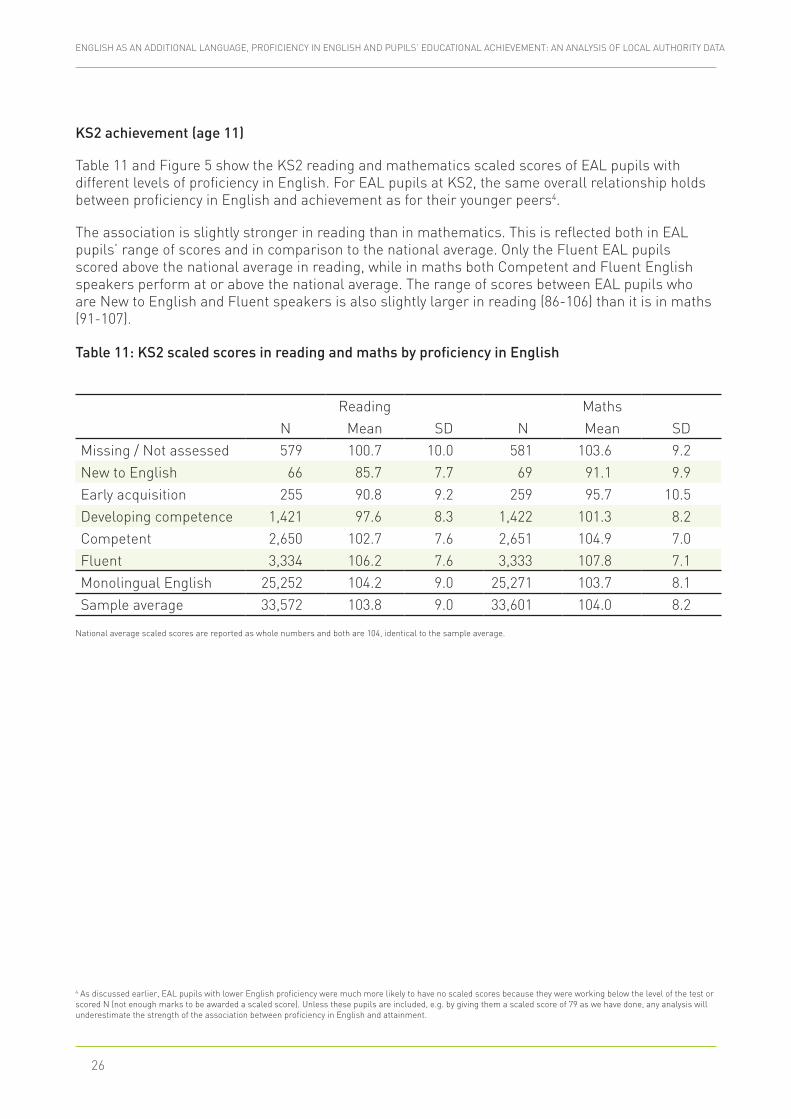
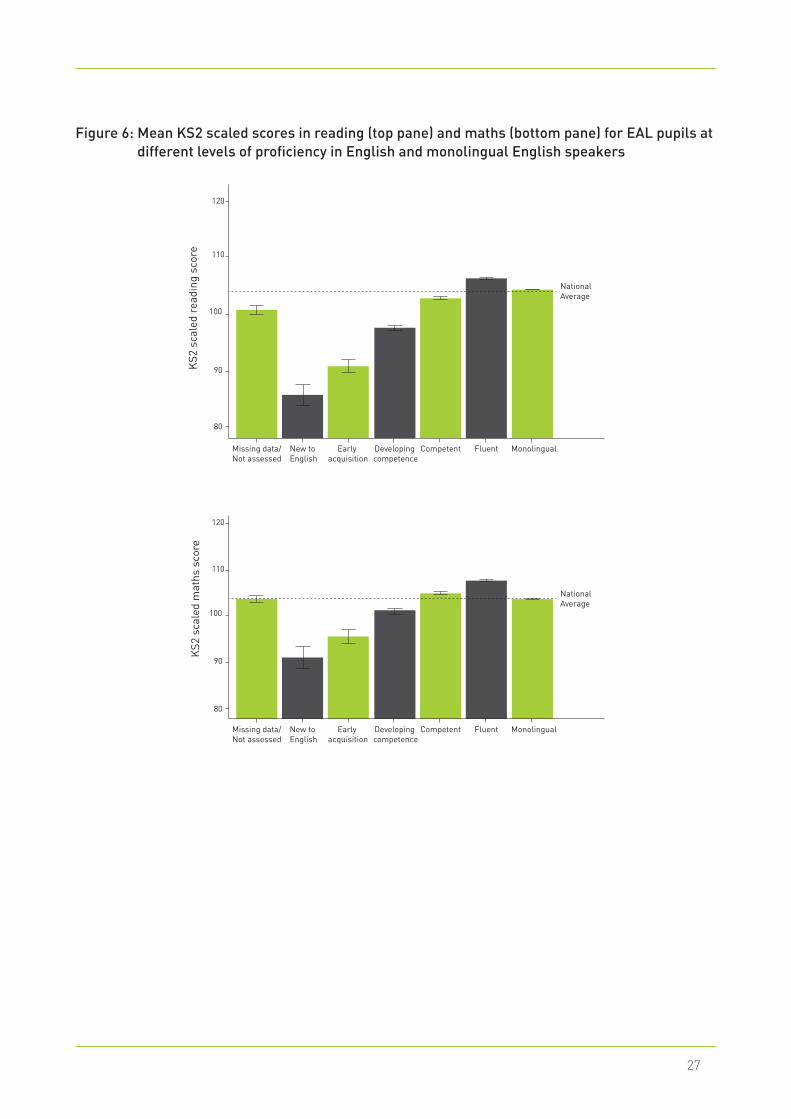
Table 11 and Figure 5 show the KS2 reading and mathematics scaled scores of EAL pupils with different levels of proficiency in English. For EAL pupils at KS2, the same overall relationship holds between proficiency in English and achievement as for their younger peers4.
The association is slightly stronger in reading than in mathematics. This is reflected both in EAL pupils’ range of scores and in comparison to the national average. Only the Fluent EAL pupils scored above the national average in reading, while in maths both Competent and Fluent English speakers perform at or above the national average. The range of scores between EAL pupils who are New to English and Fluent speakers is also slightly larger in reading (86-106) than it is in maths (91-107).
Table 11: KS2 scaled scores in reading and maths by proficiency in English
Reading MathsN Mean SD N Mean SD
Missing / Not assessed 579 100.7 10.0 581 103.6 9.2New to English 66 85.7 7.7 69 91.1 9.9Early acquisition 255 90.8 9.2 259 95.7 10.5Developing competence 1,421 97.6 8.3 1,422 101.3 8.2Competent 2,650 102.7 7.6 2,651 104.9 7.0Fluent 3,334 106.2 7.6 3,333 107.8 7.1Monolingual English 25,252 104.2 9.0 25,271 103.7 8.1Sample average 33,572 103.8 9.0 33,601 104.0 8.2
National average scaled scores are reported as whole numbers and both are 104, identical to the sample average.
4 As discussed earlier, EAL pupils with lower English proficiency were much more likely to have no scaled scores because they were working below the level of the test or scored N (not enough marks to be awarded a scaled score). Unless these pupils are included, e.g. by giving them a scaled score of 79 as we have done, any analysis will underestimate the strength of the association between proficiency in English and attainment.
27
Figure 6: Mean KS2 scaled scores in reading (top pane) and maths (bottom pane) for EAL pupils at different levels of proficiency in English and monolingual English speakers
Missing data/Not assessed
80
90
100
110
120
New to English
KS2
sca
led
read
ing
scor
e
Early acquisition
Developing competence
Competent Fluent Monolingual
National Average
Missing data/Not assessed
80
90
100
110
120
New to English
KS2
sca
led
mat
hs s
core
Early acquisition
Developing competence
Competent Fluent Monolingual
National Average
ENGLISH AS AN ADDITIONAL LANGUAGE, PROFICIENCY IN ENGLISH AND PUPILS’ EDUCATIONAL ACHIEVEMENT: AN ANALYSIS OF LOCAL AUTHORITY DATA
28
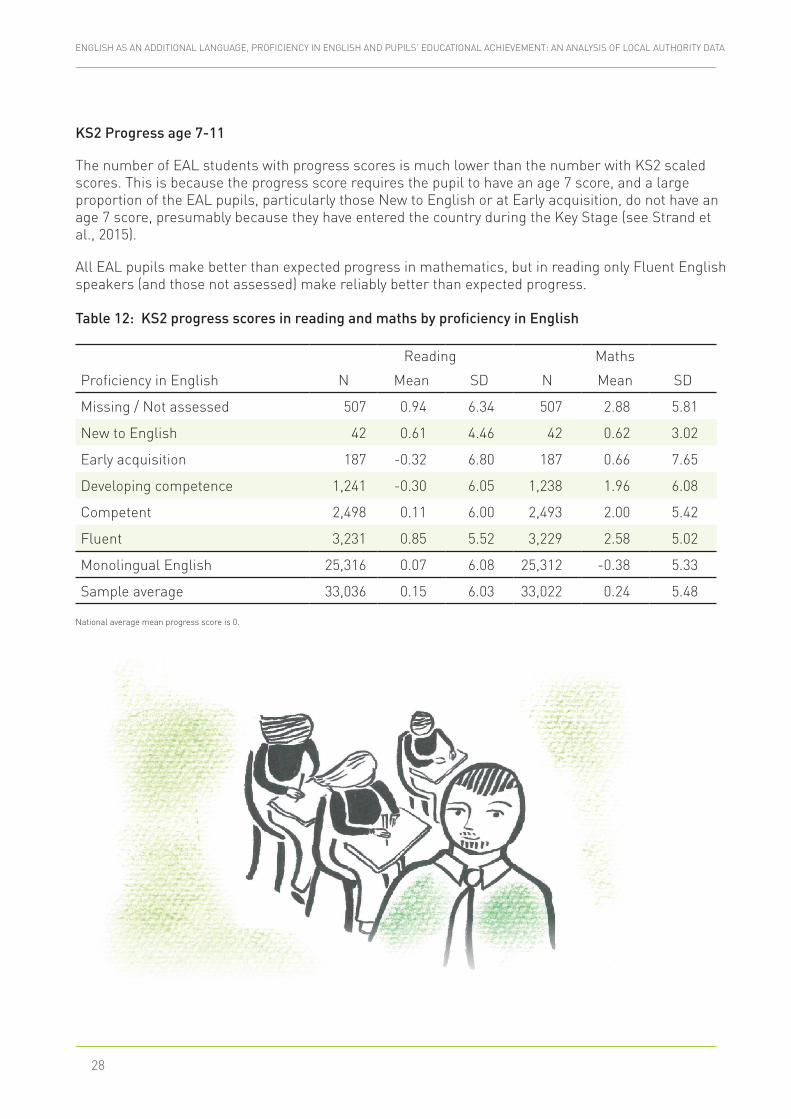
KS2 Progress age 7-11
The number of EAL students with progress scores is much lower than the number with KS2 scaled scores. This is because the progress score requires the pupil to have an age 7 score, and a large proportion of the EAL pupils, particularly those New to English or at Early acquisition, do not have an age 7 score, presumably because they have entered the country during the Key Stage (see Strand et al., 2015).
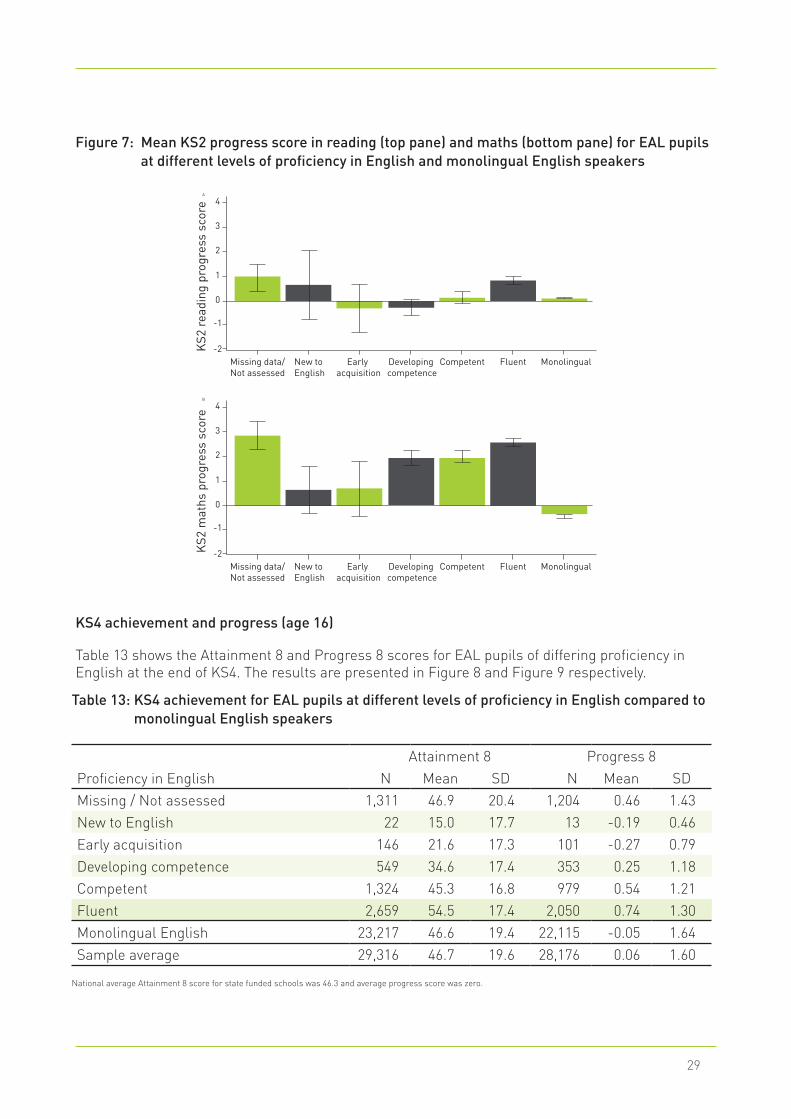
All EAL pupils make better than expected progress in mathematics, but in reading only Fluent English speakers (and those not assessed) make reliably better than expected progress.
Table 12: KS2 progress scores in reading and maths by proficiency in English
Reading Maths
Proficiency in English N Mean SD N Mean SD
Missing / Not assessed 507 0.94 6.34 507 2.88 5.81
New to English 42 0.61 4.46 42 0.62 3.02
Early acquisition 187 -0.32 6.80 187 0.66 7.65
Developing competence 1,241 -0.30 6.05 1,238 1.96 6.08
Competent 2,498 0.11 6.00 2,493 2.00 5.42
Fluent 3,231 0.85 5.52 3,229 2.58 5.02
Monolingual English 25,316 0.07 6.08 25,312 -0.38 5.33
Sample average 33,036 0.15 6.03 33,022 0.24 5.48
National average mean progress score is 0.
29
Figure 7: Mean KS2 progress score in reading (top pane) and maths (bottom pane) for EAL pupils at different levels of proficiency in English and monolingual English speakers
Missing data/Not assessed
-2
-1
1
2
3
4A
0
New to English
KS2
rea
ding
pro
gres
s sc
ore
Early acquisition
Developing competence
Competent Fluent Monolingual
Missing data/Not assessed
-2
-1
1
2
3
4B
0
New to English
KS2
mat
hs p
rogr
ess
scor
e
Early acquisition
Developing competence
Competent Fluent Monolingual
KS4 achievement and progress (age 16)
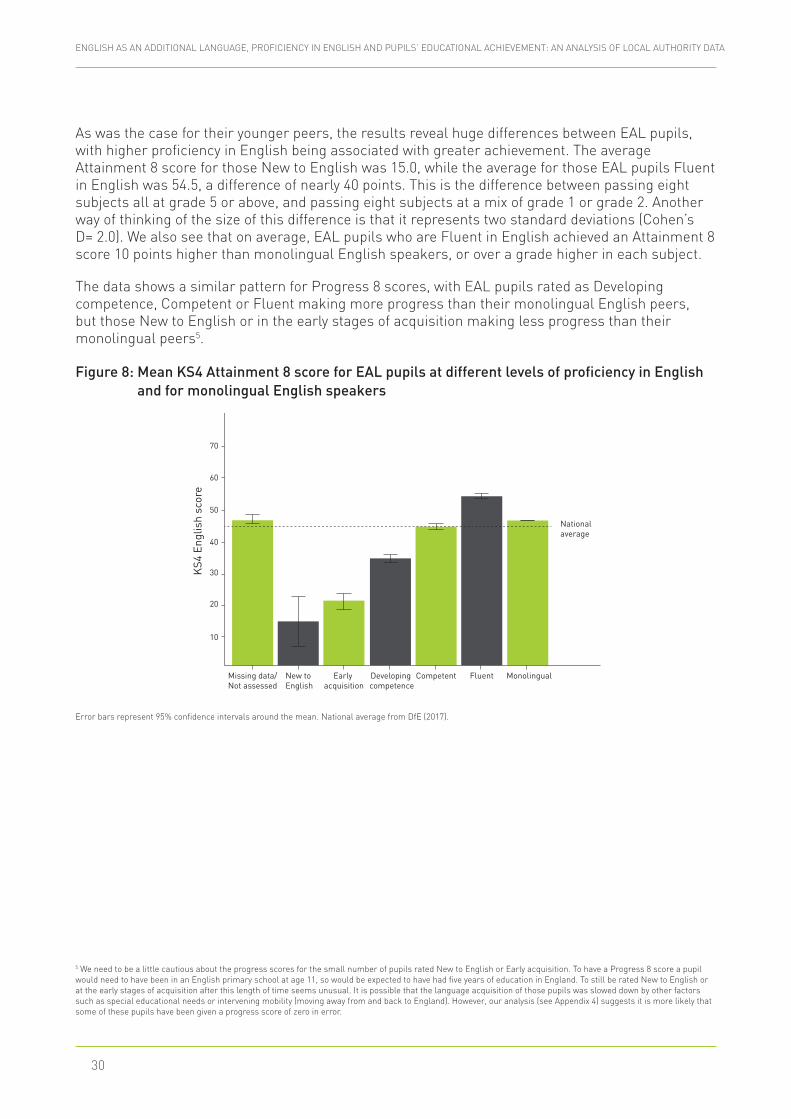
Table 13 shows the Attainment 8 and Progress 8 scores for EAL pupils of differing proficiency in English at the end of KS4. The results are presented in Figure 8 and Figure 9 respectively.
Table 13: KS4 achievement for EAL pupils at different levels of proficiency in English compared to monolingual English speakers
Attainment 8 Progress 8Proficiency in English N Mean SD N Mean SDMissing / Not assessed 1,311 46.9 20.4 1,204 0.46 1.43New to English 22 15.0 17.7 13 -0.19 0.46Early acquisition 146 21.6 17.3 101 -0.27 0.79Developing competence 549 34.6 17.4 353 0.25 1.18Competent 1,324 45.3 16.8 979 0.54 1.21Fluent 2,659 54.5 17.4 2,050 0.74 1.30Monolingual English 23,217 46.6 19.4 22,115 -0.05 1.64Sample average 29,316 46.7 19.6 28,176 0.06 1.60
National average Attainment 8 score for state funded schools was 46.3 and average progress score was zero.
ENGLISH AS AN ADDITIONAL LANGUAGE, PROFICIENCY IN ENGLISH AND PUPILS’ EDUCATIONAL ACHIEVEMENT: AN ANALYSIS OF LOCAL AUTHORITY DATA
30
As was the case for their younger peers, the results reveal huge differences between EAL pupils, with higher proficiency in English being associated with greater achievement. The average Attainment 8 score for those New to English was 15.0, while the average for those EAL pupils Fluent in English was 54.5, a difference of nearly 40 points. This is the difference between passing eight subjects all at grade 5 or above, and passing eight subjects at a mix of grade 1 or grade 2. Another way of thinking of the size of this difference is that it represents two standard deviations (Cohen’s D= 2.0). We also see that on average, EAL pupils who are Fluent in English achieved an Attainment 8 score 10 points higher than monolingual English speakers, or over a grade higher in each subject.
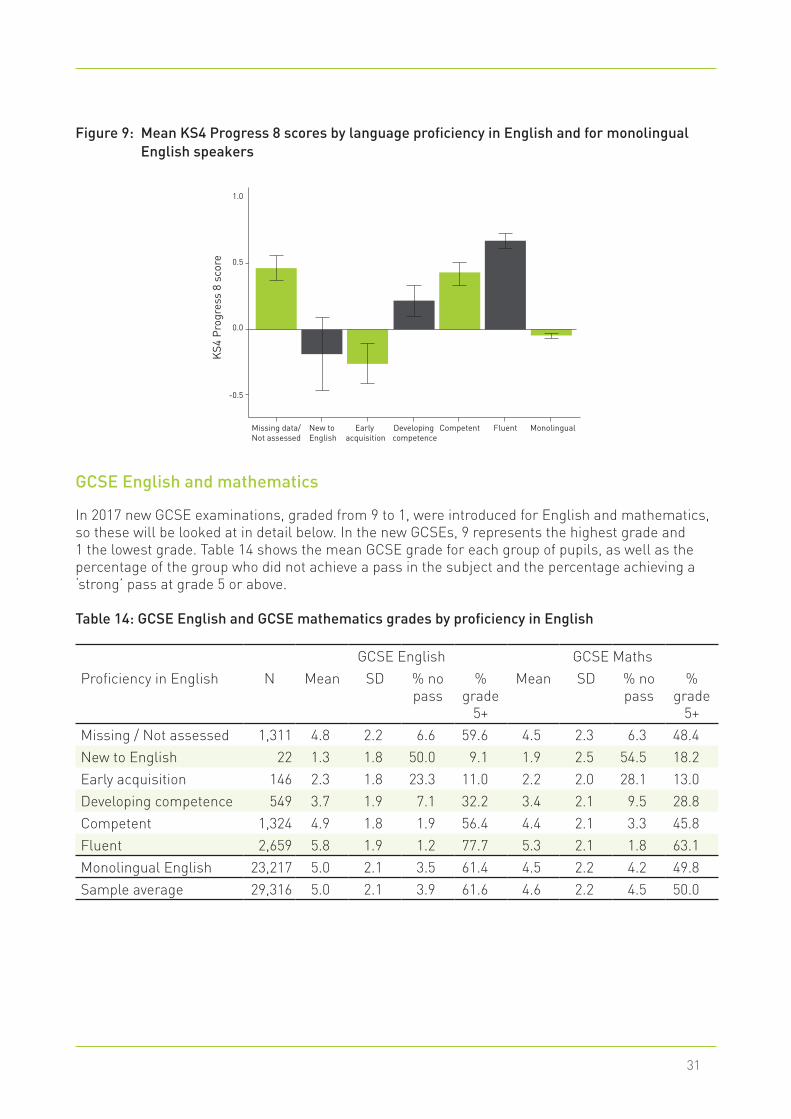
The data shows a similar pattern for Progress 8 scores, with EAL pupils rated as Developing competence, Competent or Fluent making more progress than their monolingual English peers, but those New to English or in the early stages of acquisition making less progress than their monolingual peers5.
Figure 8: Mean KS4 Attainment 8 score for EAL pupils at different levels of proficiency in English and for monolingual English speakers
Missing data/Not assessed
10
20
30
40
50
60
70
New to English
KS4
Eng
lish
scor
e
Early acquisition
Developing competence
Competent Fluent Monolingual
National average
Error bars represent 95% confidence intervals around the mean. National average from DfE (2017).
5 We need to be a little cautious about the progress scores for the small number of pupils rated New to English or Early acquisition. To have a Progress 8 score a pupil would need to have been in an English primary school at age 11, so would be expected to have had five years of education in England. To still be rated New to English or at the early stages of acquisition after this length of time seems unusual. It is possible that the language acquisition of those pupils was slowed down by other factors such as special educational needs or intervening mobility (moving away from and back to England). However, our analysis (see Appendix 4) suggests it is more likely that some of these pupils have been given a progress score of zero in error.
31
Figure 9: Mean KS4 Progress 8 scores by language proficiency in English and for monolingual English speakers
Missing data/Not assessed
-0.5
0.0
0.5
1.0
New to English
KS4
Pro
gres
s 8
scor
e
Early acquisition
Developing competence
Competent Fluent Monolingual
GCSE English and mathematics
In 2017 new GCSE examinations, graded from 9 to 1, were introduced for English and mathematics, so these will be looked at in detail below. In the new GCSEs, 9 represents the highest grade and 1 the lowest grade. Table 14 shows the mean GCSE grade for each group of pupils, as well as the percentage of the group who did not achieve a pass in the subject and the percentage achieving a ‘strong’ pass at grade 5 or above.
Table 14: GCSE English and GCSE mathematics grades by proficiency in English
GCSE English GCSE MathsProficiency in English N Mean SD % no
pass%
grade 5+
Mean SD % no pass
% grade
5+Missing / Not assessed 1,311 4.8 2.2 6.6 59.6 4.5 2.3 6.3 48.4New to English 22 1.3 1.8 50.0 9.1 1.9 2.5 54.5 18.2Early acquisition 146 2.3 1.8 23.3 11.0 2.2 2.0 28.1 13.0Developing competence 549 3.7 1.9 7.1 32.2 3.4 2.1 9.5 28.8Competent 1,324 4.9 1.8 1.9 56.4 4.4 2.1 3.3 45.8Fluent 2,659 5.8 1.9 1.2 77.7 5.3 2.1 1.8 63.1Monolingual English 23,217 5.0 2.1 3.5 61.4 4.5 2.2 4.2 49.8Sample average 29,316 5.0 2.1 3.9 61.6 4.6 2.2 4.5 50.0
ENGLISH AS AN ADDITIONAL LANGUAGE, PROFICIENCY IN ENGLISH AND PUPILS’ EDUCATIONAL ACHIEVEMENT: AN ANALYSIS OF LOCAL AUTHORITY DATA
32
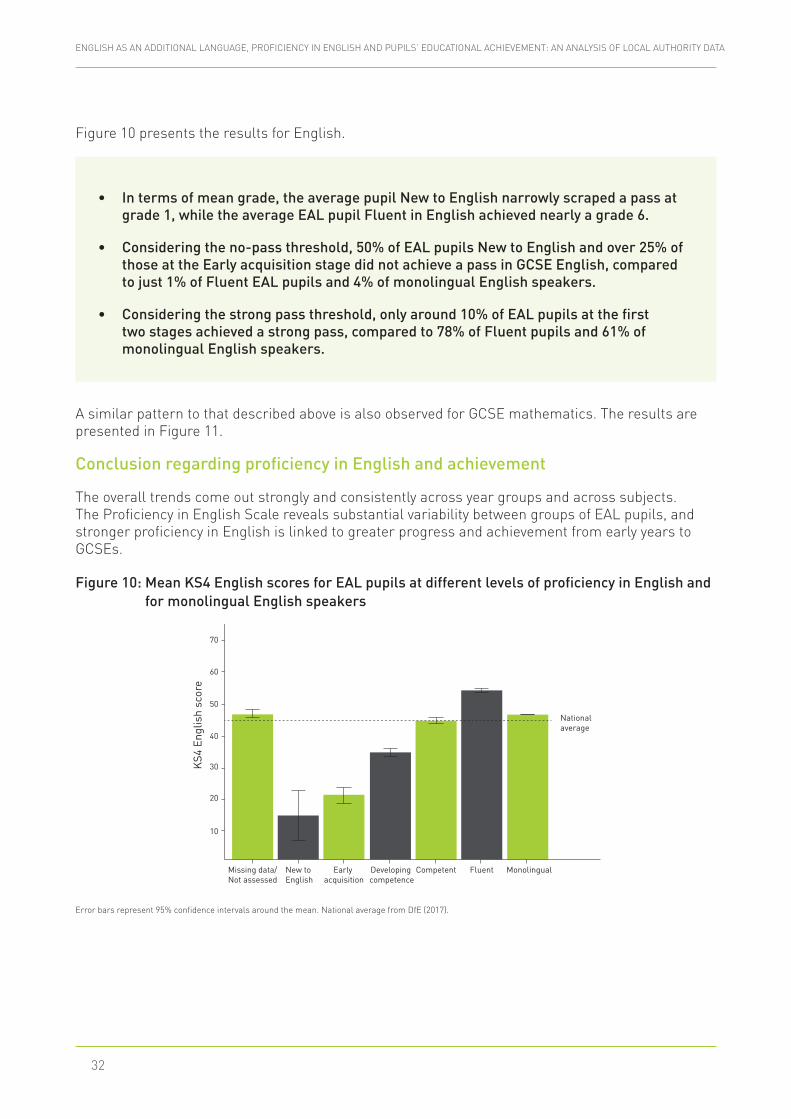
Figure 10 presents the results for English.
• In terms of mean grade, the average pupil New to English narrowly scraped a pass at grade 1, while the average EAL pupil Fluent in English achieved nearly a grade 6.
• Considering the no-pass threshold, 50% of EAL pupils New to English and over 25% of those at the Early acquisition stage did not achieve a pass in GCSE English, compared to just 1% of Fluent EAL pupils and 4% of monolingual English speakers.
• Considering the strong pass threshold, only around 10% of EAL pupils at the first two stages achieved a strong pass, compared to 78% of Fluent pupils and 61% of monolingual English speakers.
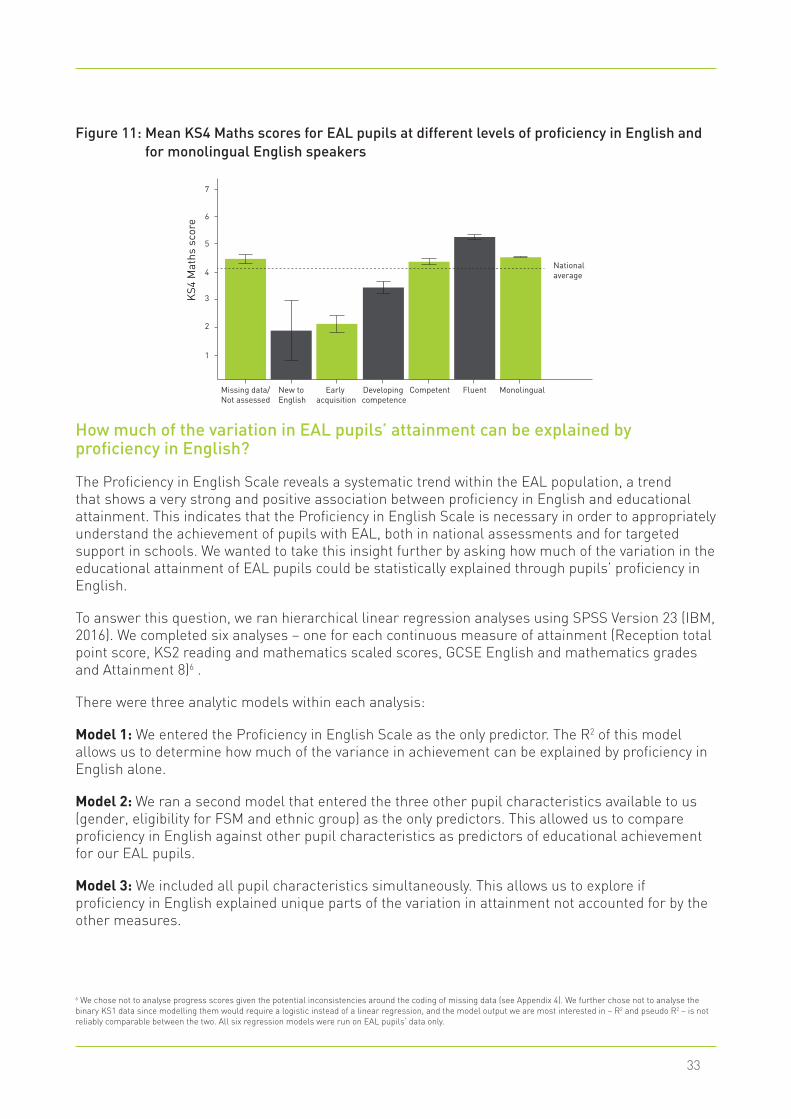
A similar pattern to that described above is also observed for GCSE mathematics. The results are presented in Figure 11.
Conclusion regarding proficiency in English and achievement
The overall trends come out strongly and consistently across year groups and across subjects. The Proficiency in English Scale reveals substantial variability between groups of EAL pupils, and stronger proficiency in English is linked to greater progress and achievement from early years to GCSEs.
Figure 10: Mean KS4 English scores for EAL pupils at different levels of proficiency in English and for monolingual English speakers
Missing data/Not assessed
10
20
30
40
50
60
70
New to English
KS4
Eng
lish
scor
e
Early acquisition
Developing competence
Competent Fluent Monolingual
National average
Error bars represent 95% confidence intervals around the mean. National average from DfE (2017).
33
Figure 11: Mean KS4 Maths scores for EAL pupils at different levels of proficiency in English and for monolingual English speakers
Missing data/Not assessed
1
2
3
4
5
6
7
New to English
KS4
Mat
hs s
core
Early acquisition
Developing competence
Competent Fluent Monolingual
National average
How much of the variation in EAL pupils’ attainment can be explained by proficiency in English?
The Proficiency in English Scale reveals a systematic trend within the EAL population, a trend that shows a very strong and positive association between proficiency in English and educational attainment. This indicates that the Proficiency in English Scale is necessary in order to appropriately understand the achievement of pupils with EAL, both in national assessments and for targeted support in schools. We wanted to take this insight further by asking how much of the variation in the educational attainment of EAL pupils could be statistically explained through pupils’ proficiency in English.
To answer this question, we ran hierarchical linear regression analyses using SPSS Version 23 (IBM, 2016). We completed six analyses – one for each continuous measure of attainment (Reception total point score, KS2 reading and mathematics scaled scores, GCSE English and mathematics grades and Attainment 8)6 .
There were three analytic models within each analysis:
Model 1: We entered the Proficiency in English Scale as the only predictor. The R2 of this model allows us to determine how much of the variance in achievement can be explained by proficiency in English alone.
Model 2: We ran a second model that entered the three other pupil characteristics available to us (gender, eligibility for FSM and ethnic group) as the only predictors. This allowed us to compare proficiency in English against other pupil characteristics as predictors of educational achievement for our EAL pupils.
Model 3: We included all pupil characteristics simultaneously. This allows us to explore if proficiency in English explained unique parts of the variation in attainment not accounted for by the other measures.
6 We chose not to analyse progress scores given the potential inconsistencies around the coding of missing data (see Appendix 4). We further chose not to analyse the binary KS1 data since modelling them would require a logistic instead of a linear regression, and the model output we are most interested in – R2 and pseudo R2 – is not reliably comparable between the two. All six regression models were run on EAL pupils’ data only.
ENGLISH AS AN ADDITIONAL LANGUAGE, PROFICIENCY IN ENGLISH AND PUPILS’ EDUCATIONAL ACHIEVEMENT: AN ANALYSIS OF LOCAL AUTHORITY DATA
34
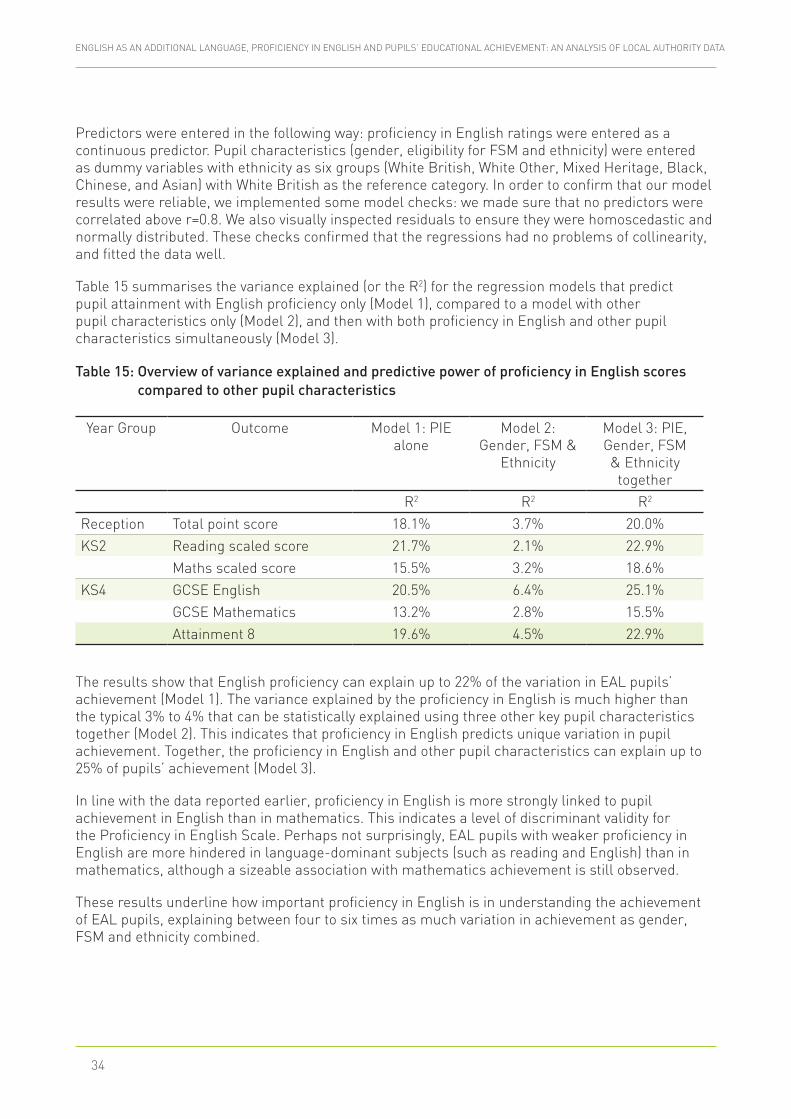
Predictors were entered in the following way: proficiency in English ratings were entered as a continuous predictor. Pupil characteristics (gender, eligibility for FSM and ethnicity) were entered as dummy variables with ethnicity as six groups (White British, White Other, Mixed Heritage, Black, Chinese, and Asian) with White British as the reference category. In order to confirm that our model results were reliable, we implemented some model checks: we made sure that no predictors were correlated above r=0.8. We also visually inspected residuals to ensure they were homoscedastic and normally distributed. These checks confirmed that the regressions had no problems of collinearity, and fitted the data well.
Table 15 summarises the variance explained (or the R2) for the regression models that predict pupil attainment with English proficiency only (Model 1), compared to a model with other pupil characteristics only (Model 2), and then with both proficiency in English and other pupil characteristics simultaneously (Model 3).
The results show that English proficiency can explain up to 22% of the variation in EAL pupils’ achievement (Model 1). The variance explained by the proficiency in English is much higher than the typical 3% to 4% that can be statistically explained using three other key pupil characteristics together (Model 2). This indicates that proficiency in English predicts unique variation in pupil achievement. Together, the proficiency in English and other pupil characteristics can explain up to 25% of pupils’ achievement (Model 3).
In line with the data reported earlier, proficiency in English is more strongly linked to pupil achievement in English than in mathematics. This indicates a level of discriminant validity for the Proficiency in English Scale. Perhaps not surprisingly, EAL pupils with weaker proficiency in English are more hindered in language-dominant subjects (such as reading and English) than in mathematics, although a sizeable association with mathematics achievement is still observed.
These results underline how important proficiency in English is in understanding the achievement of EAL pupils, explaining between four to six times as much variation in achievement as gender, FSM and ethnicity combined.
Table 15: Overview of variance explained and predictive power of proficiency in English scores compared to other pupil characteristics
Year Group Outcome Model 1: PIE alone
Model 2: Gender, FSM &
Ethnicity
Model 3: PIE, Gender, FSM & Ethnicity
togetherR2 R2 R2
Reception Total point score 18.1% 3.7% 20.0%KS2 Reading scaled score 21.7% 2.1% 22.9%
Maths scaled score 15.5% 3.2% 18.6%KS4 GCSE English 20.5% 6.4% 25.1%
GCSE Mathematics 13.2% 2.8% 15.5%Attainment 8 19.6% 4.5% 22.9%
35
Summary and discussion
The project collected data to explore the new scale included in the January 2017 School Census which records EAL pupils’ proficiency in English. The project collected data from six LAs including an inner London borough, two outer London boroughs, a West Midlands metropolitan district, a northern city and a southern shire county. Analysis of the data showed that EAL pupils varied widely in terms of their degree of English proficiency. In the context of mainstream schooling in the English language, this is not a trivial observation. Teaching is almost entirely delivered through the medium of English language (be it texts, video or audio materials, or in classroom discussions). A group of pupils who can only access this information to a limited degree is also less likely to perform to their full potential. The first question we thus asked was the following:
Do groups of EAL pupils differ in their proficiency in English?
What mattered most for EAL pupils’ degree of English proficiency was not their gender or FSM eligibility, but their age. In the first three years of primary school (Reception and KS1), over half (55%) of all EAL pupils were rated to be of low English proficiency (New to English, Early acquisition, or Developing competence). This was only the case, however, for about 23% of pupils at the end of KS2 and 15% at the end of KS4.
The low levels of fluency in English in the early years suggest that language support would be most warranted in Reception and KS1. Early support would be particularly beneficial since the earlier a pupil catches up with their language skills, the earlier they can access the curriculum. In later years, support may be needed for fewer pupils, but is still warranted, particularly for pupils who are new to the country. If the aspiration of the school system is to provide full access to the (English-language) curriculum to all pupils, language support would still be needed for one in six EAL pupils at KS4 (15% of which are rated less than Competent).
It is important to note here that the decreasing number of EAL pupils with low English proficiency mirrors the decreasing size of the EAL achievement gap at ages 5 to 16 (see Appendix 6). This leads us to our second research question where we ask about a link between the proficiency in English and EAL pupils’ attainment.
ENGLISH AS AN ADDITIONAL LANGUAGE, PROFICIENCY IN ENGLISH AND PUPILS’ EDUCATIONAL ACHIEVEMENT: AN ANALYSIS OF LOCAL AUTHORITY DATA
36
Is EAL pupils’ proficiency in English linked to their educational attainment?
Across all ages and subjects, three points came out very strongly:
• EAL pupils with different levels of English proficiency vary greatly in their achievement.
• EAL pupils’ attainment increases linearly with greater English proficiency, indicating a strong link between fluency in English and overall educational achievement.
• EAL pupils with strong proficiency in English typically score well above the national average for monolingual English speakers, but those with lower proficiency tended to score below.
When comparing achievement in different subjects, the link between proficiency in English and achievement was stronger in reading than in mathematics. This was true at all ages and both for achievement and for progress.
It makes sense that in an English-medium education system, a pupil’s likelihood to succeed will be strongly influenced by their mastery of the language of instruction. Our results chime with previous research demonstrating a link between English proficiency and EAL pupils’ achievement (Demie & Strand, 2006; Strand & Demie, 2005; Whiteside, Gooch, & Norbury, 2016; Demie, 2018). The overlap with previous research indicates that the Proficiency in English Scale is a valuable indicator to understand EAL language proficiency and to predict attainment. To quantify how much value the proficiency in English variable can add to the EAL flag, we raised our third research question:
How much of EAL pupils’ attainment can proficiency in English explain?
The results show that pupils’ proficiency in English can statistically explain up to 22% of the variability in EAL pupils’ achievement, compared to a typical 3%-4% explained by the joint combination of ethnicity, gender and entitlement to FSM. As expected, the relationship between English proficiency and achievement was particularly strong in language-dominant subjects (such as reading and English), although a sizeable effect was also noted in mathematics.
37
Conclusions
EAL itself is a poor indicator of pupils’ likely level of educational achievement – proficiency in English is central to understanding achievement and levels of need among pupils with EAL
EAL researchers and practitioners have for a long time discussed the imprecision of the binary EAL measure in the School Census that masks huge differences in English language skills (Strand & Demie, 2005; Demie & Strand, 2006; Strand et al., 2015; Hutchinson, 2018). The EAL definition groups together a diverse and heterogeneous group of pupils (e.g. those who are recent arrivals to the country with little or no English, and those who have an additional language as part of their cultural heritage but are also fully Fluent in English) all in a single group, irrespective of their actual language skills. In an English-medium education system, a pupil’s likelihood to succeed will be strongly influenced by their mastery of the language of instruction. Our results demonstrate conclusively that EAL is a poor indicator of pupils’ likely level of educational achievement. The results confirm that the Proficiency in English Scale is a vital indicator of EAL pupil’s language proficiency and the best predictor of their educational attainment.
English language support is most needed in the early years and KS1, but there is a need for support at all ages
The low levels of fluency in English in the early years suggest that language support is most warranted in Reception and KS1. Early support would be particularly beneficial since the earlier the pupil gains fluency in the language of instruction, the earlier they can access the curriculum. In later years, support may be needed for fewer pupils, but is still warranted, particularly for pupils who are new to the country. If the aspiration of the school system is to provide full access to the (English language) curriculum to all pupils, language support would still be needed for one in six EAL pupils at KS4, where 15% were judged less than Competent in regard to their proficiency.
Bilingualism can have positive associations with achievement
It is important to recognise that being bilingual is not a barrier to learning. It is possible to succeed in the English school system while reaping the benefits of growing up with more than one language. Indeed, we see that pupils with EAL who are rated as Competent or Fluent in English typically have significantly higher educational achievement than their monolingual peers. What can be a barrier to learning is low proficiency in the language of instruction. Pupils need to be supported adequately so that all children can acquire the proficiency in English they need to develop to their full potential.
The Proficiency in English Scale should be retained in the School Census and the data should be available in the NPD
It was very welcome that following the publication of the report by Strand et al. (2015), the Government recognised the need for the assessment of learners with EAL and responded by introducing the Proficiency in English Scale in 2016. This brought England into line with best practice in Wales and Scotland both of which have been collecting data on pupil’s proficiency
ENGLISH AS AN ADDITIONAL LANGUAGE, PROFICIENCY IN ENGLISH AND PUPILS’ EDUCATIONAL ACHIEVEMENT: AN ANALYSIS OF LOCAL AUTHORITY DATA
38
in English for many years. However, the DfE has recently announced it will no longer require schools to complete the Proficiency in English Scale from January 2019. This is a retrograde step and potentially a damaging one. We strongly urge the DfE to consult with schools and reconsider this decision. The data that has been collected should also be released in the National Pupil Database (NPD), so that further research can be conducted.
The DfE should provide schools with guidance on best practice
The DfE should provide guidance on best practice in EAL assessment to schools, to LAs, and to Multi-Academy Trusts which draws on what has been learnt from the introduction of the scale. It would be valuable if this included reference to the EAL Assessment Framework developed by The Bell Foundation (2017) and considered issues around expertise, training and moderation. We urge schools to continue to record the proficiency in English of their EAL pupils and to use the data to identify need and target support.
39
References
The Bell Foundation (2017). EAL Assessment Framework for schools, V1.1. Available at: https://www.bell-foundation.org.uk/eal-programme/teaching-resources/eal-assessment-framework/
Demie, F. & Strand, S. (2006). English language acquisition and educational attainment at the end of secondary school. Educational Studies, 32(2), 215–231. http://doi.org/10.1080/03055690600631119
Demie, F. (2018). English language proficiency and attainment of EAL (English as second language) pupils in England. Journal of Multilingual and Multicultural Development. DOI: 10.1080/01434632.2017.1420658
DfE (2017). Collection of data on pupil nationality, country of birth and proficiency in English: Summary Report. DfE 00316-2017. London: Department for Education.
DfE (2017b). Phonics screening check and key stage 1 assessments in England. London: Department for Education.
DfE (2017c). Schools, pupils, and their characteristics: January 2017. Department for Education. London: Department for Education.
Hutchinson, J. (2018). Educational outcomes of children with English as an additional language. Education Policy Institute.
IBM. (2016). Statistical Package for Social Sciences, Version 23. New York: IBM.
Marx, A., & Stanat, P. (2011). Reading comprehension of immigrant pupils in Germany: Research evidence on determinants and target points for intervention. Reading and Writing, 25(8), 1929–1945. http://doi.org/10.1007/s11145-011-9307-x
Murphy, V. A. (2018). Literacy development in linguistically diverse pupils. In D. Miller, F. Bayram, J. Rothman, & L. Serratrice (Eds.), Bilingual Cognition and Language: The state of the science across its subfields. (Studies in, Vol. 54, pp. 315–323). Amsterdam: John Benjamins. http://doi.org/10.1075/btl.128.02gar
Spencer, M., & Wagner, R. (2016). The comprehension problems for second-language learners with poor reading comprehension despite adequate decoding : A meta-analysis. Journal of Research in Reading, 00(00), 1–19. http://doi.org/10.1111/1467-9817.12080
Strand, S. & Demie, F. (2005). English language acquisition and educational attainment at the end of primary school. Educational Studies, 31(3), 275–291. http://doi.org/10.1080/03055690500236613
Strand, S., Malmberg, L. & Hall, J. (2015). English as an additional language and educational achievement in England: An analysis of the National Pupil Database. London: Educational Endowment Fund. http://educationendowmentfoundation.org.uk/uploads/pdf/EAL_and_educational_achievement2.pdf
Whiteside, K., Gooch, D., & Norbury, C. (2016). English Language Proficiency and Early School Attainment Among Children Learning English as an Additional Language. Child Development, 00(0), 1–16. http://doi.org/10.1111/cdev.12615
ENGLISH AS AN ADDITIONAL LANGUAGE, PROFICIENCY IN ENGLISH AND PUPILS’ EDUCATIONAL ACHIEVEMENT: AN ANALYSIS OF LOCAL AUTHORITY DATA
40
Appendix 1: DfE Proficiency in English Scale
Proficiency in English
Where ‘Proficiency in English’ is required, schools will assess the position of their EAL pupils against a five-point scale of reading, writing and spoken language proficiency (see below) and make a ‘best fit’ judgement as to the proficiency stage that a pupil corresponds most closely to:
• New to English [Code ‘A’]: May use first language for learning and other purposes. May remain completely silent in the classroom. May be copying / repeating some words or phrases. May understand some everyday expressions in English but may have minimal or no literacy in English. Needs a considerable amount of EAL support.
• Early acquisition [Code ‘B’]: May follow day-to-day social communication in English and participate in learning activities with support. Beginning to use spoken English for social purposes. May understand simple instructions and can follow narrative / accounts with visual support. May have developed some skills in reading and writing. May have become familiar with some subject specific vocabulary. Still needs a significant amount of EAL support to access the curriculum.
• Developing competence [Code ‘C’]: May participate in learning activities with increasing independence. Able to express self orally in English, but structural inaccuracies are still apparent. Literacy will require ongoing support, particularly for understanding text and writing. May be able to follow abstract concepts and more complex written English. Requires ongoing EAL support to access the curriculum fully.
• Competent [Code ‘D’]: Oral English will be developing well, enabling successful engagement in activities across the curriculum. Can read and understand a wide variety of texts. Written English may lack complexity and contain occasional evidence of errors in structure. Needs some support to access subtle nuances of meaning, to refine English usage, and to develop abstract vocabulary. Needs some/occasional EAL support to access complex curriculum material and tasks.
• Fluent [Code ‘E’]: Can operate across the curriculum to a level of competence equivalent to that of a pupil who uses English as his/her first language. Operates without EAL support across the curriculum.
Alongside the scale outlined above, Not Yet Assessed [Code ‘N’] is available for use where the school has not yet had time to assess proficiency.
Please see section 5.3.3 of the School Census guide for further information.
41
Appendix 2: Proficiency in English LA Data Project – Information Pack
Introduction
A recent analysis of the association between English as an Additional Language (EAL) and educational achievement concluded that the EAL measure in the National Pupil Database (NPD) was inadequate as it did not assess the key factor that influenced pupils’ educational achievement, namely their proficiency in the English language (Strand et al., 2015). As a result of the research the Department for Education (DfE) announced that all schools in England would be required to assess any pupils in Y1 or above recorded as EAL for their proficiency in English. Following an initial collection during the autumn 2016 School Census, information on the proficiency in English of pupils with EAL moved to an annual collection from the spring 2017 School Census onwards.
However, despite introducing the Proficiency in English Scale, the DfE has decided not to include the data in the NPD. There is therefore no access to the national data for research purposes. Furthermore, apart from a single table of the total number of pupils aged 5-16 at each stage (DfE, 2017, p7) the DfE has provided no analysis of the data.
The proposed research project
Because of the above decision, we are not able to use the NPD to answer some important questions about the Proficiency in English Scale, questions such as:
• What is the relationship between proficiency in English and pupil characteristics such as their age, ethnic group, first language, gender, entitlement to Free School Meals (FSM)?
• What is the relationship between proficiency in English and educational achievement? How does it vary at age 5, 7, 11 and 16? How do patterns vary in relation to English and mathematics achievement?
Some Local Authorities (LA) have completed analyses of their own data, for example, Lambeth (Demie, 2018). However, there would be value in having an analysis based on a larger and more representative sample of LAs, including inner London, outer London, and other parts of the country. I am therefore seeking a number of LAs who would be willing to share their proficiency in English and linked achievement data.
What are we asking from participating LAs?
We are seeking pupil level data matching the January 2017 School Census record to the pupil’s summer 2017 national assessment results. Specifically, we are seeking the data for four cohorts of pupils, those who in the 2016/17 academic year were in:
• Reception – Early Years Foundation Stage Profile • Y2 – End of Key Stage 1 assessments• Y6 – End of Key Stage 2 tests• Y11 – GCSE public examinations.
ENGLISH AS AN ADDITIONAL LANGUAGE, PROFICIENCY IN ENGLISH AND PUPILS’ EDUCATIONAL ACHIEVEMENT: AN ANALYSIS OF LOCAL AUTHORITY DATA
42
We are seeking data for all pupils, not just those who are EAL, so we can compare Competent and Fluent EAL pupils with their monolingual English peers. The exact data we are requesting is shown in Appendix 1.
I have secured the resource to employ a Research Assistant for three months April-June to help in collating and analysing the data, so this should not take an excessive amount of your time.
Confidentiality and Data Security
We will need to name the LAs that contribute data to the project so that readers of the report can gauge how representative the sample is. However, no LA will be named in analyses which will all be anonymous. Also no schools or pupils will be named in any analyses. Pupil names or UPNs will not be collected from participating LAs. We will share the report with all LAs involved in the project before it is released.
All data analysis will be compliant with the Oxford University Information Security Policy. Our IT Systems are secure and the security policy is aligned with ISO 27002. All data are hosted on a secure server requiring two levels of password authentication. The department has a SonicWall NSA 220 firewall, maintained by our IT Department. The data will only be accessed by myself and the Research Assistant, and we both have current DBS clearance.
The attached Information Sharing Agreement outlines how we meet the conditions of the Data Protection Act and how we will process the data you supply. If you wish to join the project, please sign and return the agreement.
Conclusion
I very much hope you will be able to contribute to this project. If you have any questions at all, please do not hesitate to contact me using the contact details below. I very much look forward to hearing from you.
Professor Steve Strand Professor of Education and Fellow of St. Cross College University of Oxford Department of Education 15 Norham Gardens, Oxford OX2 6PY Tel: (01865) 611071 Email: [email protected] Webpage: www.education.ox.ac.uk/about-us/directory/professor-steve-strand/
NB Even if you are not able to participate in the project, if you have completed any analysis of your proficiency in English data, I would be very grateful if you could email or post me a copy to the address above.
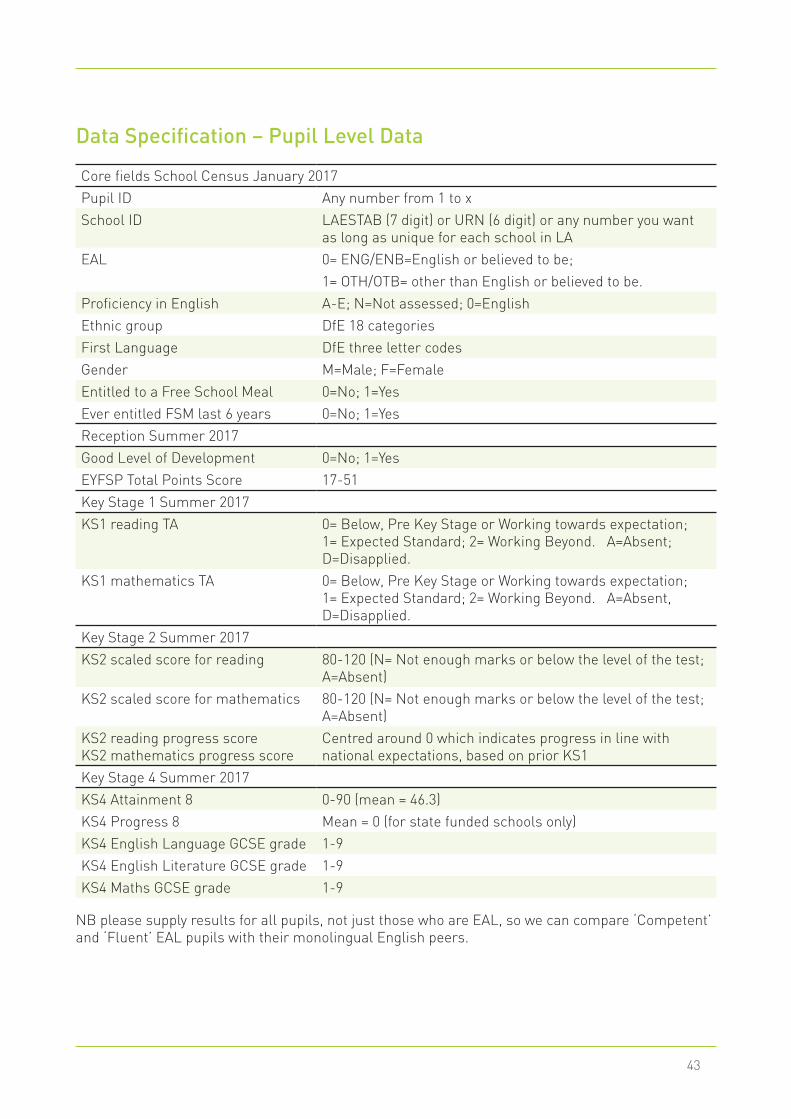
43
Data Specification – Pupil Level Data
Core fields School Census January 2017Pupil ID Any number from 1 to xSchool ID LAESTAB (7 digit) or URN (6 digit) or any number you want
as long as unique for each school in LAEAL 0= ENG/ENB=English or believed to be;
1= OTH/OTB= other than English or believed to be.Proficiency in English A-E; N=Not assessed; 0=EnglishEthnic group DfE 18 categoriesFirst Language DfE three letter codesGender M=Male; F=FemaleEntitled to a Free School Meal 0=No; 1=YesEver entitled FSM last 6 years 0=No; 1=YesReception Summer 2017Good Level of Development 0=No; 1=YesEYFSP Total Points Score 17-51
Key Stage 1 Summer 2017KS1 reading TA 0= Below, Pre Key Stage or Working towards expectation;
1= Expected Standard; 2= Working Beyond. A=Absent; D=Disapplied.
KS1 mathematics TA 0= Below, Pre Key Stage or Working towards expectation; 1= Expected Standard; 2= Working Beyond. A=Absent, D=Disapplied.
Key Stage 2 Summer 2017KS2 scaled score for reading 80-120 (N= Not enough marks or below the level of the test;
A=Absent) KS2 scaled score for mathematics 80-120 (N= Not enough marks or below the level of the test;
A=Absent)KS2 reading progress score KS2 mathematics progress score
Centred around 0 which indicates progress in line with national expectations, based on prior KS1
Key Stage 4 Summer 2017KS4 Attainment 8 0-90 (mean = 46.3)KS4 Progress 8 Mean = 0 (for state funded schools only)KS4 English Language GCSE grade 1-9KS4 English Literature GCSE grade 1-9KS4 Maths GCSE grade 1-9
NB please supply results for all pupils, not just those who are EAL, so we can compare ‘Competent’ and ‘Fluent’ EAL pupils with their monolingual English peers.
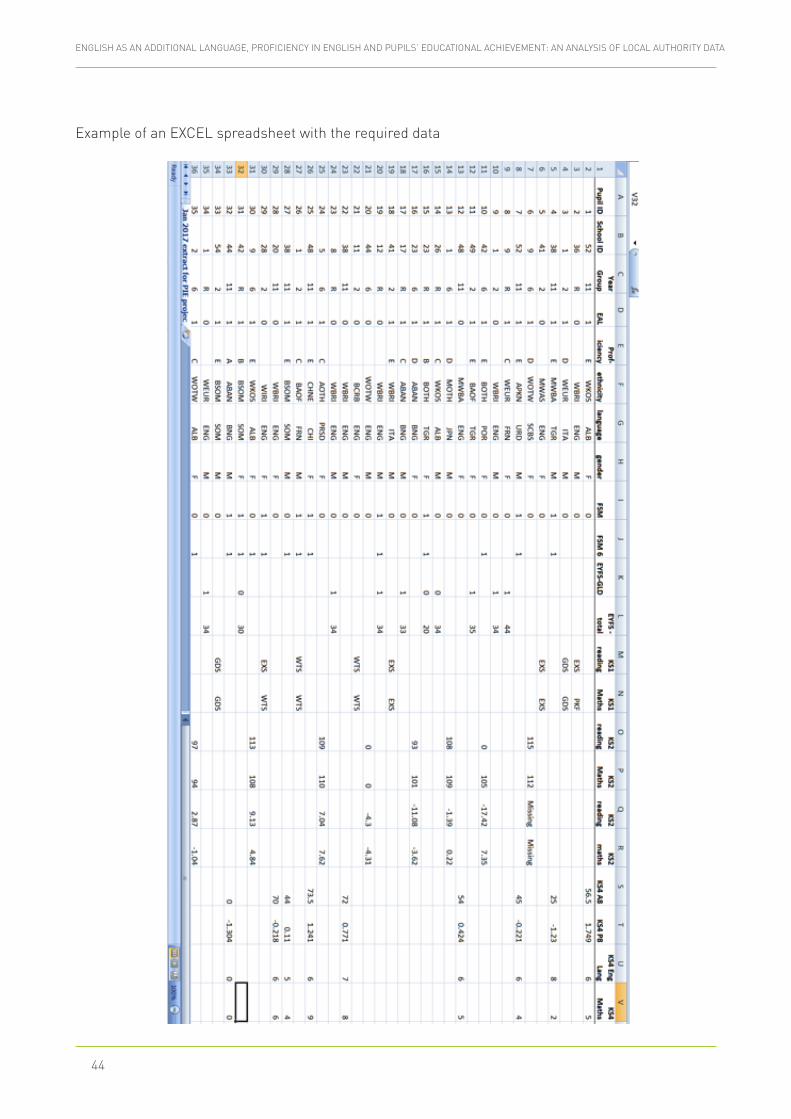
ENGLISH AS AN ADDITIONAL LANGUAGE, PROFICIENCY IN ENGLISH AND PUPILS’ EDUCATIONAL ACHIEVEMENT: AN ANALYSIS OF LOCAL AUTHORITY DATA
44
Example of an EXCEL spreadsheet with the required data
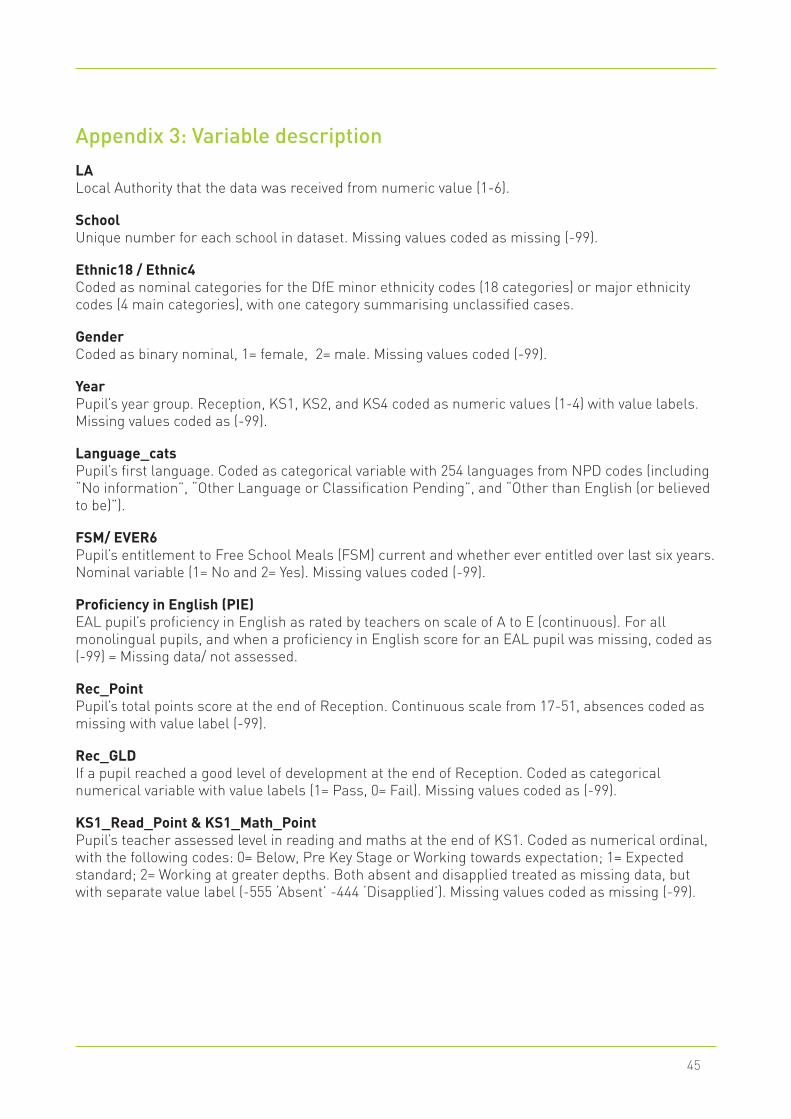
45
Appendix 3: Variable description
LA Local Authority that the data was received from numeric value (1-6).
School Unique number for each school in dataset. Missing values coded as missing (-99).
Ethnic18 / Ethnic4 Coded as nominal categories for the DfE minor ethnicity codes (18 categories) or major ethnicity codes (4 main categories), with one category summarising unclassified cases.
Gender Coded as binary nominal, 1= female, 2= male. Missing values coded (-99).
Year Pupil’s year group. Reception, KS1, KS2, and KS4 coded as numeric values (1-4) with value labels. Missing values coded as (-99).
Language_cats Pupil’s first language. Coded as categorical variable with 254 languages from NPD codes (including “No information”, “Other Language or Classification Pending”, and “Other than English (or believed to be)”).
FSM/ EVER6 Pupil’s entitlement to Free School Meals (FSM) current and whether ever entitled over last six years. Nominal variable (1= No and 2= Yes). Missing values coded (-99).
Proficiency in English (PIE) EAL pupil’s proficiency in English as rated by teachers on scale of A to E (continuous). For all monolingual pupils, and when a proficiency in English score for an EAL pupil was missing, coded as (-99) = Missing data/ not assessed.
Rec_Point Pupil’s total points score at the end of Reception. Continuous scale from 17-51, absences coded as missing with value label (-99).
Rec_GLD If a pupil reached a good level of development at the end of Reception. Coded as categorical numerical variable with value labels (1= Pass, 0= Fail). Missing values coded as (-99).
KS1_Read_Point & KS1_Math_Point Pupil’s teacher assessed level in reading and maths at the end of KS1. Coded as numerical ordinal, with the following codes: 0= Below, Pre Key Stage or Working towards expectation; 1= Expected standard; 2= Working at greater depths. Both absent and disapplied treated as missing data, but with separate value label (-555 ‘Absent’ -444 ‘Disapplied’). Missing values coded as missing (-99).
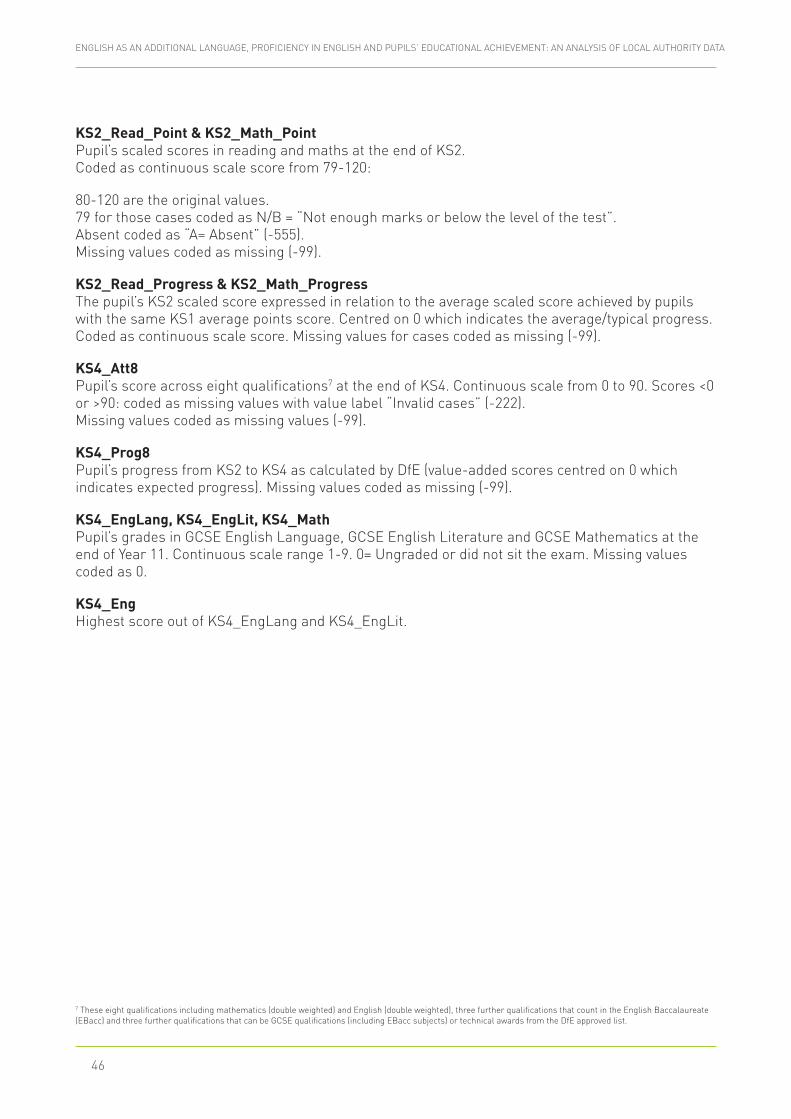
ENGLISH AS AN ADDITIONAL LANGUAGE, PROFICIENCY IN ENGLISH AND PUPILS’ EDUCATIONAL ACHIEVEMENT: AN ANALYSIS OF LOCAL AUTHORITY DATA
46
KS2_Read_Point & KS2_Math_Point Pupil’s scaled scores in reading and maths at the end of KS2. Coded as continuous scale score from 79-120:
80-120 are the original values. 79 for those cases coded as N/B = “Not enough marks or below the level of the test”. Absent coded as “A= Absent” (-555). Missing values coded as missing (-99).
KS2_Read_Progress & KS2_Math_Progress The pupil’s KS2 scaled score expressed in relation to the average scaled score achieved by pupils with the same KS1 average points score. Centred on 0 which indicates the average/typical progress. Coded as continuous scale score. Missing values for cases coded as missing (-99).
KS4_Att8 Pupil’s score across eight qualifications7 at the end of KS4. Continuous scale from 0 to 90. Scores <0 or >90: coded as missing values with value label “Invalid cases” (-222). Missing values coded as missing values (-99).
KS4_Prog8 Pupil’s progress from KS2 to KS4 as calculated by DfE (value-added scores centred on 0 which indicates expected progress). Missing values coded as missing (-99).
KS4_EngLang, KS4_EngLit, KS4_Math Pupil’s grades in GCSE English Language, GCSE English Literature and GCSE Mathematics at the end of Year 11. Continuous scale range 1-9. 0= Ungraded or did not sit the exam. Missing values coded as 0.
KS4_Eng Highest score out of KS4_EngLang and KS4_EngLit.
7 These eight qualifications including mathematics (double weighted) and English (double weighted), three further qualifications that count in the English Baccalaureate (EBacc) and three further qualifications that can be GCSE qualifications (including EBacc subjects) or technical awards from the DfE approved list.
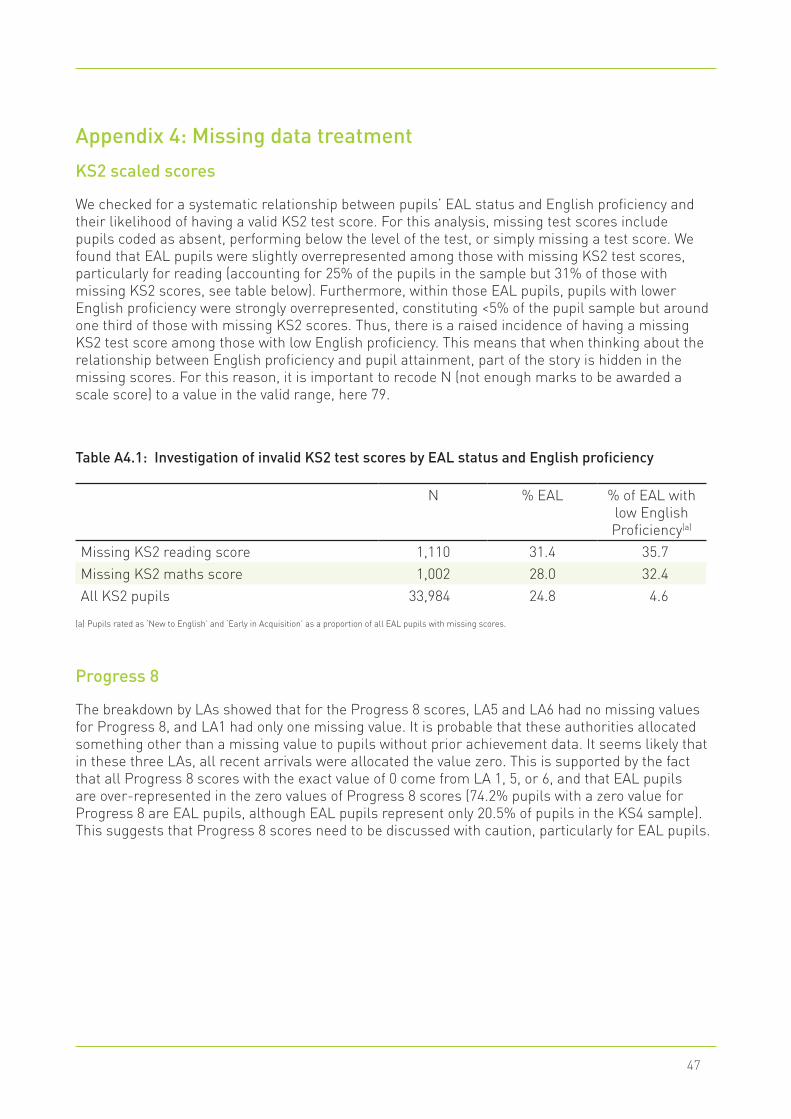
47
Appendix 4: Missing data treatment
KS2 scaled scores
We checked for a systematic relationship between pupils’ EAL status and English proficiency and their likelihood of having a valid KS2 test score. For this analysis, missing test scores include pupils coded as absent, performing below the level of the test, or simply missing a test score. We found that EAL pupils were slightly overrepresented among those with missing KS2 test scores, particularly for reading (accounting for 25% of the pupils in the sample but 31% of those with missing KS2 scores, see table below). Furthermore, within those EAL pupils, pupils with lower English proficiency were strongly overrepresented, constituting <5% of the pupil sample but around one third of those with missing KS2 scores. Thus, there is a raised incidence of having a missing KS2 test score among those with low English proficiency. This means that when thinking about the relationship between English proficiency and pupil attainment, part of the story is hidden in the missing scores. For this reason, it is important to recode N (not enough marks to be awarded a scale score) to a value in the valid range, here 79.
Table A4.1: Investigation of invalid KS2 test scores by EAL status and English proficiency
N % EAL % of EAL with low English Proficiency(a)
Missing KS2 reading score 1,110 31.4 35.7Missing KS2 maths score 1,002 28.0 32.4All KS2 pupils 33,984 24.8 4.6
(a) Pupils rated as ‘New to English’ and ‘Early in Acquisition’ as a proportion of all EAL pupils with missing scores.
Progress 8
The breakdown by LAs showed that for the Progress 8 scores, LA5 and LA6 had no missing values for Progress 8, and LA1 had only one missing value. It is probable that these authorities allocated something other than a missing value to pupils without prior achievement data. It seems likely that in these three LAs, all recent arrivals were allocated the value zero. This is supported by the fact that all Progress 8 scores with the exact value of 0 come from LA 1, 5, or 6, and that EAL pupils are over-represented in the zero values of Progress 8 scores (74.2% pupils with a zero value for Progress 8 are EAL pupils, although EAL pupils represent only 20.5% of pupils in the KS4 sample). This suggests that Progress 8 scores need to be discussed with caution, particularly for EAL pupils.
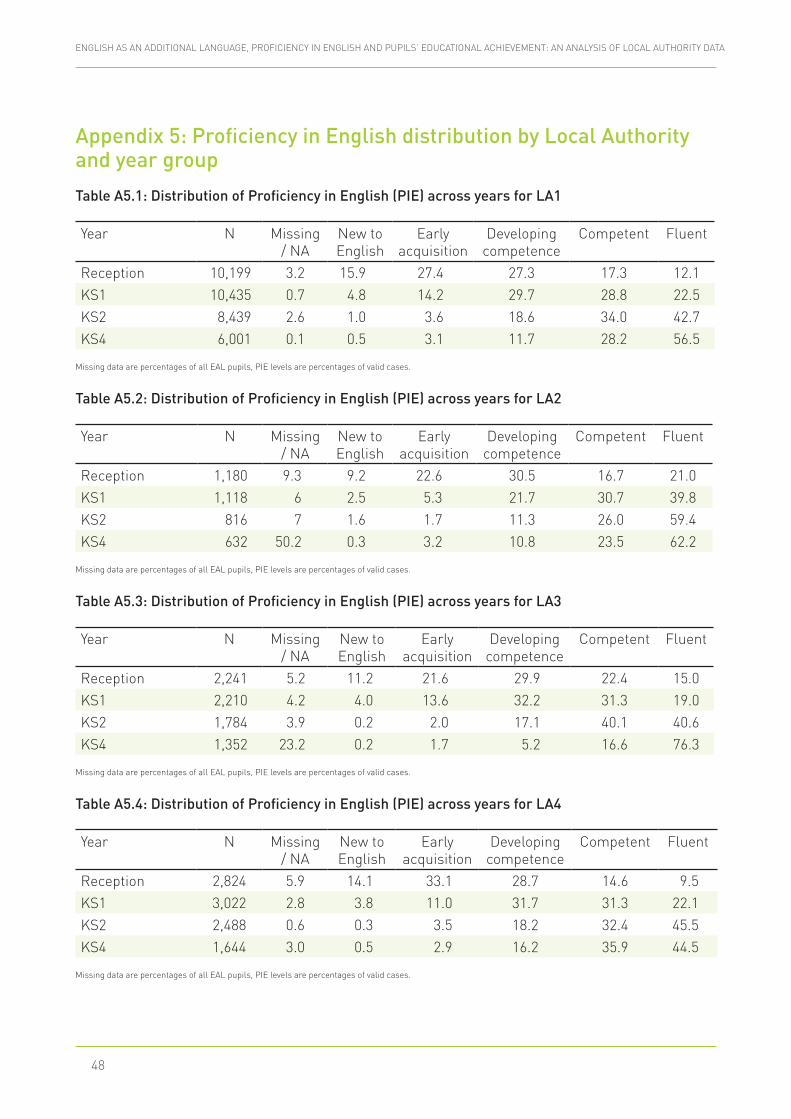
ENGLISH AS AN ADDITIONAL LANGUAGE, PROFICIENCY IN ENGLISH AND PUPILS’ EDUCATIONAL ACHIEVEMENT: AN ANALYSIS OF LOCAL AUTHORITY DATA
48
Appendix 5: Proficiency in English distribution by Local Authority and year group
Table A5.1: Distribution of Proficiency in English (PIE) across years for LA1
Year N Missing / NA
New to English
Early acquisition
Developing competence
Competent Fluent
Reception 10,199 3.2 15.9 27.4 27.3 17.3 12.1KS1 10,435 0.7 4.8 14.2 29.7 28.8 22.5KS2 8,439 2.6 1.0 3.6 18.6 34.0 42.7KS4 6,001 0.1 0.5 3.1 11.7 28.2 56.5
Missing data are percentages of all EAL pupils, PIE levels are percentages of valid cases.
Table A5.2: Distribution of Proficiency in English (PIE) across years for LA2
Year N Missing / NA
New to English
Early acquisition
Developing competence
Competent Fluent
Reception 1,180 9.3 9.2 22.6 30.5 16.7 21.0KS1 1,118 6 2.5 5.3 21.7 30.7 39.8KS2 816 7 1.6 1.7 11.3 26.0 59.4KS4 632 50.2 0.3 3.2 10.8 23.5 62.2
Missing data are percentages of all EAL pupils, PIE levels are percentages of valid cases.
Table A5.3: Distribution of Proficiency in English (PIE) across years for LA3
Year N Missing / NA
New to English
Early acquisition
Developing competence
Competent Fluent
Reception 2,241 5.2 11.2 21.6 29.9 22.4 15.0KS1 2,210 4.2 4.0 13.6 32.2 31.3 19.0KS2 1,784 3.9 0.2 2.0 17.1 40.1 40.6KS4 1,352 23.2 0.2 1.7 5.2 16.6 76.3
Missing data are percentages of all EAL pupils, PIE levels are percentages of valid cases.
Table A5.4: Distribution of Proficiency in English (PIE) across years for LA4
Year N Missing / NA
New to English
Early acquisition
Developing competence
Competent Fluent
Reception 2,824 5.9 14.1 33.1 28.7 14.6 9.5KS1 3,022 2.8 3.8 11.0 31.7 31.3 22.1KS2 2,488 0.6 0.3 3.5 18.2 32.4 45.5KS4 1,644 3.0 0.5 2.9 16.2 35.9 44.5
Missing data are percentages of all EAL pupils, PIE levels are percentages of valid cases.
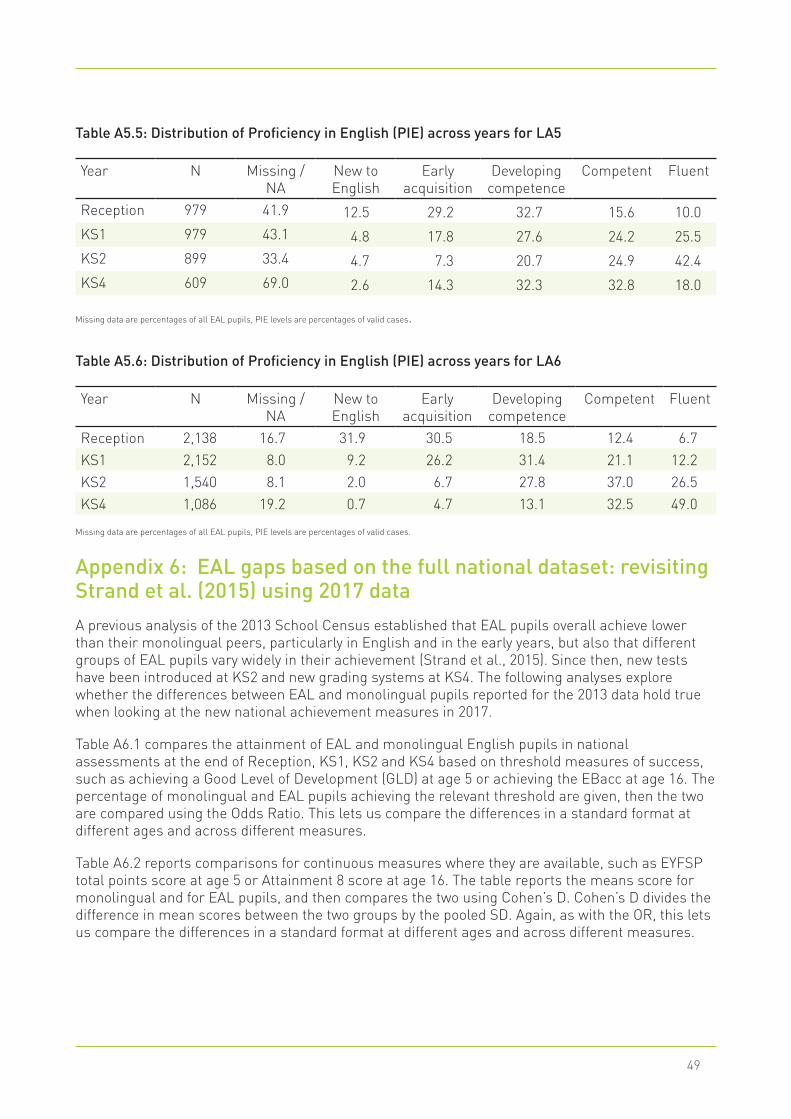
49
Table A5.5: Distribution of Proficiency in English (PIE) across years for LA5
Year N Missing / NA
New to English
Early acquisition
Developing competence
Competent Fluent
Reception 979 41.9 12.5 29.2 32.7 15.6 10.0KS1 979 43.1 4.8 17.8 27.6 24.2 25.5KS2 899 33.4 4.7 7.3 20.7 24.9 42.4KS4 609 69.0 2.6 14.3 32.3 32.8 18.0
Missing data are percentages of all EAL pupils, PIE levels are percentages of valid cases.
Table A5.6: Distribution of Proficiency in English (PIE) across years for LA6
Year N Missing / NA
New to English
Early acquisition
Developing competence
Competent Fluent
Reception 2,138 16.7 31.9 30.5 18.5 12.4 6.7KS1 2,152 8.0 9.2 26.2 31.4 21.1 12.2KS2 1,540 8.1 2.0 6.7 27.8 37.0 26.5KS4 1,086 19.2 0.7 4.7 13.1 32.5 49.0
Missing data are percentages of all EAL pupils, PIE levels are percentages of valid cases.
Appendix 6: EAL gaps based on the full national dataset: revisiting Strand et al. (2015) using 2017 data
A previous analysis of the 2013 School Census established that EAL pupils overall achieve lower than their monolingual peers, particularly in English and in the early years, but also that different groups of EAL pupils vary widely in their achievement (Strand et al., 2015). Since then, new tests have been introduced at KS2 and new grading systems at KS4. The following analyses explore whether the differences between EAL and monolingual pupils reported for the 2013 data hold true when looking at the new national achievement measures in 2017.
Table A6.1 compares the attainment of EAL and monolingual English pupils in national assessments at the end of Reception, KS1, KS2 and KS4 based on threshold measures of success, such as achieving a Good Level of Development (GLD) at age 5 or achieving the EBacc at age 16. The percentage of monolingual and EAL pupils achieving the relevant threshold are given, then the two are compared using the Odds Ratio. This lets us compare the differences in a standard format at different ages and across different measures.
Table A6.2 reports comparisons for continuous measures where they are available, such as EYFSP total points score at age 5 or Attainment 8 score at age 16. The table reports the means score for monolingual and for EAL pupils, and then compares the two using Cohen’s D. Cohen’s D divides the difference in mean scores between the two groups by the pooled SD. Again, as with the OR, this lets us compare the differences in a standard format at different ages and across different measures.
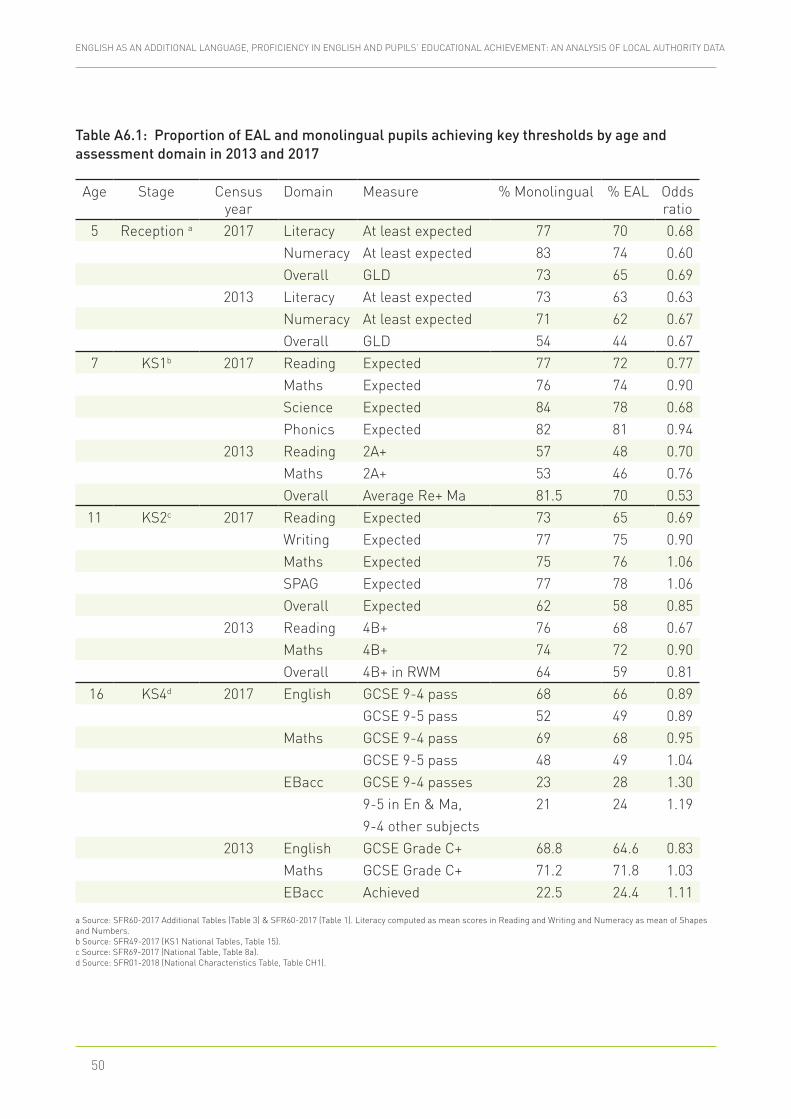
ENGLISH AS AN ADDITIONAL LANGUAGE, PROFICIENCY IN ENGLISH AND PUPILS’ EDUCATIONAL ACHIEVEMENT: AN ANALYSIS OF LOCAL AUTHORITY DATA
50
Table A6.1: Proportion of EAL and monolingual pupils achieving key thresholds by age and assessment domain in 2013 and 2017
Age Stage Census year
Domain Measure % Monolingual % EAL Odds ratio
5 Reception a 2017 Literacy At least expected 77 70 0.68Numeracy At least expected 83 74 0.60Overall GLD 73 65 0.69
2013 Literacy At least expected 73 63 0.63Numeracy At least expected 71 62 0.67Overall GLD 54 44 0.67
7 KS1b 2017 Reading Expected 77 72 0.77Maths Expected 76 74 0.90Science Expected 84 78 0.68Phonics Expected 82 81 0.94
2013 Reading 2A+ 57 48 0.70Maths 2A+ 53 46 0.76Overall Average Re+ Ma 81.5 70 0.53
11 KS2c 2017 Reading Expected 73 65 0.69Writing Expected 77 75 0.90Maths Expected 75 76 1.06SPAG Expected 77 78 1.06Overall Expected 62 58 0.85
2013 Reading 4B+ 76 68 0.67Maths 4B+ 74 72 0.90Overall 4B+ in RWM 64 59 0.81
16 KS4d 2017 English GCSE 9-4 pass 68 66 0.89 GCSE 9-5 pass 52 49 0.89 Maths GCSE 9-4 pass 69 68 0.95 GCSE 9-5 pass 48 49 1.04
EBacc GCSE 9-4 passes 23 28 1.309-5 in En & Ma, 21 24 1.199-4 other subjects
2013 English GCSE Grade C+ 68.8 64.6 0.83Maths GCSE Grade C+ 71.2 71.8 1.03EBacc Achieved 22.5 24.4 1.11
a Source: SFR60-2017 Additional Tables (Table 3) & SFR60-2017 (Table 1). Literacy computed as mean scores in Reading and Writing and Numeracy as mean of Shapes and Numbers. b Source: SFR49-2017 (KS1 National Tables, Table 15). c Source: SFR69-2017 (National Table, Table 8a). d Source: SFR01-2018 (National Characteristics Table, Table CH1).
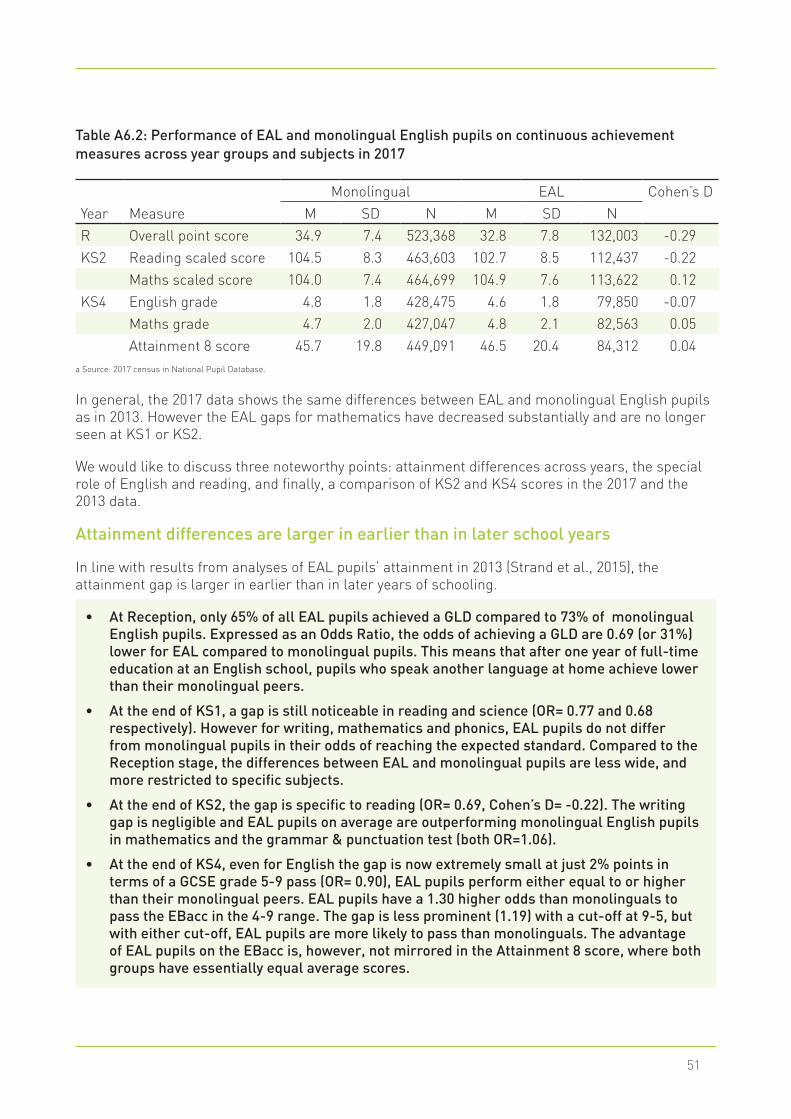
51
Table A6.2: Performance of EAL and monolingual English pupils on continuous achievement measures across year groups and subjects in 2017
Monolingual EAL Cohen’s DYear Measure M SD N M SD NR Overall point score 34.9 7.4 523,368 32.8 7.8 132,003 -0.29KS2 Reading scaled score 104.5 8.3 463,603 102.7 8.5 112,437 -0.22
Maths scaled score 104.0 7.4 464,699 104.9 7.6 113,622 0.12KS4 English grade 4.8 1.8 428,475 4.6 1.8 79,850 -0.07
Maths grade 4.7 2.0 427,047 4.8 2.1 82,563 0.05Attainment 8 score 45.7 19.8 449,091 46.5 20.4 84,312 0.04
a Source: 2017 census in National Pupil Database.
In general, the 2017 data shows the same differences between EAL and monolingual English pupils as in 2013. However the EAL gaps for mathematics have decreased substantially and are no longer seen at KS1 or KS2.
We would like to discuss three noteworthy points: attainment differences across years, the special role of English and reading, and finally, a comparison of KS2 and KS4 scores in the 2017 and the 2013 data.
Attainment differences are larger in earlier than in later school years
In line with results from analyses of EAL pupils’ attainment in 2013 (Strand et al., 2015), the attainment gap is larger in earlier than in later years of schooling.
• At Reception, only 65% of all EAL pupils achieved a GLD compared to 73% of monolingual English pupils. Expressed as an Odds Ratio, the odds of achieving a GLD are 0.69 (or 31%) lower for EAL compared to monolingual pupils. This means that after one year of full-time education at an English school, pupils who speak another language at home achieve lower than their monolingual peers.
• At the end of KS1, a gap is still noticeable in reading and science (OR= 0.77 and 0.68 respectively). However for writing, mathematics and phonics, EAL pupils do not differ from monolingual pupils in their odds of reaching the expected standard. Compared to the Reception stage, the differences between EAL and monolingual pupils are less wide, and more restricted to specific subjects.
• At the end of KS2, the gap is specific to reading (OR= 0.69, Cohen’s D= -0.22). The writing gap is negligible and EAL pupils on average are outperforming monolingual English pupils in mathematics and the grammar & punctuation test (both OR=1.06).
• At the end of KS4, even for English the gap is now extremely small at just 2% points in terms of a GCSE grade 5-9 pass (OR= 0.90), EAL pupils perform either equal to or higher than their monolingual peers. EAL pupils have a 1.30 higher odds than monolinguals to pass the EBacc in the 4-9 range. The gap is less prominent (1.19) with a cut-off at 9-5, but with either cut-off, EAL pupils are more likely to pass than monolinguals. The advantage of EAL pupils on the EBacc is, however, not mirrored in the Attainment 8 score, where both groups have essentially equal average scores.
ENGLISH AS AN ADDITIONAL LANGUAGE, PROFICIENCY IN ENGLISH AND PUPILS’ EDUCATIONAL ACHIEVEMENT: AN ANALYSIS OF LOCAL AUTHORITY DATA
52
In summary, EAL pupils perform noticeably lower than their monolingual peers at the end of the first year at school. Also at age 7 and 11, there is still a gap in reading particularly. At age 16, however, EAL pupils are on par with monolinguals, and even outperformed them on the EBacc. The fact that the 2017 data replicates this finding from 2013 supports the robustness of the earlier findings and suggests that they are largely applicable to current pupil achievement.
The special role of English / reading
Reading takes a special role in EAL learners’ attainment. At the Reception year, EAL learners perform lower both on literacy and numeracy, but from KS2 onwards, the difference remains only for English or reading, and not for mathematics. This finding is in line with an array of national and international research that documents lower reading skills for minority language learners (see, for example, Marx & Stanat, 2011; Strand et al., 2015). Reading comprehension is a complex process and generally where gaps between the language skills of monolingual and EAL learners show most acutely (Spencer & Wagner, 2016). It is plausible that those gaps would also show up in a national assessment of reading.
This is not to say, however, that weaker language skills will only affect subjects that directly deal with language skills. For example, there is a considerable gap between EAL and monolingual pupils in science at KS1 which indicates attainment differences beyond reading. It is also highlighted in this report that averages for all EAL pupils cannot be generalised, as we know that pupils at the first three stages of proficiency in English do have significantly lower achievement in mathematics at KS2 and KS4 compared to the national average.
New compared to old measures in KS2 and KS4
Between the 2013 and the 2017 census, the grading systems for KS2 and KS4 scores changed. However, as the results show, the same trends persist with the new measures: while there is still a noticeable gap between monolinguals and EAL pupils at the end of KS2 (particularly in reading), the gap largely closes at KS4. EAL pupils are even slightly more likely to achieve an EBacc which is likely to be due to EAL pupils’ strong performance in Modern Foreign Languages (Strand et al., 2015).

53
The Bell Foundation Hillscross Red Cross Lane Cambridge CB2 0QU
www.bell-foundation.org.uk