England Professional Rugby Injury Surveillance Project · Authored by the England Professional...
40
England Professional Rugby Injury Surveillance Project 2014-15 Season Report March 2016
Transcript of England Professional Rugby Injury Surveillance Project · Authored by the England Professional...

England Professional Rugby Injury Surveillance Project
2014-15 Season ReportMarch 2016
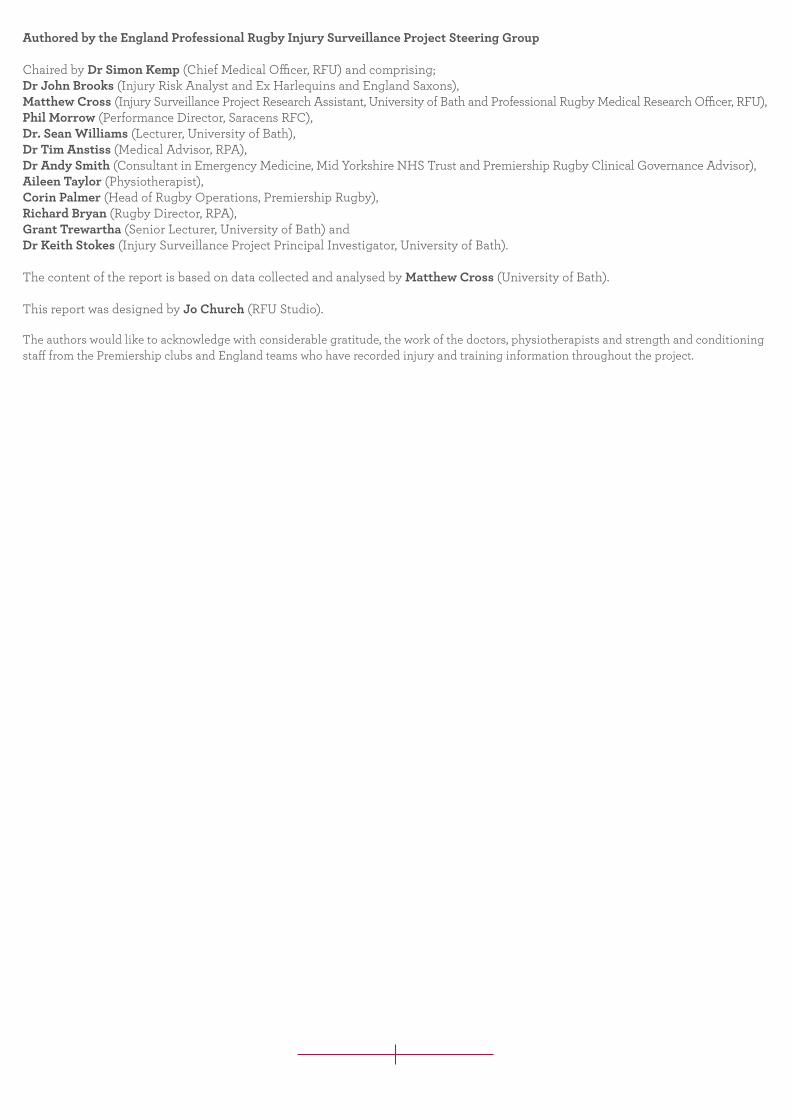
Authored by the England Professional Rugby Injury Surveillance Project Steering Group
Chaired by Dr Simon Kemp (Chief Medical Officer, RFU) and comprising; Dr John Brooks (Injury Risk Analyst and Ex Harlequins and England Saxons), Matthew Cross (Injury Surveillance Project Research Assistant, University of Bath and Professional Rugby Medical Research Officer, RFU), Phil Morrow (Performance Director, Saracens RFC), Dr. Sean Williams (Lecturer, University of Bath), Dr Tim Anstiss (Medical Advisor, RPA), Dr Andy Smith (Consultant in Emergency Medicine, Mid Yorkshire NHS Trust and Premiership Rugby Clinical Governance Advisor), Aileen Taylor (Physiotherapist), Corin Palmer (Head of Rugby Operations, Premiership Rugby), Richard Bryan (Rugby Director, RPA), Grant Trewartha (Senior Lecturer, University of Bath) andDr Keith Stokes (Injury Surveillance Project Principal Investigator, University of Bath).
The content of the report is based on data collected and analysed by Matthew Cross (University of Bath).
This report was designed by Jo Church (RFU Studio).
The authors would like to acknowledge with considerable gratitude, the work of the doctors, physiotherapists and strength and conditioning staff from the Premiership clubs and England teams who have recorded injury and training information throughout the project.
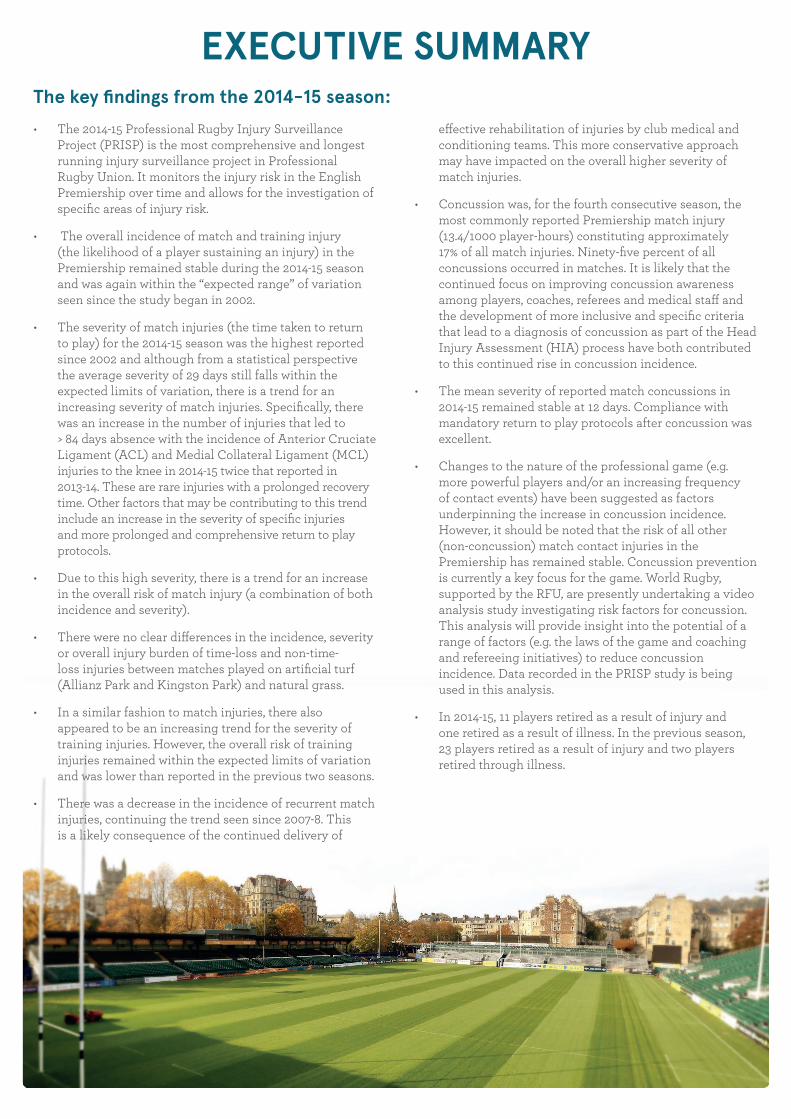
The key findings from the 2014-15 season:
EXECUTIVE SUMMARY
• The 2014-15 Professional Rugby Injury Surveillance Project (PRISP) is the most comprehensive and longest running injury surveillance project in Professional Rugby Union. It monitors the injury risk in the English Premiership over time and allows for the investigation of specific areas of injury risk.
• The overall incidence of match and training injury (the likelihood of a player sustaining an injury) in the Premiership remained stable during the 2014-15 season and was again within the “expected range” of variation seen since the study began in 2002.
• The severity of match injuries (the time taken to return to play) for the 2014-15 season was the highest reported since 2002 and although from a statistical perspective the average severity of 29 days still falls within the expected limits of variation, there is a trend for an increasing severity of match injuries. Specifically, there was an increase in the number of injuries that led to > 84 days absence with the incidence of Anterior Cruciate Ligament (ACL) and Medial Collateral Ligament (MCL) injuries to the knee in 2014-15 twice that reported in 2013-14. These are rare injuries with a prolonged recovery time. Other factors that may be contributing to this trend include an increase in the severity of specific injuries and more prolonged and comprehensive return to play protocols.
• Due to this high severity, there is a trend for an increase in the overall risk of match injury (a combination of both incidence and severity).
• There were no clear differences in the incidence, severity or overall injury burden of time-loss and non-time-loss injuries between matches played on artificial turf (Allianz Park and Kingston Park) and natural grass.
• In a similar fashion to match injuries, there also appeared to be an increasing trend for the severity of training injuries. However, the overall risk of training injuries remained within the expected limits of variation and was lower than reported in the previous two seasons.
• There was a decrease in the incidence of recurrent match injuries, continuing the trend seen since 2007-8. This is a likely consequence of the continued delivery of
effective rehabilitation of injuries by club medical and conditioning teams. This more conservative approach may have impacted on the overall higher severity of match injuries.
• Concussion was, for the fourth consecutive season, the most commonly reported Premiership match injury (13.4/1000 player-hours) constituting approximately 17% of all match injuries. Ninety-five percent of all concussions occurred in matches. It is likely that the continued focus on improving concussion awareness among players, coaches, referees and medical staff and the development of more inclusive and specific criteria that lead to a diagnosis of concussion as part of the Head Injury Assessment (HIA) process have both contributed to this continued rise in concussion incidence.
• The mean severity of reported match concussions in 2014-15 remained stable at 12 days. Compliance with mandatory return to play protocols after concussion was excellent.
• Changes to the nature of the professional game (e.g. more powerful players and/or an increasing frequency of contact events) have been suggested as factors underpinning the increase in concussion incidence. However, it should be noted that the risk of all other (non-concussion) match contact injuries in the Premiership has remained stable. Concussion prevention is currently a key focus for the game. World Rugby, supported by the RFU, are presently undertaking a video analysis study investigating risk factors for concussion. This analysis will provide insight into the potential of a range of factors (e.g. the laws of the game and coaching and refereeing initiatives) to reduce concussion incidence. Data recorded in the PRISP study is being used in this analysis.
• In 2014-15, 11 players retired as a result of injury and one retired as a result of illness. In the previous season, 23 players retired as a result of injury and two players retired through illness.
1
4
4
5
6
9
12
14
16
16
18
20
21
23
24
26
28
22
22
23
Introduction
Updates: 2014-15
Looking Forward
Project Definitions
Match Injury Incidence & Severity
Training Injury Incidence & Severity
Injury Recurrence
Match Injury Event
Time in the Season
Injuries Leading to Retirement
Concussion
Injuries at the Scrum
Artificial Turf
Training Volume
Injury Diagnosis
Other Projects
England Senior Side
Training Injury Event
Hamstring Injuries
Time-Loss Illness
EXECUTIVE SUMMARY
KEY FINDINGS
RFU INJURY SURVEILLANCE PROJECT METHODS
CURRENT PUBLICATIONS & PRESENTATIONS
SUPPLEMENTARY DATA
CONTENTS
30
06
00
31
32
RFU INJURY SURVEILLANCE PROJECT METHODS
CURRENT PUBLICATIONS & PRESENTATIONS
SUPPLEMENTARY DATA
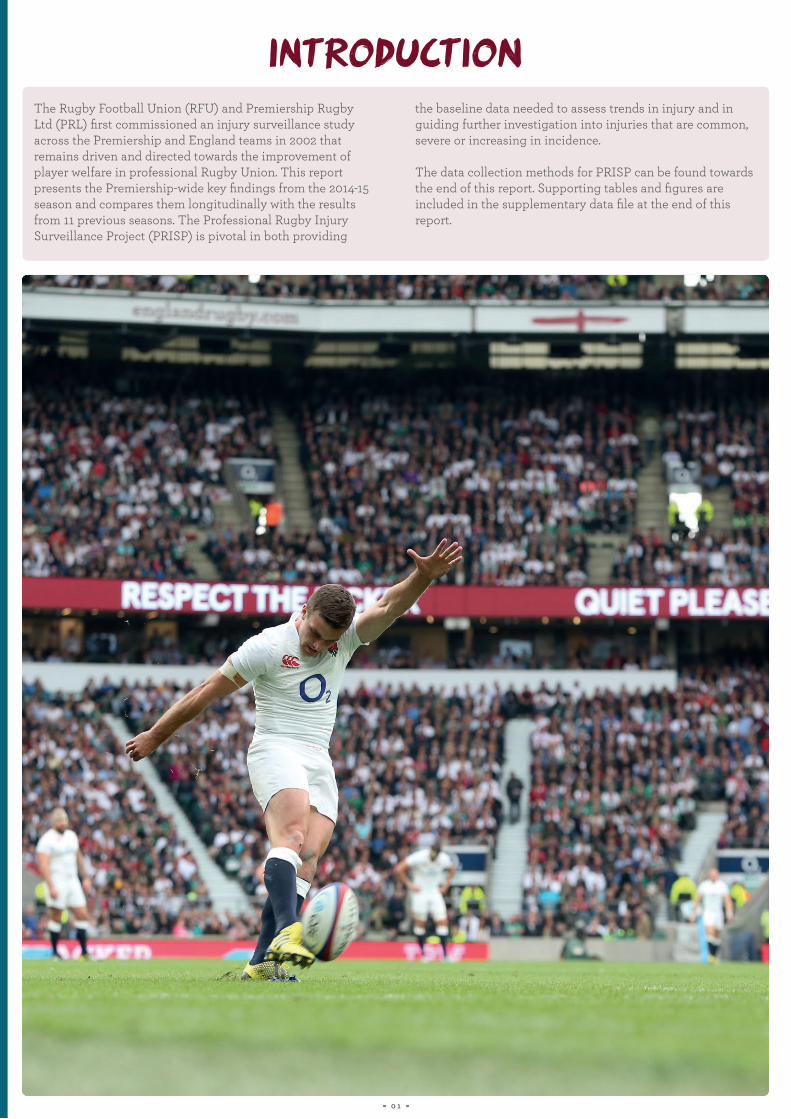
The Rugby Football Union (RFU) and Premiership Rugby Ltd (PRL) first commissioned an injury surveillance study across the Premiership and England teams in 2002 that remains driven and directed towards the improvement of player welfare in professional Rugby Union. This report presents the Premiership-wide key findings from the 2014-15 season and compares them longitudinally with the results from 11 previous seasons. The Professional Rugby Injury Surveillance Project (PRISP) is pivotal in both providing
the baseline data needed to assess trends in injury and in guiding further investigation into injuries that are common, severe or increasing in incidence.
The data collection methods for PRISP can be found towards the end of this report. Supporting tables and figures are included in the supplementary data file at the end of this report.
0 1
INTRODUCTION

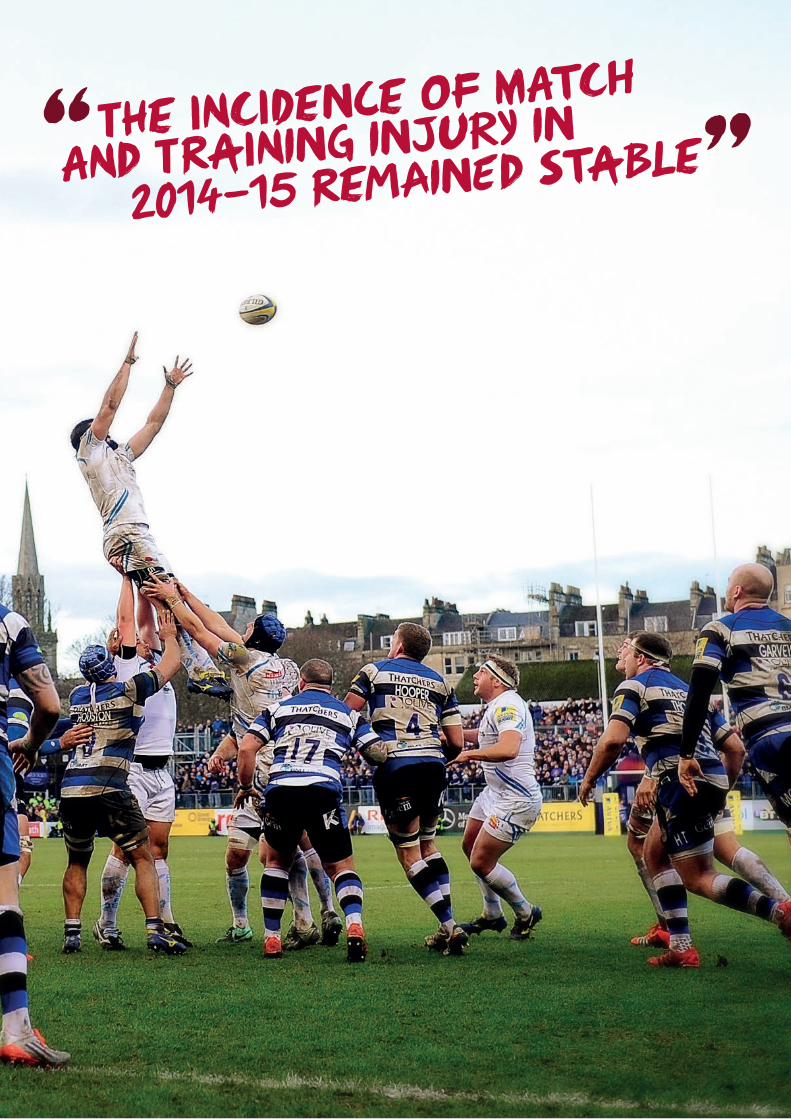
THE INCIDENCE OF MATCH
“ ”AND TRAINING INJURY IN
2014-15 REMAINED STABLE

Return to play following concussion
Training load and injury risk
Scrum engagement
Game events and concussion risk
Artificial turf
Training load and injury risk
In line with a desire to understand more about the return to play following concussion, 2014-15 saw the continuation for a third season of the RFU concussion surveillance project across all 12 Premiership clubs. This was introduced to improve our understanding of the time course of resolution of concussion in professional Rugby Union and includes an
audit of return to play practices. These findings have been released separately to this report via an open access (freely available to all) publication in the British Journal of Sports Medicine, however a summary of the key findings of this study and also of the concussion incidence, severity and risk of concussion during 2014-15 are included in this report.
In a pilot study aligned with the injury surveillance project, individual training and match intensity and load were captured from players at four Premiership clubs during the 2013-14 season (data collection continued in 2014-15 but are currently being analysed). The aim of this study was to
investigate the relationship between training intensity and load and injury risk, an area that has not yet been explored by the Premiership injury surveillance project. A summary of the key findings are included in this report.
2013-14 saw the continuation of the “crouch, bind, set” scrum engagement sequence throughout the game. It is likely that further global analysis will be provided in the near future, however this report continues to highlight the incidence
of time-loss injuries attributed to the scrum in the English Premiership since 2002 and including the 2013-14 and 2014-15 seasons for which the most recent engagement sequence was in operation.
As part of the Rugby Football Union’s continued focus on concussion, and in conjunction with research being conducted by World Rugby, a study investigating the mechanisms of time-loss match concussion in professional Rugby Union is in progress. Footage of match events
associated with a concussion will be analysed from the 2013-14, 2014-15 and 2015-16 Premiership seasons.
During 2014-15, two English Premiership teams played their home fixtures on an artificial playing surface. Our understanding of the influence that the new generation artificial turf has upon injury risk and perceptions of muscle soreness is still developing. To address this, a study was commissioned by the RFU, Premiership Rugby and
the Rugby Players Association. This report gives a short summary of the results from 2013-14 and 2014-15. The study will continue in 2015-16 and will include additional information including the collection of training exposure by surface type and association with training injury risk.
In order to further progress our initial work in this area (as mentioned above, a summary of the current key findings are included in this report), we have expanded the collection of training load data to form a much bigger sample of
Premiership clubs and the inclusion of the England 7s team. An update regarding the development of this study and any new findings will be included in the 2015-16 annual report.
UPDATES: 2014-15
LOOKING FORWARD: 2015-16
0 4
Time-loss injury
Injury severity
Injury incidence and days absence
Illness
Statistical significance
Recurrent injury
NB: The vertical line on each figure denotes the change in data collection methods (from paper to electronic data capture) prior to the start of the 2013-14 season.
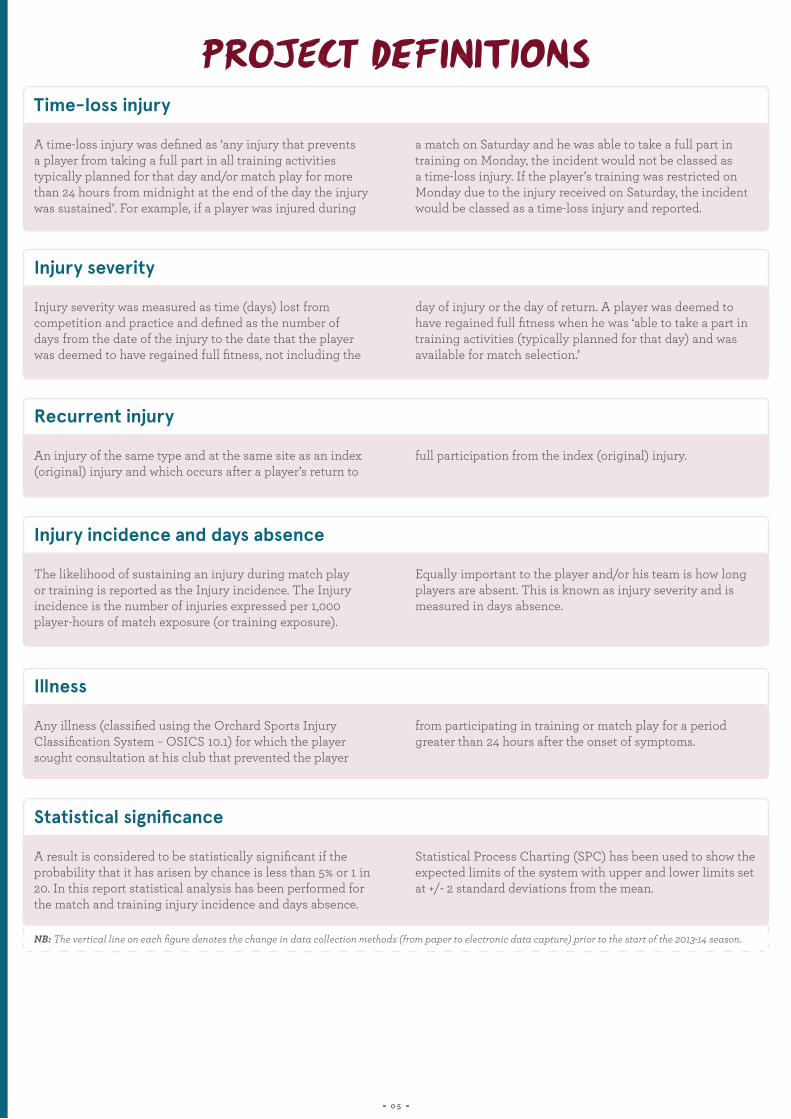
A time-loss injury was defined as ‘any injury that prevents a player from taking a full part in all training activities typically planned for that day and/or match play for more than 24 hours from midnight at the end of the day the injury was sustained’. For example, if a player was injured during
a match on Saturday and he was able to take a full part in training on Monday, the incident would not be classed as a time-loss injury. If the player’s training was restricted on Monday due to the injury received on Saturday, the incident would be classed as a time-loss injury and reported.
Injury severity was measured as time (days) lost from competition and practice and defined as the number of days from the date of the injury to the date that the player was deemed to have regained full fitness, not including the
day of injury or the day of return. A player was deemed to have regained full fitness when he was ‘able to take a part in training activities (typically planned for that day) and was available for match selection.’
The likelihood of sustaining an injury during match play or training is reported as the Injury incidence. The Injury incidence is the number of injuries expressed per 1,000 player-hours of match exposure (or training exposure).
Equally important to the player and/or his team is how long players are absent. This is known as injury severity and is measured in days absence.
Any illness (classified using the Orchard Sports Injury Classification System – OSICS 10.1) for which the player sought consultation at his club that prevented the player
from participating in training or match play for a period greater than 24 hours after the onset of symptoms.
A result is considered to be statistically significant if the probability that it has arisen by chance is less than 5% or 1 in 20. In this report statistical analysis has been performed for the match and training injury incidence and days absence.
Statistical Process Charting (SPC) has been used to show the expected limits of the system with upper and lower limits set at +/- 2 standard deviations from the mean.
An injury of the same type and at the same site as an index (original) injury and which occurs after a player’s return to
full participation from the index (original) injury.
PROJECT DEFINITIONS
0 5
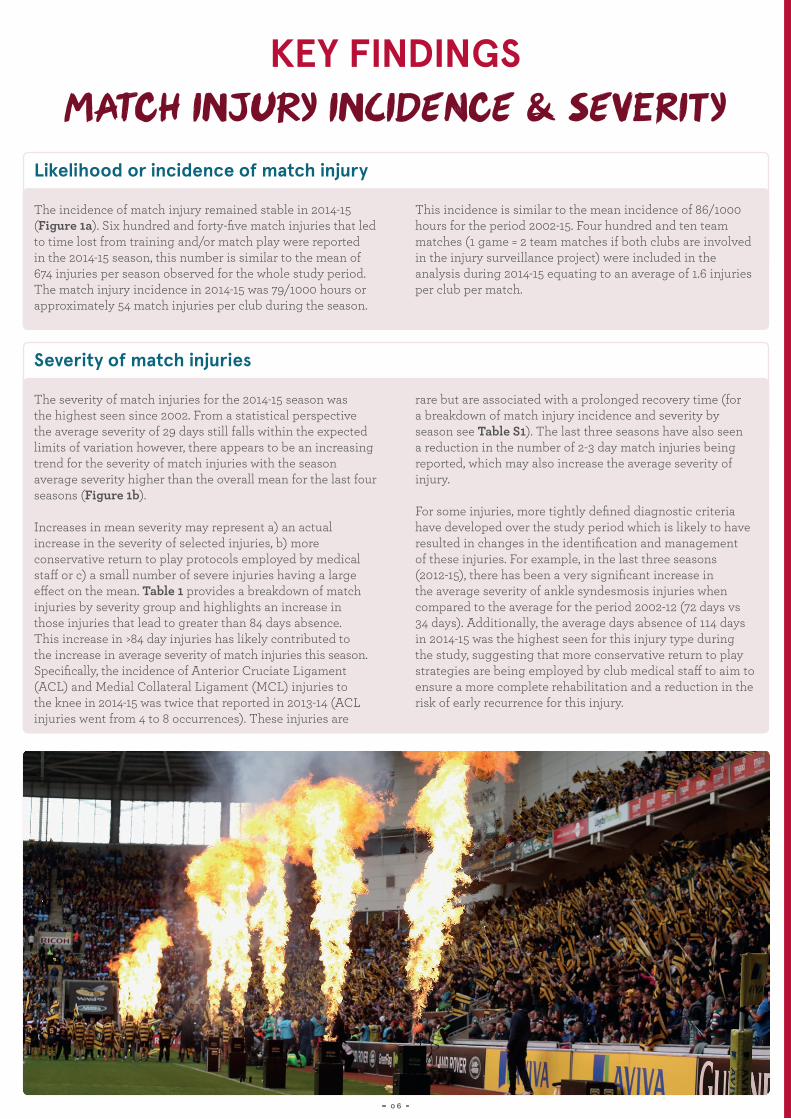
Likelihood or incidence of match injury
Severity of match injuries
The incidence of match injury remained stable in 2014-15 (Figure 1a). Six hundred and forty-five match injuries that led to time lost from training and/or match play were reported in the 2014-15 season, this number is similar to the mean of 674 injuries per season observed for the whole study period. The match injury incidence in 2014-15 was 79/1000 hours or approximately 54 match injuries per club during the season.
This incidence is similar to the mean incidence of 86/1000 hours for the period 2002-15. Four hundred and ten team matches (1 game = 2 team matches if both clubs are involved in the injury surveillance project) were included in the analysis during 2014-15 equating to an average of 1.6 injuries per club per match.
The severity of match injuries for the 2014-15 season was the highest seen since 2002. From a statistical perspective the average severity of 29 days still falls within the expected limits of variation however, there appears to be an increasing trend for the severity of match injuries with the season average severity higher than the overall mean for the last four seasons (Figure 1b).
Increases in mean severity may represent a) an actual increase in the severity of selected injuries, b) more conservative return to play protocols employed by medical staff or c) a small number of severe injuries having a large effect on the mean. Table 1 provides a breakdown of match injuries by severity group and highlights an increase in those injuries that lead to greater than 84 days absence. This increase in >84 day injuries has likely contributed to the increase in average severity of match injuries this season. Specifically, the incidence of Anterior Cruciate Ligament (ACL) and Medial Collateral Ligament (MCL) injuries to the knee in 2014-15 was twice that reported in 2013-14 (ACL injuries went from 4 to 8 occurrences). These injuries are
rare but are associated with a prolonged recovery time (for a breakdown of match injury incidence and severity by season see Table S1). The last three seasons have also seen a reduction in the number of 2-3 day match injuries being reported, which may also increase the average severity of injury.
For some injuries, more tightly defined diagnostic criteria have developed over the study period which is likely to have resulted in changes in the identification and management of these injuries. For example, in the last three seasons (2012-15), there has been a very significant increase in the average severity of ankle syndesmosis injuries when compared to the average for the period 2002-12 (72 days vs 34 days). Additionally, the average days absence of 114 days in 2014-15 was the highest seen for this injury type during the study, suggesting that more conservative return to play strategies are being employed by club medical staff to aim to ensure a more complete rehabilitation and a reduction in the risk of early recurrence for this injury.
KEY FINDINGSMATCH INJURY INCIDENCE & SEVERITY
0 6
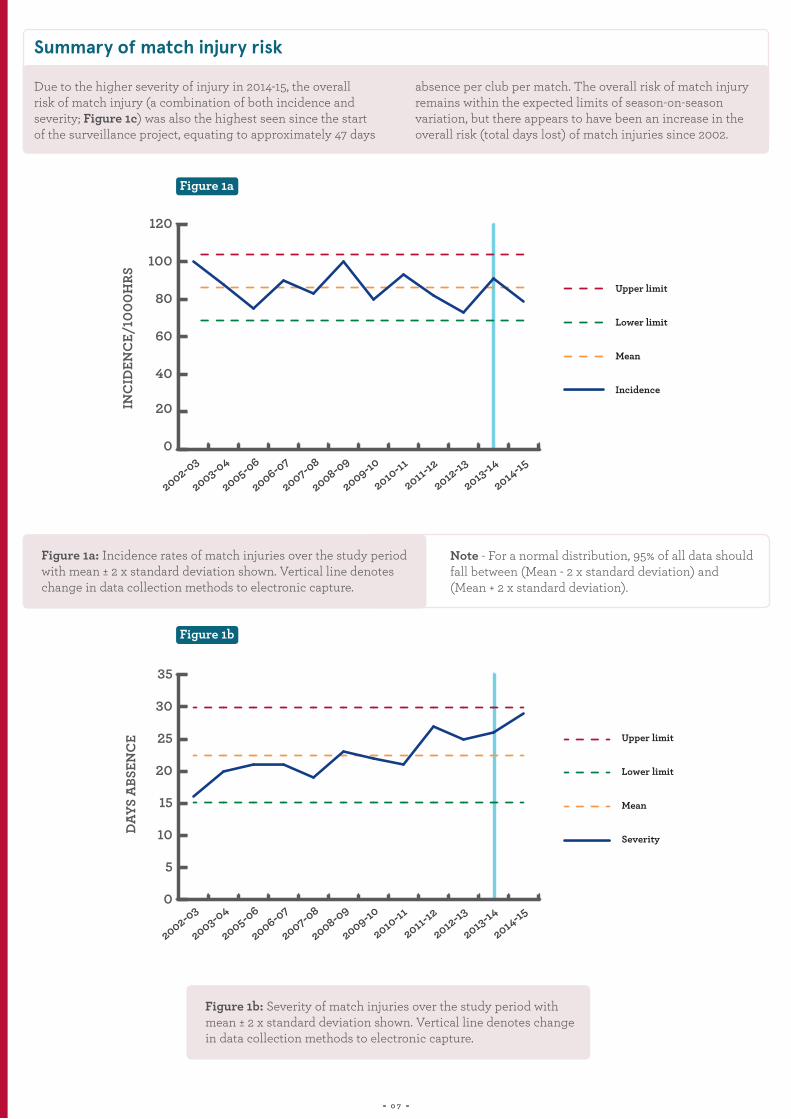
Summary of match injury risk
Due to the higher severity of injury in 2014-15, the overall risk of match injury (a combination of both incidence and severity; Figure 1c) was also the highest seen since the start of the surveillance project, equating to approximately 47 days
absence per club per match. The overall risk of match injury remains within the expected limits of season-on-season variation, but there appears to have been an increase in the overall risk (total days lost) of match injuries since 2002.
Note - For a normal distribution, 95% of all data should fall between (Mean - 2 x standard deviation) and (Mean + 2 x standard deviation).
Figure 1a: Incidence rates of match injuries over the study period with mean ± 2 x standard deviation shown. Vertical line denotes change in data collection methods to electronic capture.
Figure 1b: Severity of match injuries over the study period with mean ± 2 x standard deviation shown. Vertical line denotes change in data collection methods to electronic capture.
Figure 1a
Figure 1b
0 7
0
20
40
60
80
100
120
Upper limit
Lower limit
Mean
Incidence
INC
IDEN
CE/
1000
HRS
2014-15
2013-14
2012-13
2011-12
2010-11
2009-10
2008-09
2007-08
2006-07
2005-06
2003-04
2002-03
0
5
10
15
20
25
30
35
Lower limit
Upper limit
Mean
Severity
FIG 1B
DAYS
ABS
ENC
E
2014-15
2013-14
2012-13
2011-12
2010-11
2009-10
2008-09
2007-08
2006-07
2005-06
2003-04
2002-03

Figure 1c: Days absence/1000 hrs from match injuries over the study period with mean ± 2 x standard deviation shown. Vertical line denotes change in data collection methods to electronic capture.
TRAINING INJURY INCIDENCE & SEVERITY
Table 1: Match injury incidence by severity grouping 2002-15
0 8
2 - 7DAYS
29 - 84DAYS
8 - 28DAYS
> 84DAYS ALL
INCIDENCE /1000 HRS
57 30 9 3 100
45 26 14 4 88
29 29 13 3 75
47 28 11 5 90
39 30 10 4 83
48 31 14 6 100
36 29 10 4 80
44 32 11 5 9334 28 13 7 82
26 30 13 4 73
38 33 14 6 9133 25 12 9 79
Figure 1c
FIG 1C
0
500
1000
1500
2000
2500
3000
Upper Limit
Lower Limit
Mean
Days absence
DAYS
ABS
ENC
E/10
00 H
RS
2014-15
2013-14
2012-13
2011-12
2010-11
2009-10
2008-09
2007-08
2006-07
2005-06
2003-04
2002-03
SEASON
2002-03
2003-04
2005-06
2006-07
2007-08
2008-09
2009-10
2010-112011-12
2012-13
2013-142014-15

Summary of training injury risk
A total of 325 training injuries (34% of the total injury count for 2014-15) led to time lost from training and/or match play were reported in the 2014-15 season. This equated to an incidence rate of 2.3/1000 player hours or approximately 27 injuries per club per season (a season-by-season breakdown can be seen in Table S2).The incidence of injury from training was within the expected limits of natural season-to-season variation and is very similar to the mean incidence seen during the study period (Figure 2a).
The severity of training injuries during season 2014-15 was 28 days and there appears to be a trend for increased severity of injuries, although the data are within the expected limits
of variation (Figure 2b). The severity of training injuries has been higher than the mean severity for the last three seasons and requires careful monitoring. In common with the previous two seasons, as well as the match injury data, it is the most severe injuries that appear to contribute to this higher severity in 2014-15. The incidence of injuries in the 29-84 and >84 day severity categories remained high when compared with previous seasons (Table 2).
Despite this high severity, the overall risk of training injuries (days absence/1000 hours) remained within the expected limits of season-to-season variation and was lower than seen in the previous two seasons (Figure 2c).
Figure 2a: Incidence rates of training injuries over the study period with the mean ± 2 x standard deviation shown. Vertical line denotes change in data collection methods to electronic capture.
TRAINING INJURY INCIDENCE & SEVERITY
0 9
Figure 2a
0.0
0.5
1.0
1.5
2.0
2.5
3.0
3.5
Upper limit
Lower limit
Mean
Incidence
FIG 2A
INC
IDEN
CE/
1000
HRS
2014-15
2013-14
2012-13
2011-12
2010-11
2009-10
2008-09
2007-08
2006-07
2005-06
2003-04
2002-03
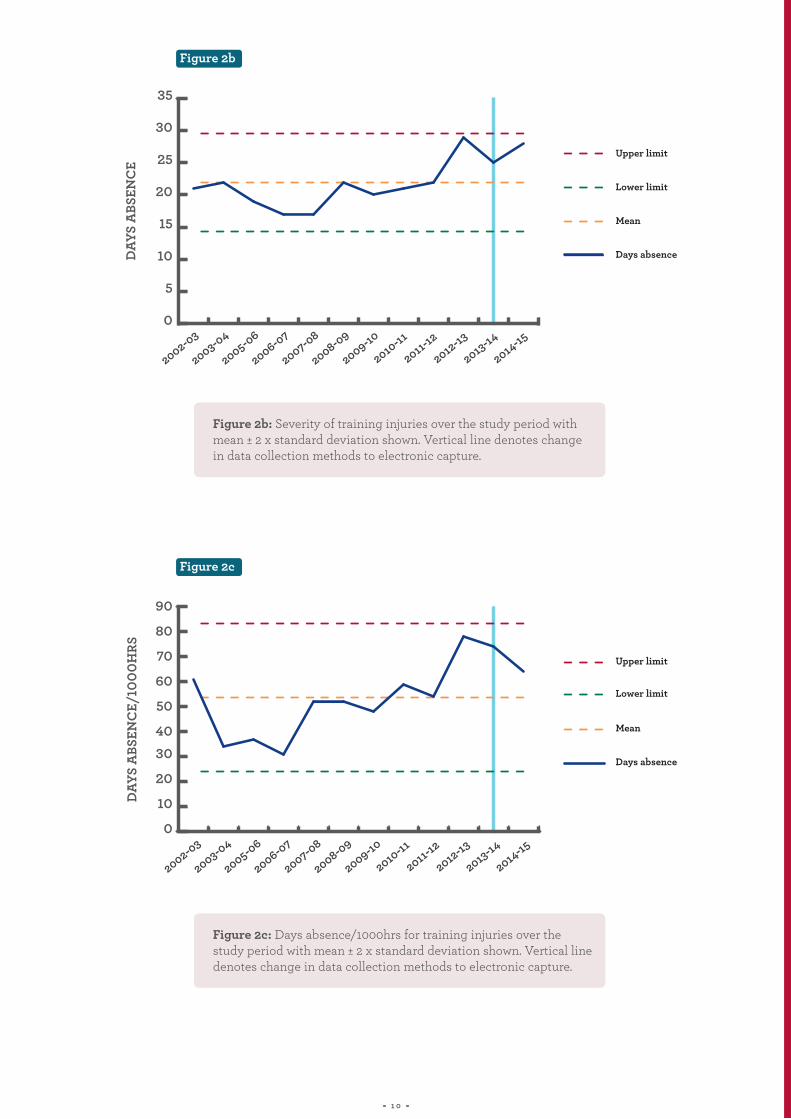
Figure 2b: Severity of training injuries over the study period with mean ± 2 x standard deviation shown. Vertical line denotes change in data collection methods to electronic capture.
Figure 2c: Days absence/1000hrs for training injuries over the study period with mean ± 2 x standard deviation shown. Vertical line denotes change in data collection methods to electronic capture.
1 0
Figure 2b
Figure 2c
0
5
10
15
20
25
30
35
Upper limit
Lower limit
Mean
Days absence
FIG 2B
DAYS
ABS
ENC
E
2014-15
2013-14
2012-13
2011-12
2010-11
2009-10
2008-09
2007-08
2006-07
2005-06
2003-04
2002-03
0
10
20
3040
50
60
70
80
90
Lower limit
Upper limit
Mean
Days absence
FIG 2C
DAYS
ABS
ENC
E/10
00H
RS
2014-15
2013-14
2012-13
2011-12
2010-11
2009-10
2008-09
2007-08
2006-07
2005-06
2003-04
2002-03

Table 2: Training injury incidence by severity grouping 2002-15
1 1
2 - 7DAYS
29 - 84DAYS
8 - 28DAYS
> 84DAYS ALL
INCIDENCE /1000 HRS
1.13 1.29 0.42 0.18 3.0
0.61 0.63 0.30 0.08 1.6
1.04 0.70 0.35 0.10 2.2
0.99 0.61 0.20 0.07 1.9
1.26 1.08 0.38 0.07 2.8
1.00 0.94 0.31 0.10 2.4
1.09 0.89 0.34 0.07 2.4
1.24 1.12 0.32 0.13 2.80.87 0.97 0.30 0.14 2.3
0.90 0.98 0.49 0.21 2.6
0.94 1.25 0.52 0.18 2.90.87 0.82 0.44 0.19 2.3
SEASON
2002-03
2003-04
2005-06
2006-07
2007-08
2008-09
2009-10
2010-112011-12
2012-13
2013-142014-15

INJURY RECURRENCE
Summary of recurrent injury incidence
The incidence of recurrent injuries in match (Figure 3a) and training (Figure 3b) remains within the expected limits of variation in 2014-15 (although season 2002-03 now falls outside of what is expected for recurrent match injuries). The decrease in reported recurrent injuries since 2007-08 continues. The 2014-15 incidence rate for recurrent match injuries was 3.0/1000 player hours and was well below the mean incidence of 8.7/1000 player hours for the period 2002-14. More detailed data regarding the incidence, severity and overall risk of new vs recurrent injuries can be seen in Tables S3 and S4 for match and training respectively.
This may indicate that on average players are undertaking a more comprehensive and conservative rehabilitation, which may have impacted the overall severity of match and training injuries.
The most commonly reported recurrent match injuries during the 2014-15 season were hamstring, soleus and quadriceps muscle injuries (three injuries each) and ankle syndesmosis injury (two injuries). These injury types are similar to those reported in season 2013-14. The severity of the most common recurrent match injuries can be seen in Table S5.
NB: Concussion was not included in the analysis of recurrent injury for consistency with data reported in previous years. A separate section on concussion is presented opposite.
“ ”COMPLIANCE WITH THE MANDATORY
CONCUSSION WAS EXCELLENTRETURN TO PLAY PROTOCOLS AFTER
1 2

Figure 3a: Incidence rates of recurrent match injuries over the study period with mean ± 2 x standard deviation shown. Vertical line denotes change in data collection methods to electronic capture.
Figure 3b: Incidence rates of recurrent training injuries over the study period with mean ± 2 x standard deviation shown. Vertical line denotes change in data collection methods to electronic capture.
INJURY RECURRENCE
1 3
Figure 3a
Figure 3b
02468
1012141618
20
Lower limit
Upper limit
Mean
Incidence
FIG 3A
INC
IDEN
CE/
1000
HRS
2014-15
2013-14
2012-13
2011-12
2010-11
2009-10
2008-09
2007-08
2006-07
2005-06
2003-04
2002-03
0.0
0.1
0.2
0.3
0.4
0.5
0.6
0.7
Lower limit
Upper limit
Mean
Incidence
FIG 3B
INC
IDEN
CE/
1000
HRS
2014-15
2013-14
2012-13
2011-12
2010-11
2009-10
2008-09
2007-08
2006-07
2005-06
2003-04
2002-03
MATCH INJURY EVENT
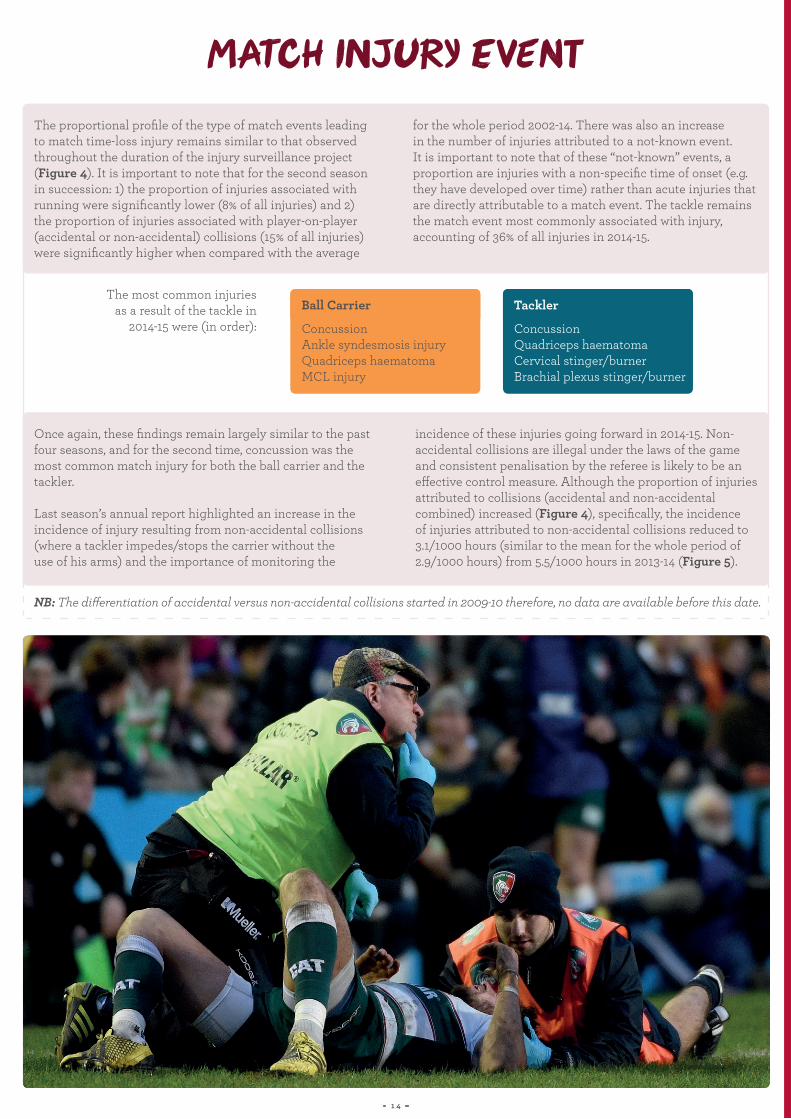
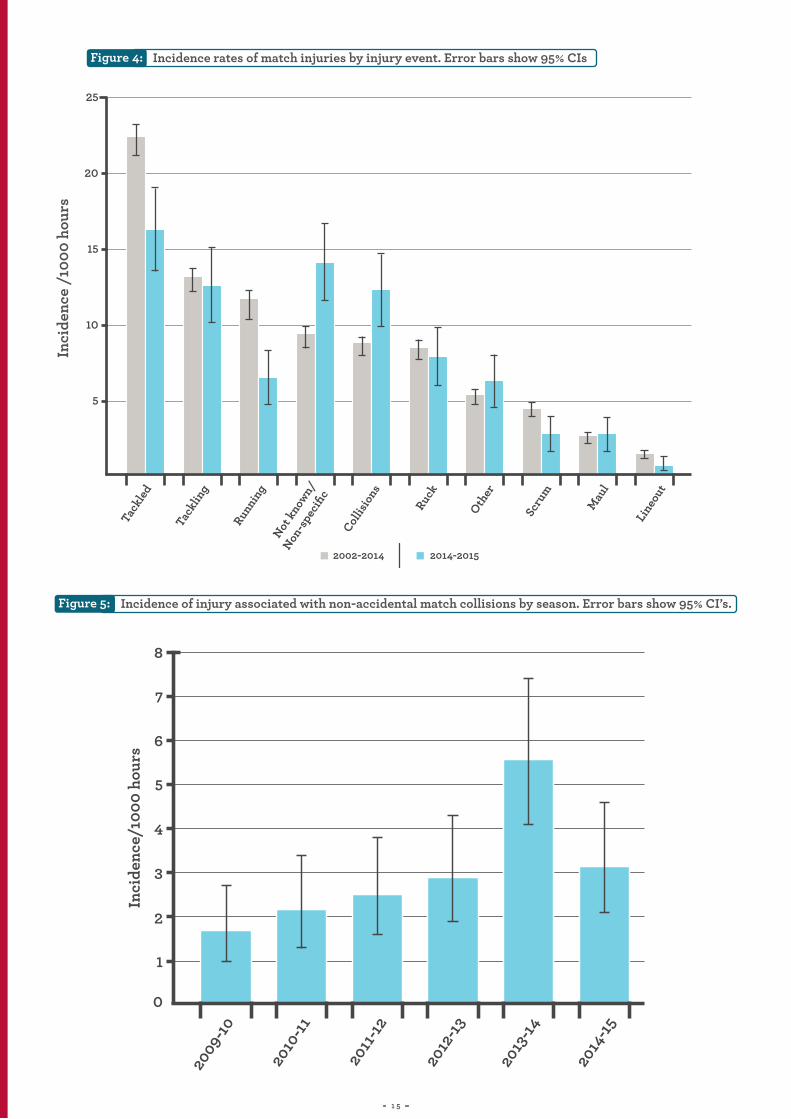
The proportional profile of the type of match events leading to match time-loss injury remains similar to that observed throughout the duration of the injury surveillance project (Figure 4). It is important to note that for the second season in succession: 1) the proportion of injuries associated with running were significantly lower (8% of all injuries) and 2) the proportion of injuries associated with player-on-player (accidental or non-accidental) collisions (15% of all injuries) were significantly higher when compared with the average
for the whole period 2002-14. There was also an increase in the number of injuries attributed to a not-known event. It is important to note that of these “not-known” events, a proportion are injuries with a non-specific time of onset (e.g. they have developed over time) rather than acute injuries that are directly attributable to a match event. The tackle remains the match event most commonly associated with injury, accounting of 36% of all injuries in 2014-15.
Once again, these findings remain largely similar to the past four seasons, and for the second time, concussion was the most common match injury for both the ball carrier and the tackler.
Last season’s annual report highlighted an increase in the incidence of injury resulting from non-accidental collisions (where a tackler impedes/stops the carrier without the use of his arms) and the importance of monitoring the
incidence of these injuries going forward in 2014-15. Non-accidental collisions are illegal under the laws of the game and consistent penalisation by the referee is likely to be an effective control measure. Although the proportion of injuries attributed to collisions (accidental and non-accidental combined) increased (Figure 4), specifically, the incidence of injuries attributed to non-accidental collisions reduced to 3.1/1000 hours (similar to the mean for the whole period of 2.9/1000 hours) from 5.5/1000 hours in 2013-14 (Figure 5).
NB: The differentiation of accidental versus non-accidental collisions started in 2009-10 therefore, no data are available before this date.
Ball Carrier
ConcussionAnkle syndesmosis injuryQuadriceps haematomaMCL injury
Tackler
ConcussionQuadriceps haematomaCervical stinger/burnerBrachial plexus stinger/burner
1 4
The most common injuries as a result of the tackle in
2014-15 were (in order):
MATCH INJURY EVENT Figure 4:
Figure 5:
Incidence rates of match injuries by injury event. Error bars show 95% CIsIn
cide
nce
/100
0 ho
urs
Incidence of injury associated with non-accidental match collisions by season. Error bars show 95% CI’s.
1 5
25
20
15
10
5
Tack
led
Tack
ling
Runni
ngNot
know
n/
Non-s
peci
fic
Collis
ions
Ruck
Other
Scru
m
Mau
l
Line
out
2002-2014 2014-2015
8
7
6
5
4
Inci
denc
e/10
00 h
ours
3
2
1
0
2009-
10
2010
-11
2011
-12
2012
-13
2013
-14
2014
-15
TIME IN THE SEASON
INJURIES LEADING TO RETIREMENT
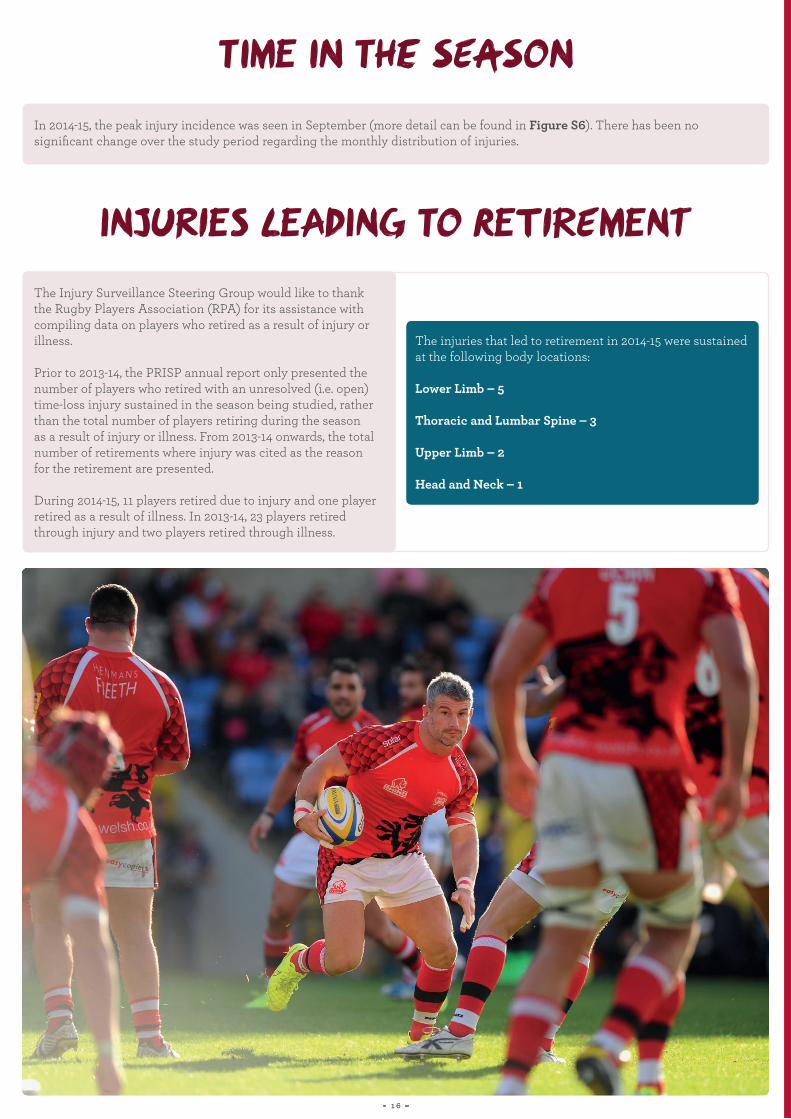
In 2014-15, the peak injury incidence was seen in September (more detail can be found in Figure S6). There has been no significant change over the study period regarding the monthly distribution of injuries.
The Injury Surveillance Steering Group would like to thank the Rugby Players Association (RPA) for its assistance with compiling data on players who retired as a result of injury or illness.
Prior to 2013-14, the PRISP annual report only presented the number of players who retired with an unresolved (i.e. open) time-loss injury sustained in the season being studied, rather than the total number of players retiring during the season as a result of injury or illness. From 2013-14 onwards, the total number of retirements where injury was cited as the reason for the retirement are presented.
During 2014-15, 11 players retired due to injury and one player retired as a result of illness. In 2013-14, 23 players retired through injury and two players retired through illness.
The injuries that led to retirement in 2014-15 were sustained at the following body locations:
Lower Limb – 5
Thoracic and Lumbar Spine – 3
Upper Limb – 2
Head and Neck – 1
1 6

TIME IN THE SEASON
INJURIES LEADING TO RETIREMENT
OF INJURY IN 2014-15 COMPARED
WITH 23 IN 2013-14PLAYERS RETIRED AS A RESULT
11
1 7

CONCUSSION
Prevalence, incidence and severity
During 2014-15 there were 110 reported match concussions (70 Premiership, 23 European Competition and 17 National Cup) compared with 86 in 2013-14. Six concussions occurred in training (compared with 8 in 2013-14). Overall, 95% of concussions occurred in match play and 5% in training. During 2014-15, 83% of players did not have a diagnosed concussion. Of the 17% of players (13% in 2013-14) for whom a concussion was reported by medical staff, 87 players sustained 1 concussion. 8 players sustained 2 concussions, 1 player sustained 3 concussions and 1 player was reported as having sustained 4 concussions. The Rugby Football Union and Premiership Rugby currently recommends that a specialist neurological opinion should be sought for players following a second diagnosed concussion during a 12 month period.
For the fifth consecutive season, the incidence of reported concussions increased (Figure 6). In 2014-15, the reported incidence of concussion was 13.4/1000 hours, and is the highest observed since the start of the surveillance project in 2002. For the second season in succession, the incidence of reported concussions rose above the upper limit of expected variation.
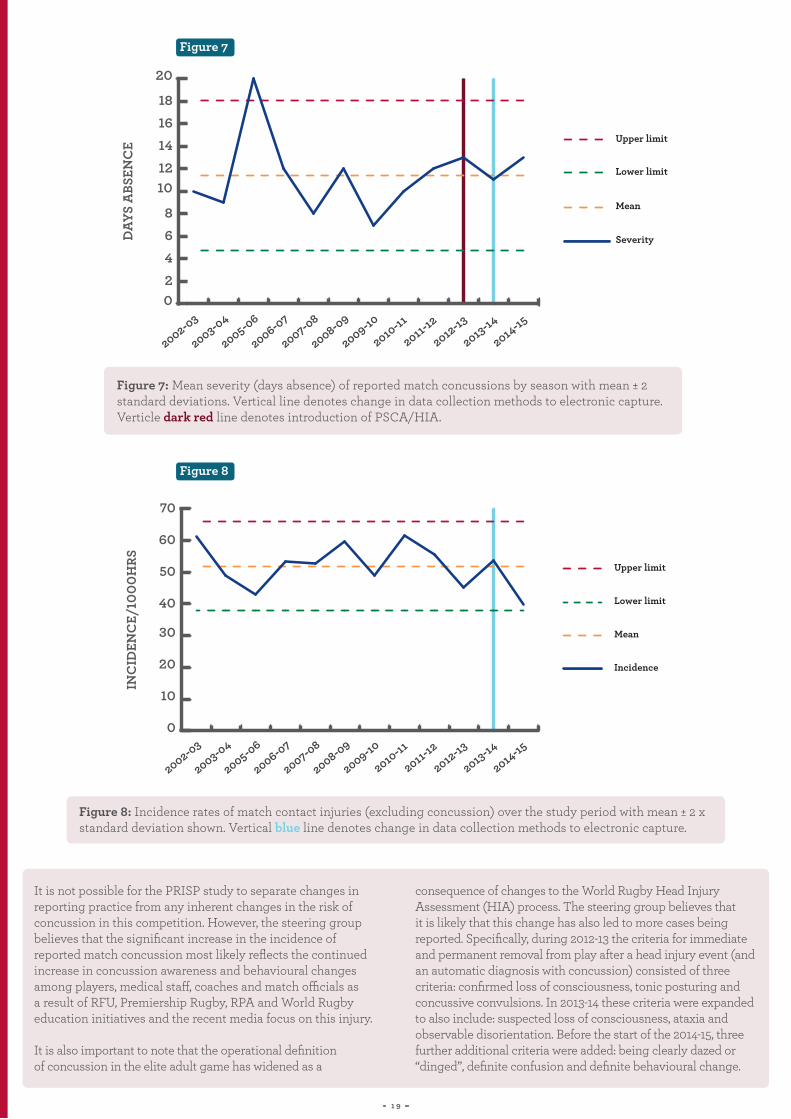
The mean severity of reported match concussions in 2014-15 was 12 days and remains stable (Figure 7). If the current graduated return to play protocol is followed correctly, the minimum time to return to play is six days from the day of injury. In 2014-15, the number of players returning to play earlier than the recommended guidelines continued to fall, with only one player returning in less than six days. This finding highlights the excellent compliance with concussion return to play guidelines in 2014-15.
Figure 6: Incidence per 1000 player hours of reported match concussions by season with mean ± 2 standard deviations. Vertical line denotes change in data collection methods to electronic capture.Verticle dark red line denotes introduction of PSCA/HIA.
1 8
Figure 6
0
2
4
6
8
10
12
14
16
Lower limit
Upper limit
Mean
Incidence
FIG 6
INC
IDEN
CE/
1000
HRS
2014-15
2013-14
2012-13
2011-12
2010-11
2009-10
2008-09
2007-08
2006-07
2005-06
2003-04
2002-03
CONCUSSION
It is not possible for the PRISP study to separate changes in reporting practice from any inherent changes in the risk of concussion in this competition. However, the steering group believes that the significant increase in the incidence of reported match concussion most likely reflects the continued increase in concussion awareness and behavioural changes among players, medical staff, coaches and match officials as a result of RFU, Premiership Rugby, RPA and World Rugby education initiatives and the recent media focus on this injury.
It is also important to note that the operational definition of concussion in the elite adult game has widened as a
consequence of changes to the World Rugby Head Injury Assessment (HIA) process. The steering group believes that it is likely that this change has also led to more cases being reported. Specifically, during 2012-13 the criteria for immediate and permanent removal from play after a head injury event (and an automatic diagnosis with concussion) consisted of three criteria: confirmed loss of consciousness, tonic posturing and concussive convulsions. In 2013-14 these criteria were expanded to also include: suspected loss of consciousness, ataxia and observable disorientation. Before the start of the 2014-15, three further additional criteria were added: being clearly dazed or “dinged”, definite confusion and definite behavioural change.
Figure 7: Mean severity (days absence) of reported match concussions by season with mean ± 2 standard deviations. Vertical line denotes change in data collection methods to electronic capture.Verticle dark red line denotes introduction of PSCA/HIA.
Figure 8: Incidence rates of match contact injuries (excluding concussion) over the study period with mean ± 2 x standard deviation shown. Vertical blue line denotes change in data collection methods to electronic capture.
1 9
Figure 7
Figure 8
02468
1012141618
20
Lower limit
Upper limit
Mean
Severity
FIG 7
DAYS
ABS
ENC
E
2014-15
2013-14
2012-13
2011-12
2010-11
2009-10
2008-09
2007-08
2006-07
2005-06
2003-04
2002-03
0
10
20
30
40
50
60
70
Upper limit
Lower limit
Mean
Incidence
FIG 8
INC
IDEN
CE/
1000
HRS
2014-15
2013-14
2012-13
2011-12
2010-11
2009-10
2008-09
2007-08
2006-07
2005-06
2003-04
2002-03
INJURIES AT THE SCRUM ARTIFICIAL TURF
Figure 9:
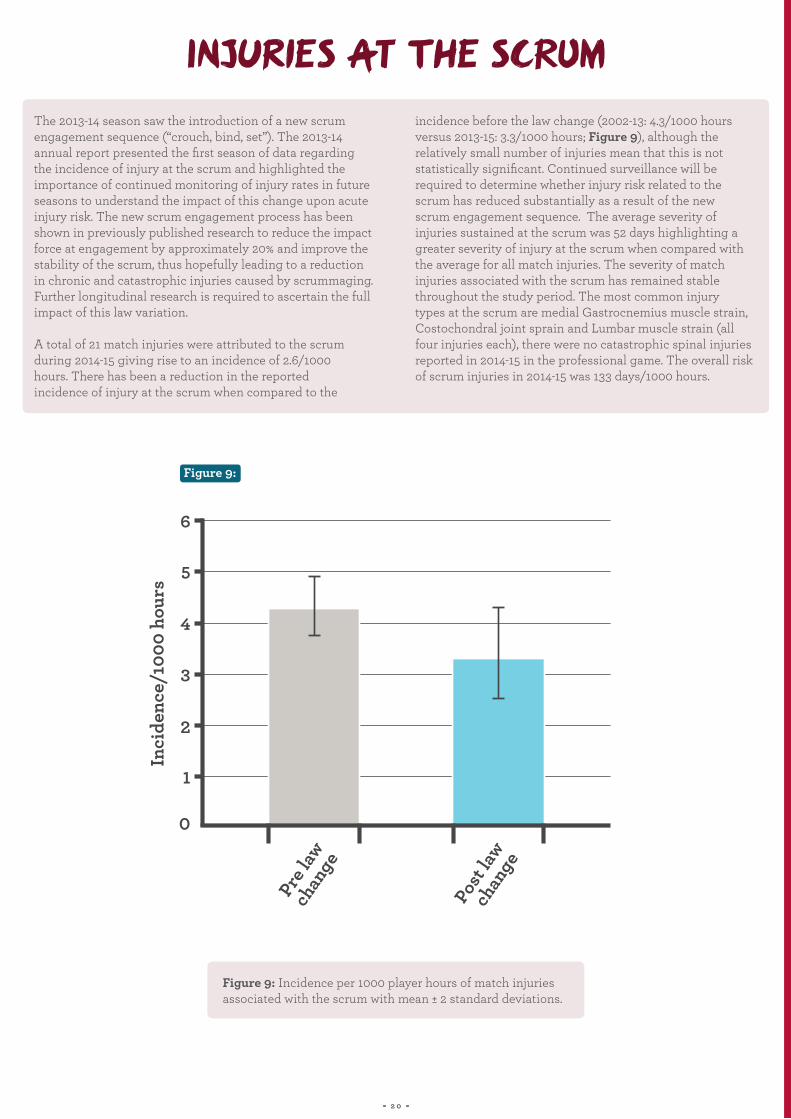
The 2013-14 season saw the introduction of a new scrum engagement sequence (“crouch, bind, set”). The 2013-14 annual report presented the first season of data regarding the incidence of injury at the scrum and highlighted the importance of continued monitoring of injury rates in future seasons to understand the impact of this change upon acute injury risk. The new scrum engagement process has been shown in previously published research to reduce the impact force at engagement by approximately 20% and improve the stability of the scrum, thus hopefully leading to a reduction in chronic and catastrophic injuries caused by scrummaging. Further longitudinal research is required to ascertain the full impact of this law variation.
A total of 21 match injuries were attributed to the scrum during 2014-15 giving rise to an incidence of 2.6/1000 hours. There has been a reduction in the reported incidence of injury at the scrum when compared to the
incidence before the law change (2002-13: 4.3/1000 hours versus 2013-15: 3.3/1000 hours; Figure 9), although the relatively small number of injuries mean that this is not statistically significant. Continued surveillance will be required to determine whether injury risk related to the scrum has reduced substantially as a result of the new scrum engagement sequence. The average severity of injuries sustained at the scrum was 52 days highlighting a greater severity of injury at the scrum when compared with the average for all match injuries. The severity of match injuries associated with the scrum has remained stable throughout the study period. The most common injury types at the scrum are medial Gastrocnemius muscle strain, Costochondral joint sprain and Lumbar muscle strain (all four injuries each), there were no catastrophic spinal injuries reported in 2014-15 in the professional game. The overall risk of scrum injuries in 2014-15 was 133 days/1000 hours.
Figure 9: Incidence per 1000 player hours of match injuries associated with the scrum with mean ± 2 standard deviations.
2 0
6
5
4
Inci
denc
e/10
00 h
ours
3
2
1
0
Pre la
w ch
ange
Post
law
chan
ge
INJURIES AT THE SCRUM ARTIFICIAL TURF
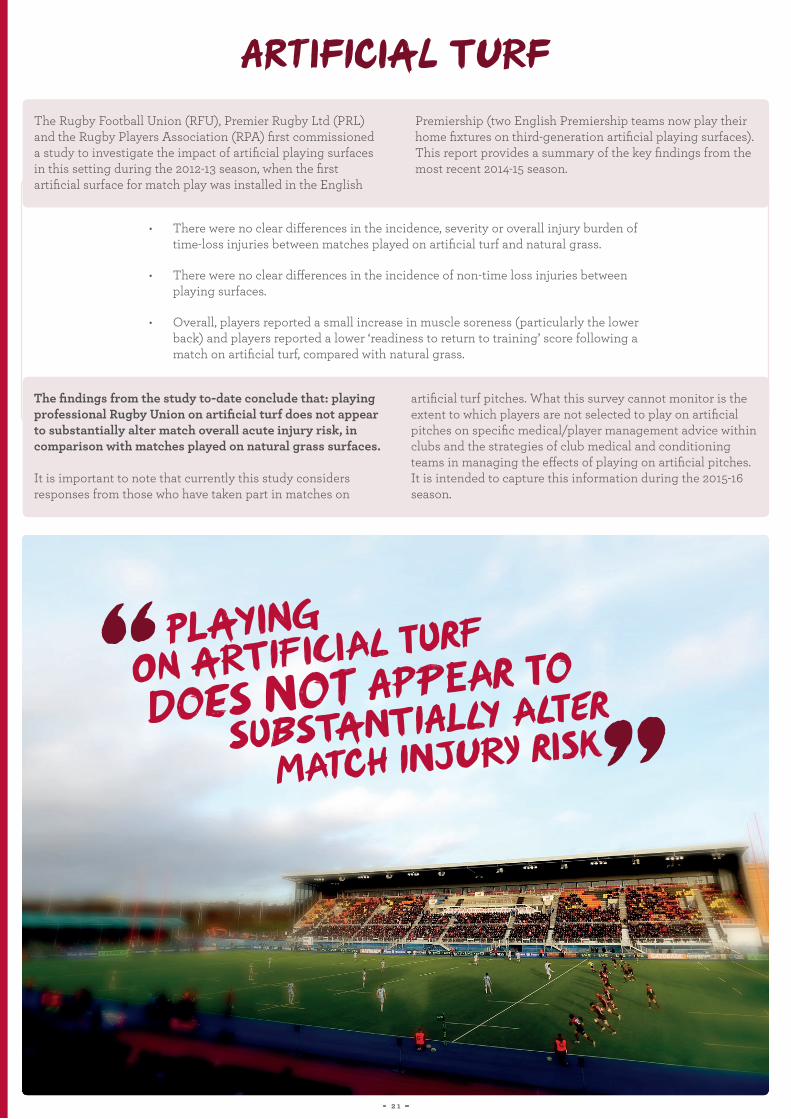
The Rugby Football Union (RFU), Premier Rugby Ltd (PRL) and the Rugby Players Association (RPA) first commissioned a study to investigate the impact of artificial playing surfaces in this setting during the 2012-13 season, when the first artificial surface for match play was installed in the English
Premiership (two English Premiership teams now play their home fixtures on third-generation artificial playing surfaces). This report provides a summary of the key findings from the most recent 2014-15 season.
The findings from the study to-date conclude that: playing professional Rugby Union on artificial turf does not appear to substantially alter match overall acute injury risk, in comparison with matches played on natural grass surfaces.
It is important to note that currently this study considers responses from those who have taken part in matches on
artificial turf pitches. What this survey cannot monitor is the extent to which players are not selected to play on artificial pitches on specific medical/player management advice within clubs and the strategies of club medical and conditioning teams in managing the effects of playing on artificial pitches. It is intended to capture this information during the 2015-16 season.
• There were no clear differences in the incidence, severity or overall injury burden of time-loss injuries between matches played on artificial turf and natural grass.
• There were no clear differences in the incidence of non-time loss injuries between playing surfaces.
• Overall, players reported a small increase in muscle soreness (particularly the lower back) and players reported a lower ‘readiness to return to training’ score following a match on artificial turf, compared with natural grass.
MATCH INJURY RISK
PLAYING
”“ON ARTIFICIAL TURF
DOES NOT APPEAR TO
SUBSTANTIALLY ALTER
2 1
TRAINING INJURY EVENT TIME-LOSS ILLNESS
TRAINING VOLUME
HAMSTRING INJURIES
Figure 10:
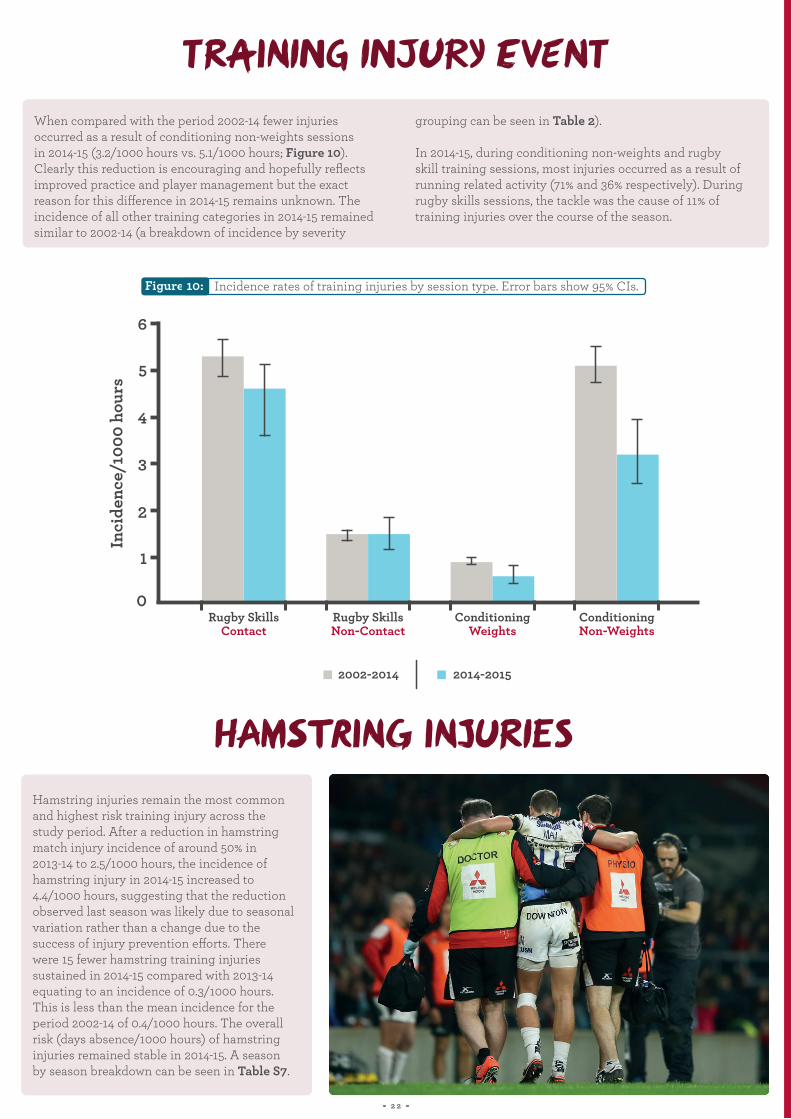
When compared with the period 2002-14 fewer injuries occurred as a result of conditioning non-weights sessions in 2014-15 (3.2/1000 hours vs. 5.1/1000 hours; Figure 10). Clearly this reduction is encouraging and hopefully reflects improved practice and player management but the exact reason for this difference in 2014-15 remains unknown. The incidence of all other training categories in 2014-15 remained similar to 2002-14 (a breakdown of incidence by severity
grouping can be seen in Table 2).
In 2014-15, during conditioning non-weights and rugby skill training sessions, most injuries occurred as a result of running related activity (71% and 36% respectively). During rugby skills sessions, the tackle was the cause of 11% of training injuries over the course of the season.
Hamstring injuries remain the most common and highest risk training injury across the study period. After a reduction in hamstring match injury incidence of around 50% in 2013-14 to 2.5/1000 hours, the incidence of hamstring injury in 2014-15 increased to 4.4/1000 hours, suggesting that the reduction observed last season was likely due to seasonal variation rather than a change due to the success of injury prevention efforts. There were 15 fewer hamstring training injuries sustained in 2014-15 compared with 2013-14 equating to an incidence of 0.3/1000 hours. This is less than the mean incidence for the period 2002-14 of 0.4/1000 hours. The overall risk (days absence/1000 hours) of hamstring injuries remained stable in 2014-15. A season by season breakdown can be seen in Table S7.
2 2
6
5
4
Inci
denc
e/10
00 h
ours
3
2
1
0Rugby Skills
ContactRugby Skills Non-Contact
2002-2014 2014-2015
ConditioningWeights
ConditioningNon-Weights
Incidence rates of training injuries by session type. Error bars show 95% CIs.
TRAINING INJURY EVENT TIME-LOSS ILLNESS
TRAINING VOLUME
The Premiership injury surveillance project has collected time-loss illness data for two seasons (2013-14 and 2014-15). During 2014-15, a total of 155 time-loss illnesses were reported compared with 112 time-loss illnesses in 2013-14. The incidence of time-loss illness this season was 1.0/1000 player days (0.8/1000 player days for the two season period; N.B. The incidence of illness is not directly comparable with the incidence of injury due to the different incidence denominator). Over the two seasons, the mean severity of
time-loss illness was 12 days, with 15% of players reporting at least one time-loss illness. Overall, in 2014-15, illness led to a total of 2701 days lost from training and match play equating to approximately 225 squad days of unavailability per club during the season. Additional seasons of data collection and a better understanding of illness procedures in each club are required in order to present these data in further detail and to allow the monitoring and comparison of illness incidence and severity across multiple seasons.
The most commonly affected systems during the last two seasons (2013-14 and 2014-15) were; Respiratory, Digestive and Dermatological accounting for 31%, 23% and 17% of all reported time-loss illness, respectively. Specifically, upper respiratory tract infections and diarrhoea were the most common diagnoses, each accounting for 12% of all illnesses. Although the comparison of these data is difficult due to a) the lack of scientific literature regarding illness in Rugby
Union b) the lack of a scientific consensus regarding the reporting of illness, it would appear that the incidence of time-loss illness in this cohort is lower than in Super Rugby competition. It should be noted however that it is likely that the increased travel demand and as a consequence, exposure to varied environmental conditions increases the risk of illness in the Super Rugby competition.
The total training volume per player at Premiership clubs in 2014-15 was similar to that for the period 2002-14 (6.0 hours/week vs. 6.5 hours/week, respectively). A similar proportion of time spent in contact and non-contact training means
that any change in training injury incidence is unlikely to be related to a change in type of training. A season by season breakdown can be seen in Table S8.
Incidence and severity of time-loss illness
Most common time-loss illnesses
2 3

INJURY DIAGNOSIS
2011-12
2011-12
2013-14
2013-14
2012-13
2012-13
2014-15
2014-15
For the fourth consecutive season, concussion was the most common match injury (17% of all match injuries; Figure 11a) with the incidence of this injury continuing to rise (Figure 6). It is hoped that the aforementioned video analysis study investigating the mechanisms for concussion from match events will provide further understanding of the potential to reduce concussion incidence in the future. The 2014-15 incidence value again highlights that concussion was previously significantly under-reported (along with the more inclusive sign/symptom checklist to indicate diagnosis and removal from play) and as such the reported incidence for the 2014-15 season should serve as a minimum estimate. In addition, injuries to the AC joint entered the five most common injuries for the first time since 2010-11.
The overall risk of specific match injuries (days absence per 1000 player hours) increased in 2014-15 due to the higher
average severity for all match injuries (Figure 2b). ACL injuries carried the highest risk of any injury with an equal number occurring in contact and non-contact events (Figure 11b). While these injuries are not common (eight ACL injuries were sustained in 2014-15) the average severity was 246 days. For the second season in succession, concussion appears in the top five highest risk (days absence/1000 hours) match injuries. This is due to the increasing incidence of concussion when compared with all other contact injuries (Figure 8) rather than changes to the severity of the injury, which has remained stable throughout the surveillance period (Figure 7).
Overall, the profile of the most common and highest risk match injuries has remained similar throughout the injury surveillance project with the exception of concussion.
Figure 11b: Ranking of the top five highest risk match injuries for each season 2011-15 with the associated days absence/1000hours.
Figure 11a: Ranking of the top five most common match injuries each season for 2011-15 with the associated incidence rates (injuries/1000 hours).
Summary of the most common and highest risk match injuries
Match
The
mos
t com
mon
mat
ch in
juri
esTh
e hi
ghes
t ris
k m
atch
inju
ries
Fi
gure
11b:
Fi
gure
11a:
Concussion 5.1
ACL 186
Concussion 6.7
Anklesyndesmosis 145
Concussion 10.5
MCL 130
Concussion 13.4
ACL 240
Calf muscle 4.8
Shoulderdislocation 108
MCL 3.6
ACL 108
Ankle lat. lig. 2.9
Hamstringmuscle 104
MCL 3.3
Anklesyndesmosis 142
MCL 4.0
PCL/LCL 92
Thighhaematoma 3.3
Claviclefracture 95
Hamstringmuscle 2.5
Anklesyndesmosis 96
AC joint 2.9
MCL 139
Hamstringmuscle 5.0
MCL 148
Hamstringmuscle 4.9
MCL 141
Thighhaematoma 4.2
ACL 116
Hamstringmuscle 4.4
Concussion 189
Thighhaematoma 4.9
Hamstringmuscle 119
Anklesyndesmosis 3.8
Hamstringmuscle 130
MCL 3.7
Concussion 105
Thighhaematoma 3.4
Hamstringmuscle 153
2 4
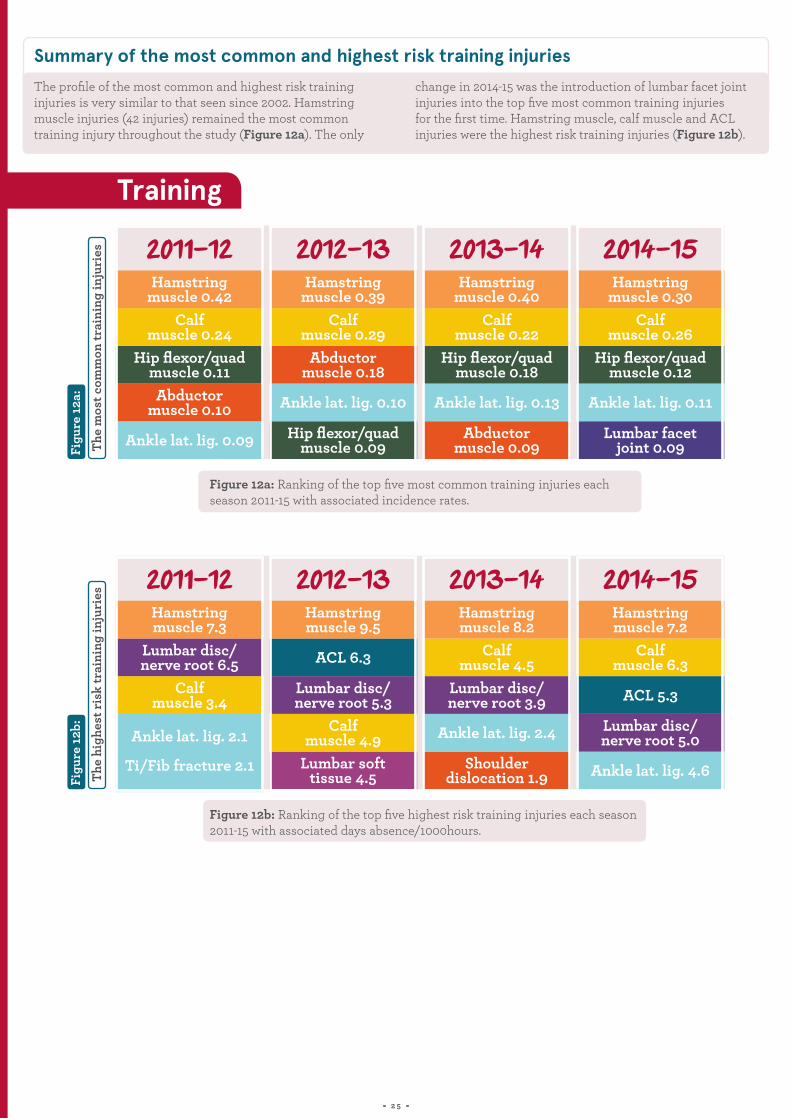
INJURY DIAGNOSISThe profile of the most common and highest risk training injuries is very similar to that seen since 2002. Hamstring muscle injuries (42 injuries) remained the most common training injury throughout the study (Figure 12a). The only
change in 2014-15 was the introduction of lumbar facet joint injuries into the top five most common training injuries for the first time. Hamstring muscle, calf muscle and ACL injuries were the highest risk training injuries (Figure 12b).
Figure 12a: Ranking of the top five most common training injuries each season 2011-15 with associated incidence rates.
Figure 12b: Ranking of the top five highest risk training injuries each season 2011-15 with associated days absence/1000hours.
Summary of the most common and highest risk training injuries
Training
The
mos
t com
mon
trai
ning
inju
ries
Th
e hi
ghes
t ris
k tr
aini
ng in
juri
esFi
gure
12a:
Fi
gure
12b:
2011-12
2011-12
2013-14
2013-14
2012-13
2012-13
2014-15
2014-15
Hamstringmuscle 0.42
Hamstringmuscle 7.3
Hamstringmuscle 0.39
Hamstringmuscle 9.5
Hamstringmuscle 0.40
Hamstringmuscle 8.2
Hamstringmuscle 0.30
Hamstringmuscle 7.2
Abductor muscle 0.10
Ankle lat. lig. 2.1
Ti/Fib fracture 2.1
Ankle lat. lig. 0.10
Calfmuscle 4.9
Ankle lat. lig. 0.13
Ankle lat. lig. 2.4
Ankle lat. lig. 0.11
Lumbar disc/nerve root 5.0
Ankle lat. lig. 0.09 Hip flexor/quadmuscle 0.09
Lumbar soft tissue 4.5
Abductor muscle 0.09
Shoulder dislocation 1.9
Lumbar facetjoint 0.09
Ankle lat. lig. 4.6
Calfmuscle 0.24
Lumbar disc/nerve root 6.5
Calfmuscle 0.29
ACL 6.3
Calfmuscle 0.22
Calfmuscle 4.5
Calfmuscle 0.26
Calfmuscle 6.3
Hip flexor/quadmuscle 0.11
Calfmuscle 3.4
Abductor muscle 0.18
Lumbar disc/nerve root 5.3
Hip flexor/quadmuscle 0.18
Lumbar disc/nerve root 3.9
Hip flexor/quadmuscle 0.12
ACL 5.3
2 5
OTHER PROJECTS
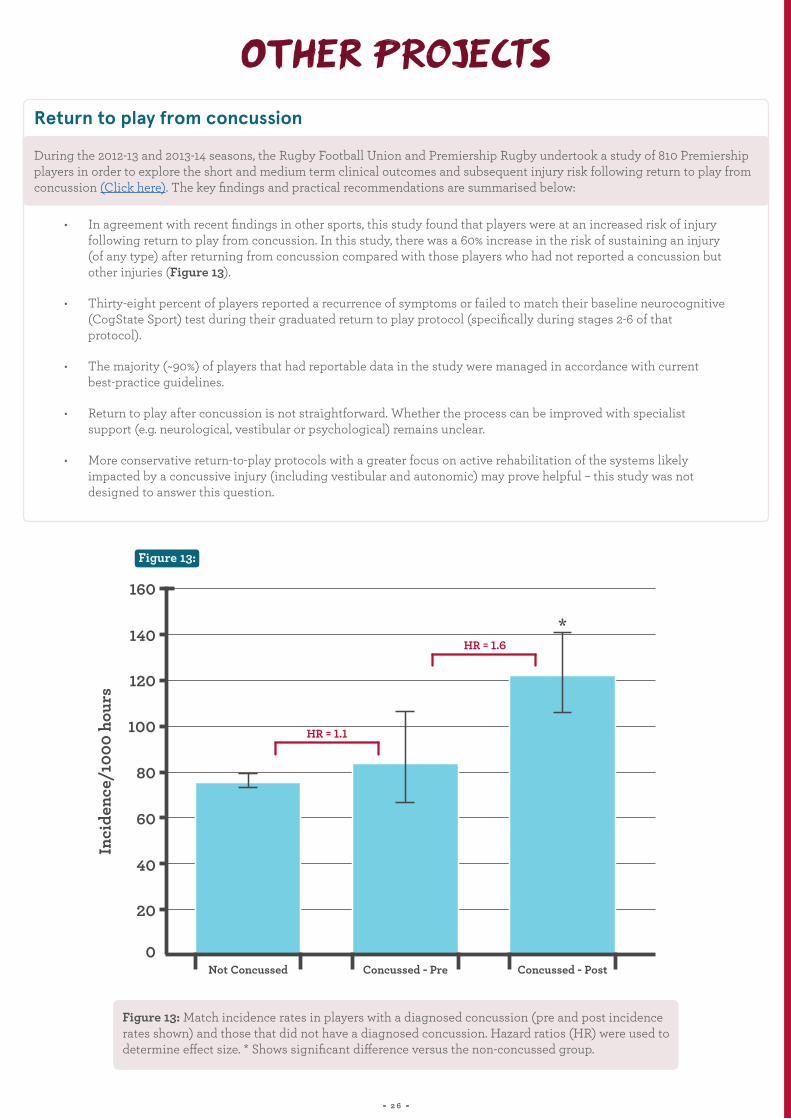
During the 2012-13 and 2013-14 seasons, the Rugby Football Union and Premiership Rugby undertook a study of 810 Premiership players in order to explore the short and medium term clinical outcomes and subsequent injury risk following return to play from concussion (Click here). The key findings and practical recommendations are summarised below:
• In agreement with recent findings in other sports, this study found that players were at an increased risk of injury following return to play from concussion. In this study, there was a 60% increase in the risk of sustaining an injury (of any type) after returning from concussion compared with those players who had not reported a concussion but other injuries (Figure 13).
• Thirty-eight percent of players reported a recurrence of symptoms or failed to match their baseline neurocognitive (CogState Sport) test during their graduated return to play protocol (specifically during stages 2-6 of that protocol).
• The majority (~90%) of players that had reportable data in the study were managed in accordance with current best-practice guidelines.
• Return to play after concussion is not straightforward. Whether the process can be improved with specialist support (e.g. neurological, vestibular or psychological) remains unclear.
• More conservative return-to-play protocols with a greater focus on active rehabilitation of the systems likely impacted by a concussive injury (including vestibular and autonomic) may prove helpful – this study was not designed to answer this question.
Return to play from concussion
Figure 13:
Figure 13: Match incidence rates in players with a diagnosed concussion (pre and post incidence rates shown) and those that did not have a diagnosed concussion. Hazard ratios (HR) were used to determine effect size. * Shows significant difference versus the non-concussed group.
2 6
160
140
120
100
80
Inci
denc
e/10
00 h
ours
60
40
20
0Not Concussed Concussed - Pre
HR = 1.1
*HR = 1.6
Concussed - Post
OTHER PROJECTSThe risk of injury during training is a function of the content/activity, training duration (volume) and also training intensity. Previously, the intensity of training has not been reported by the injury surveillance project however, in order to fully understand the risk of injury during training, training load (a product of volume and intensity) is clearly an important measure to consider. During 2013-14, four clubs participated in a study in order to explore the association between training load measures and injury risk in professional Rugby Union. Each player was asked to report their RPE (using the modified Borg CR 10 RPE Rate of Perceived Exertion scale) for each session confidentially to the strength and conditioning coach without knowledge of other players’ ratings. Session RPE in arbitrary units (AU) for each player was then derived by multiplying RPE and session duration/volume (min). The key findings that can be made from the 2013-14 data are presented below:
• Players had an increased risk of injury if they had high one-week cumulative loads or large week-to-week changes in load.
• A ‘U-shaped’ relationship was observed for four-week cumulative loads, with an apparent increase in risk associated with higher loads (>8651 AU) and a reduction in risk with higher intermediate loads (5932 to 8651 AU).
• Team coaches should monitor a player’s weekly load, week-to-week changes in load and four-week cumulative load, when planning and implementing training to optimise performance whilst minimising injury risk.
• Given that these findings suggest that a high weekly load and a large absolute change in load increase the risk of injury in professional Rugby Union players, trying to periodise training schedules with alternating heavy and light training weeks is not recommended (as opposed to alternating heavy and light days which requires further investigation). One way that this may be achieved in practice is for coaches to prescribe stable and consistent weekly loads throughout the season in order to prevent any spikes in acute workload.
• Professional players may have a four-week cumulative training load limit, and that exceeding this threshold is associated with a substantial increase in injury risk. These findings should provide a starting point for planning and monitoring individual player training thresholds.
NB: From 2015-16 onwards, this study has been expanded to include data collection for all 12 Premiership clubs. It is therefore anticipated that more detailed findings regarding the training load-injury relationship in the English Premiership will be presented in future PRISP annual reports.
Training load and injury risk
2 7
ENGLAND SENIOR SIDE
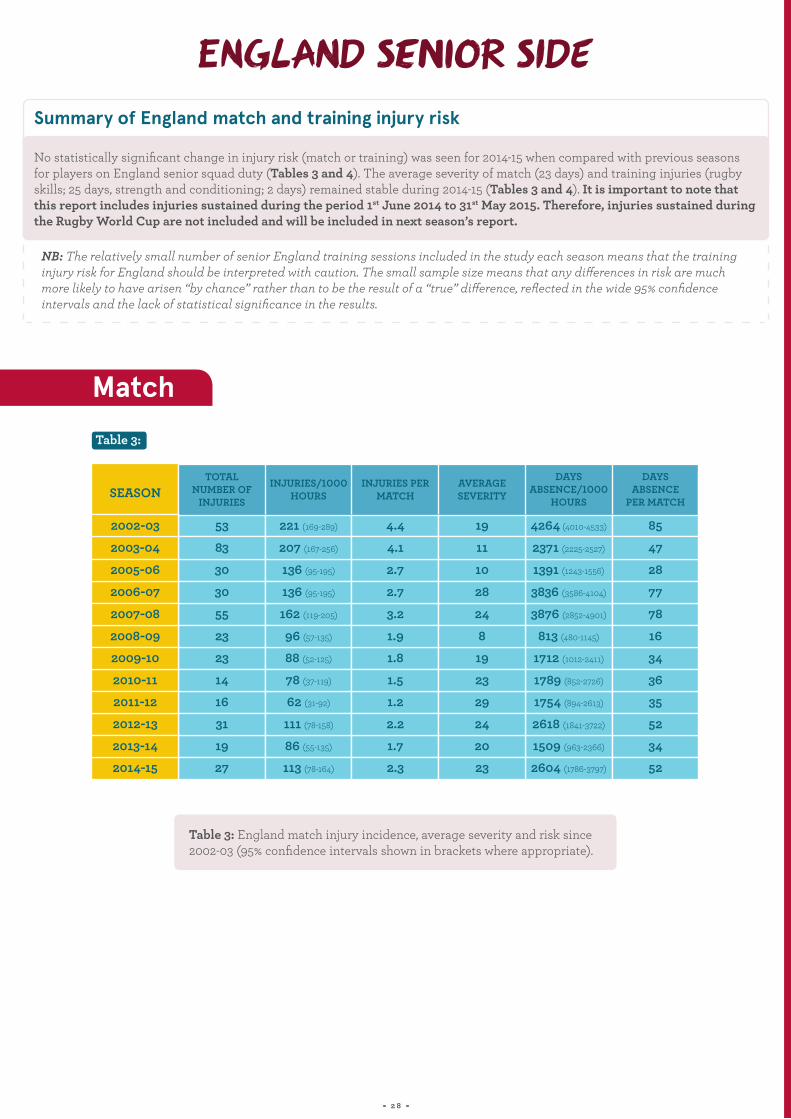
No statistically significant change in injury risk (match or training) was seen for 2014-15 when compared with previous seasons for players on England senior squad duty (Tables 3 and 4). The average severity of match (23 days) and training injuries (rugby skills; 25 days, strength and conditioning; 2 days) remained stable during 2014-15 (Tables 3 and 4). It is important to note that this report includes injuries sustained during the period 1st June 2014 to 31st May 2015. Therefore, injuries sustained during the Rugby World Cup are not included and will be included in next season’s report.
NB: The relatively small number of senior England training sessions included in the study each season means that the training injury risk for England should be interpreted with caution. The small sample size means that any differences in risk are much more likely to have arisen “by chance” rather than to be the result of a “true” difference, reflected in the wide 95% confidence intervals and the lack of statistical significance in the results.
Summary of England match and training injury risk
Table 3: England match injury incidence, average severity and risk since 2002-03 (95% confidence intervals shown in brackets where appropriate). “
2 8
Table 3:
TOTAL NUMBER OF
INJURIES
INJURIES PER MATCH
DAYS ABSENCE/1000
HOURS
INJURIES/1000HOURS
AVERAGE SEVERITY
DAYS ABSENCE
PER MATCH
53 221 (169-289) 4.4 4264 (4010-4533)19 85
83 207 (167-256) 4.1 2371 (2225-2527)11 47
30 136 (95-195) 2.7 1391 (1243-1556)10 28
30 136 (95-195) 2.7 3836 (3586-4104)28 77
55 162 (119-205) 3.2 3876 (2852-4901)24 78
23 96 (57-135) 1.9 813 (480-1145)8 16
23 88 (52-125) 1.8 1712 (1012-2411)19 34
14 78 (37-119) 1.5 1789 (852-2726)23 3616 62 (31-92) 1.2 1754 (894-2613)29 35
31 111 (78-158) 2.2 2618 (1841-3722)24 52
19 86 (55-135) 1.7 1509 (963-2366)20 3427 113 (78-164) 2.3 2604 (1786-3797)23 52
SEASON
2002-03
2003-04
2005-06
2006-07
2007-08
2008-09
2009-10
2010-112011-12
2012-13
2013-142014-15
Match

ENGLAND SENIOR SIDE
Table 4: England training injury incidence, average severity and risk since 2002-03 (95% confidence intervals shown in brackets where appropriate).
THERE WAS A CONTINUED
“DECREASE IN THE LIKELIHOOD OF
AND CONDITIONING TEAMS.
MATCH INJURIES RECURRING,
THE EFFECTIVENESS OF CLUB MEDICAL A LIKELY CONSEQUENCE OF
” 2 9
Table 4:
DAYS ABSENCE/1000
HOURS
AVERAGE SEVERITY
AVERAGE SEVERITY
INJURIES/1000HOURS
INJURIES/1000HOURS
DAYS ABSENCE/1000
HOURS
4.5 (2.6-8.0)
7.6 (5.3-11.0)
0.6 (0.1-4.0)
9.8 (5.9-16.3)
7.3 (4.5-10.1)
6.5 (3.0-10.0)
5.3 (3.4-8.3)
1.7 (0.8-3.5)
3.2 (1.4-5.1)
3.7 (1.6-9.0)
7.9 (4.7-13.3)
3.3 (1.6-6.9)
15
12
4
15
9
20
8
7
22
20
11
25
69 (60-80)
89 (80-99)
2 (1-6)
149 (131-169)
74 (46-103)
135 (62-209)
46 (30-73)
12 (6-26)
70 (31-110)
58 (24-139)
87 (52-147)
85 (50-145)
4.0 (1.0-15.9)
6.3 (3.8-10.3)
-
-
2.5 (0.5-4.6)
12.1 (4.2-20.0)
4.0 (2.0-8.6)
4.4 (1.8-10.5)
2.8 (0.4-5.3)
1.1 (0.2-7.8)
3.9 (1.3-12.1)
2.3 (0.6-9.2)
4
13
-
-
12
18
6
5
18
9
14
2
16 (8-32)
79 (68-90)
-
-
34 (7-61)
233 (81-385)
26 (12-55)
22 (9-53)
51 (6-95)
10 (1-71)
57 (18-177)
3 (1-80)
SEASON
2002-03
2003-04
2005-06
2006-07
2007-08
2008-09
2009-10
2010-112011-12
2012-13
2013-142014-15
Training
RFU INJURY SURVEILLANCE PROJECT METHODS CURRENT PUBLICATIONS & PRESENTATIONS
Written informed consent was obtained from 577 registered Premiership squad players for the 2014-15 season, there were three players that formally refused consent. A total of 410 team games were included in the analyses for the 2014-2015 season.
Injuries from consented first team squad (including academy players that trained regularly with the first team) players sustained in training and in all matches in the Aviva Premiership, LV Cup and European Competitions (Champions and Challenge Cup) were included. Injuries sustained while players represented England were reported and analysed separately.
Match and training injury data, and training exposure data, were provided by all 12 Premiership clubs in 2014-2015. A complete set of data were collected from all 12 Premiership clubs and the England senior side.
Medical personnel at each Premiership club and the England senior team reported the details of injuries and illnesses sustained by a player at their club/team that were included in the study group together with the details of the associated injury event using an online medical record keeping system. Strength and conditioning staff recorded the squad’s weekly training schedules and exposure on a password protected online system. Team match days were also recorded by strength and conditioning staff.
Injury and illness diagnoses were recorded using the Orchard Sports Injury Classification System (OSICS) version 10.1. This sports specific injury classification system allows detailed diagnoses to be reported and injuries to be grouped by body part and injury pathology.
The definitions and data collection methods utilised in this study are aligned with the IRB (now World Rugby) Consensus statement on injury definitions and data collection procedures for studies of injuries in Rugby Union.
3 0
RFU INJURY SURVEILLANCE PROJECT METHODS CURRENT PUBLICATIONS & PRESENTATIONS
Further detailed information on injury risk in this cohort of players can be obtained from the following peer reviewed publications that have been produced as part of the Premiership injury surveillance project.
Publications
MJ Cross, G Trewartha, A Smith, SPT Kemp & KA Stokes. Professional Rugby Union players have a 60% greater risk of time loss injury after concussion: a 2-season prospective study of clinical outcomes, 2015. British Journal of Sports Medicine pp.bjsports-2015.
MJ Cross, S Williams, G Trewartha, SPT Kemp & KA Stokes. The influence of in-season training loads on injury risk in professional rugby union, 2015. International Journal of Sports Physiology and Performance.
S Williams, G Trewartha, SPT Kemp, JHM Brooks, CW Fuller, AE Taylor, MJ Cross & KA Stokes. Time-loss injuries compromise team success in elite Rugby Union: A 7-year prospective study, 2015. British Journal of Sports Medicine bjsports-2015.
CW Fuller, AE Taylor & M Raftery. Epidemiology of concussion in men's elite Rugby-7s (Sevens World Series) and Rugby-15s (Rugby World Cup, Junior World Championship and Rugby Trophy, Pacific Nations Cup and English Premiership). British Journal of Sports Medicine 2014; 10.1136/bjsports-2013-093381.
AE Taylor, SPT Kemp, G Trewartha & KA Stokes. Scrum injury risk in English professional rugby union. British Journal of Sports Medicine 2014; 48(13) 1066-1068.
S Williams, G Trewartha, SPT Kemp & KA Stokes. A meta-analysis of injuries in senior men's professional rugby union. Sports Medicine 2013; 43(10) 1043-1055.
CW Fuller, AE Taylor JHM Brooks & SPT Kemp Changes in the stature, body mass and age of English professional rugby players: A 10-year review, Journal of Sports Sciences 2012 DOI:10.1080/02640414.2012.753156.
SC Cheng, ZK Sivardeen, WA Wallace, D Buchanan, D Hulse, KJ Fairbairn, SP Kemp & JH Brooks. Shoulder instability in professional rugby players-the significance of shoulder laxity. Clinical Journal of Sports Medicine 2012 Sep; 22(5):397-402.
CJ Pearce, JHM Brooks, SP Kemp & JD Calder. The epidemiology of foot injuries in professional rugby union players Foot & Ankle Surgery. 2011 Sep; 17(3):113-8. Epub 2010 Mar 5.
JHM Brooks & SPT Kemp Injury prevention priorities according to playing position in professional rugby union players. British Journal of Sports Medicine 2011 Aug;45(10):765-75. Epub 2010 May 19.
RA Sankey, JHM Brooks, SPT Kemp & FS Haddad The epidemiology of ankle injuries in professional rugby union players. American Journal of Sports Medicine Dec 2008; 36:2415-2424.
CW Fuller, T Ashton, JHM Brooks, RJ Cancea, J Hall, & SPT Kemp Injury risks associated with tackling in rugby union. British Journal of Sports Medicine 2010; 44(3): 159-167.
JHM Brooks, CW Fuller, SPT Kemp & DB Reddin An assessment of training volume in professional rugby union and its impact on the incidence, severity and nature of match and training injuries. Journal of Sports Sciences 2008 26:8, 863-873.
SPT Kemp, Z Hudson, JHM Brooks & CW Fuller. The epidemiology of head injuries in English professional rugby union. Clinical Journal of Sports Medicine 2008; 18:227-234.
CW Fuller, JHM Brooks, RJ Cancea, J Hall, & SPT Kemp Contact events in rugby union and their propensity to cause injury. British Journal of Sports Medicine, Dec 2007; 41: 862 - 867.
J Headey, JHM Brooks & SPT Kemp. The epidemiology of shoulder injuries in English professional rugby union. American Journal of Sports Medicine, Sep 2007; 35: 1537 - 1543.
RJ Dallana, JHM Brooks, SPT Kemp & AW Williams. The epidemiology of knee injuries in English professional rugby union. American Journal of Sports Medicine, May 2007; 35: 818 – 830.
CW Fuller, JHM Brooks & SPT Kemp. Spinal injuries in professional rugby union: a prospective cohort study. Clinical Journal of Sport Medicine, 2007; 17 (1): 10-16.
JHM Brooks, CW Fuller, SPT Kemp & DB Reddin. Incidence, risk and prevention of hamstring muscle injuries in professional rugby union. American Journal of Sports Medicine, 2006; 34: 1297-1307.
JHM Brooks, CW Fuller, SPT Kemp & DB Reddin. Epidemiology of injuries in English professional rugby union: part 1 match injuries. British Journal of Sports Medicine, Oct 2005; 39: 757 - 766.
JHM Brooks, CW Fuller, SPT Kemp & DB Reddin. Epidemiology of injuries in English professional rugby union: part 2 training injuries. British Journal of Sports Medicine, Oct 2005; 39: 767 – 775.
JHM Brooks, CW Fuller, SPT Kemp & DB Reddin A prospective study of injuries and training amongst the England 2003 Rugby World Cup squad British Journal of Sports Medicine, May 2005; 39: 288 – 293.
Abstracts/Presentations
MJ Cross, SPT Kemp, A Smith, G Trewartha & KA Stokes. Injury risk after returning from concussion in elite Rugby Union players. Presented at: The 8th World Congress on Science and Football, Copenhagen, 2015.
S Williams, G Trewartha, SPT Kemp, JHM Brooks, CW Fuller, A Taylor, MJ Cross, & KA Stokes. Association between injuries and team success in elite Rugby Union. Presented at: The World Congress on Science and Football, Copenhagen, 2015.
JHM Brooks, CW Fuller, SPT Kemp & DB Reddin. The Incidence, Severity and Nature of Injuries Caused by Tackling in Professional Rugby Union Competition. Presented (poster) at The American College of Sports Medicine Annual Meeting, 1st June 2006. Published in: Medicine and Science in Sports and Exercise 2006: 38(5) S351-352.
JHM Brooks, CW Fuller, SPT Kemp. The Incidence, Severity and Nature of Groin Injuries in Professional Rugby Union. Presented at The American College of Sports Medicine Annual Meeting, 1st June 2006. Published in: Medicine and Science in Sports and Exercise 2006: 38(5) S351.
JHM Brooks, CW Fuller, SPT Kemp & DB Reddin. The incidence, severity and nature of injuries caused by being tackled in professional rugby union. Presented (oral) at The Faculty of Sports and Exercise Medicine, Royal College of Physicians Ireland (RCPI) and Royal College of Surgeons, Ireland (RCSI) Annual Scientific Meeting, Dublin, 5th September 2005.
JHM Brooks, CW Fuller, SPT Kemp. The incidence, severity, and nature of scrummaging injuries in professional rugby union. Presented (poster) at 1st World Congress of Sports Injury Prevention, Oslo, Norway 23rd-25th June 2005. Published in: Br J Sports Med 39: 377.
3 1
SUPPLEMENTARY DATA
3 2
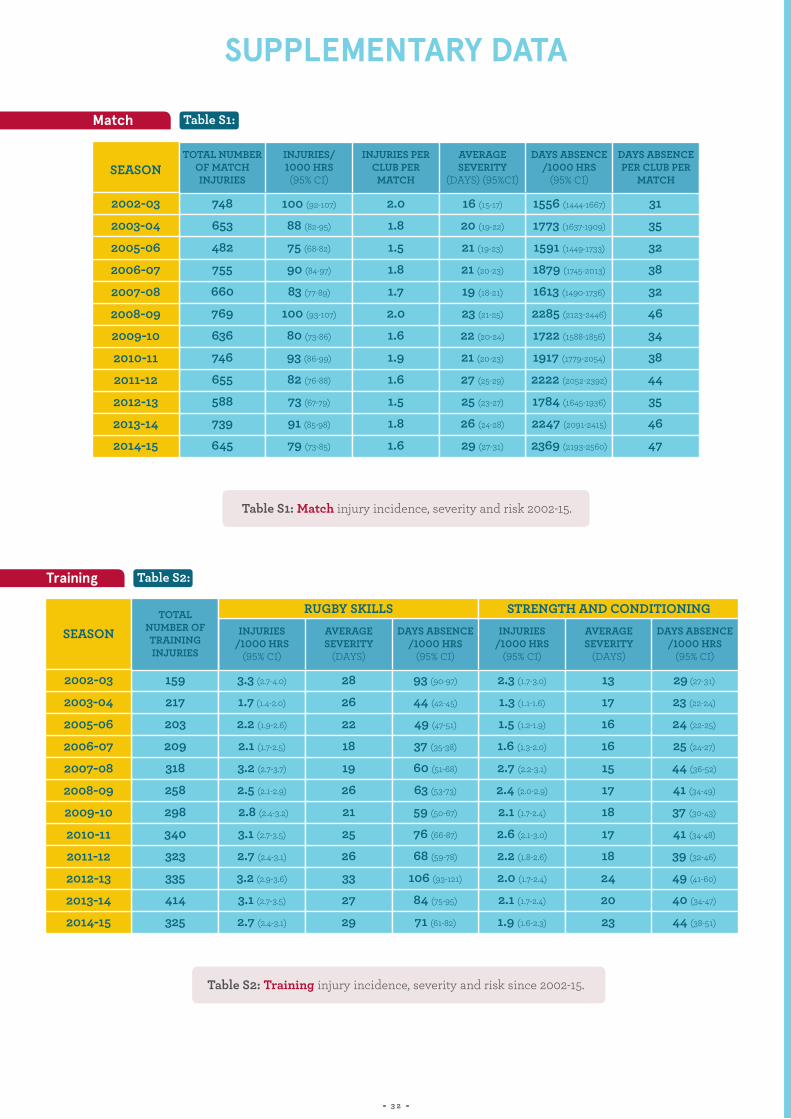
Table S1: Match injury incidence, severity and risk 2002-15.
Table S2: Training injury incidence, severity and risk since 2002-15.
Table S1:
Table S2:
INJURIES PER CLUB PER
MATCH
AVERAGE SEVERITY
(DAYS) (95%CI)
DAYS ABSENCE /1000 HRS
(95% CI)
TOTAL NUMBER OF MATCH INJURIES
AVERAGE SEVERITY
(DAYS)
TOTAL NUMBER OF TRAINING INJURIES
INJURIES/1000 HRS
(95% CI)
INJURIES/ 1000 HRS (95% CI)
DAYS ABSENCE PER CLUB PER
MATCH
AVERAGE SEVERITY
(DAYS)
DAYS ABSENCE /1000 HRS
(95% CI)
DAYS ABSENCE /1000 HRS
(95% CI)
INJURIES /1000 HRS
(95% CI)
748
653
482
755
660
769
636
746
655
588
739
645
159
217
203
209
318
258
298
340
323
335
414
325
100 (92-107)
88 (82-95)
75 (68-82)
90 (84-97)
83 (77-89)
100 (93-107)
80 (73-86)
93 (86-99)
82 (76-88)
73 (67-79)
91 (85-98)
79 (73-85)
3.3 (2.7-4.0)
1.7 (1.4-2.0)
2.2 (1.9-2.6)
2.1 (1.7-2.5)
3.2 (2.7-3.7)
2.5 (2.1-2.9)
2.8 (2.4-3.2)
3.1 (2.7-3.5)
2.7 (2.4-3.1)
3.2 (2.9-3.6)
3.1 (2.7-3.5)
2.7 (2.4-3.1)
2.0
1.8
1.5
1.8
1.7
2.0
1.6
1.9
1.6
1.5
1.8
1.6
28
26
22
18
19
26
21
25
26
33
27
29
16 (15-17)
20 (19-22)
21 (19-23)
21 (20-23)
19 (18-21)
23 (21-25)
22 (20-24)
21 (20-23)
27 (25-29)
25 (23-27)
26 (24-28)
29 (27-31)
93 (90-97)
44 (42-45)
49 (47-51)
37 (35-38)
60 (51-68)
63 (53-73)
59 (50-67)
76 (66-87)
68 (59-78)
106 (93-121)
84 (75-95)
71 (61-82)
1556 (1444-1667)
1773 (1637-1909)
1591 (1449-1733)
1879 (1745-2013)
1613 (1490-1736)
2285 (2123-2446)
1722 (1588-1856)
1917 (1779-2054)
2222 (2052-2392)
1784 (1645-1936)
2247 (2091-2415)
2369 (2193-2560)
2.3 (1.7-3.0)
1.3 (1.1-1.6)
1.5 (1.2-1.9)
1.6 (1.3-2.0)
2.7 (2.2-3.1)
2.4 (2.0-2.9)
2.1 (1.7-2.4)
2.6 (2.1-3.0)
2.2 (1.8-2.6)
2.0 (1.7-2.4)
2.1 (1.7-2.4)
1.9 (1.6-2.3)
31
35
32
38
32
46
34
38
44
35
46
47
13
17
16
16
15
17
18
17
18
24
20
23
29 (27-31)
23 (22-24)
24 (22-25)
25 (24-27)
44 (36-52)
41 (34-49)
37 (30-43)
41 (34-48)
39 (32-46)
49 (41-60)
40 (34-47)
44 (38-51)
SEASON
SEASON
RUGBY SKILLS STRENGTH AND CONDITIONING
2002-03
2002-03
2003-04
2003-04
2005-06
2005-06
2006-07
2006-07
2007-08
2007-08
2008-09
2008-09
2009-10
2009-10
2010-11
2010-11
2011-12
2011-12
2012-13
2012-13
2013-14
2013-14
2014-15
2014-15
Match
Training
SUPPLEMENTARY DATA
3 3
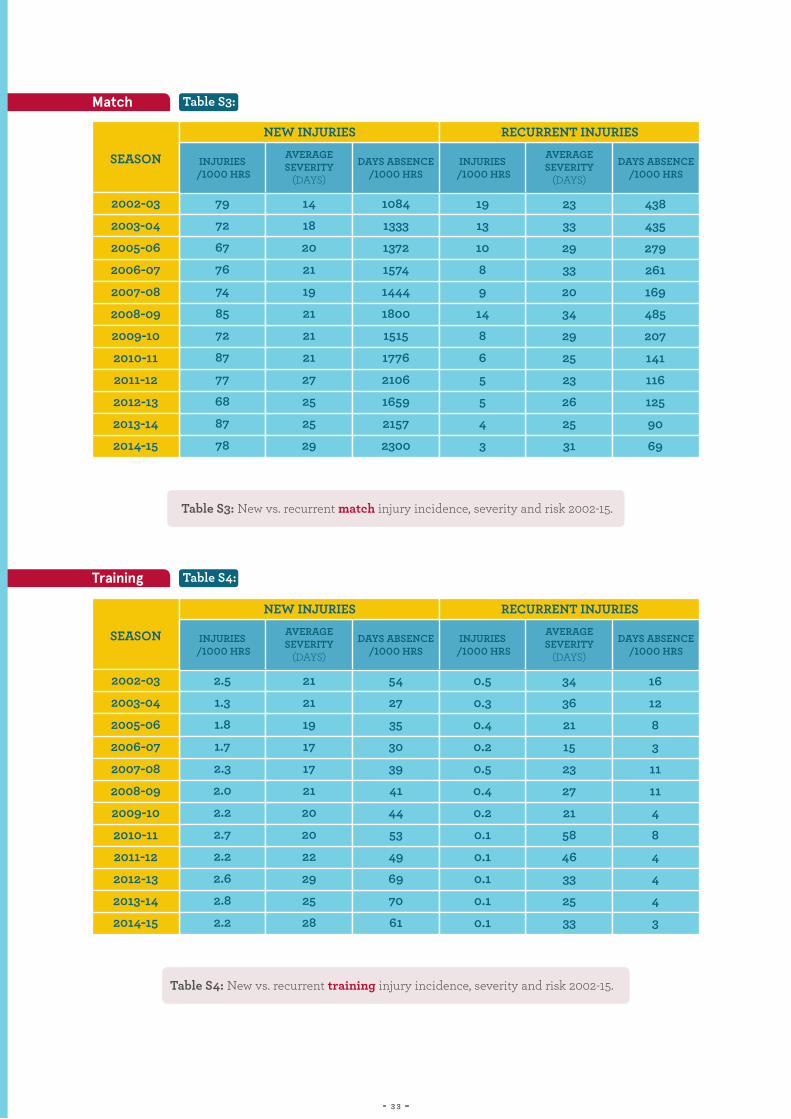
Table S3: New vs. recurrent match injury incidence, severity and risk 2002-15.
Table S4: New vs. recurrent training injury incidence, severity and risk 2002-15.
Table S4:
Table S3:
INJURIES /1000 HRS
INJURIES /1000 HRS
INJURIES /1000 HRS
INJURIES /1000 HRS
DAYS ABSENCE /1000 HRS
DAYS ABSENCE /1000 HRS
DAYS ABSENCE /1000 HRS
DAYS ABSENCE /1000 HRS
AVERAGE SEVERITY
(DAYS)
AVERAGE SEVERITY
(DAYS)
AVERAGE SEVERITY
(DAYS)
AVERAGE SEVERITY
(DAYS)
79
72
67
76
74
85
72
87
77
68
87
78
2.5
1.3
1.8
1.7
2.3
2.0
2.2
2.7
2.2
2.6
2.8
2.2
14
18
20
21
19
21
21
21
27
25
25
29
21
21
19
17
17
21
20
20
22
29
25
28
1084
1333
1372
1574
1444
1800
1515
1776
2106
1659
2157
2300
54
27
35
30
39
41
44
53
49
69
70
61
19
13
10
8
9
14
8
6
5
5
4
3
0.5
0.3
0.4
0.2
0.5
0.4
0.2
0.1
0.1
0.1
0.1
0.1
23
33
29
33
20
34
29
25
23
26
25
31
34
36
21
15
23
27
21
58
46
33
25
33
438
435
279
261
169
485
207
141
116
125
90
69
16
12
8
3
11
11
4
8
4
4
4
3
SEASON
SEASON
NEW INJURIES
NEW INJURIES
RECURRENT INJURIES
RECURRENT INJURIES
2002-03
2002-03
2003-04
2003-04
2005-06
2005-06
2006-07
2006-07
2007-08
2007-08
2008-09
2008-09
2009-10
2009-10
2010-11
2010-11
2011-12
2011-12
2012-13
2012-13
2013-14
2013-14
2014-15
2014-15
Training
Match

3 4
Figure S6: Incidence rates of match injuries by month of the season. Error bars show 95% CI’s.
Figure S5: The four most common match injury recurrences during 2014-15.
Table S5:
Table S6:
NUMBER OF INJURIES AVERAGE SEVERITY(DAYS)
3
3
3
2
Hamstring muscle injury
Soleus muscle injury
Quadriceps muscle injury
Ankle syndesmosis
40
49
16
71
DIAGNOSIS
2002-2014 2014-2015
0
20
40
60
80
100
120
140
160
2014-15
2002-14
September
October
November
December
January
FebruaryMarch
Inci
denc
e/10
00 h
ours
AprilMay

3 5
Table S7: Hamstring training injury incidence and risk 2002-2015.
Table S8: Average player training volume (hours) per week 2002-15.
Table S7:
Table S8:
INCIDENCE/1000 HOURS
RUGBY SKILLS
TRAINING (HOURS PER WEEK)
DAYS ABSENCE/1000 HOURS
STRENGTH & CONDITIONING TOTAL
0.45
0.21
0.36
0.32
0.59
0.36
0.38
0.45
0.42
0.39
0.40
0.30
3.9
5.0
4.3
4.1
3.0
3.2
3.2
3.1
3.6
3.1
3.3
3.4
6.4
4.2
4.6
5.1
9.5
5.0
6.1
6.9
7.3
9.5
10.7
7.2
2.5
3.7
3.1
3.1
2.7
2.6
2.9
2.8
2.8
2.7
2.9
2.6
6.4
8.7
7.4
7.2
5.7
5.8
6.1
5.9
6.4
5.9
6.2
6.0
SEASON
SEASON
2002-03
2002-03
2003-04
2003-04
2005-06
2005-06
2006-07
2006-07
2007-08
2007-08
2008-09
2008-09
2009-10
2009-10
2010-11
2010-11
2011-12
2011-12
2012-13
2012-13
2013-14
2013-14
2014-15
2014-15

Rugby Football Union. The RFU Rose and the words ‘England Rugby’ are official registered trade marks of the Rugby Football Union.